|
||||||||||||||||||||
| |
| Phenotypic Information (metabolism pathway, cancer, disease, phenome) |
| |
| |
| Gene-Gene Network Information: Co-Expression Network, Interacting Genes & KEGG |
| |
|


| Gene Summary for FABP1 |
| Top |
| Phenotypic Information for FABP1(metabolism pathway, cancer, disease, phenome) |
| Cancer | CGAP: FABP1 |
| Familial Cancer Database: FABP1 | |
| * This gene is included in those cancer gene databases. |
|
|
|
|
|
| . | ||||||||||||||
Oncogene 1 | Significant driver gene in | |||||||||||||||||||
| cf) number; DB name 1 Oncogene; http://nar.oxfordjournals.org/content/35/suppl_1/D721.long, 2 Tumor Suppressor gene; https://bioinfo.uth.edu/TSGene/, 3 Cancer Gene Census; http://www.nature.com/nrc/journal/v4/n3/abs/nrc1299.html, 4 CancerGenes; http://nar.oxfordjournals.org/content/35/suppl_1/D721.long, 5 Network of Cancer Gene; http://ncg.kcl.ac.uk/index.php, 1Therapeutic Vulnerabilities in Cancer; http://cbio.mskcc.org/cancergenomics/statius/ |
| REACTOME_METABOLISM_OF_LIPIDS_AND_LIPOPROTEINS | |
| OMIM | |
| Orphanet | |
| Disease | KEGG Disease: FABP1 |
| MedGen: FABP1 (Human Medical Genetics with Condition) | |
| ClinVar: FABP1 | |
| Phenotype | MGI: FABP1 (International Mouse Phenotyping Consortium) |
| PhenomicDB: FABP1 | |
| Mutations for FABP1 |
| * Under tables are showing count per each tissue to give us broad intuition about tissue specific mutation patterns.You can go to the detailed page for each mutation database's web site. |
| There's no structural variation information in COSMIC data for this gene. |
| * From mRNA Sanger sequences, Chitars2.0 arranged chimeric transcripts. This table shows FABP1 related fusion information. |
| ID | Head Gene | Tail Gene | Accession | Gene_a | qStart_a | qEnd_a | Chromosome_a | tStart_a | tEnd_a | Gene_a | qStart_a | qEnd_a | Chromosome_a | tStart_a | tEnd_a |
| AK000234 | PRDM10 | 1 | 2619 | 11 | 129772259 | 129812485 | FABP1 | 2613 | 2916 | 2 | 88422501 | 88425782 | |
| AI114691 | GOT1 | 30 | 319 | 10 | 101180445 | 101190377 | FABP1 | 304 | 643 | 2 | 88424050 | 88427579 | |
| CB163566 | FABP1 | 1 | 407 | 2 | 88427067 | 88427473 | FABP1 | 400 | 650 | 2 | 88422552 | 88425780 | |
| Top |
| There's no copy number variation information in COSMIC data for this gene. |
| Top |
|
 |
| Top |
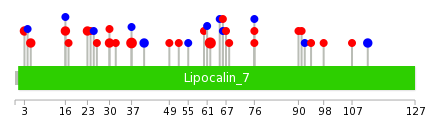
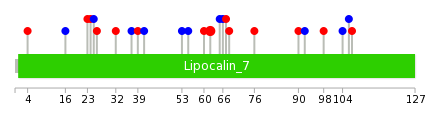
| Stat. for Non-Synonymous SNVs (# total SNVs=25) | (# total SNVs=7) |
 |  |
(# total SNVs=0) | (# total SNVs=1) |
 |
| Top |
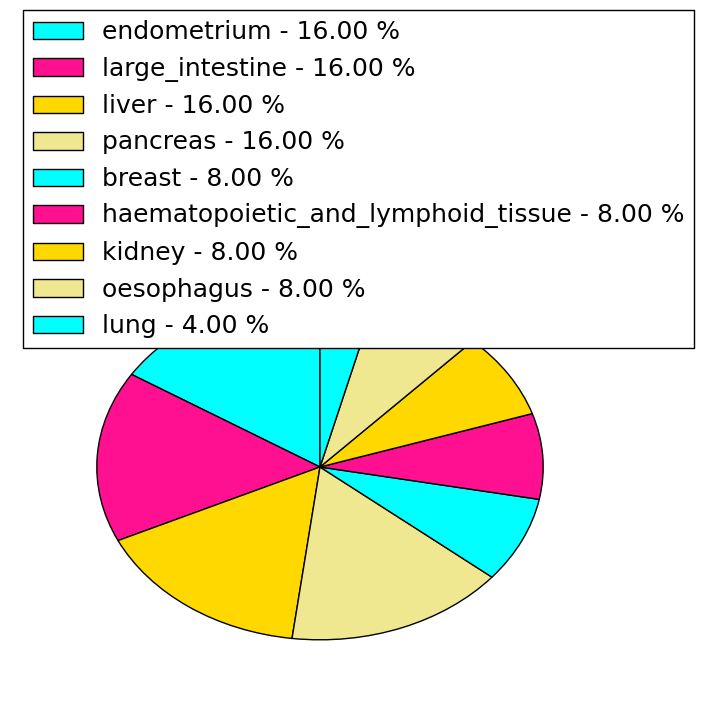
| * When you move the cursor on each content, you can see more deailed mutation information on the Tooltip. Those are primary_site,primary_histology,mutation(aa),pubmedID. |
| GRCh37 position | Mutation(aa) | Unique sampleID count |
| chr2:88425751-88425751 | p.E62K | 5 |
| chr2:88425826-88425826 | p.G37R | 4 |
| chr2:88427470-88427470 | p.G23S | 2 |
| chr2:88425812-88425812 | p.I41I | 2 |
| chr2:88422621-88422621 | p.T112T | 2 |
| chr2:88427491-88427491 | p.E16K | 2 |
| chr2:88427523-88427523 | p.G5D | 2 |
| chr2:88425847-88425847 | p.Q30E | 2 |
| chr2:88427528-88427528 | p.F3L | 2 |
| chr2:88425757-88425757 | p.Q60E | 2 |
| Top |
|
 |
| Point Mutation/ Tissue ID | 1 | 2 | 3 | 4 | 5 | 6 | 7 | 8 | 9 | 10 | 11 | 12 | 13 | 14 | 15 | 16 | 17 | 18 | 19 | 20 |
| # sample | 1 | 1 | 2 | 1 | 2 | 2 | 4 | 1 | 9 | 1 | 3 | |||||||||
| # mutation | 1 | 1 | 2 | 1 | 2 | 2 | 4 | 1 | 7 | 1 | 3 | |||||||||
| nonsynonymous SNV | 1 | 2 | 1 | 1 | 1 | 1 | 4 | 3 | ||||||||||||
| synonymous SNV | 1 | 1 | 1 | 4 | 3 | 1 |
| cf) Tissue ID; Tissue type (1; BLCA[Bladder Urothelial Carcinoma], 2; BRCA[Breast invasive carcinoma], 3; CESC[Cervical squamous cell carcinoma and endocervical adenocarcinoma], 4; COAD[Colon adenocarcinoma], 5; GBM[Glioblastoma multiforme], 6; Glioma Low Grade, 7; HNSC[Head and Neck squamous cell carcinoma], 8; KICH[Kidney Chromophobe], 9; KIRC[Kidney renal clear cell carcinoma], 10; KIRP[Kidney renal papillary cell carcinoma], 11; LAML[Acute Myeloid Leukemia], 12; LUAD[Lung adenocarcinoma], 13; LUSC[Lung squamous cell carcinoma], 14; OV[Ovarian serous cystadenocarcinoma ], 15; PAAD[Pancreatic adenocarcinoma], 16; PRAD[Prostate adenocarcinoma], 17; SKCM[Skin Cutaneous Melanoma], 18:STAD[Stomach adenocarcinoma], 19:THCA[Thyroid carcinoma], 20:UCEC[Uterine Corpus Endometrial Carcinoma]) |
| Top |
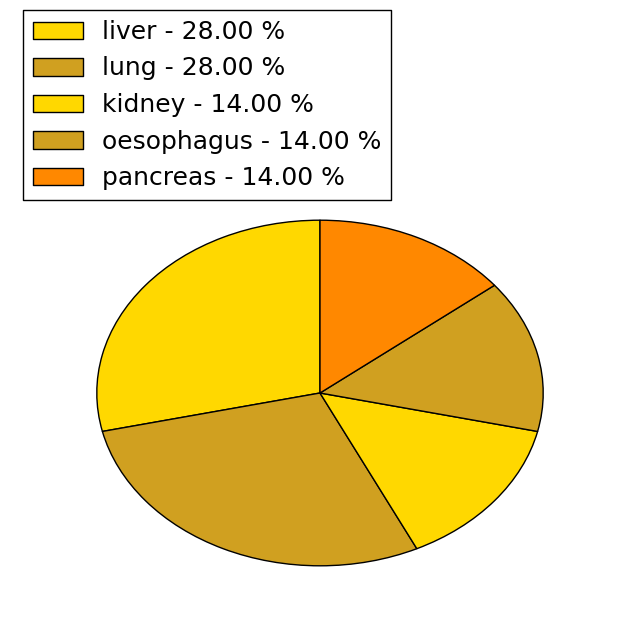
| * We represented just top 10 SNVs. When you move the cursor on each content, you can see more deailed mutation information on the Tooltip. Those are primary_site, primary_histology, mutation(aa), pubmedID. |
| Genomic Position | Mutation(aa) | Unique sampleID count |
| chr2:88425751 | p.E62K | 3 |
| chr2:88425860 | p.G55G | 1 |
| chr2:88425740 | p.T53T | 1 |
| chr2:88425865 | p.I41I | 1 |
| chr2:88424027 | p.S39L | 1 |
| chr2:88427470 | p.D107N | 1 |
| chr2:88424028 | p.G37G | 1 |
| chr2:88425757 | p.G106G | 1 |
| chr2:88427489 | p.G32E | 1 |
| chr2:88424034 | p.L104L | 1 |
| * Copy number data were extracted from TCGA using R package TCGA-Assembler. The URLs of all public data files on TCGA DCC data server were gathered on Jan-05-2015. Function ProcessCNAData in TCGA-Assembler package was used to obtain gene-level copy number value which is calculated as the average copy number of the genomic region of a gene. |
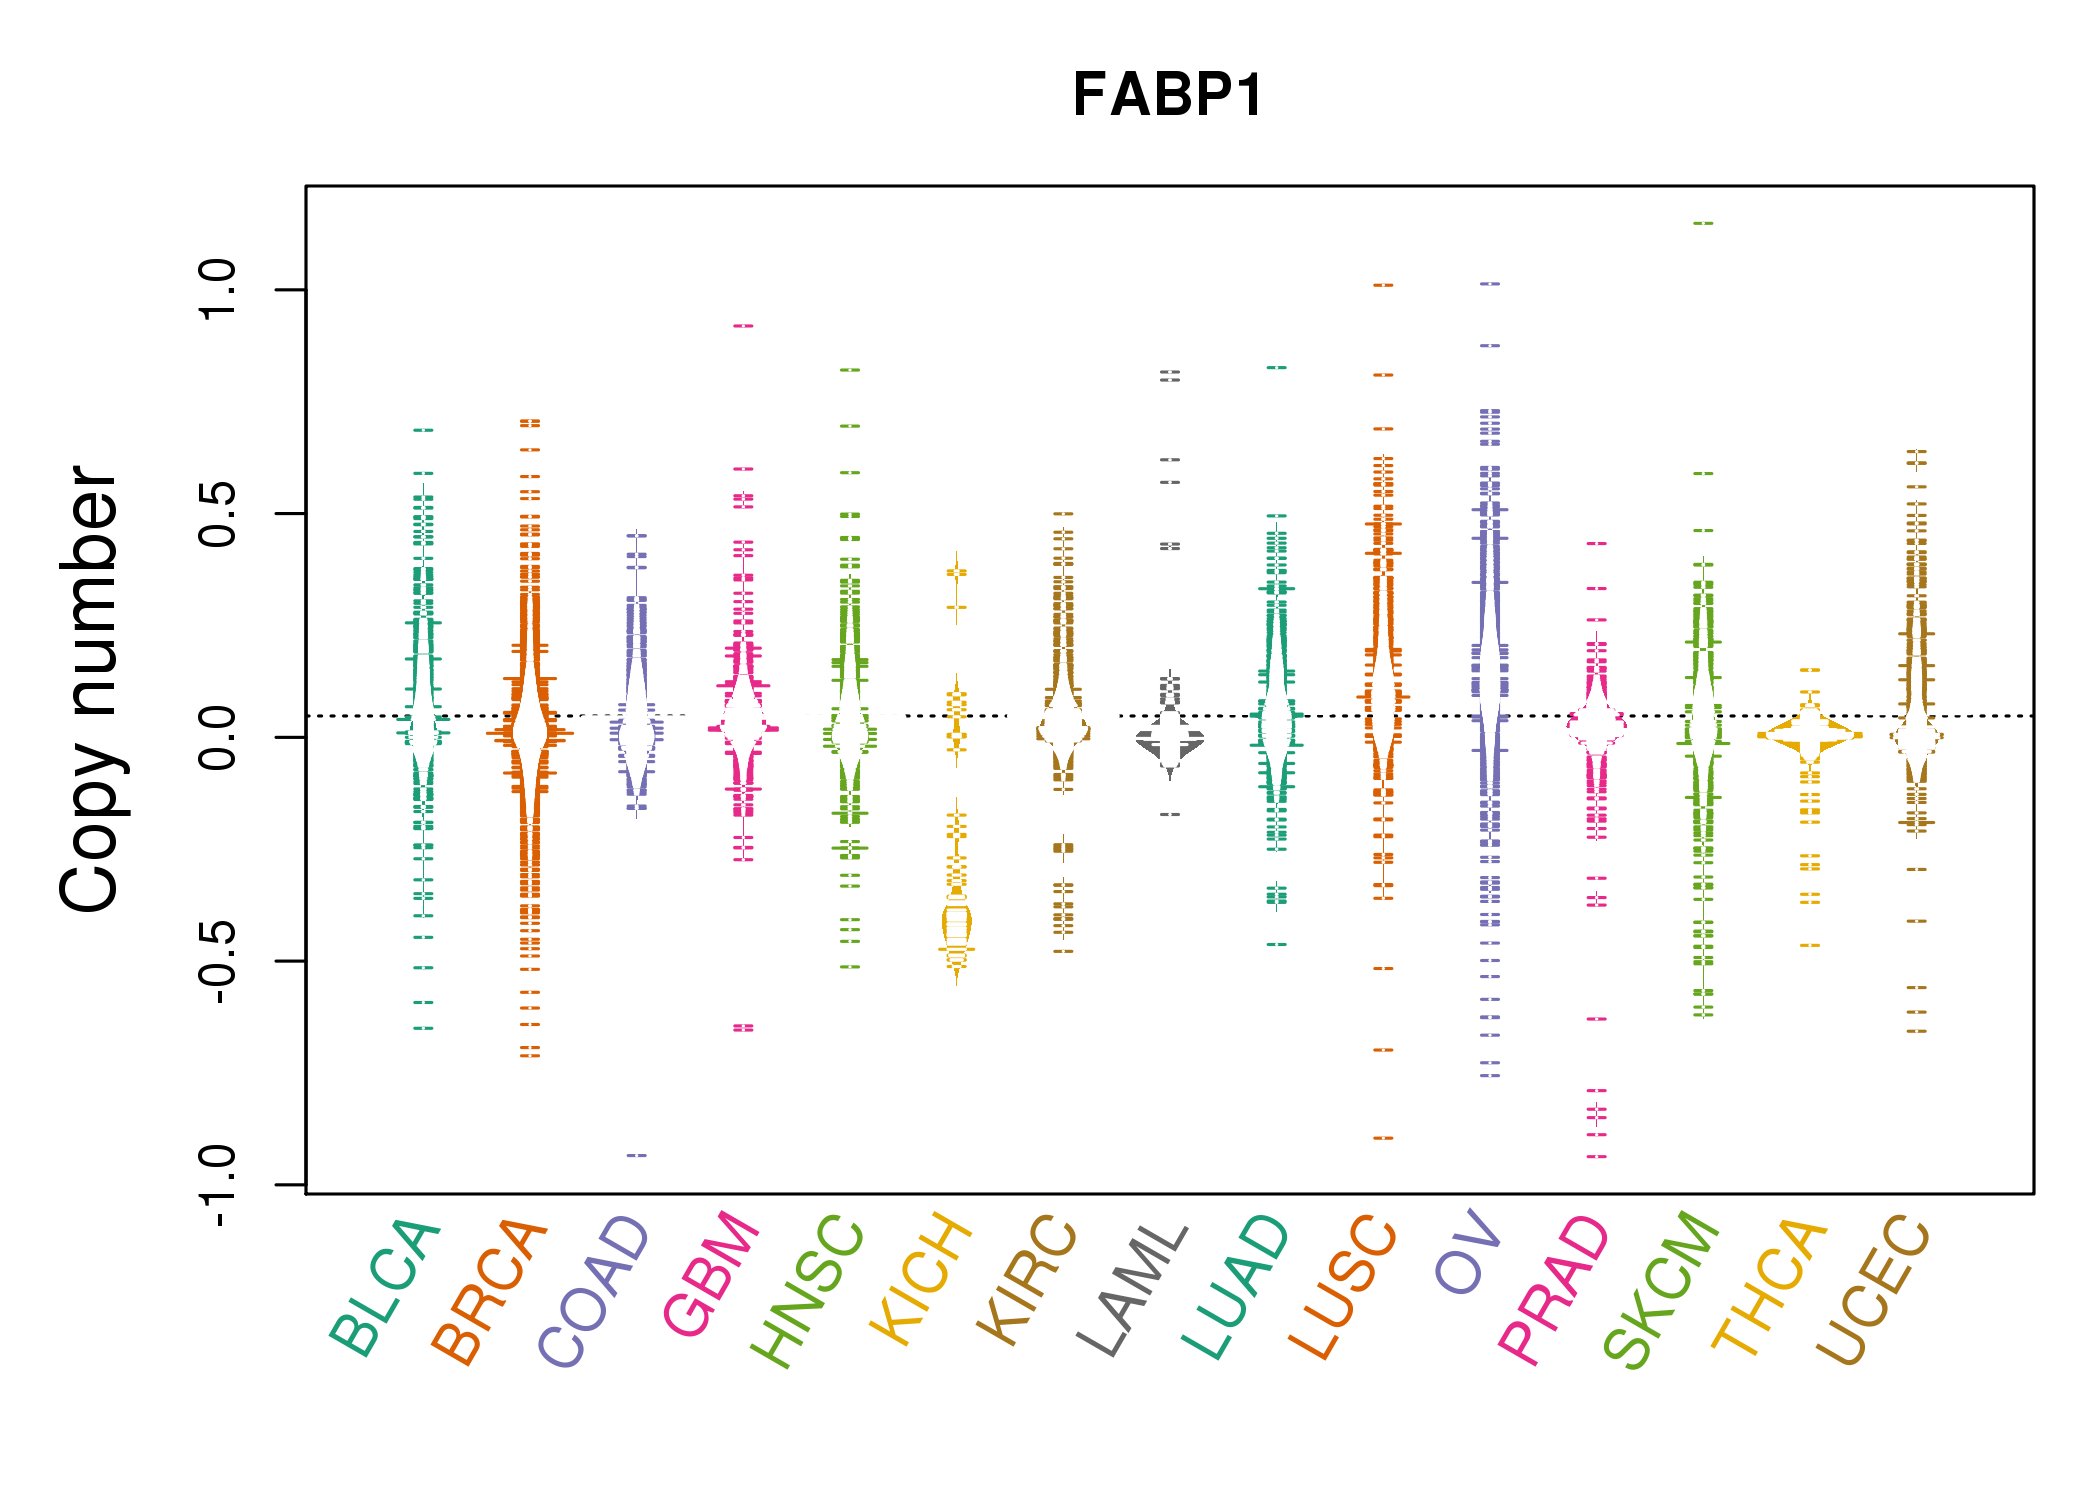 |
| cf) Tissue ID[Tissue type]: BLCA[Bladder Urothelial Carcinoma], BRCA[Breast invasive carcinoma], CESC[Cervical squamous cell carcinoma and endocervical adenocarcinoma], COAD[Colon adenocarcinoma], GBM[Glioblastoma multiforme], Glioma Low Grade, HNSC[Head and Neck squamous cell carcinoma], KICH[Kidney Chromophobe], KIRC[Kidney renal clear cell carcinoma], KIRP[Kidney renal papillary cell carcinoma], LAML[Acute Myeloid Leukemia], LUAD[Lung adenocarcinoma], LUSC[Lung squamous cell carcinoma], OV[Ovarian serous cystadenocarcinoma ], PAAD[Pancreatic adenocarcinoma], PRAD[Prostate adenocarcinoma], SKCM[Skin Cutaneous Melanoma], STAD[Stomach adenocarcinoma], THCA[Thyroid carcinoma], UCEC[Uterine Corpus Endometrial Carcinoma] |
| Top |
| Gene Expression for FABP1 |
| * CCLE gene expression data were extracted from CCLE_Expression_Entrez_2012-10-18.res: Gene-centric RMA-normalized mRNA expression data. |
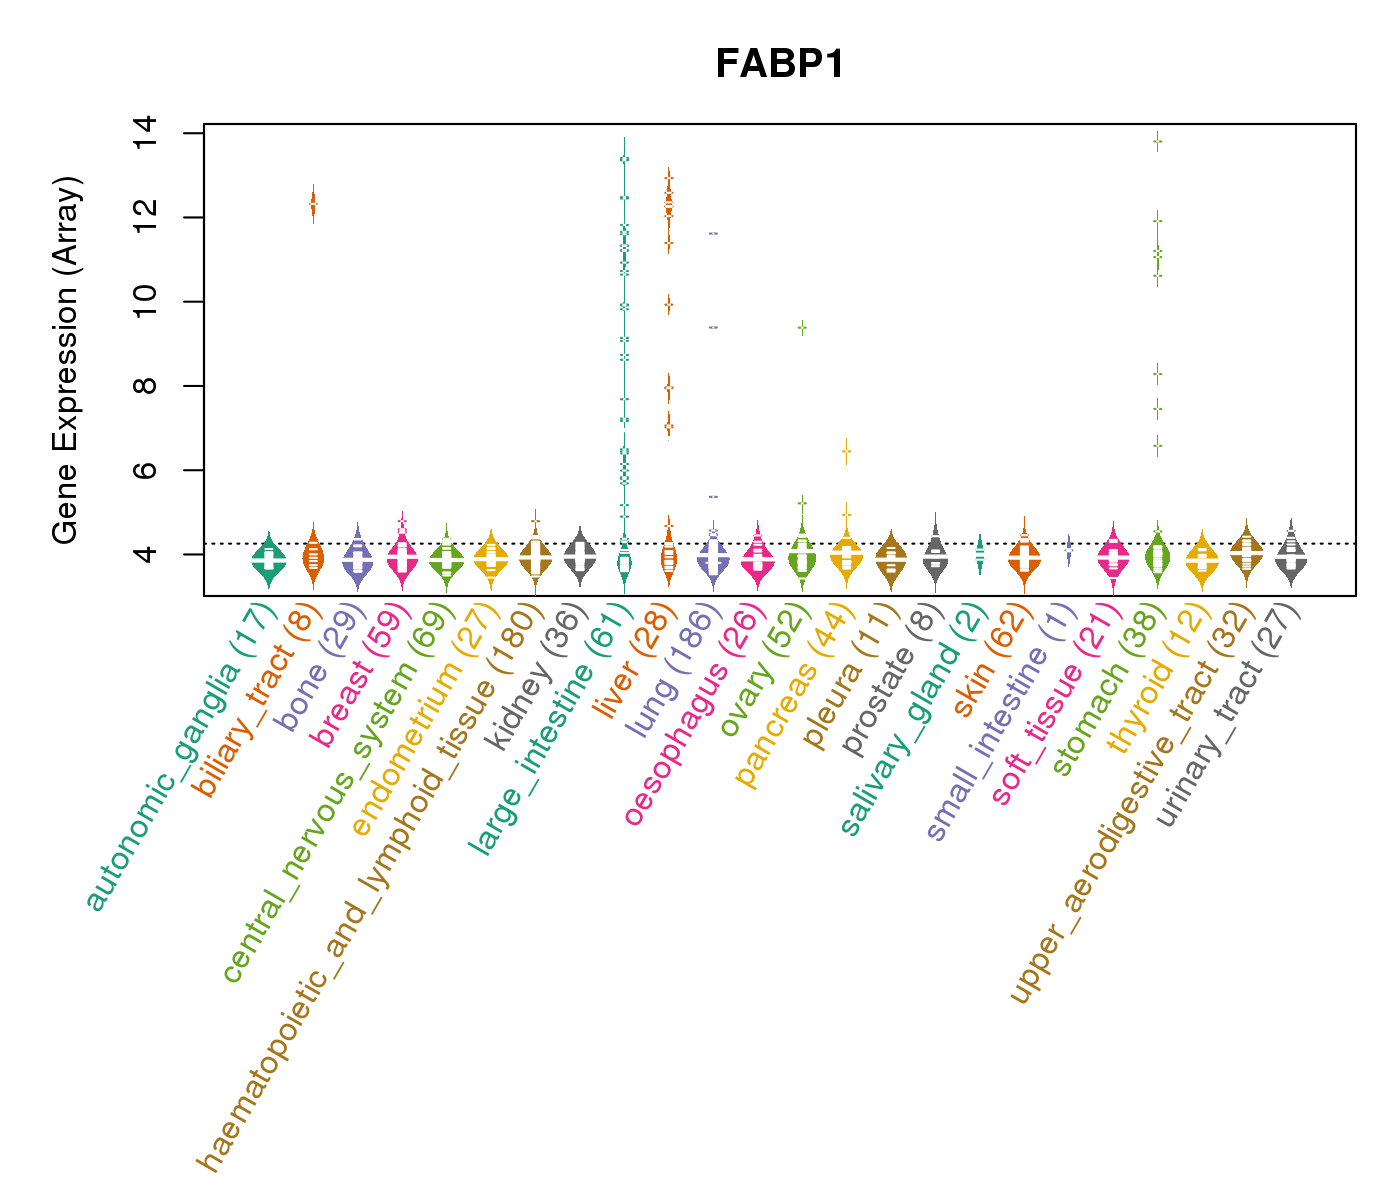 |
| * Normalized gene expression data of RNASeqV2 was extracted from TCGA using R package TCGA-Assembler. The URLs of all public data files on TCGA DCC data server were gathered at Jan-05-2015. Only eight cancer types have enough normal control samples for differential expression analysis. (t test, adjusted p<0.05 (using Benjamini-Hochberg FDR)) |
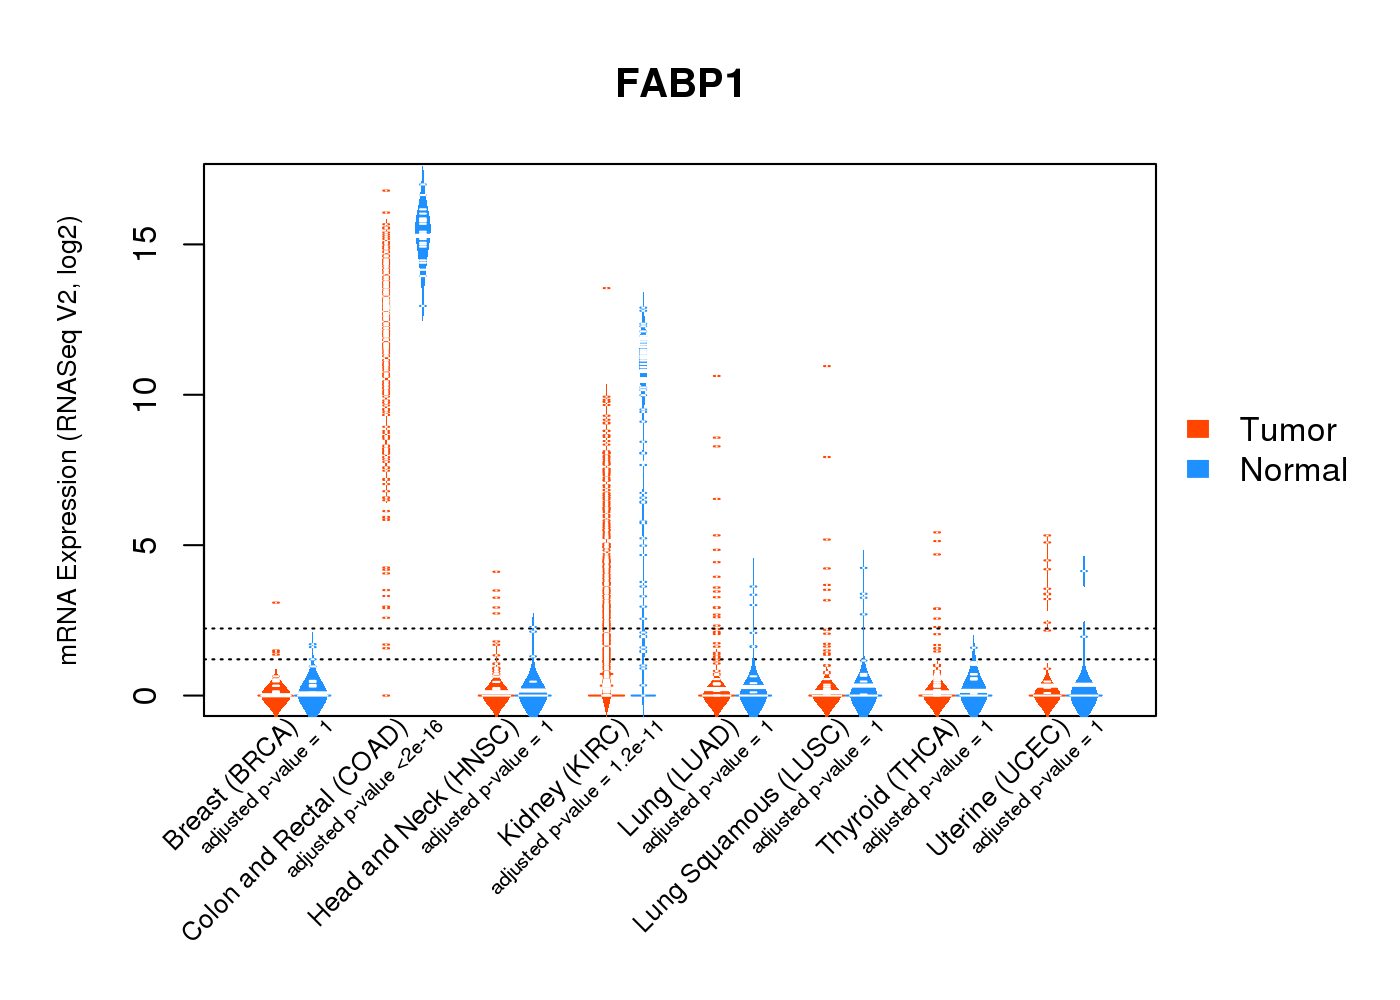 |
| Top |
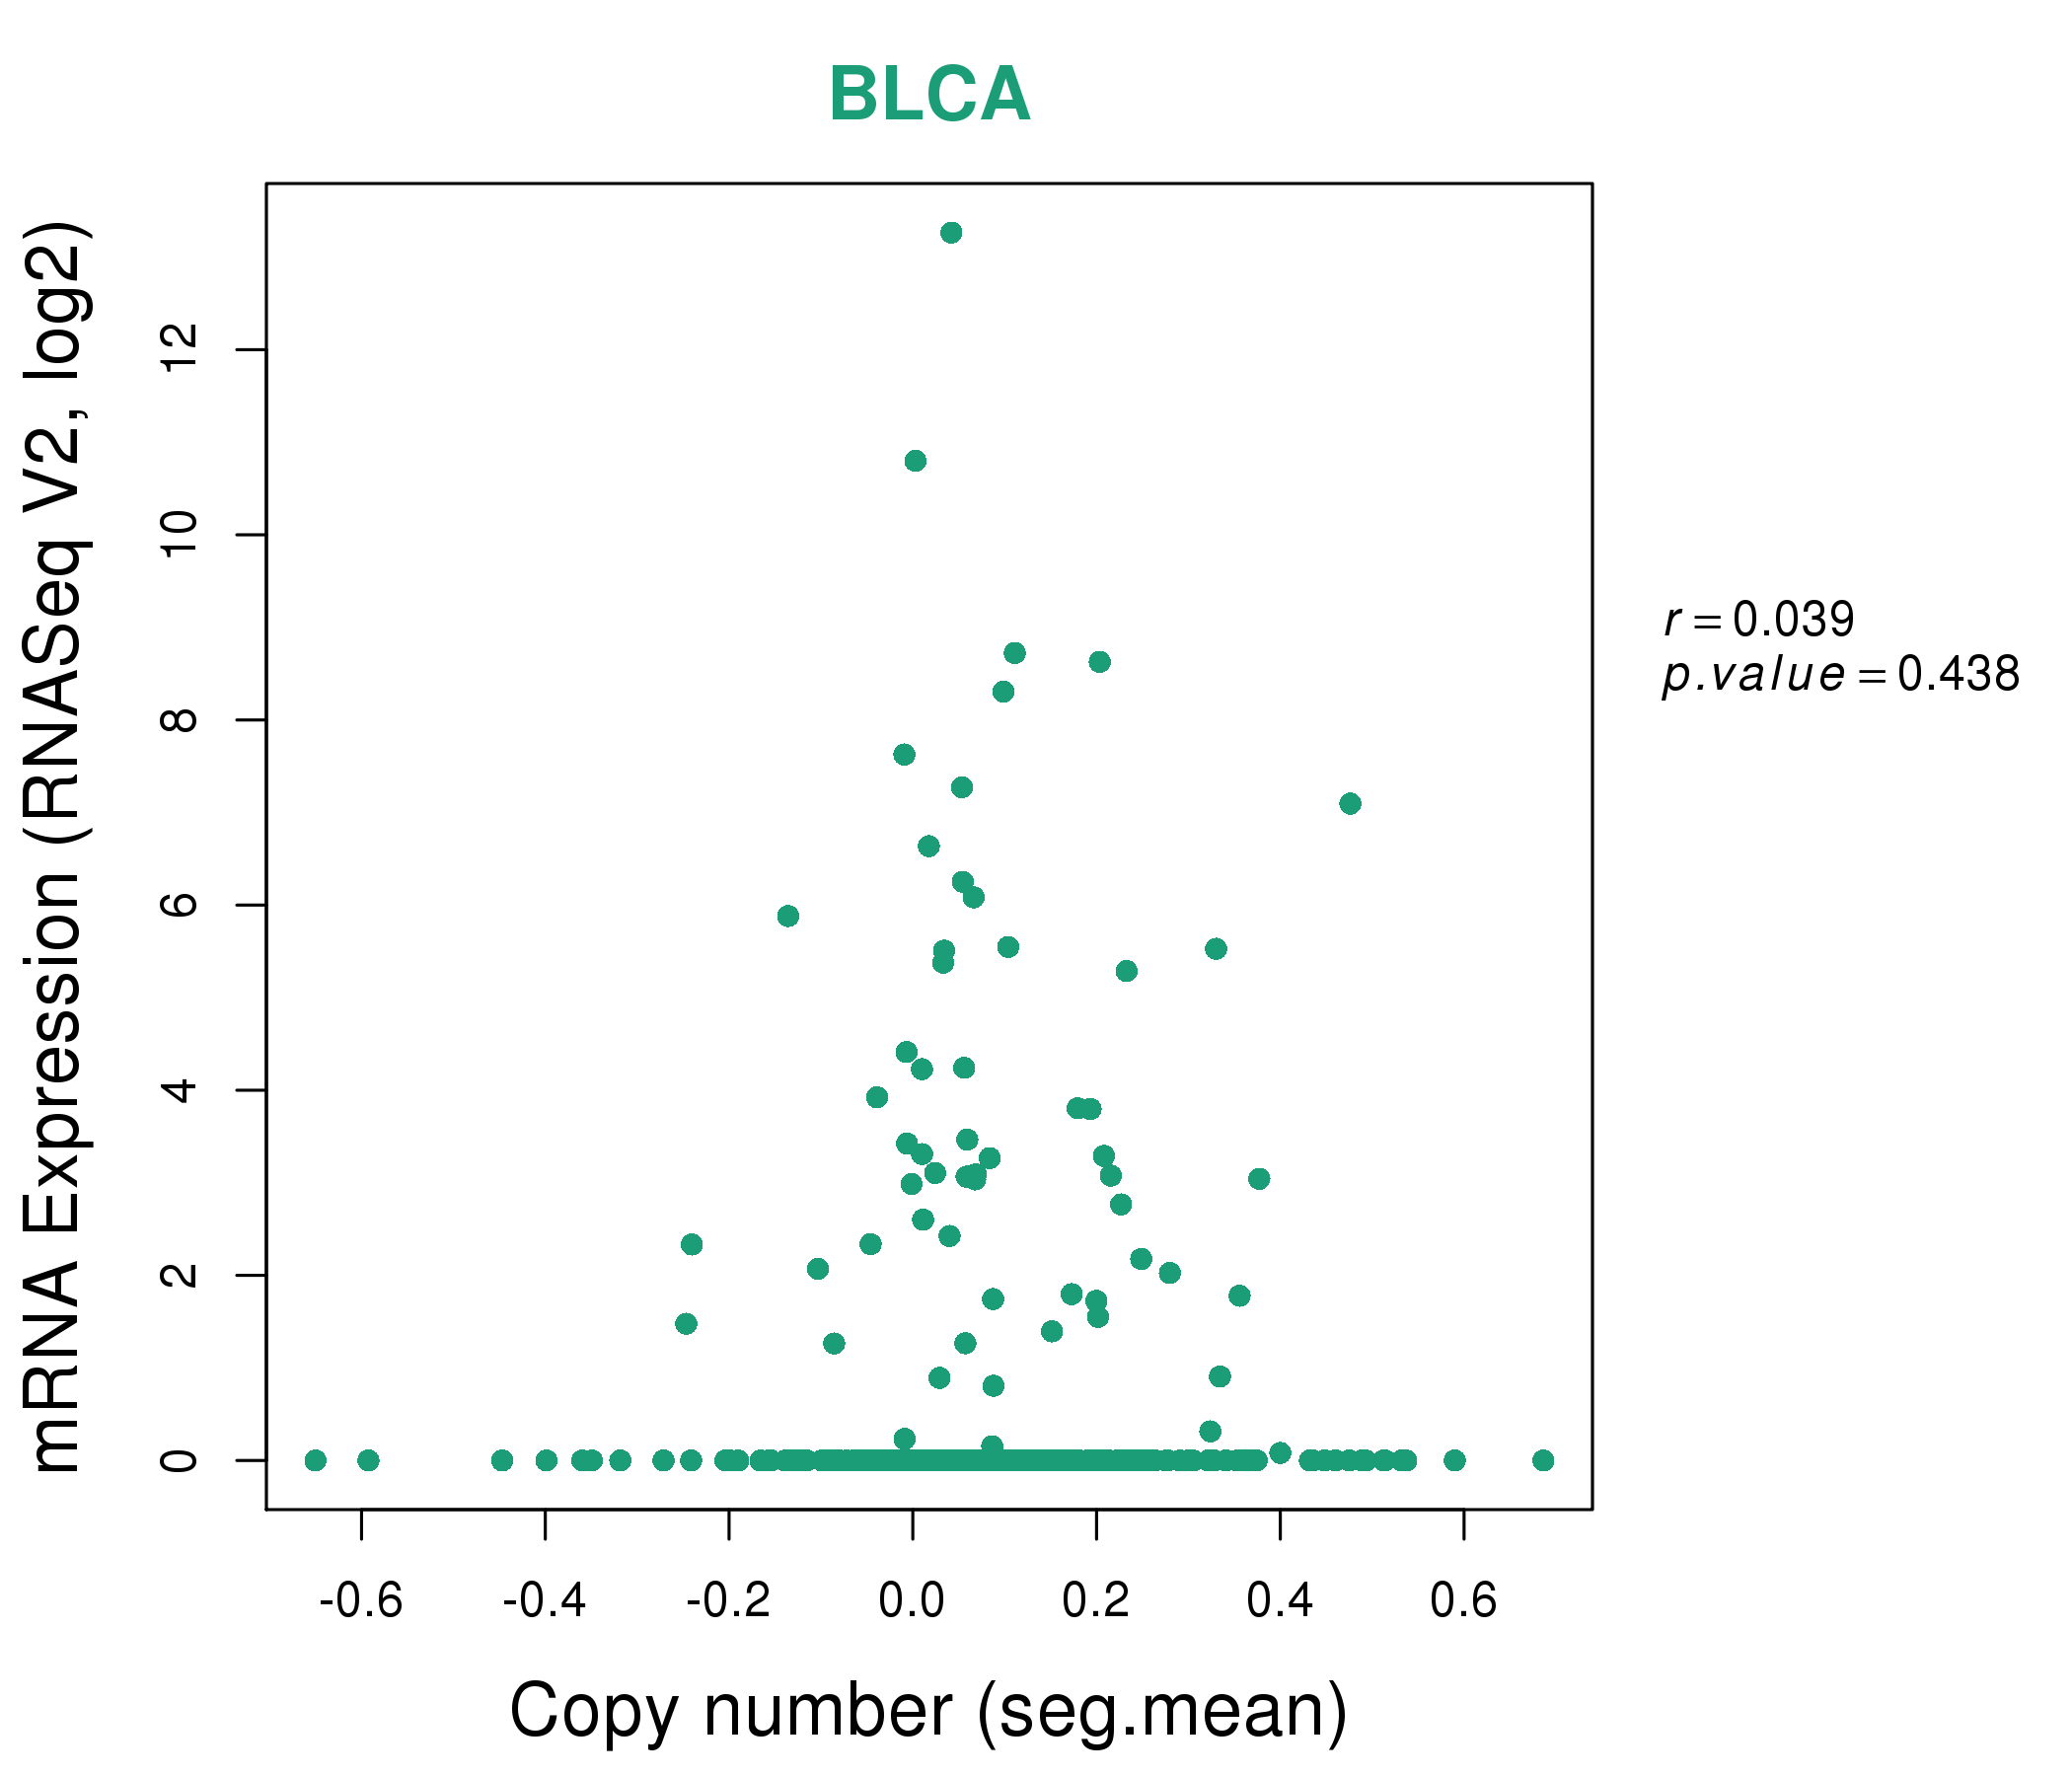
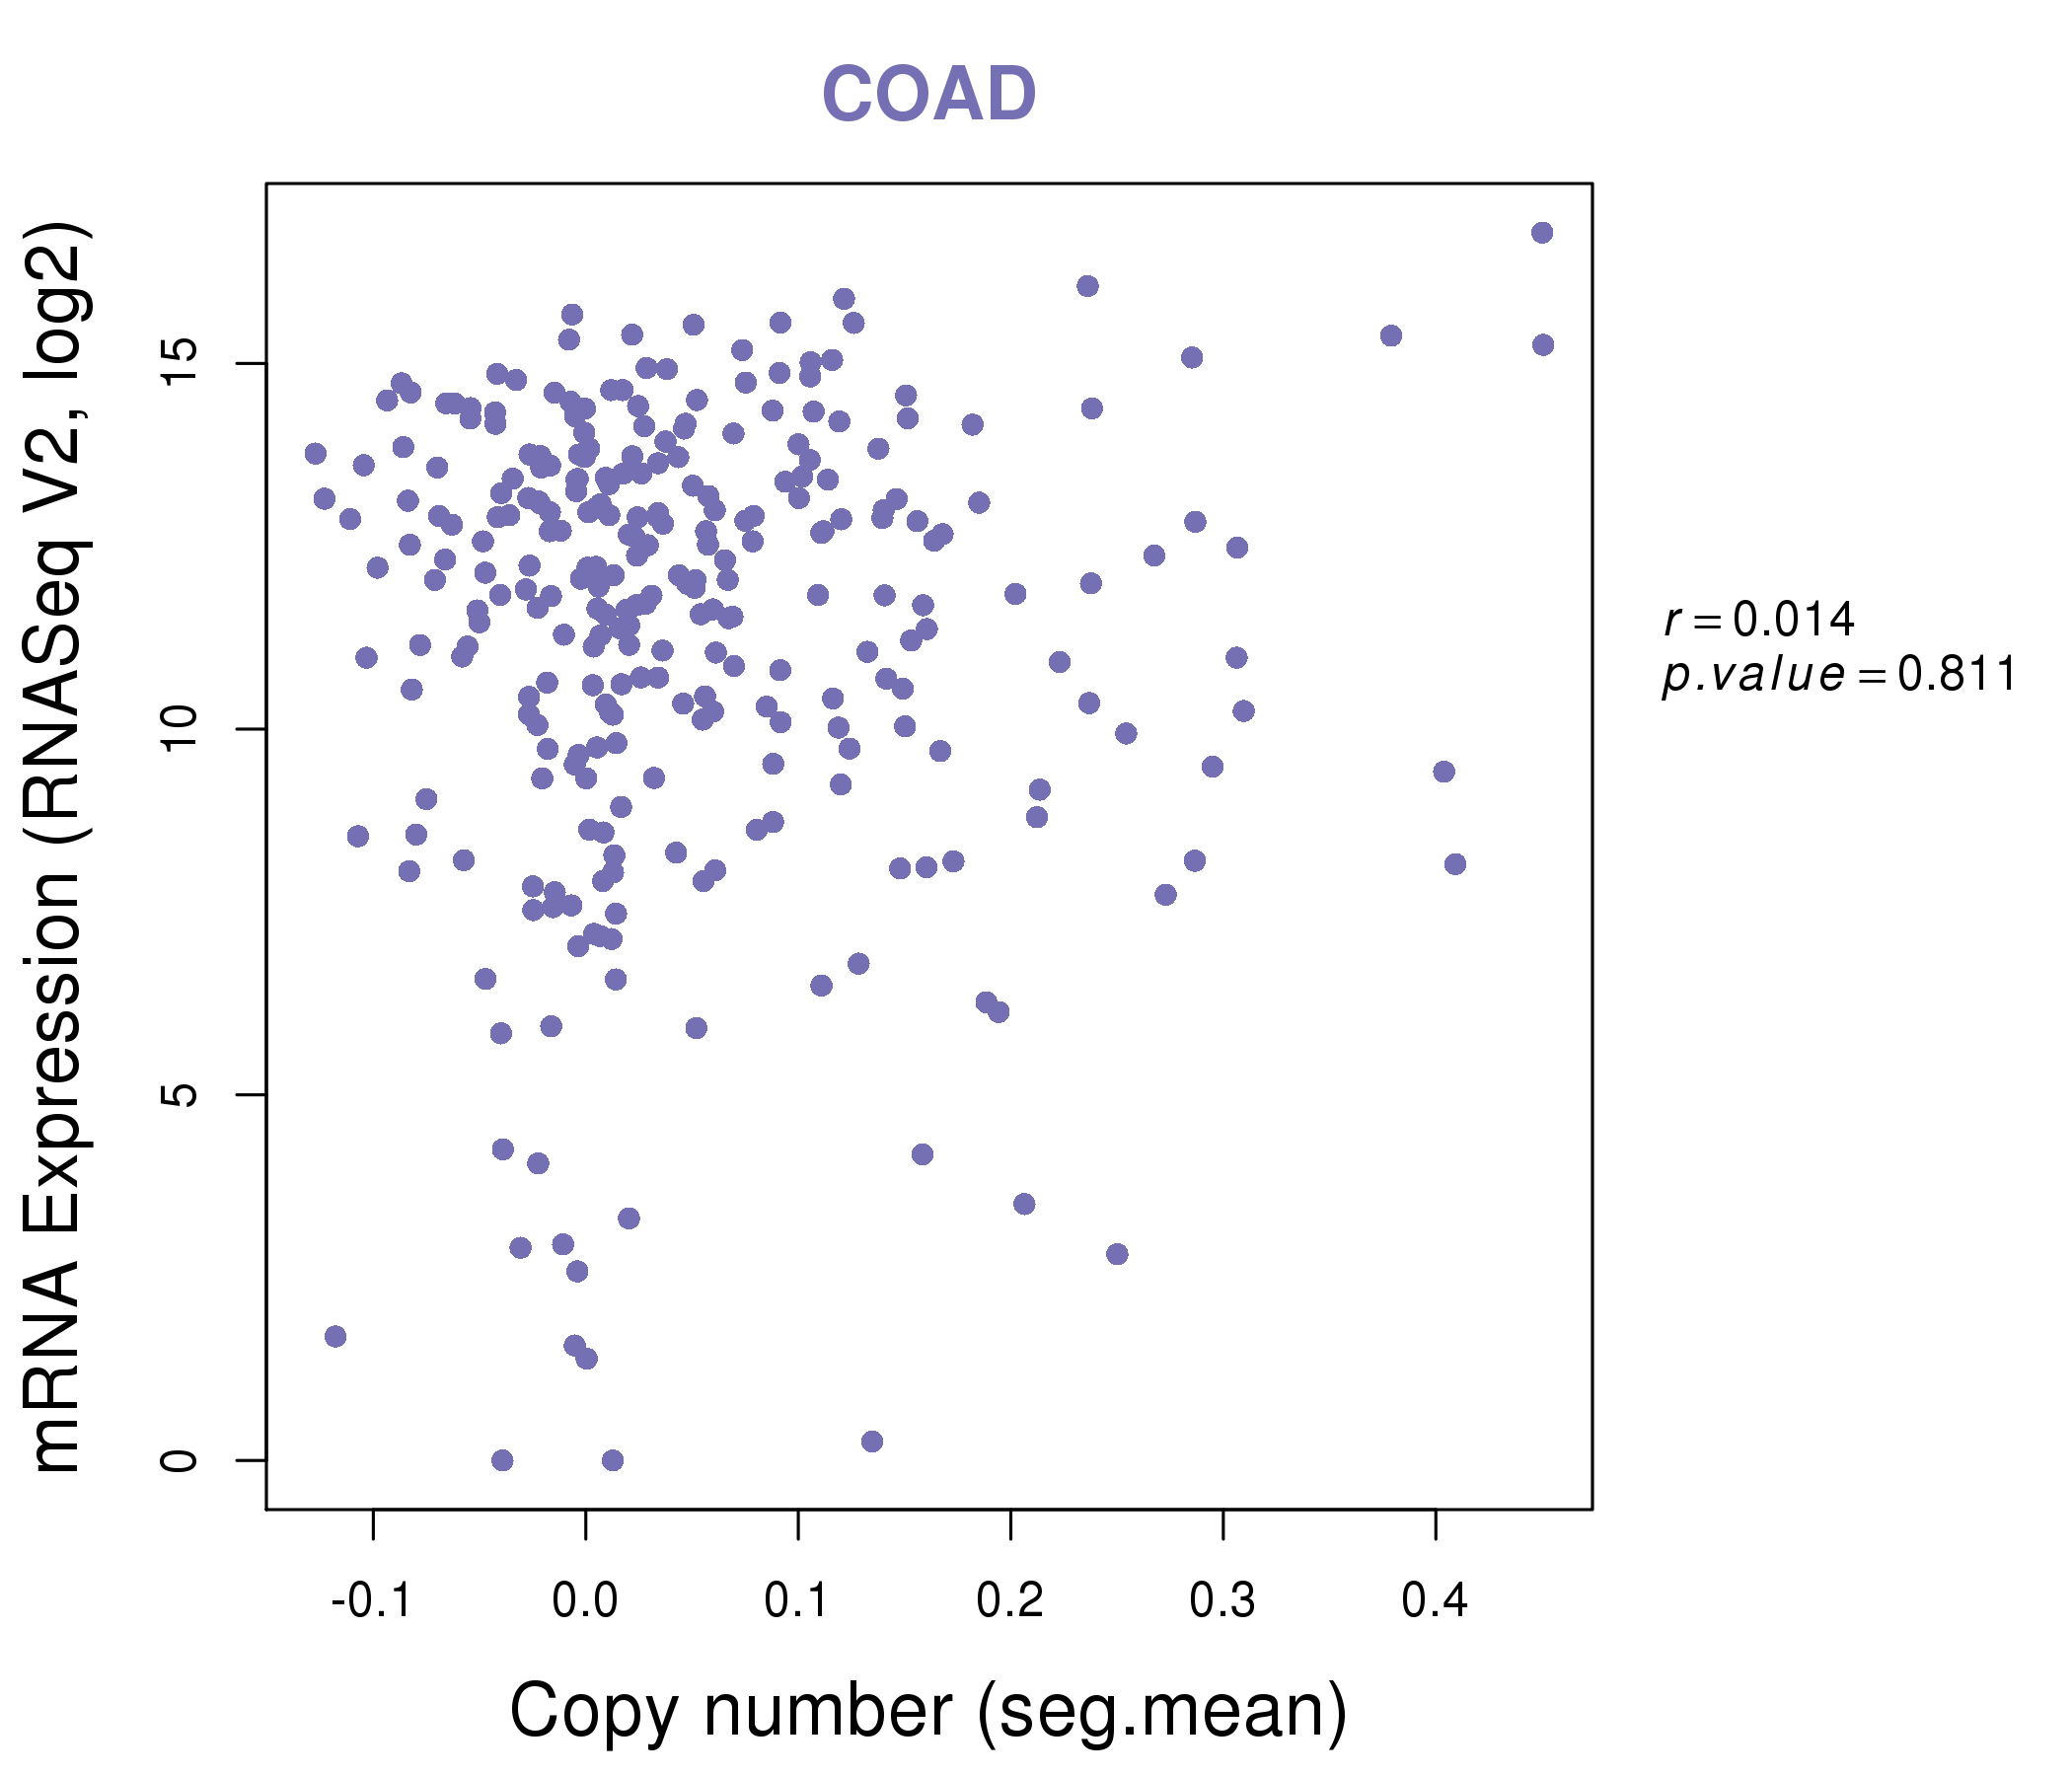
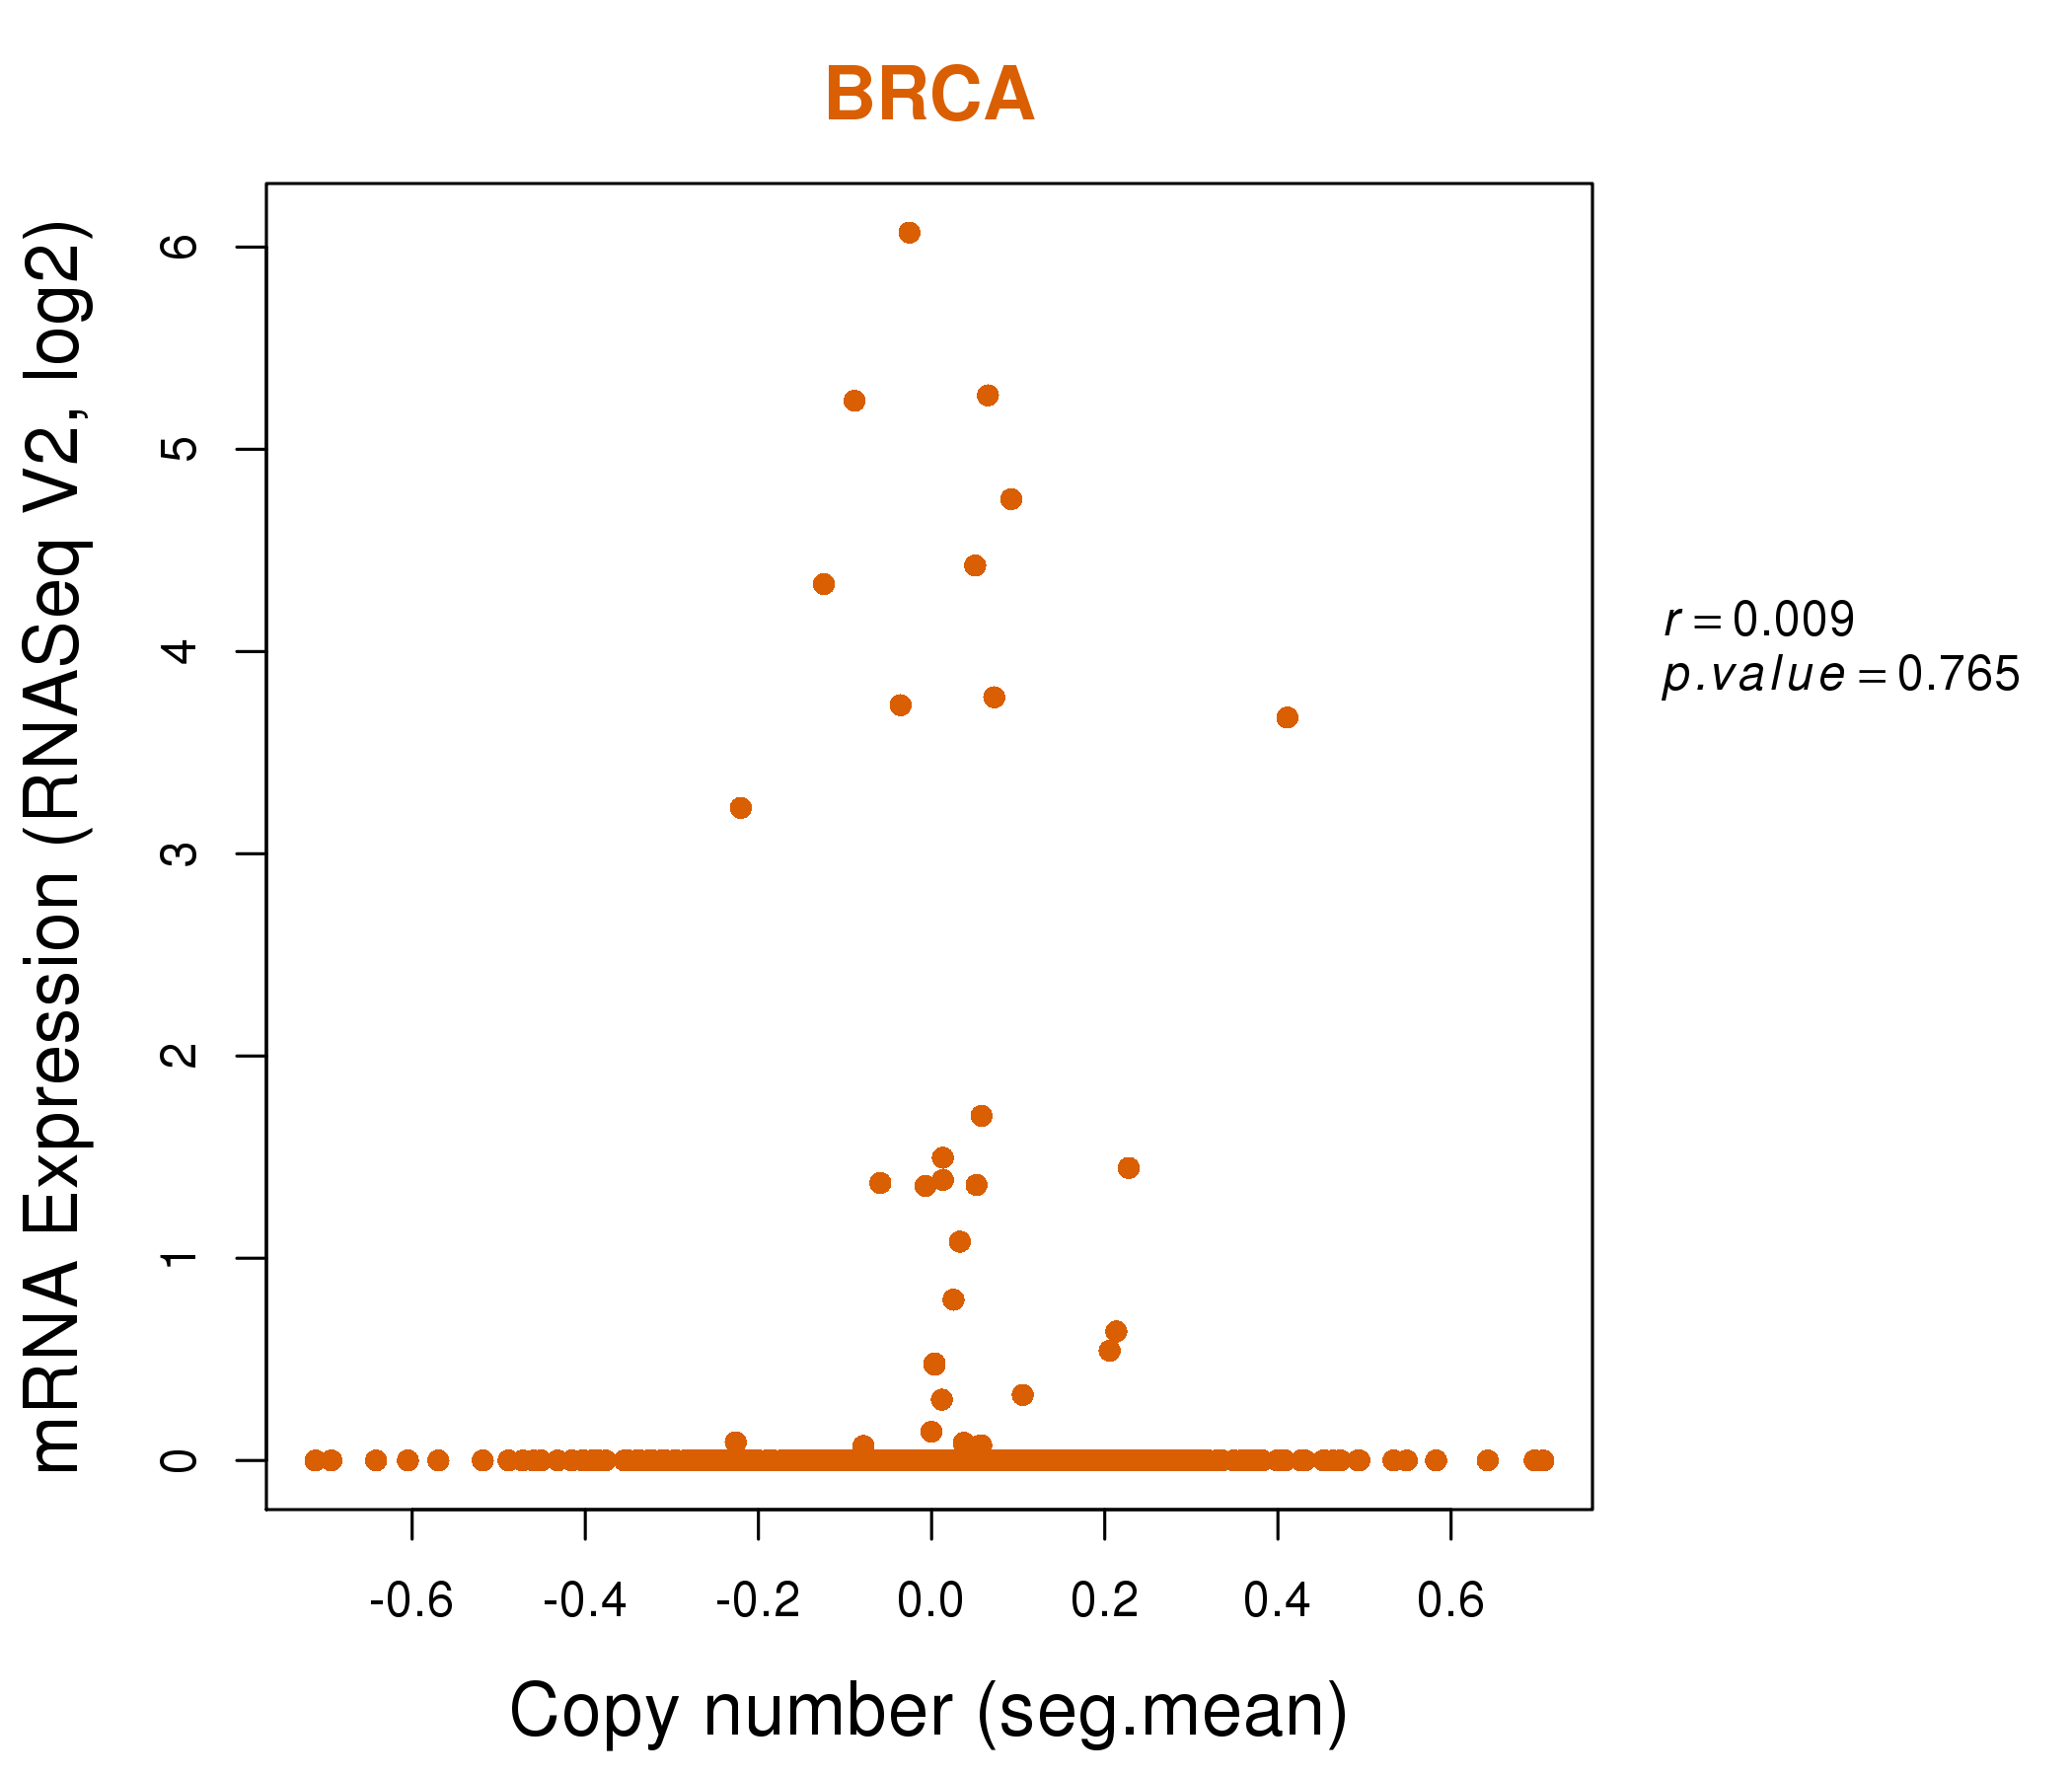
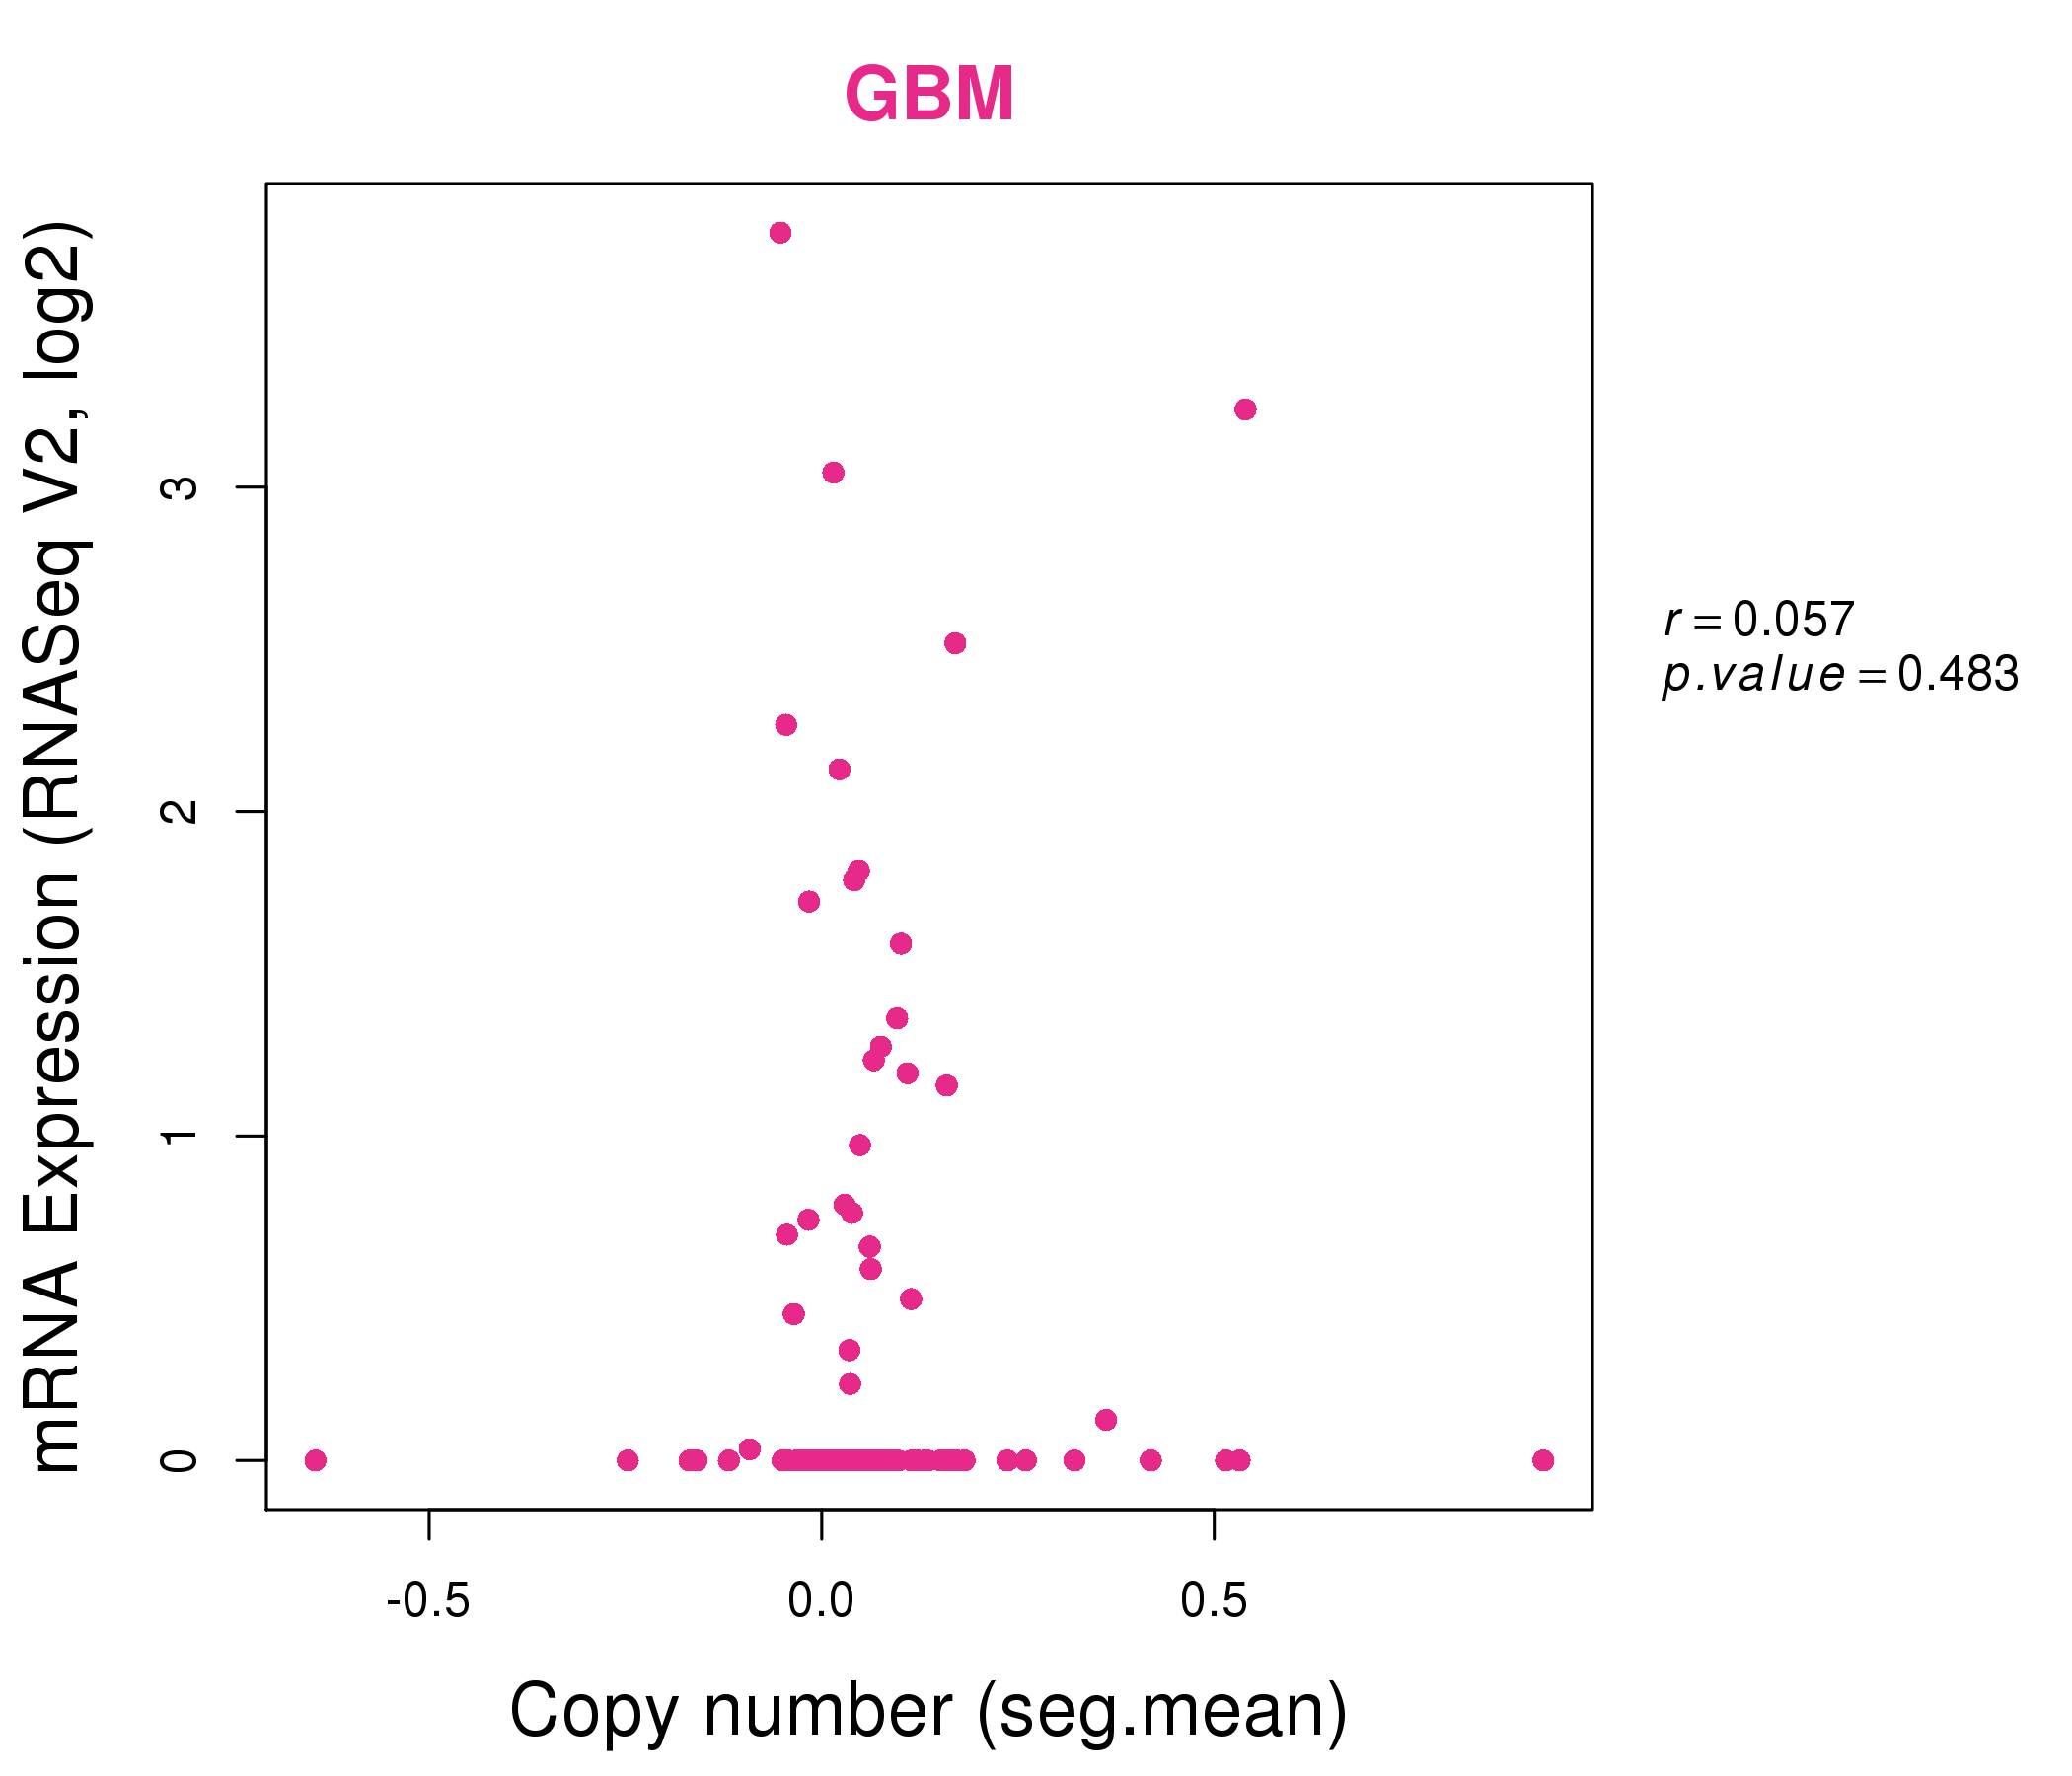
| * This plots show the correlation between CNV and gene expression. |
: Open all plots for all cancer types
 |
|
 |
|
| Top |
| Gene-Gene Network Information |
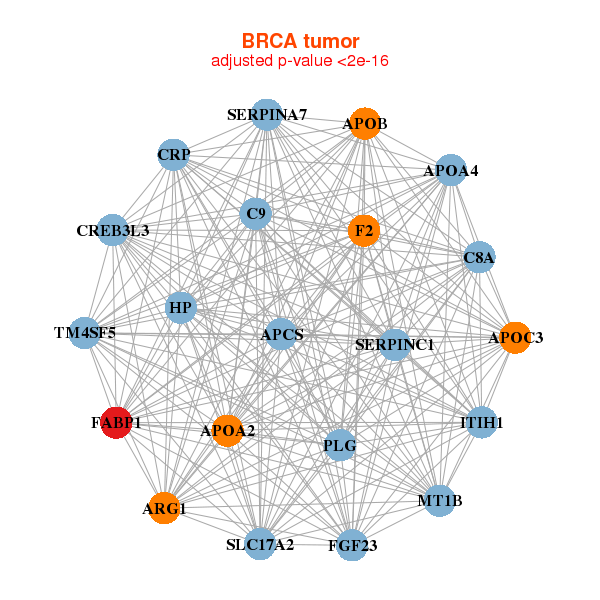
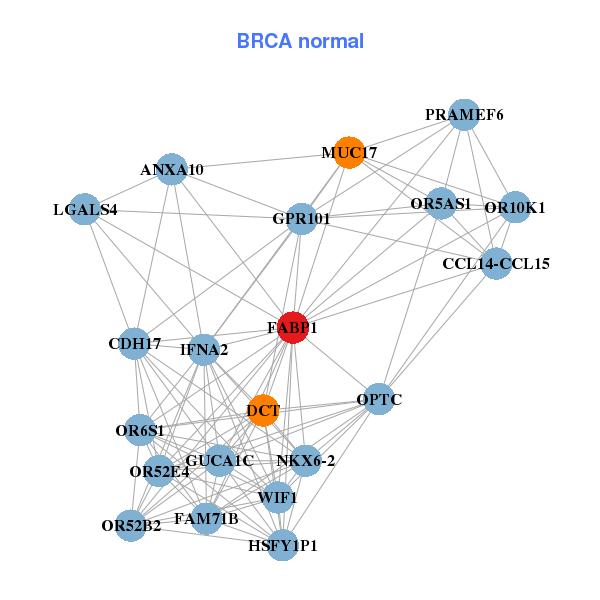
| * Co-Expression network figures were drawn using R package igraph. Only the top 20 genes with the highest correlations were shown. Red circle: input gene, orange circle: cell metabolism gene, sky circle: other gene |
: Open all plots for all cancer types
 |
|
| APCS,APOA2,APOA4,APOB,APOC3,ARG1,C8A, C9,CREB3L3,CRP,F2,FABP1,FGF23,HP, ITIH1,MT1B,PLG,SERPINA7,SERPINC1,SLC17A2,TM4SF5 | ANXA10,CCL14-CCL15,CDH17,DCT,FABP1,FAM71B,GPR101, GUCA1C,HSFY1P1,IFNA2,LGALS4,MUC17,NKX6-2,OPTC, OR10K1,OR52B2,OR52E4,OR5AS1,OR6S1,PRAMEF6,WIF1 |
 |
|
| ABCC13,AXDND1,EPCAM,FABP1,FER1L4,GPR39,HHLA2, KRT20,NAT2,P2RY2,PDE6A,PDZD3,PIGZ,PLCE1, PPARG,PPP1R14C,PPP1R14D,PRELID2,SFXN5,SGK2,UGP2 | ABHD3,ACOX1,CXorf56,EPCAM,FABP1,GRAMD3,JOSD1, MGLL,OPN3,PDCD6IP,PKIB,PLOD2,PPARG,PPP1R14C, PTPRR,RNF103,SGK2,TGFA,TMEM171,TMEM65,VDAC1 |
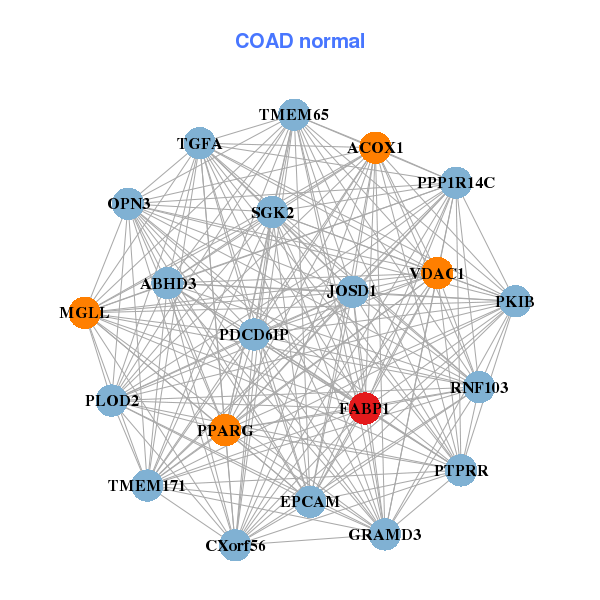
| * Co-Expression network figures were drawn using R package igraph. Only the top 20 genes with the highest correlations were shown. Red circle: input gene, orange circle: cell metabolism gene, sky circle: other gene |
: Open all plots for all cancer types
| Top |
: Open all interacting genes' information including KEGG pathway for all interacting genes from DAVID
| Top |
| Pharmacological Information for FABP1 |
| There's no related Drug. |
| Top |
| Cross referenced IDs for FABP1 |
| * We obtained these cross-references from Uniprot database. It covers 150 different DBs, 18 categories. http://www.uniprot.org/help/cross_references_section |
: Open all cross reference information
|
Copyright © 2016-Present - The Univsersity of Texas Health Science Center at Houston @ |