|
||||||||||||||||||||
| |
| Phenotypic Information (metabolism pathway, cancer, disease, phenome) |
| |
| |
| Gene-Gene Network Information: Co-Expression Network, Interacting Genes & KEGG |
| |
|


| Gene Summary for ALDH3A1 |
| Top |
| Phenotypic Information for ALDH3A1(metabolism pathway, cancer, disease, phenome) |
| Cancer | CGAP: ALDH3A1 |
| Familial Cancer Database: ALDH3A1 | |
| * This gene is included in those cancer gene databases. |
|
|
|
|
|
|
| ||||||||||||||
Oncogene 1 | Significant driver gene in | |||||||||||||||||||
| cf) number; DB name 1 Oncogene; http://nar.oxfordjournals.org/content/35/suppl_1/D721.long, 2 Tumor Suppressor gene; https://bioinfo.uth.edu/TSGene/, 3 Cancer Gene Census; http://www.nature.com/nrc/journal/v4/n3/abs/nrc1299.html, 4 CancerGenes; http://nar.oxfordjournals.org/content/35/suppl_1/D721.long, 5 Network of Cancer Gene; http://ncg.kcl.ac.uk/index.php, 1Therapeutic Vulnerabilities in Cancer; http://cbio.mskcc.org/cancergenomics/statius/ |
| KEGG_GLYCOLYSIS_GLUCONEOGENESIS KEGG_HISTIDINE_METABOLISM KEGG_TYROSINE_METABOLISM KEGG_PHENYLALANINE_METABOLISM KEGG_METABOLISM_OF_XENOBIOTICS_BY_CYTOCHROME_P450 KEGG_DRUG_METABOLISM_CYTOCHROME_P450 | |
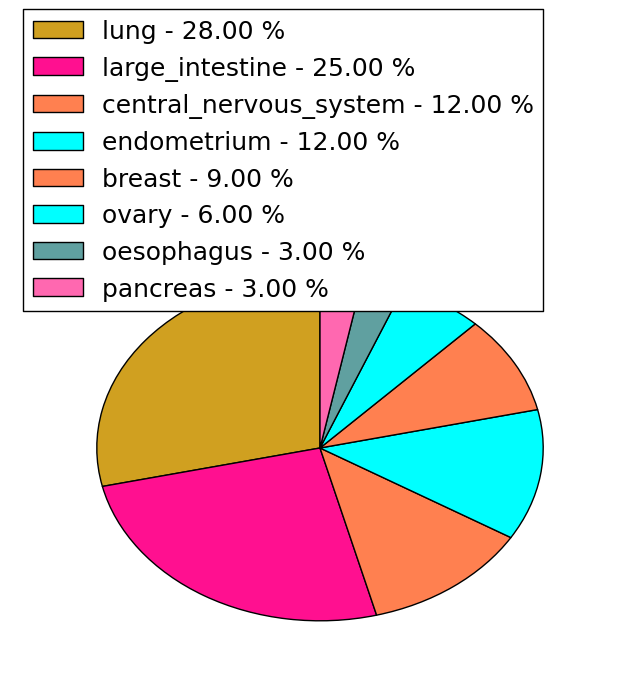
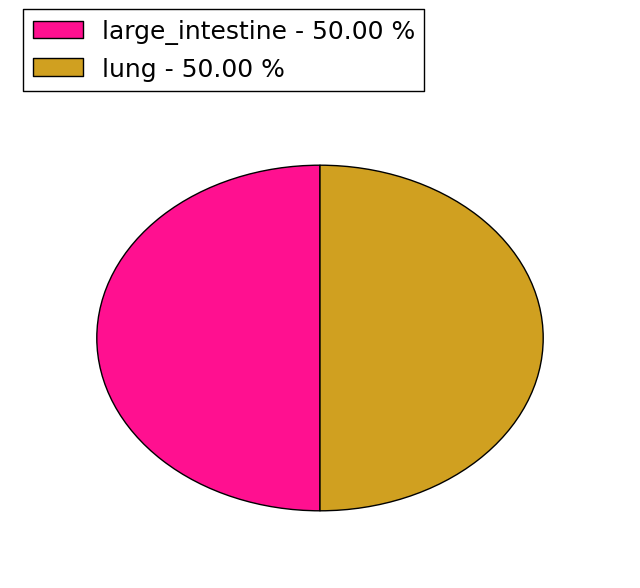
| Mutations for ALDH3A1 |
| * Under tables are showing count per each tissue to give us broad intuition about tissue specific mutation patterns.You can go to the detailed page for each mutation database's web site. |
| There's no structural variation information in COSMIC data for this gene. |
| * From mRNA Sanger sequences, Chitars2.0 arranged chimeric transcripts. This table shows ALDH3A1 related fusion information. |
| ID | Head Gene | Tail Gene | Accession | Gene_a | qStart_a | qEnd_a | Chromosome_a | tStart_a | tEnd_a | Gene_a | qStart_a | qEnd_a | Chromosome_a | tStart_a | tEnd_a |
| CV572132 | MSI2 | 1 | 261 | 17 | 55334385 | 55335694 | ALDH3A1 | 253 | 378 | 17 | 19641303 | 19641428 | |
| BQ331769 | DDX55 | 1 | 163 | 12 | 124099741 | 124101096 | ALDH3A1 | 156 | 289 | 17 | 19643649 | 19643782 | |
| BU679486 | ALDH3A1 | 18 | 83 | 17 | 19641302 | 19641367 | ASPH | 73 | 458 | 8 | 62574298 | 62596725 | |
| BU685263 | ALDH3A1 | 18 | 83 | 17 | 19641302 | 19641367 | ASPH | 73 | 513 | 8 | 62574243 | 62596725 | |
| Top |
| There's no copy number variation information in COSMIC data for this gene. |
| Top |
|
 |
| Top |
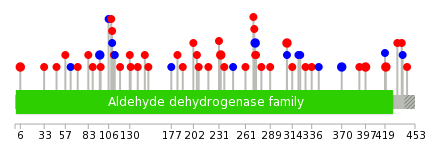
| Stat. for Non-Synonymous SNVs (# total SNVs=32) | (# total SNVs=10) |
 |  |
(# total SNVs=2) | (# total SNVs=0) |
 |
| Top |
| * When you move the cursor on each content, you can see more deailed mutation information on the Tooltip. Those are primary_site,primary_histology,mutation(aa),pubmedID. |
| GRCh37 position | Mutation(aa) | Unique sampleID count |
| chr17:19644516-19644516 | p.A233T | 2 |
| chr17:19642827-19642827 | p.N370N | 2 |
| chr17:19646651-19646651 | p.D96D | 2 |
| chr17:19648427-19648427 | p.E6K | 2 |
| chr17:19643782-19643782 | p.Y272Y | 2 |
| chr17:19641725-19641725 | p.E420K | 2 |
| chr17:19642335-19642335 | p.L397S | 2 |
| chr17:19643676-19643676 | p.T308P | 2 |
| chr17:19648346-19648346 | p.L33M | 1 |
| chr17:19641635-19641635 | p.? | 1 |
| Top |
|
 |
| Point Mutation/ Tissue ID | 1 | 2 | 3 | 4 | 5 | 6 | 7 | 8 | 9 | 10 | 11 | 12 | 13 | 14 | 15 | 16 | 17 | 18 | 19 | 20 |
| # sample | 1 | 5 | 3 | 1 | 4 | 1 | 2 | 9 | 5 | 8 | ||||||||||
| # mutation | 1 | 5 | 3 | 1 | 4 | 1 | 2 | 9 | 6 | 8 | ||||||||||
| nonsynonymous SNV | 1 | 5 | 2 | 3 | 1 | 2 | 5 | 6 | 4 | |||||||||||
| synonymous SNV | 1 | 1 | 1 | 4 | 4 |
| cf) Tissue ID; Tissue type (1; BLCA[Bladder Urothelial Carcinoma], 2; BRCA[Breast invasive carcinoma], 3; CESC[Cervical squamous cell carcinoma and endocervical adenocarcinoma], 4; COAD[Colon adenocarcinoma], 5; GBM[Glioblastoma multiforme], 6; Glioma Low Grade, 7; HNSC[Head and Neck squamous cell carcinoma], 8; KICH[Kidney Chromophobe], 9; KIRC[Kidney renal clear cell carcinoma], 10; KIRP[Kidney renal papillary cell carcinoma], 11; LAML[Acute Myeloid Leukemia], 12; LUAD[Lung adenocarcinoma], 13; LUSC[Lung squamous cell carcinoma], 14; OV[Ovarian serous cystadenocarcinoma ], 15; PAAD[Pancreatic adenocarcinoma], 16; PRAD[Prostate adenocarcinoma], 17; SKCM[Skin Cutaneous Melanoma], 18:STAD[Stomach adenocarcinoma], 19:THCA[Thyroid carcinoma], 20:UCEC[Uterine Corpus Endometrial Carcinoma]) |
| Top |
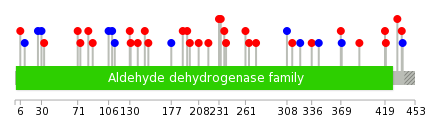
| * We represented just top 10 SNVs. When you move the cursor on each content, you can see more deailed mutation information on the Tooltip. Those are primary_site, primary_histology, mutation(aa), pubmedID. |
| Genomic Position | Mutation(aa) | Unique sampleID count |
| chr17:19646609 | p.G106G,ALDH3A1 | 1 |
| chr17:19641666 | p.G438D,ALDH3A1 | 1 |
| chr17:19643657 | p.F237L,ALDH3A1 | 1 |
| chr17:19645413 | p.E88D,ALDH3A1 | 1 |
| chr17:19646621 | p.L433V,ALDH3A1 | 1 |
| chr17:19641670 | p.A233T,ALDH3A1 | 1 |
| chr17:19643674 | p.A83V,ALDH3A1 | 1 |
| chr17:19645423 | p.E420K,ALDH3A1 | 1 |
| chr17:19646675 | p.R231H,ALDH3A1 | 1 |
| chr17:19641686 | p.M74I,ALDH3A1 | 1 |
| * Copy number data were extracted from TCGA using R package TCGA-Assembler. The URLs of all public data files on TCGA DCC data server were gathered on Jan-05-2015. Function ProcessCNAData in TCGA-Assembler package was used to obtain gene-level copy number value which is calculated as the average copy number of the genomic region of a gene. |
 |
| cf) Tissue ID[Tissue type]: BLCA[Bladder Urothelial Carcinoma], BRCA[Breast invasive carcinoma], CESC[Cervical squamous cell carcinoma and endocervical adenocarcinoma], COAD[Colon adenocarcinoma], GBM[Glioblastoma multiforme], Glioma Low Grade, HNSC[Head and Neck squamous cell carcinoma], KICH[Kidney Chromophobe], KIRC[Kidney renal clear cell carcinoma], KIRP[Kidney renal papillary cell carcinoma], LAML[Acute Myeloid Leukemia], LUAD[Lung adenocarcinoma], LUSC[Lung squamous cell carcinoma], OV[Ovarian serous cystadenocarcinoma ], PAAD[Pancreatic adenocarcinoma], PRAD[Prostate adenocarcinoma], SKCM[Skin Cutaneous Melanoma], STAD[Stomach adenocarcinoma], THCA[Thyroid carcinoma], UCEC[Uterine Corpus Endometrial Carcinoma] |
| Top |
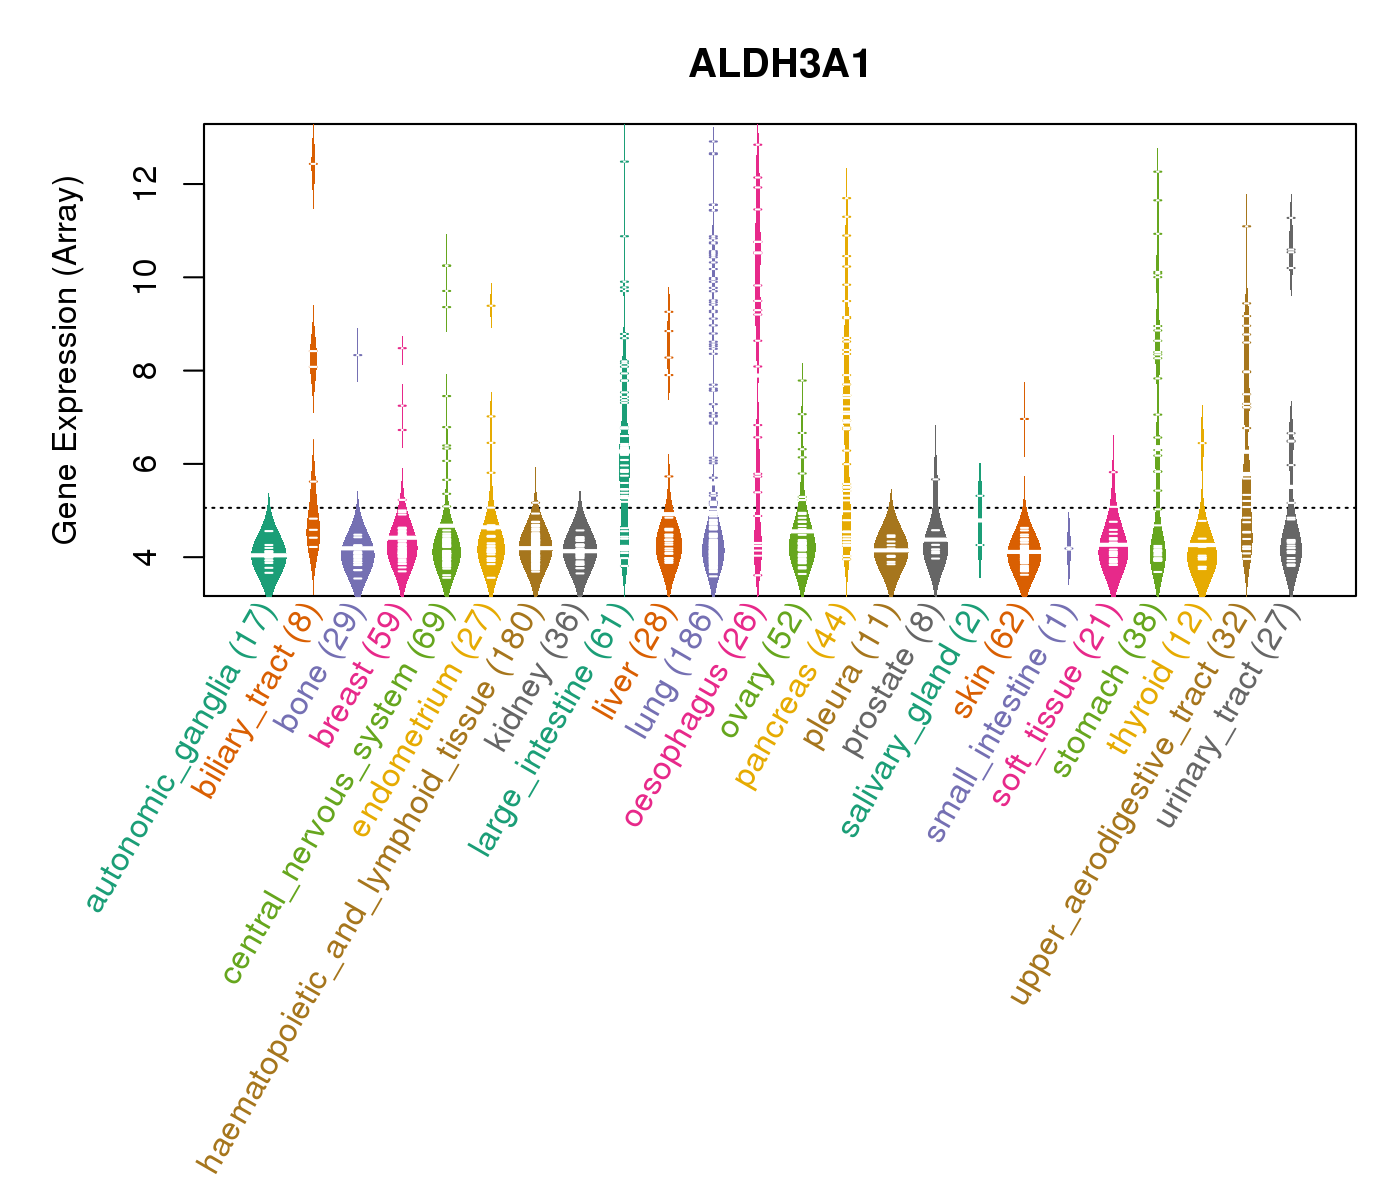
| Gene Expression for ALDH3A1 |
| * CCLE gene expression data were extracted from CCLE_Expression_Entrez_2012-10-18.res: Gene-centric RMA-normalized mRNA expression data. |
 |
| * Normalized gene expression data of RNASeqV2 was extracted from TCGA using R package TCGA-Assembler. The URLs of all public data files on TCGA DCC data server were gathered at Jan-05-2015. Only eight cancer types have enough normal control samples for differential expression analysis. (t test, adjusted p<0.05 (using Benjamini-Hochberg FDR)) |
 |
| Top |
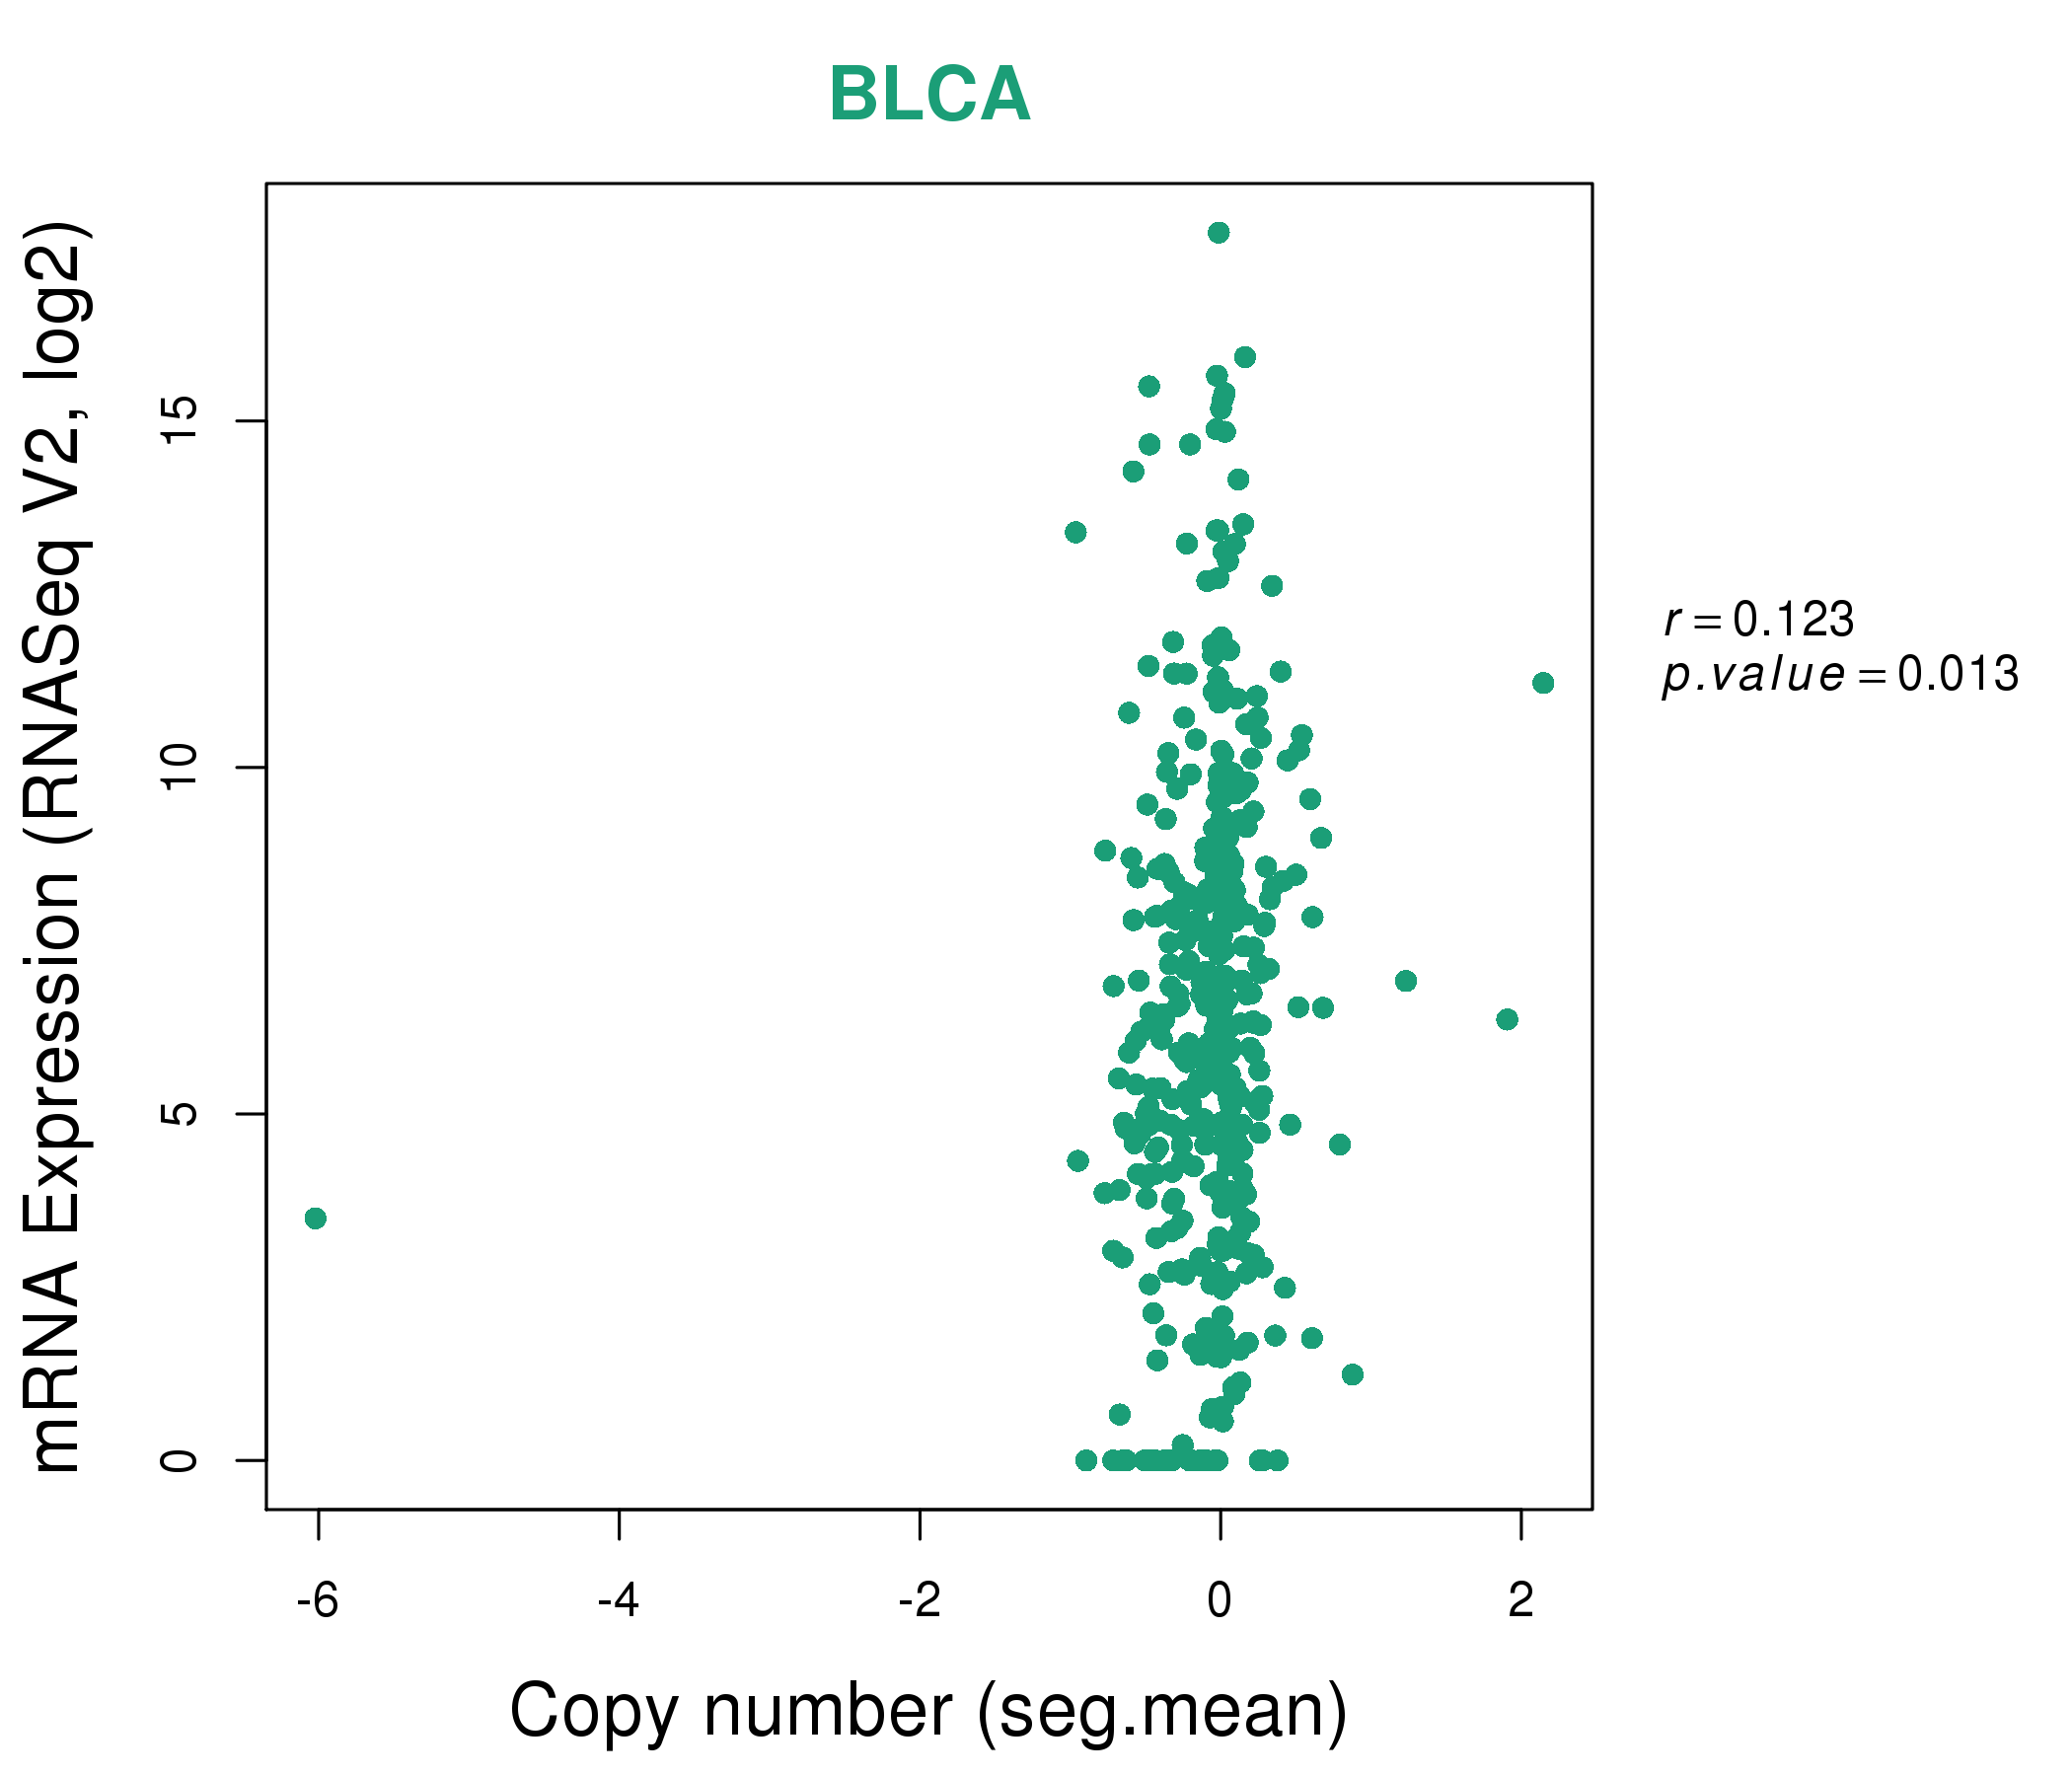
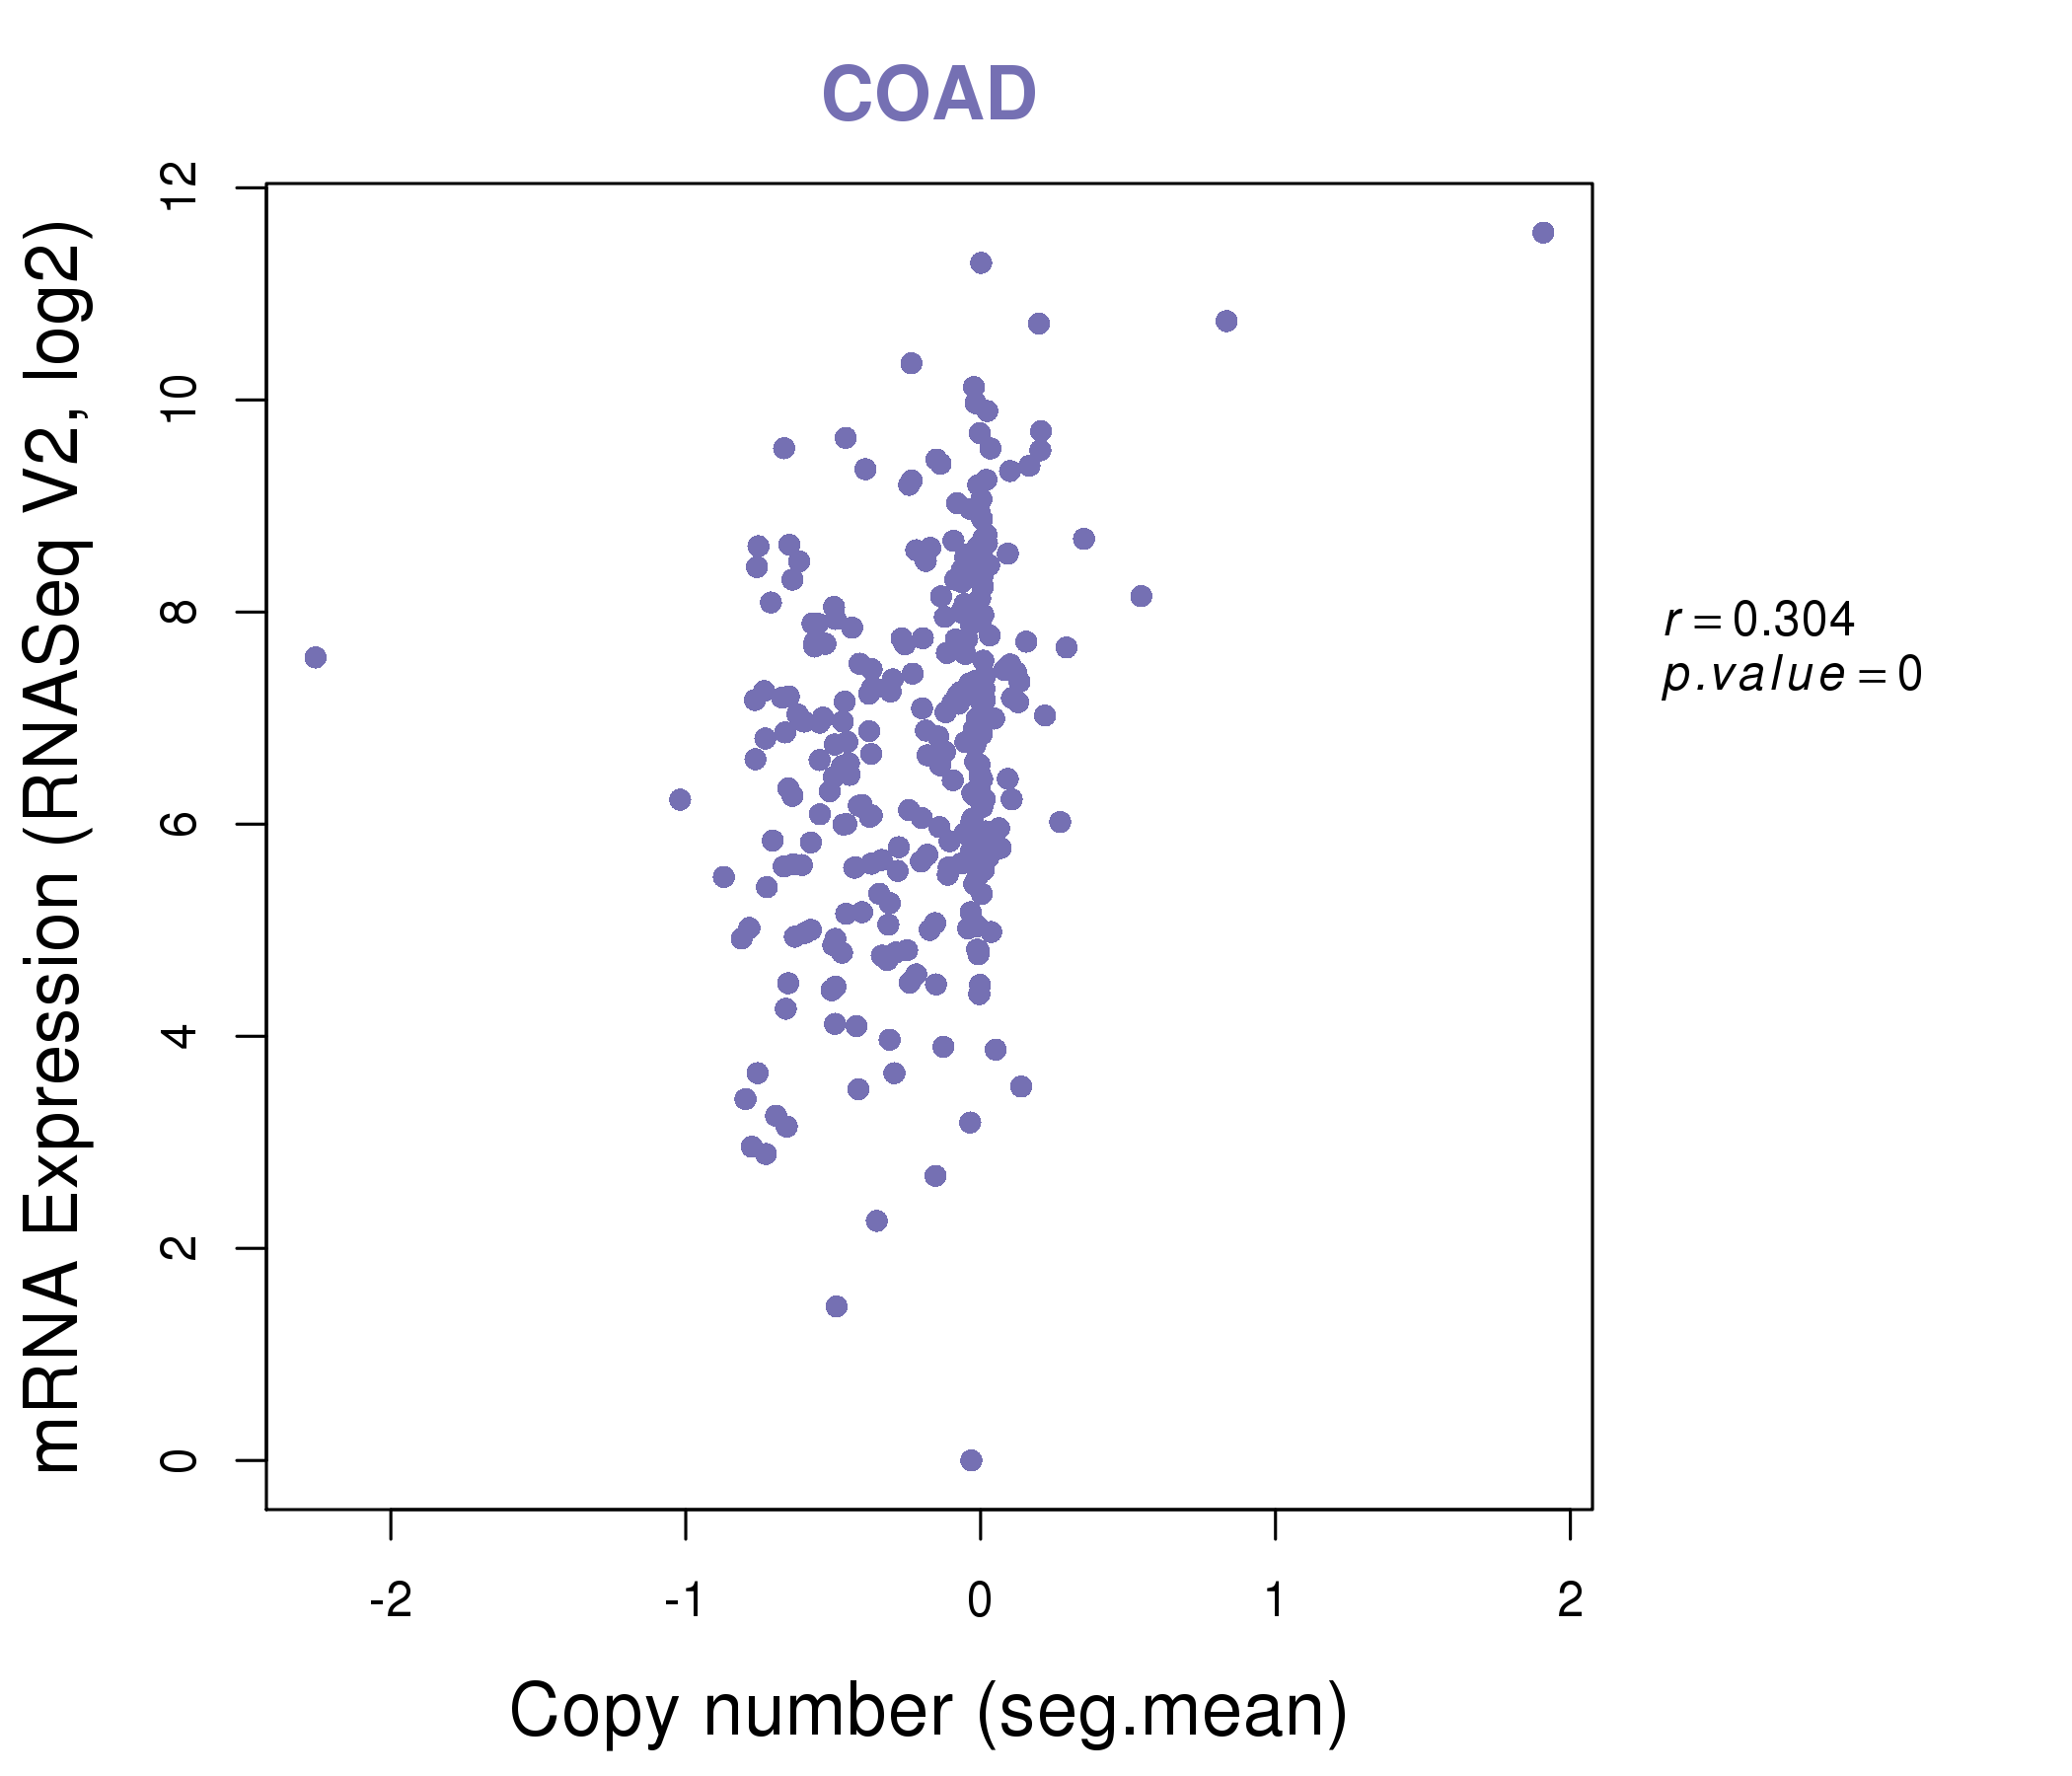
| * This plots show the correlation between CNV and gene expression. |
: Open all plots for all cancer types
 |
|
 |
|


| Top |
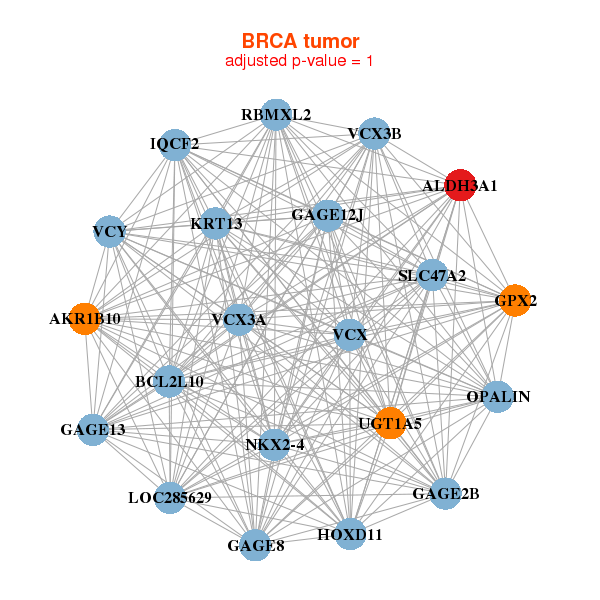
| Gene-Gene Network Information |
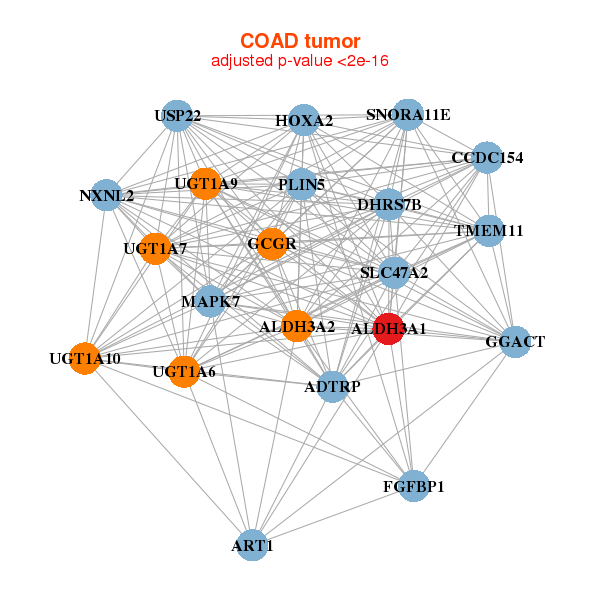
| * Co-Expression network figures were drawn using R package igraph. Only the top 20 genes with the highest correlations were shown. Red circle: input gene, orange circle: cell metabolism gene, sky circle: other gene |
: Open all plots for all cancer types
 |
| ||||
| AKR1B10,ALDH3A1,BCL2L10,GAGE12J,GAGE13,GAGE2B,GAGE8, GPX2,HOXD11,IQCF2,KRT13,LOC285629,NKX2-4,OPALIN, RBMXL2,SLC47A2,UGT1A5,VCX,VCX3A,VCX3B,VCY | ADH7,AKR1B10,ALDH3A1,CAPNS2,CYP4F3,GJB6,KRT13, KRT4,KRT6A,KRT78,KRTDAP,SERPINB3,SOX2,SPRR1A, SPRR2A,SPRR2D,SPRR3,TMPRSS4,UGT1A6,UGT1A7,UPK1B | ||||
 |
| ||||
| GGACT,ALDH3A1,ALDH3A2,ART1,ADTRP,CCDC154,DHRS7B, FGFBP1,GCGR,HOXA2,MAPK7,NXNL2,PLIN5,SLC47A2, SNORA11E,TMEM11,UGT1A10,UGT1A6,UGT1A7,UGT1A9,USP22 | ADH1C,ALDH3A1,BDH1,APMAP,C21orf33,CA2,CLYBL, DTWD2,GSS,LOC100134229,ME3,NDUFA10,NDUFV1,PCCA, PEX11A,RPL10L,RPP25,STARD7,TBRG4,TCEA3,WARS2 |
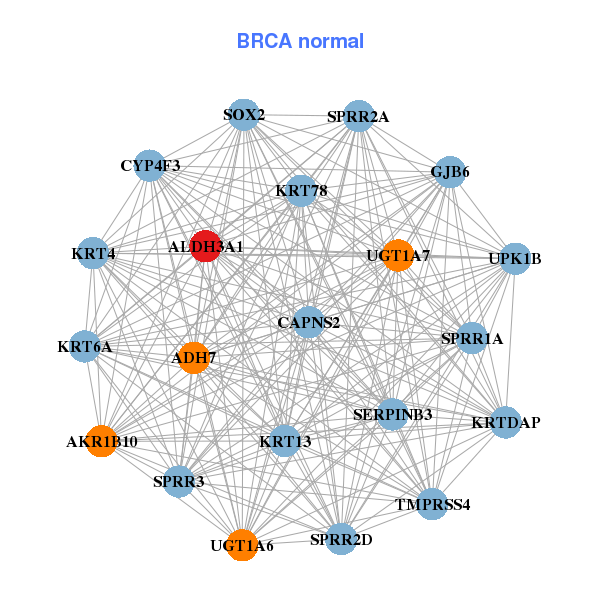
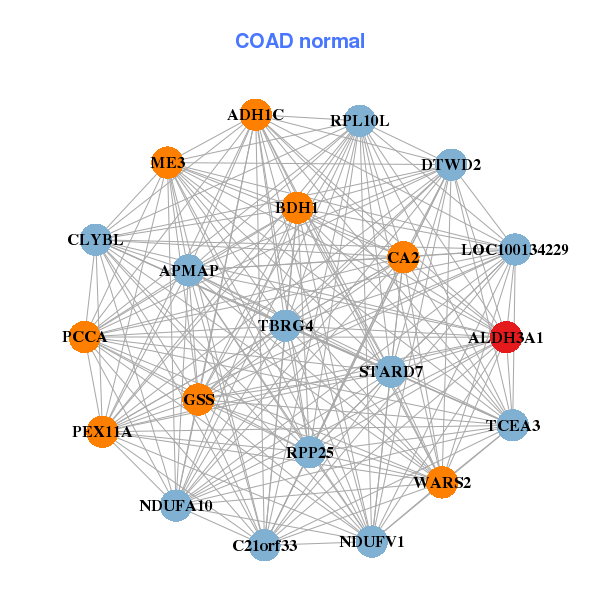
| * Co-Expression network figures were drawn using R package igraph. Only the top 20 genes with the highest correlations were shown. Red circle: input gene, orange circle: cell metabolism gene, sky circle: other gene |
: Open all plots for all cancer types
| Top |
: Open all interacting genes' information including KEGG pathway for all interacting genes from DAVID
| Top |
| Pharmacological Information for ALDH3A1 |
| DB Category | DB Name | DB's ID and Url link |
| * Gene Centered Interaction Network. |
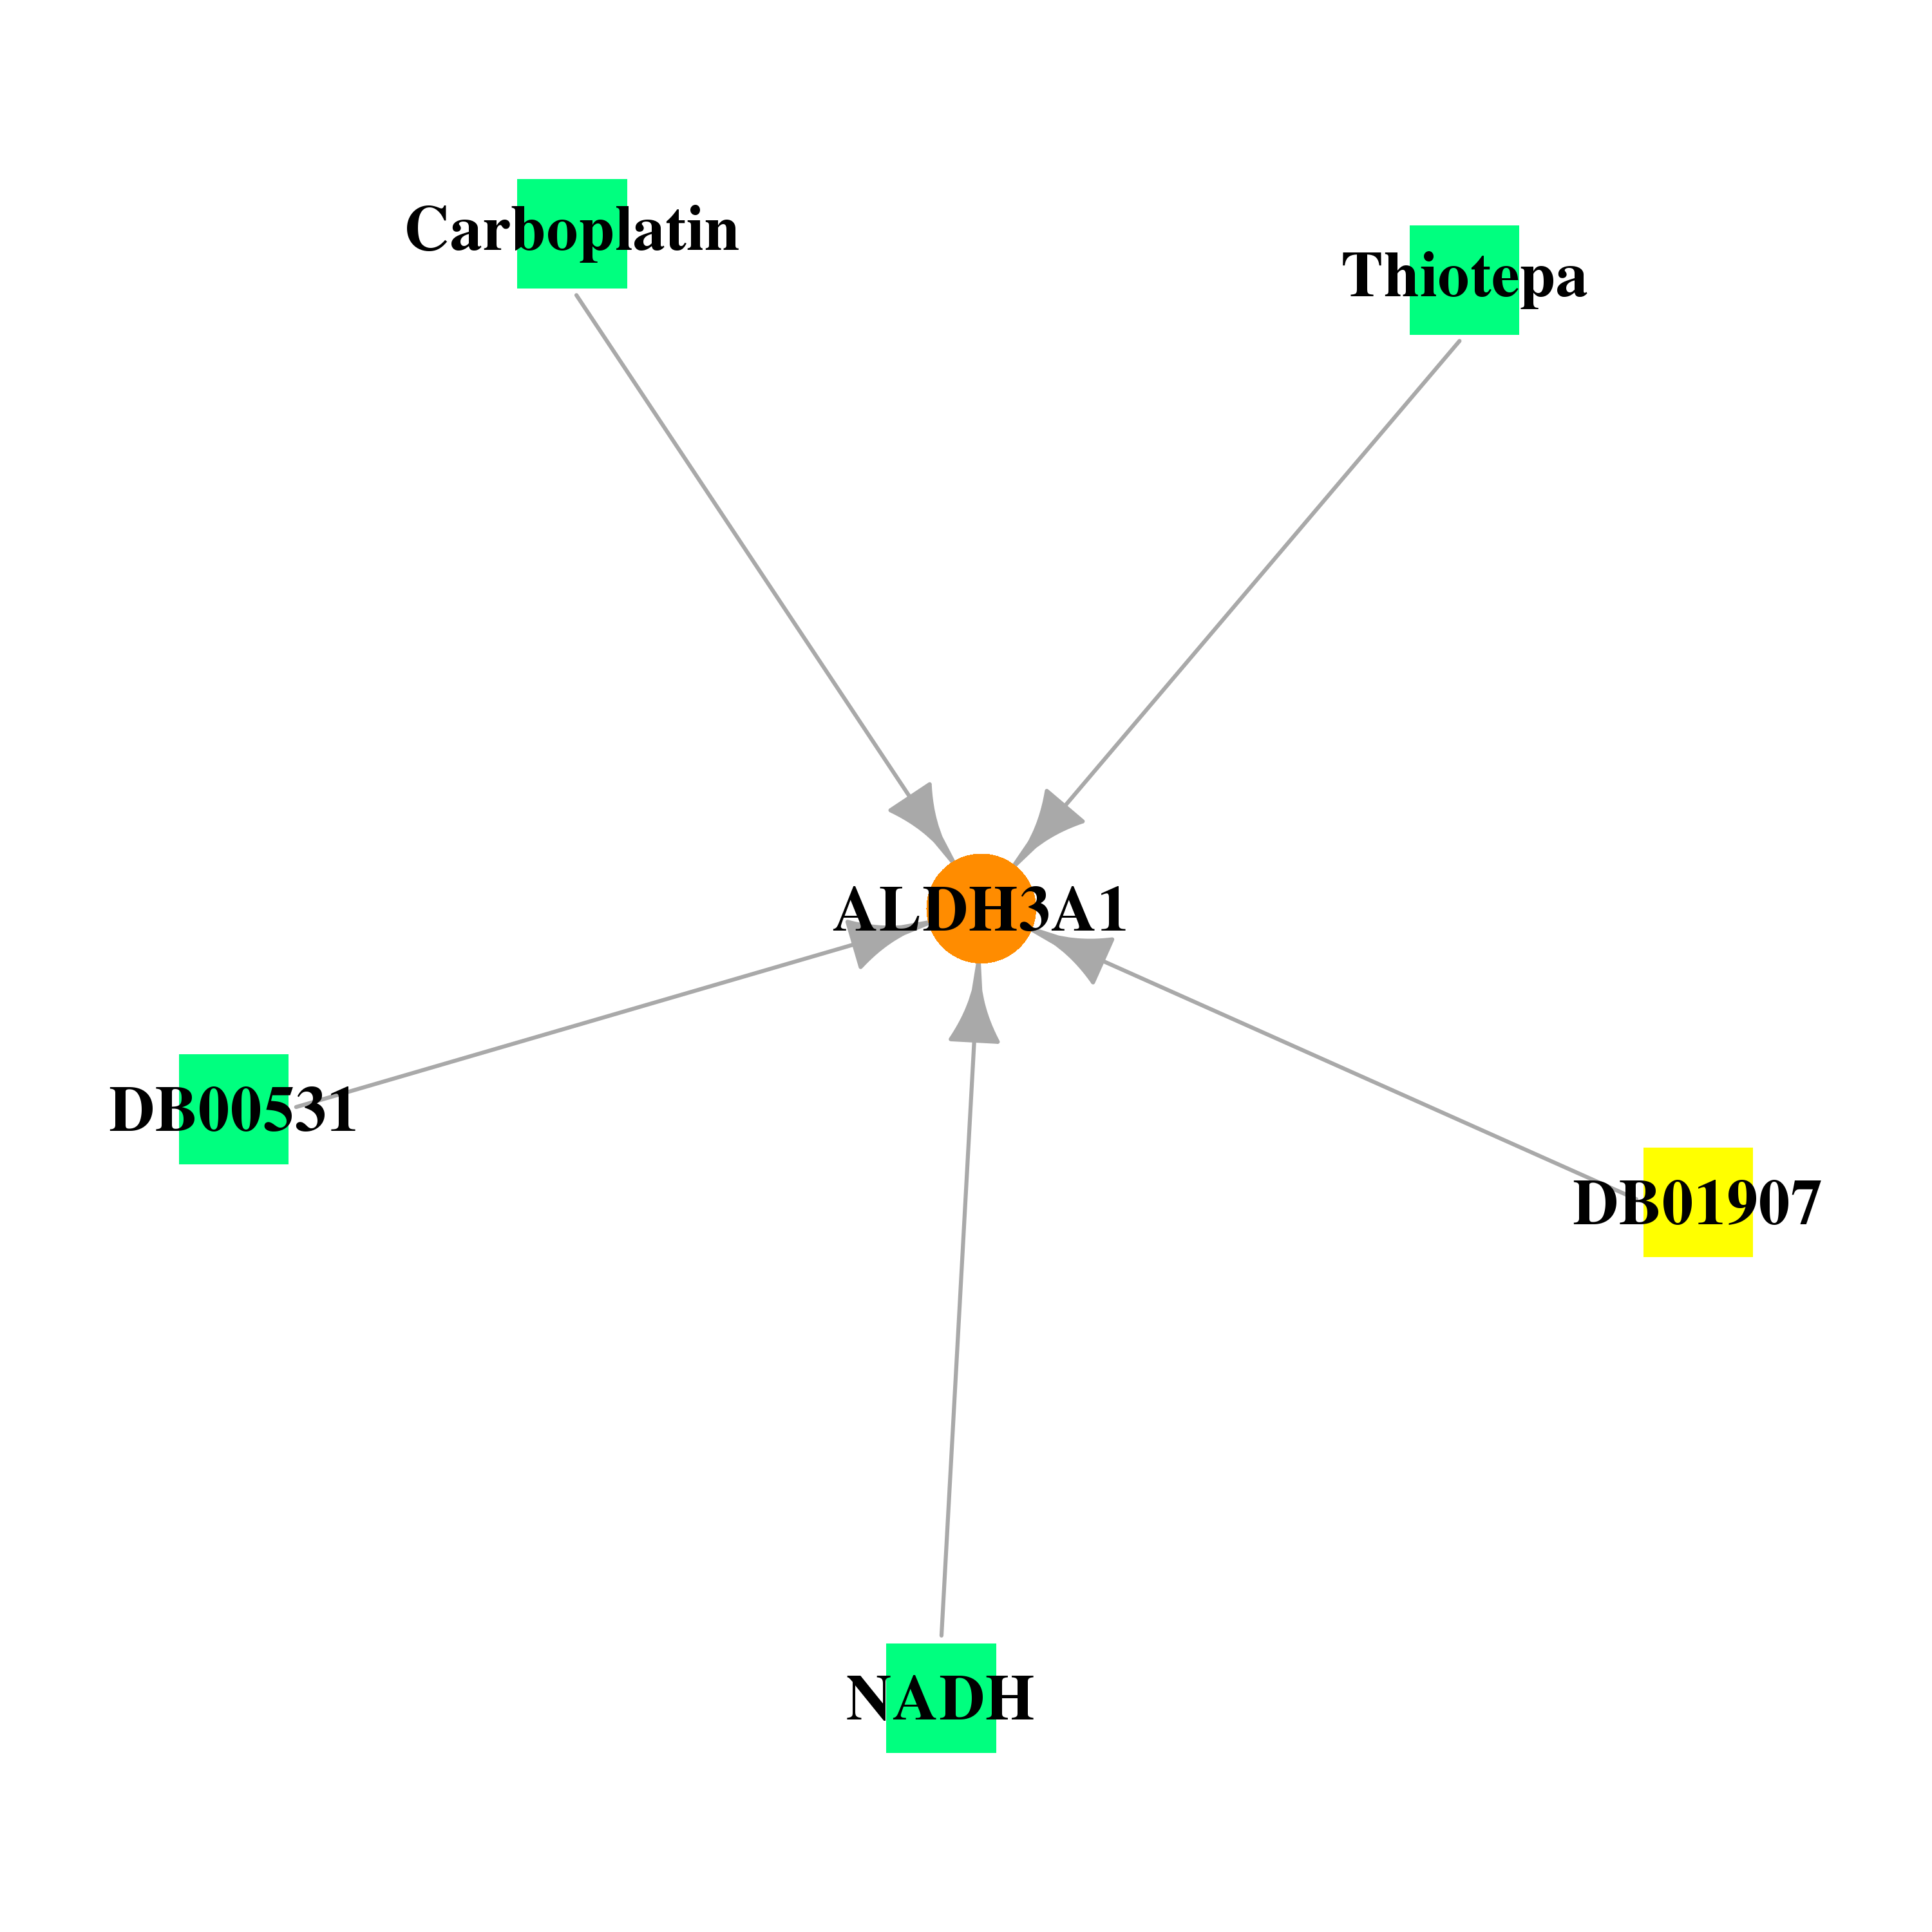 |
| * Drug Centered Interaction Network. |
| DrugBank ID | Target Name | Drug Groups | Generic Name | Drug Centered Network | Drug Structure |
| DB00157 | aldehyde dehydrogenase 3 family, member A1 | approved; nutraceutical | NADH |  |  |
| DB01907 | aldehyde dehydrogenase 3 family, member A1 | experimental | Nicotinamide-Adenine-Dinucleotide | 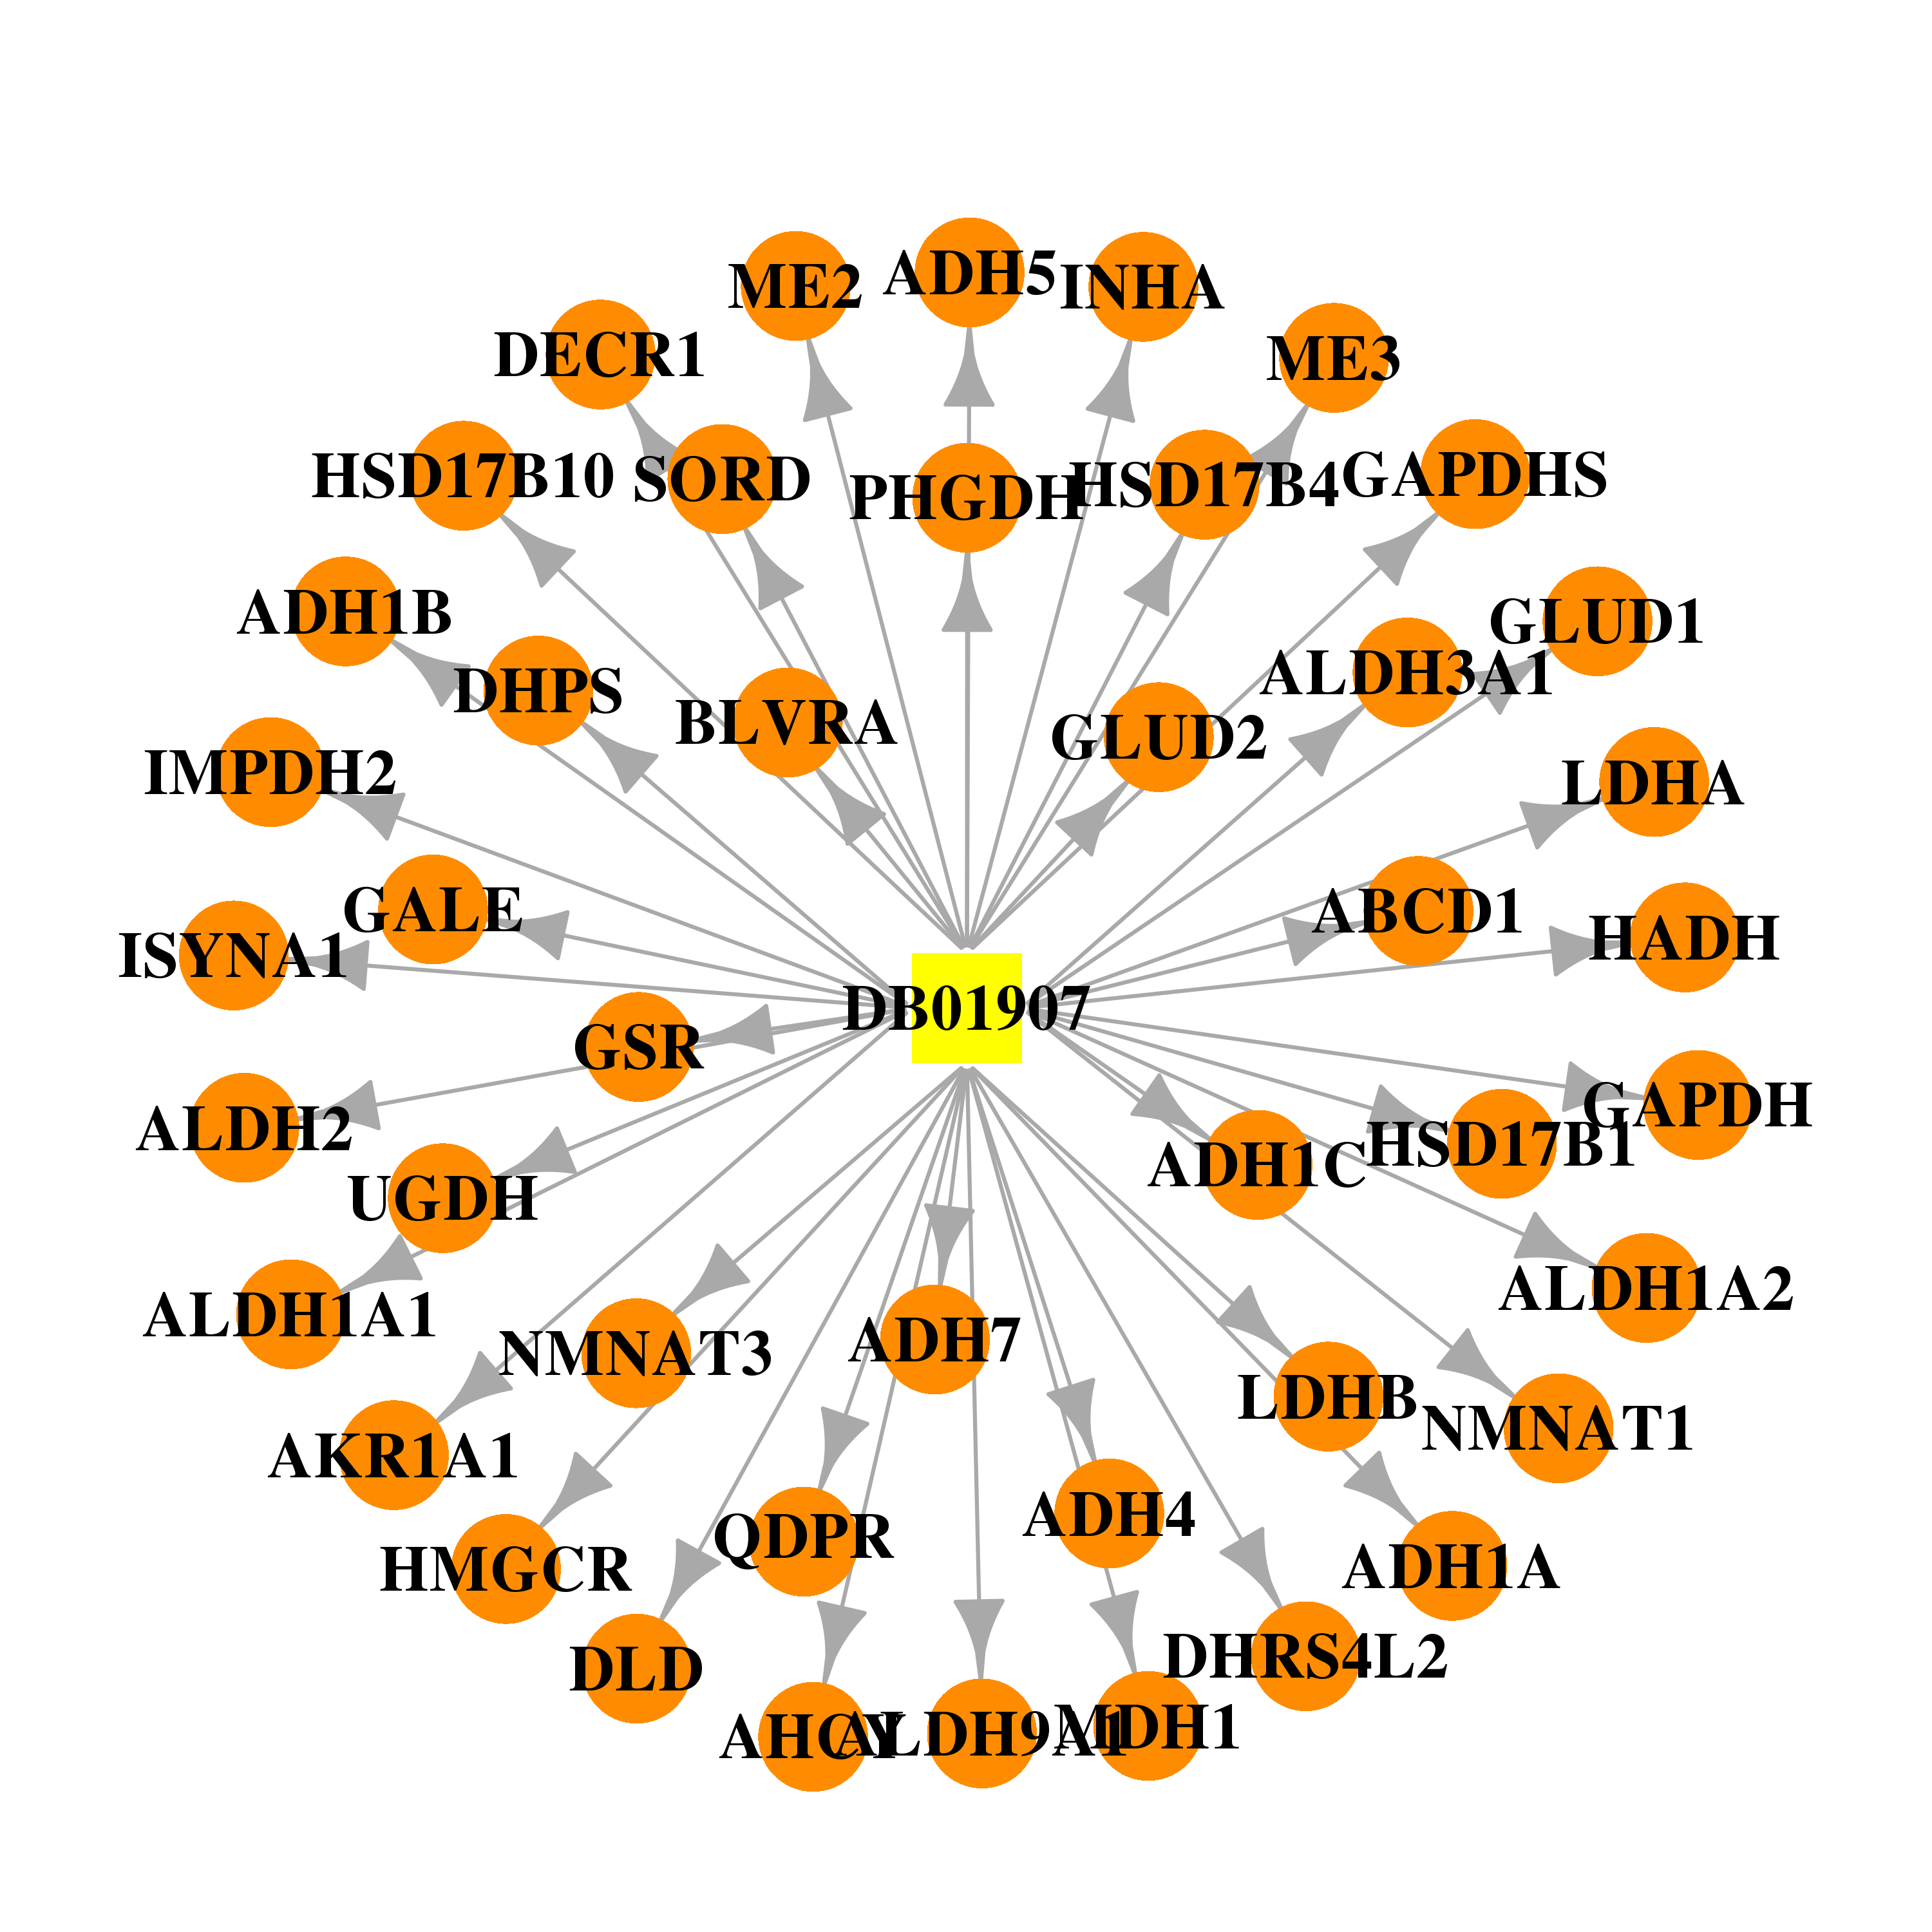 | 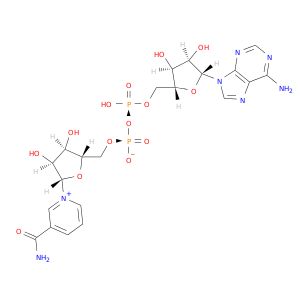 |
| DB00958 | aldehyde dehydrogenase 3 family, member A1 | approved | Carboplatin | 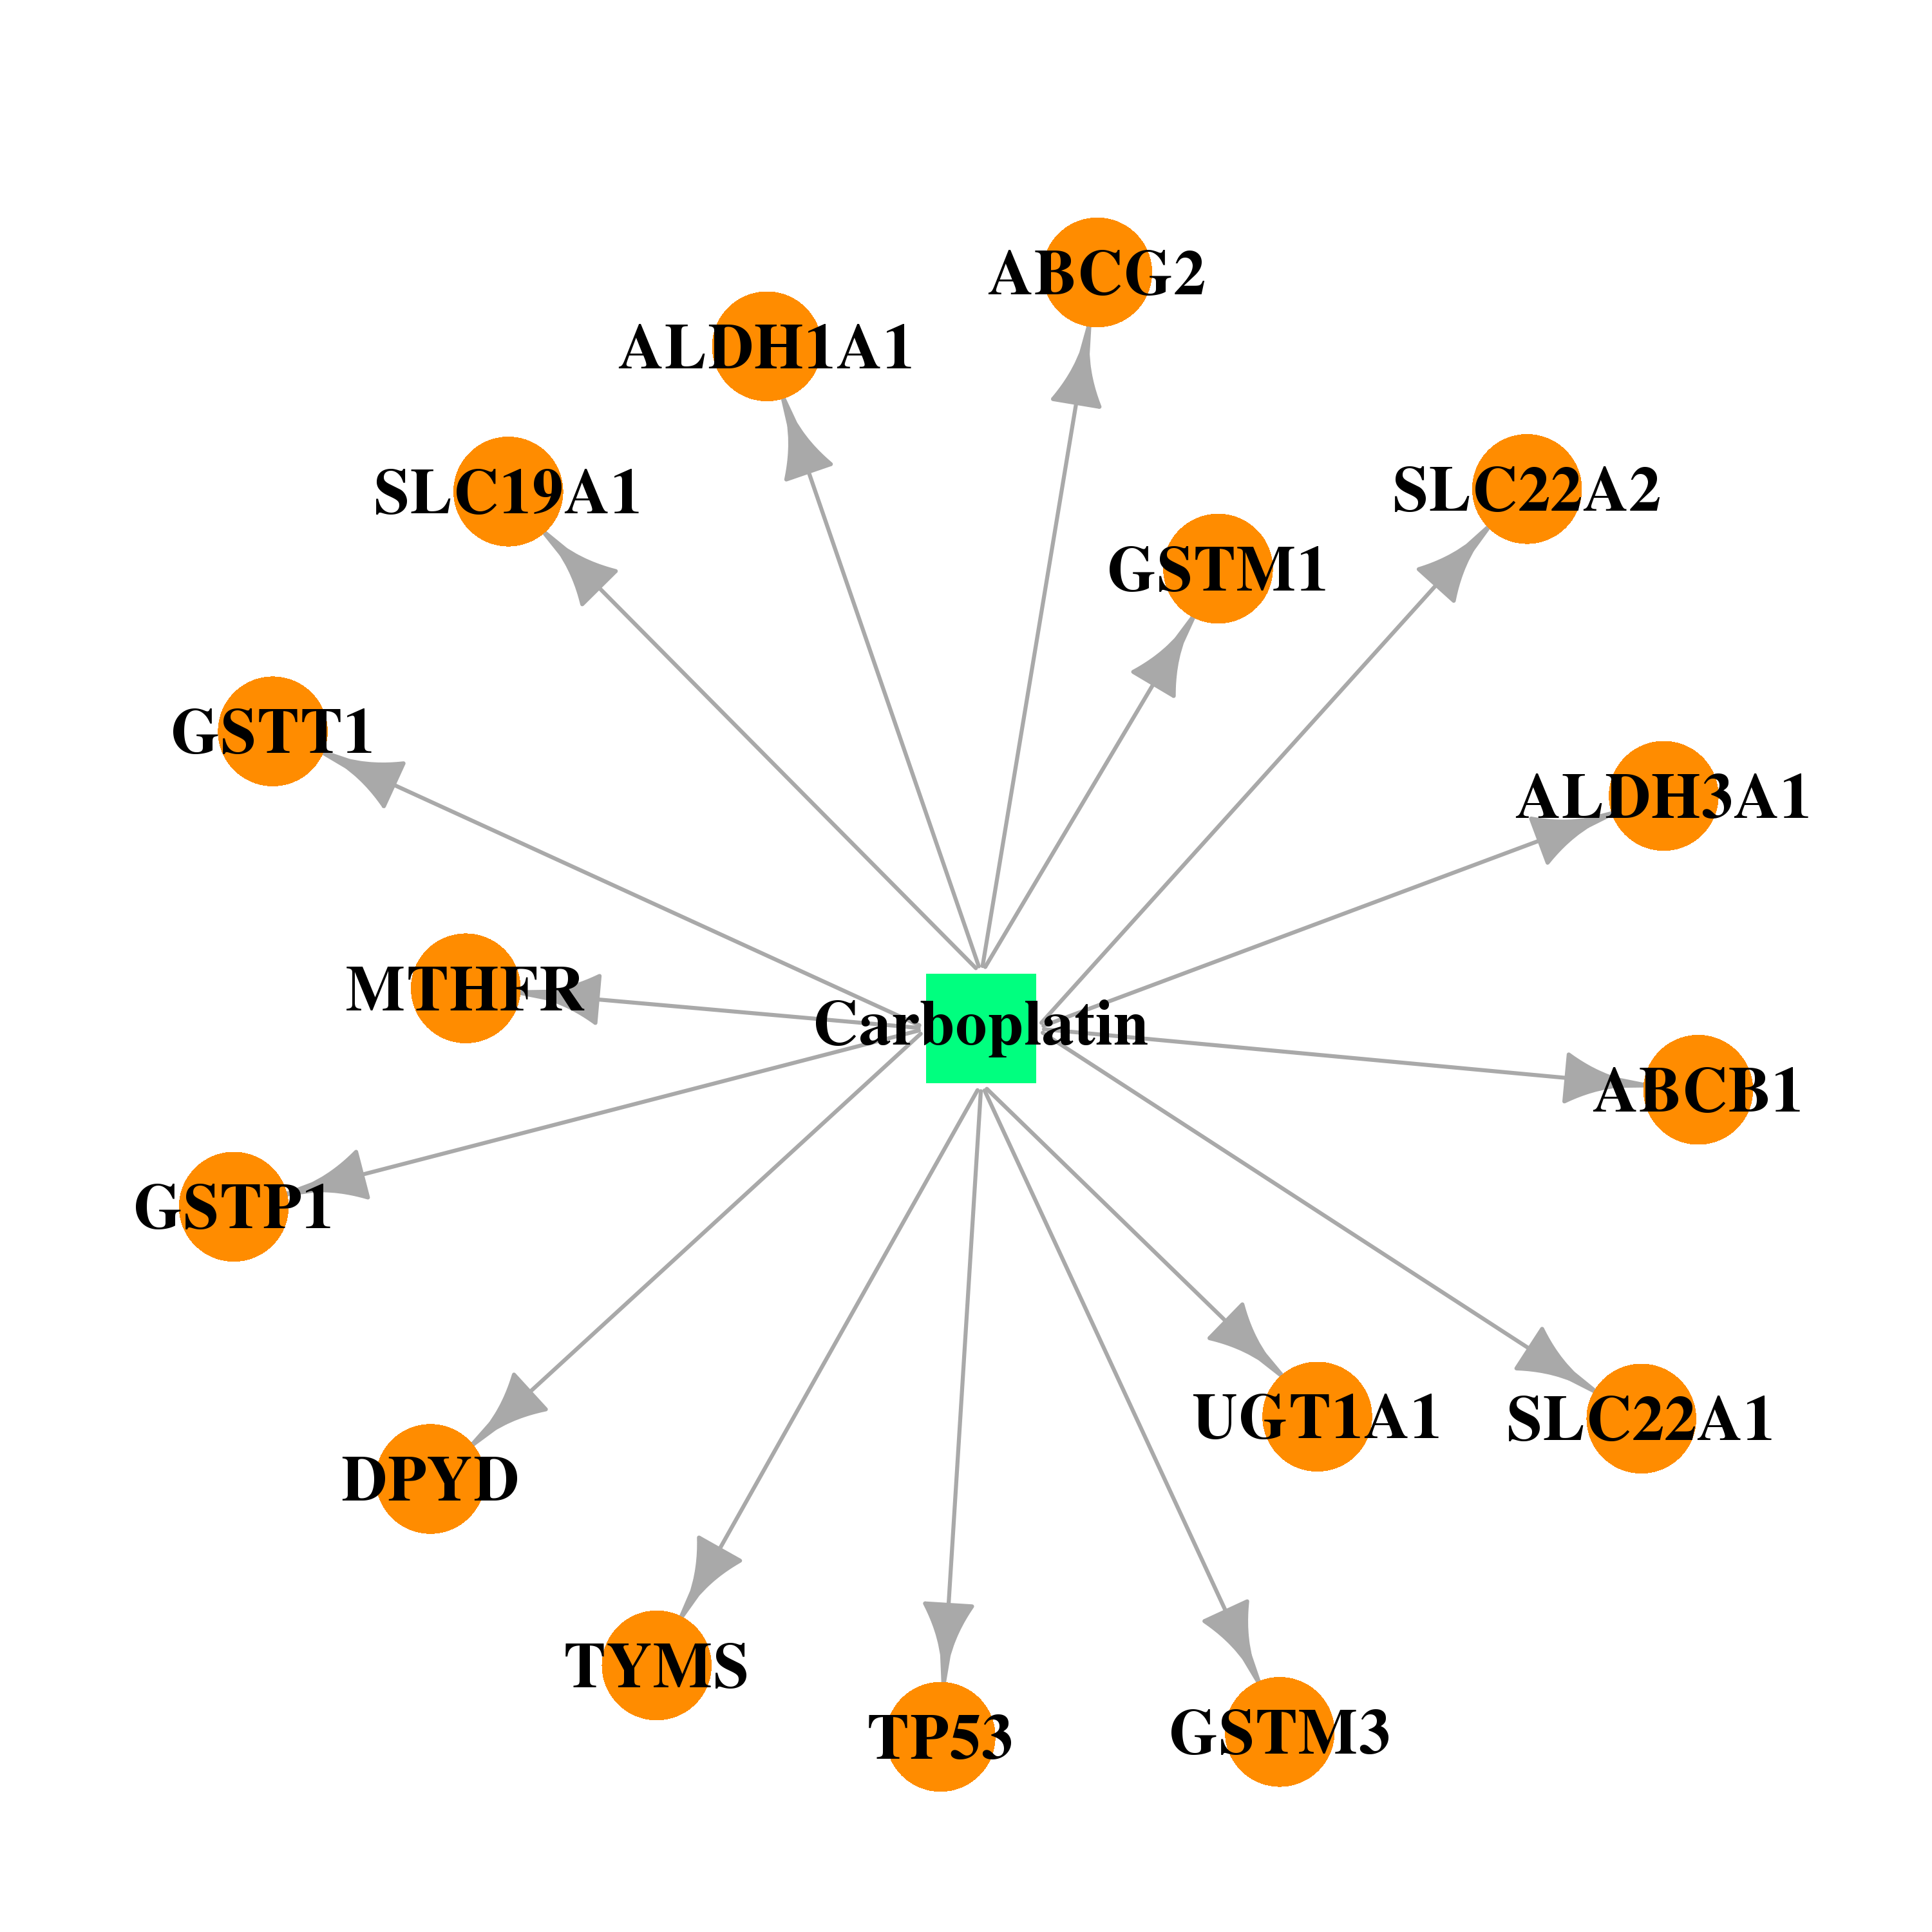 | 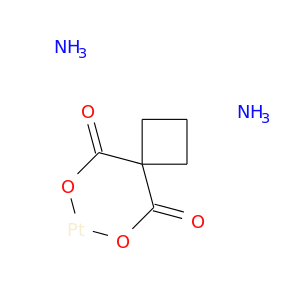 |
| DB04572 | aldehyde dehydrogenase 3 family, member A1 | approved | Thiotepa | 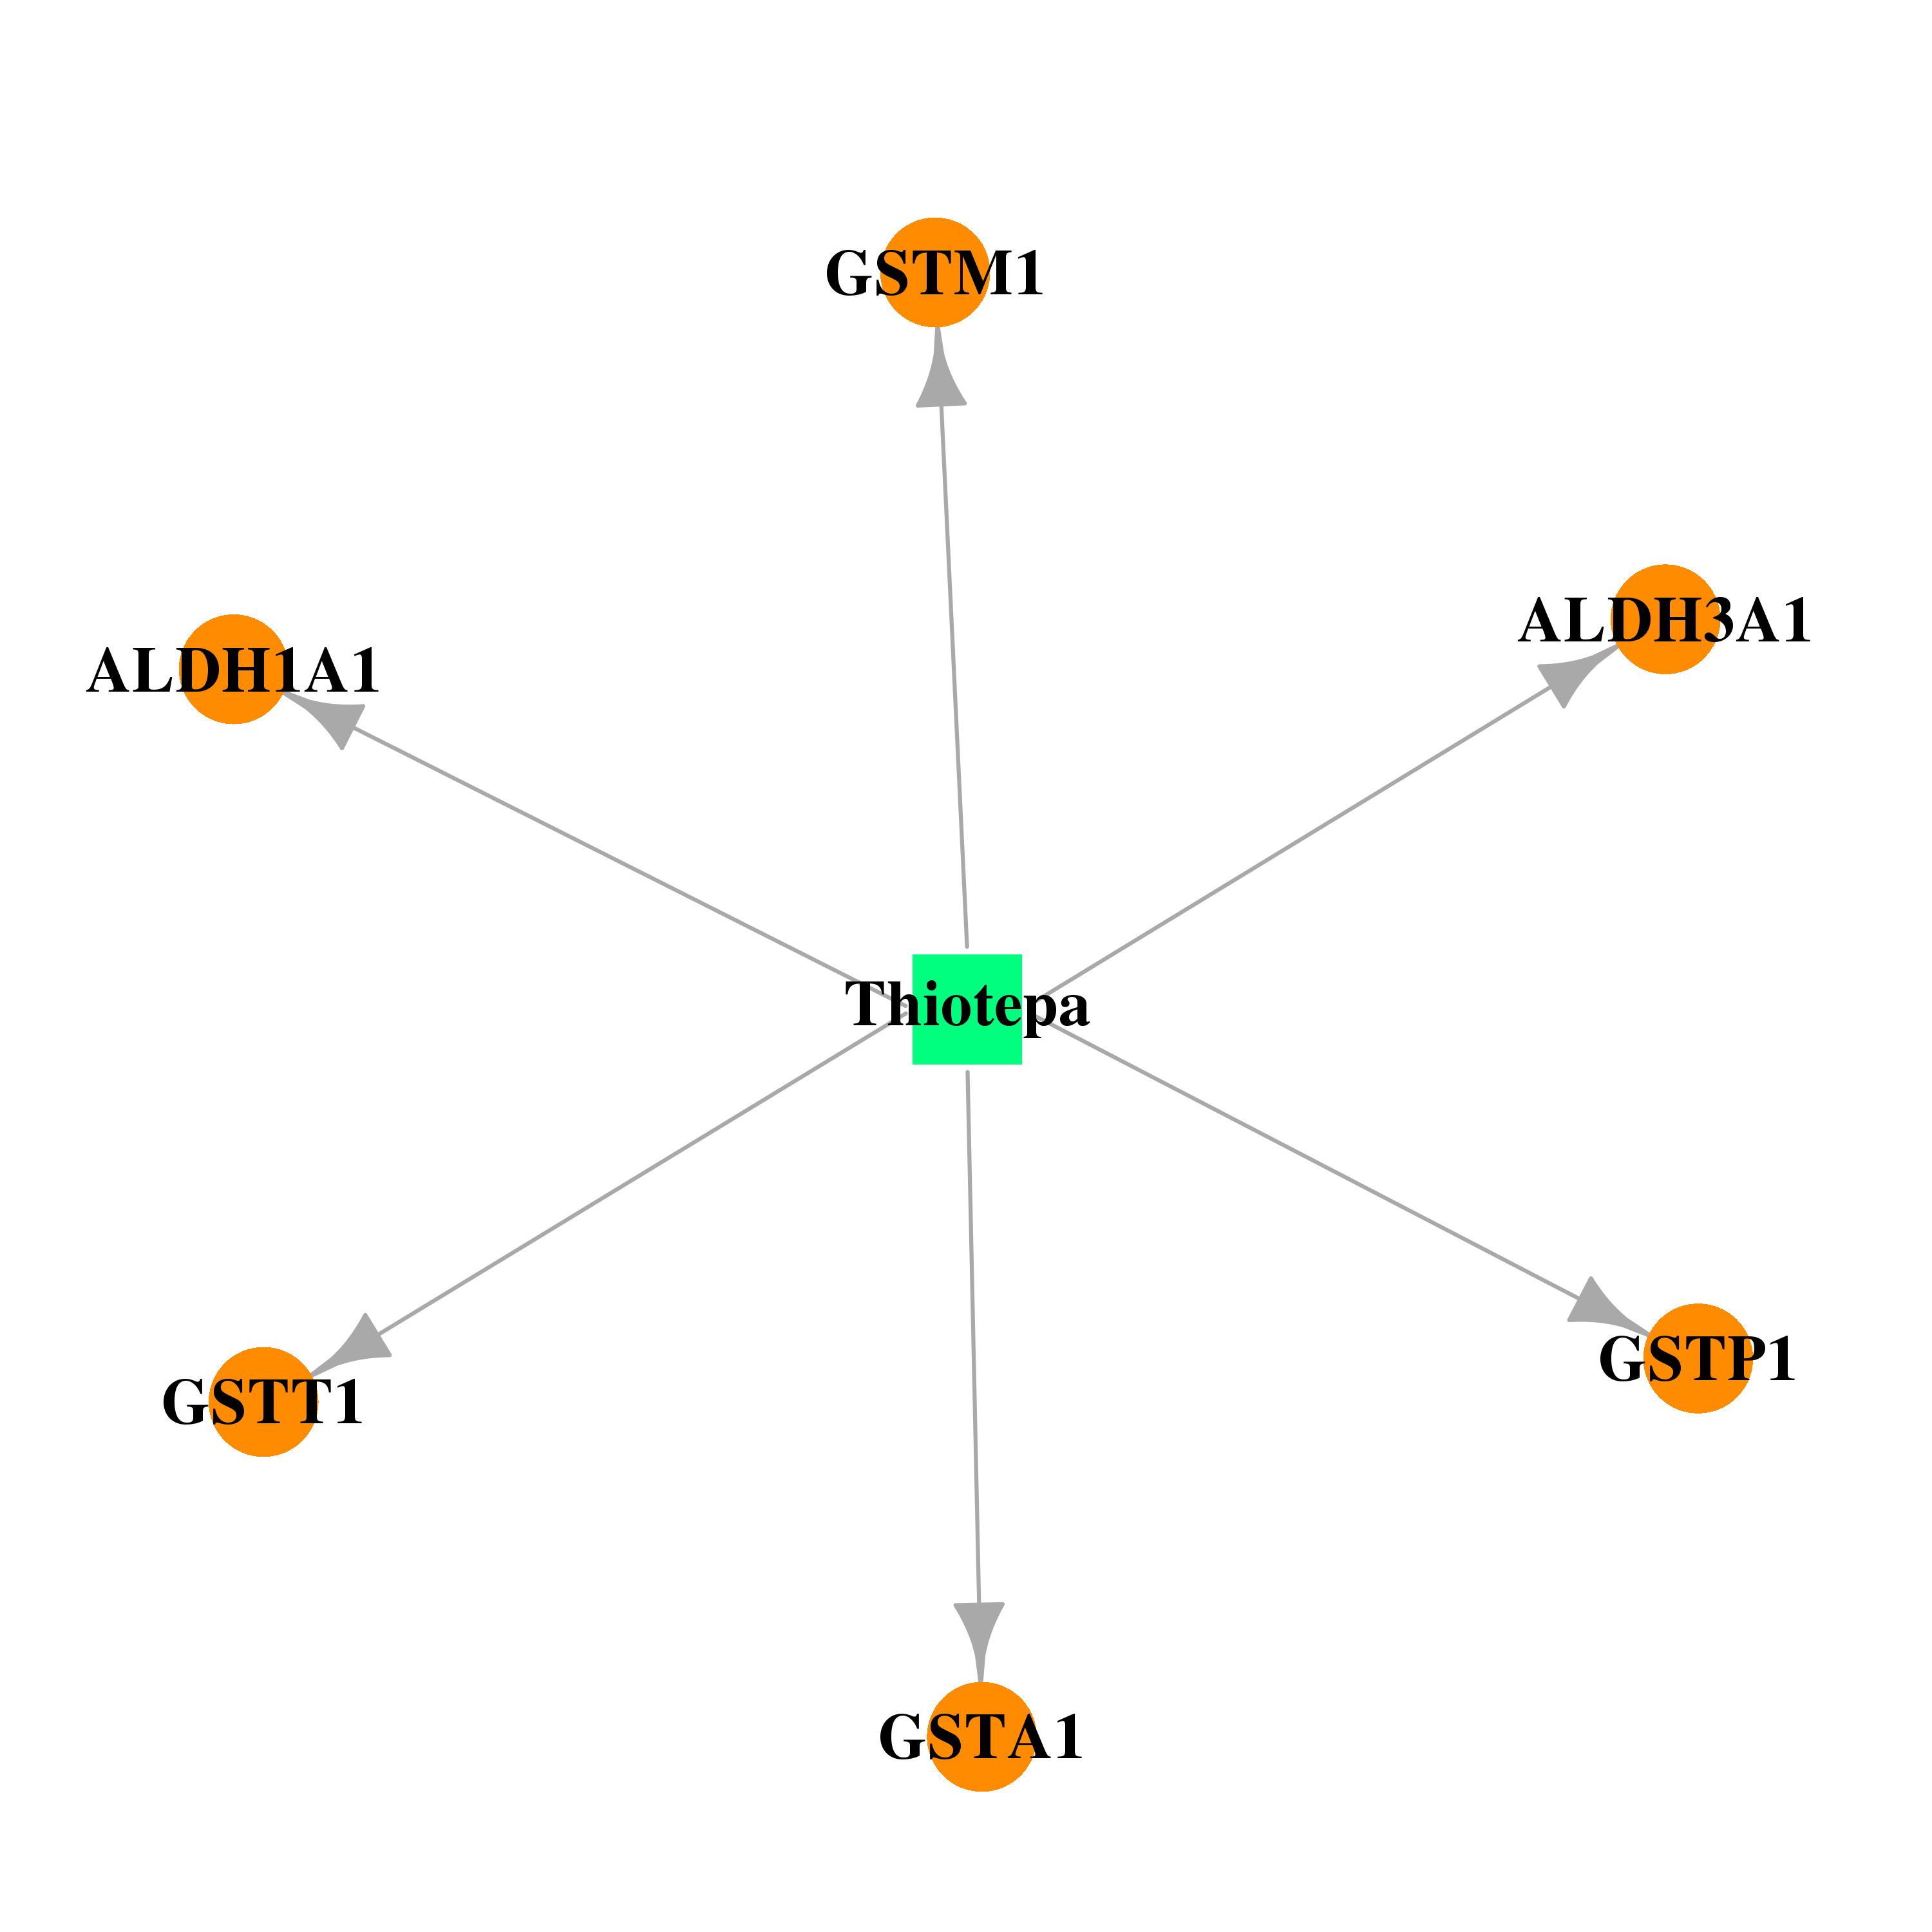 | 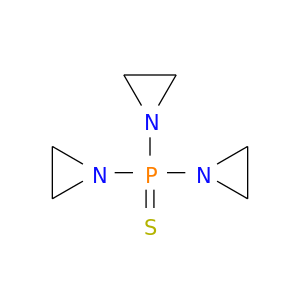 |
| DB00531 | aldehyde dehydrogenase 3 family, member A1 | approved; investigational | Cyclophosphamide | 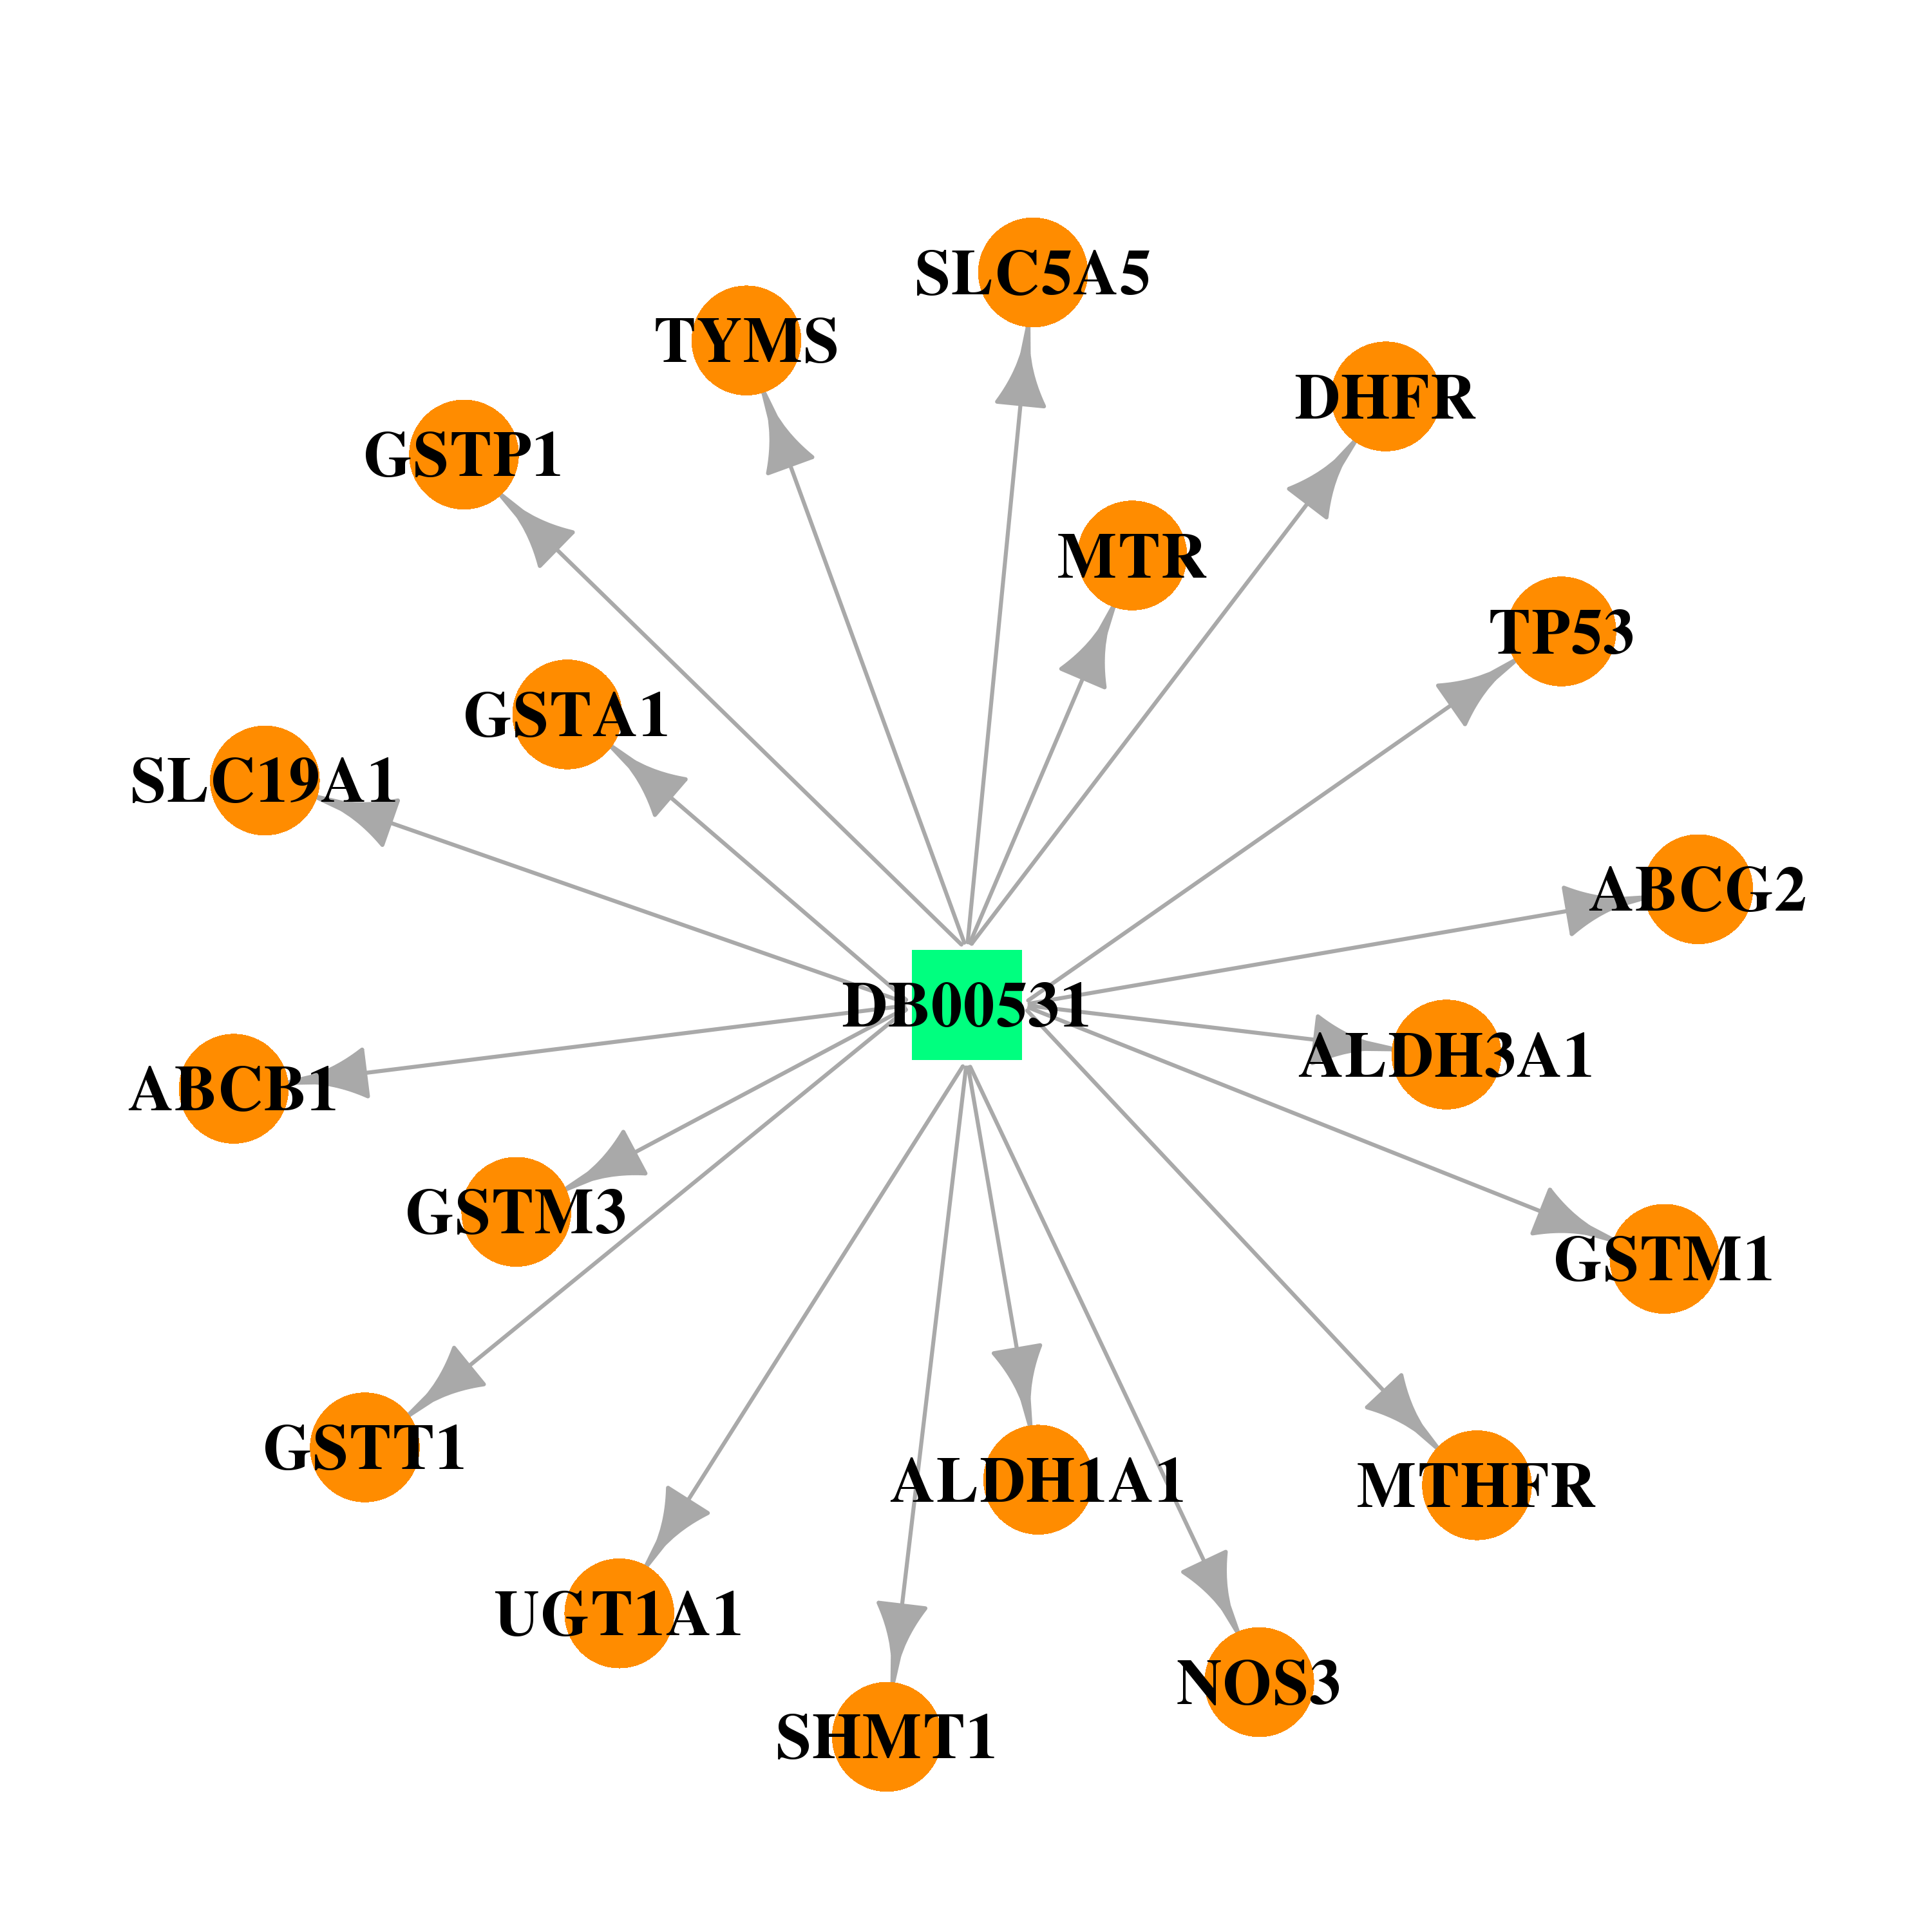 | 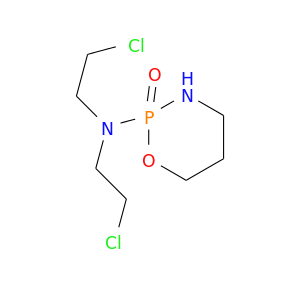 |
| Top |
| Cross referenced IDs for ALDH3A1 |
| * We obtained these cross-references from Uniprot database. It covers 150 different DBs, 18 categories. http://www.uniprot.org/help/cross_references_section |
: Open all cross reference information
|
Copyright © 2016-Present - The Univsersity of Texas Health Science Center at Houston @ |