|
||||||||||||||||||||
| |
| Phenotypic Information (metabolism pathway, cancer, disease, phenome) |
| |
| |
| Gene-Gene Network Information: Co-Expression Network, Interacting Genes & KEGG |
| |
|


| Gene Summary for ACSL3 |
| Basic gene info. | Gene symbol | ACSL3 |
| Gene name | acyl-CoA synthetase long-chain family member 3 | |
| Synonyms | ACS3|FACL3|PRO2194 | |
| Cytomap | UCSC genome browser: 2q34-q35 | |
| Genomic location | chr2 :223725731-223808119 | |
| Type of gene | protein-coding | |
| RefGenes | NM_004457.3, NM_203372.1, | |
| Ensembl id | ENSG00000123983 | |
| Description | LACS 3fatty-acid-Coenzyme A ligase, long-chain 3lignoceroyl-CoA synthaselong-chain acyl-CoA synthetase 3long-chain-fatty-acid--CoA ligase 3 | |
| Modification date | 20141207 | |
| dbXrefs | MIM : 602371 | |
| HGNC : HGNC | ||
| HPRD : 03845 | ||
| Protein | UniProt: O95573 go to UniProt's Cross Reference DB Table | |
| Expression | CleanEX: HS_ACSL3 | |
| BioGPS: 2181 | ||
| Gene Expression Atlas: ENSG00000123983 | ||
| The Human Protein Atlas: ENSG00000123983 | ||
| Pathway | NCI Pathway Interaction Database: ACSL3 | |
| KEGG: ACSL3 | ||
| REACTOME: ACSL3 | ||
| ConsensusPathDB | ||
| Pathway Commons: ACSL3 | ||
| Metabolism | MetaCyc: ACSL3 | |
| HUMANCyc: ACSL3 | ||
| Regulation | Ensembl's Regulation: ENSG00000123983 | |
| miRBase: chr2 :223,725,731-223,808,119 | ||
| TargetScan: NM_004457 | ||
| cisRED: ENSG00000123983 | ||
| Context | iHOP: ACSL3 | |
| cancer metabolism search in PubMed: ACSL3 | ||
| UCL Cancer Institute: ACSL3 | ||
| Assigned class in ccmGDB | A - This gene has a literature evidence and it belongs to cancer gene. | |
| References showing role of ACSL3 in cancer cell metabolism | 1. Cadenas C, Vosbeck S, Hein EM, Hellwig B, Langer A, et al. (2012) Glycerophospholipid profile in oncogene-induced senescence. Biochim Biophys Acta 1821: 1256-1268. doi: 10.1016/j.bbalip.2011.11.008. go to article 2. 1. Sumantran VN, Mishra P, Sudhakar N (2015) Microarray analysis of differentially expressed genes regulating lipid metabolism during melanoma progression. Indian J Biochem Biophys 52: 125-131. go to article | |
| Top |
| Phenotypic Information for ACSL3(metabolism pathway, cancer, disease, phenome) |
| Cancer | CGAP: ACSL3 |
| Familial Cancer Database: ACSL3 | |
| * This gene is included in those cancer gene databases. |
|
|
|
|
|
| . | ||||||||||||||
Oncogene 1 | Significant driver gene in | |||||||||||||||||||
| cf) number; DB name 1 Oncogene; http://nar.oxfordjournals.org/content/35/suppl_1/D721.long, 2 Tumor Suppressor gene; https://bioinfo.uth.edu/TSGene/, 3 Cancer Gene Census; http://www.nature.com/nrc/journal/v4/n3/abs/nrc1299.html, 4 CancerGenes; http://nar.oxfordjournals.org/content/35/suppl_1/D721.long, 5 Network of Cancer Gene; http://ncg.kcl.ac.uk/index.php, 1Therapeutic Vulnerabilities in Cancer; http://cbio.mskcc.org/cancergenomics/statius/ |
| KEGG_FATTY_ACID_METABOLISM REACTOME_METABOLISM_OF_LIPIDS_AND_LIPOPROTEINS | |
| OMIM | 602371; gene. |
| Orphanet | |
| Disease | KEGG Disease: ACSL3 |
| MedGen: ACSL3 (Human Medical Genetics with Condition) | |
| ClinVar: ACSL3 | |
| Phenotype | MGI: ACSL3 (International Mouse Phenotyping Consortium) |
| PhenomicDB: ACSL3 | |
| Mutations for ACSL3 |
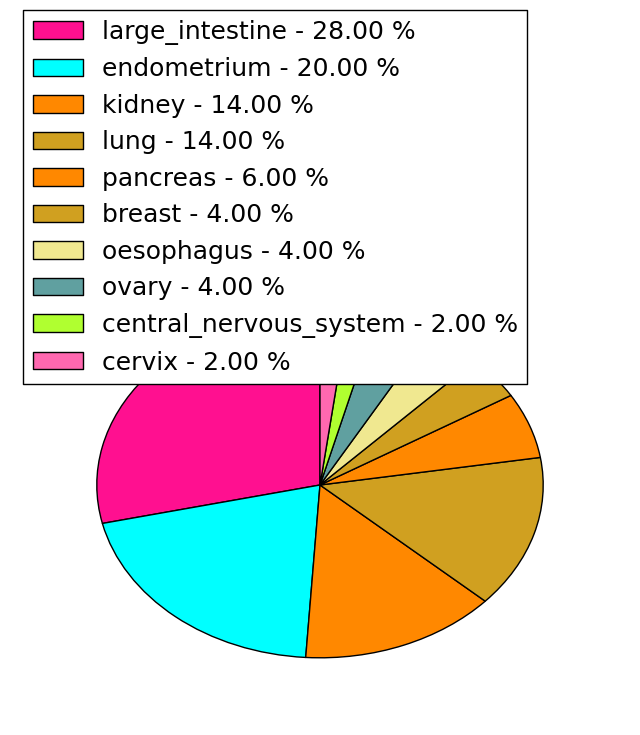
| * Under tables are showing count per each tissue to give us broad intuition about tissue specific mutation patterns.You can go to the detailed page for each mutation database's web site. |
| - Statistics for Tissue and Mutation type | Top |
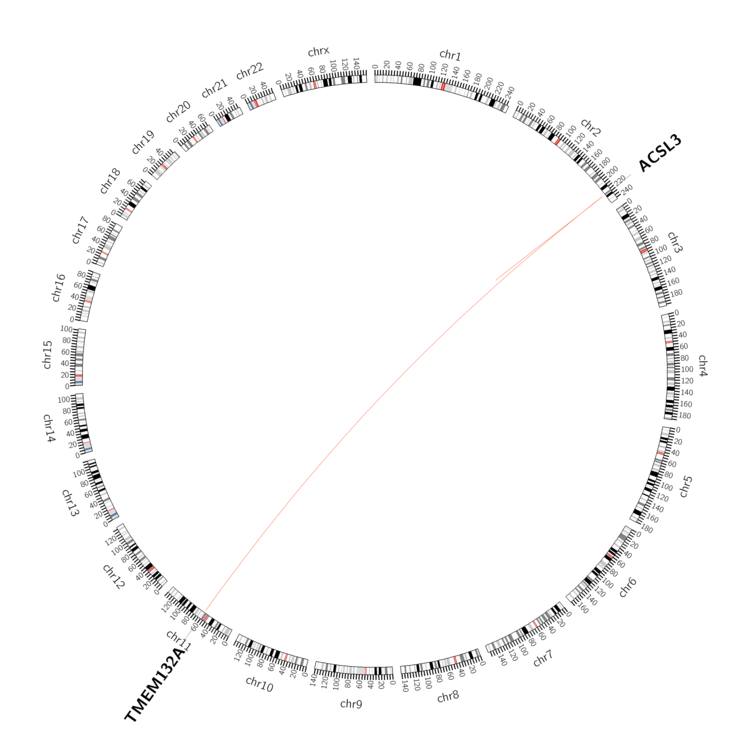 |
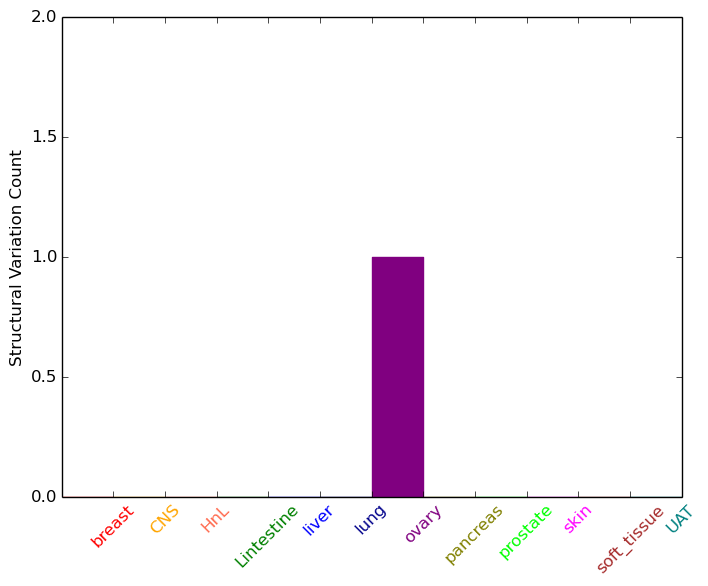
| - For Inter-chromosomal Variations |
| * Inter-chromosomal variantions includes 'interchromosomal amplicon to amplicon', 'interchromosomal amplicon to non-amplified dna', 'interchromosomal insertion', 'Interchromosomal unknown type'. |
 |
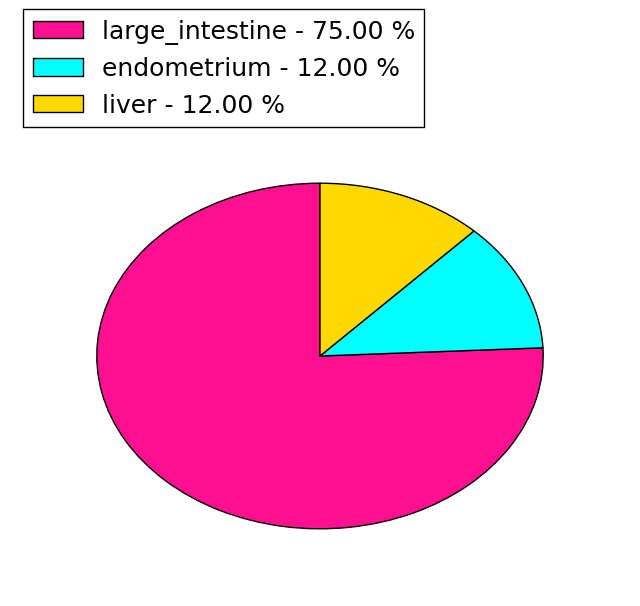
| - For Intra-chromosomal Variations |
| * Intra-chromosomal variantions includes 'intrachromosomal amplicon to amplicon', 'intrachromosomal amplicon to non-amplified dna', 'intrachromosomal deletion', 'intrachromosomal fold-back inversion', 'intrachromosomal inversion', 'intrachromosomal tandem duplication', 'Intrachromosomal unknown type', 'intrachromosomal with inverted orientation', 'intrachromosomal with non-inverted orientation'. |
 |
| Sample | Symbol_a | Chr_a | Start_a | End_a | Symbol_b | Chr_b | Start_b | End_b |
| ovary | ACSL3 | chr2 | 223731485 | 223731505 | TMEM132A | chr11 | 60704441 | 60704461 |
| ovary | ACSL3 | chr2 | 223766141 | 223766161 | ACSL3 | chr2 | 223767093 | 223767113 |
| cf) Tissue number; Tissue name (1;Breast, 2;Central_nervous_system, 3;Haematopoietic_and_lymphoid_tissue, 4;Large_intestine, 5;Liver, 6;Lung, 7;Ovary, 8;Pancreas, 9;Prostate, 10;Skin, 11;Soft_tissue, 12;Upper_aerodigestive_tract) |
| * From mRNA Sanger sequences, Chitars2.0 arranged chimeric transcripts. This table shows ACSL3 related fusion information. |
| ID | Head Gene | Tail Gene | Accession | Gene_a | qStart_a | qEnd_a | Chromosome_a | tStart_a | tEnd_a | Gene_a | qStart_a | qEnd_a | Chromosome_a | tStart_a | tEnd_a |
| BQ343112 | ACSL3 | 222 | 266 | 2 | 223773788 | 223773832 | MKI67IP | 265 | 634 | 2 | 122488497 | 122493267 | |
| BM684664 | ACSL3 | 1 | 82 | 2 | 223807733 | 223807814 | ACSL3 | 78 | 613 | 2 | 223807994 | 223808529 | |
| Top |
| There's no copy number variation information in COSMIC data for this gene. |
| Top |
|
 |
| Top |
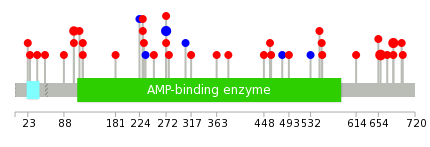
| Stat. for Non-Synonymous SNVs (# total SNVs=49) | (# total SNVs=8) |
 |  |
(# total SNVs=0) | (# total SNVs=0) |
| Top |
| * When you move the cursor on each content, you can see more deailed mutation information on the Tooltip. Those are primary_site,primary_histology,mutation(aa),pubmedID. |
| GRCh37 position | Mutation(aa) | Unique sampleID count |
| chr2:223782769-223782769 | p.T188S | 6 |
| chr2:223806250-223806250 | p.R681C | 5 |
| chr2:223799373-223799373 | p.V658A | 4 |
| chr2:223786008-223786008 | p.P272P | 3 |
| chr2:223783810-223783810 | p.R232Q | 3 |
| chr2:223781078-223781078 | p.V140V | 2 |
| chr2:223782762-223782762 | p.? | 2 |
| chr2:223786007-223786007 | p.P272L | 2 |
| chr2:223773807-223773807 | p.G106E | 2 |
| chr2:223773584-223773584 | p.L32I | 1 |
| Top |
|
 |
| Point Mutation/ Tissue ID | 1 | 2 | 3 | 4 | 5 | 6 | 7 | 8 | 9 | 10 | 11 | 12 | 13 | 14 | 15 | 16 | 17 | 18 | 19 | 20 |
| # sample | 1 | 16 | 1 | 1 | 1 | 3 | 2 | 2 | 4 | 6 | 8 | |||||||||
| # mutation | 1 | 12 | 1 | 1 | 1 | 3 | 2 | 2 | 4 | 6 | 9 | |||||||||
| nonsynonymous SNV | 1 | 9 | 1 | 1 | 1 | 3 | 2 | 2 | 3 | 5 | 8 | |||||||||
| synonymous SNV | 3 | 1 | 1 | 1 |
| cf) Tissue ID; Tissue type (1; BLCA[Bladder Urothelial Carcinoma], 2; BRCA[Breast invasive carcinoma], 3; CESC[Cervical squamous cell carcinoma and endocervical adenocarcinoma], 4; COAD[Colon adenocarcinoma], 5; GBM[Glioblastoma multiforme], 6; Glioma Low Grade, 7; HNSC[Head and Neck squamous cell carcinoma], 8; KICH[Kidney Chromophobe], 9; KIRC[Kidney renal clear cell carcinoma], 10; KIRP[Kidney renal papillary cell carcinoma], 11; LAML[Acute Myeloid Leukemia], 12; LUAD[Lung adenocarcinoma], 13; LUSC[Lung squamous cell carcinoma], 14; OV[Ovarian serous cystadenocarcinoma ], 15; PAAD[Pancreatic adenocarcinoma], 16; PRAD[Prostate adenocarcinoma], 17; SKCM[Skin Cutaneous Melanoma], 18:STAD[Stomach adenocarcinoma], 19:THCA[Thyroid carcinoma], 20:UCEC[Uterine Corpus Endometrial Carcinoma]) |
| Top |
| * We represented just top 10 SNVs. When you move the cursor on each content, you can see more deailed mutation information on the Tooltip. Those are primary_site, primary_histology, mutation(aa), pubmedID. |
| Genomic Position | Mutation(aa) | Unique sampleID count |
| chr2:223799373 | p.V658A,ACSL3 | 4 |
| chr2:223806250 | p.R681C,ACSL3 | 3 |
| chr2:223773807 | p.G106E,ACSL3 | 3 |
| chr2:223786008 | p.P272P,ACSL3 | 3 |
| chr2:223786007 | p.P272L,ACSL3 | 2 |
| chr2:223773608 | p.P40S,ACSL3 | 1 |
| chr2:223783810 | p.L277S,ACSL3 | 1 |
| chr2:223791818 | p.R54Q,ACSL3 | 1 |
| chr2:223773651 | p.G307G,ACSL3 | 1 |
| chr2:223806218 | p.S670N,ACSL3 | 1 |
| * Copy number data were extracted from TCGA using R package TCGA-Assembler. The URLs of all public data files on TCGA DCC data server were gathered on Jan-05-2015. Function ProcessCNAData in TCGA-Assembler package was used to obtain gene-level copy number value which is calculated as the average copy number of the genomic region of a gene. |
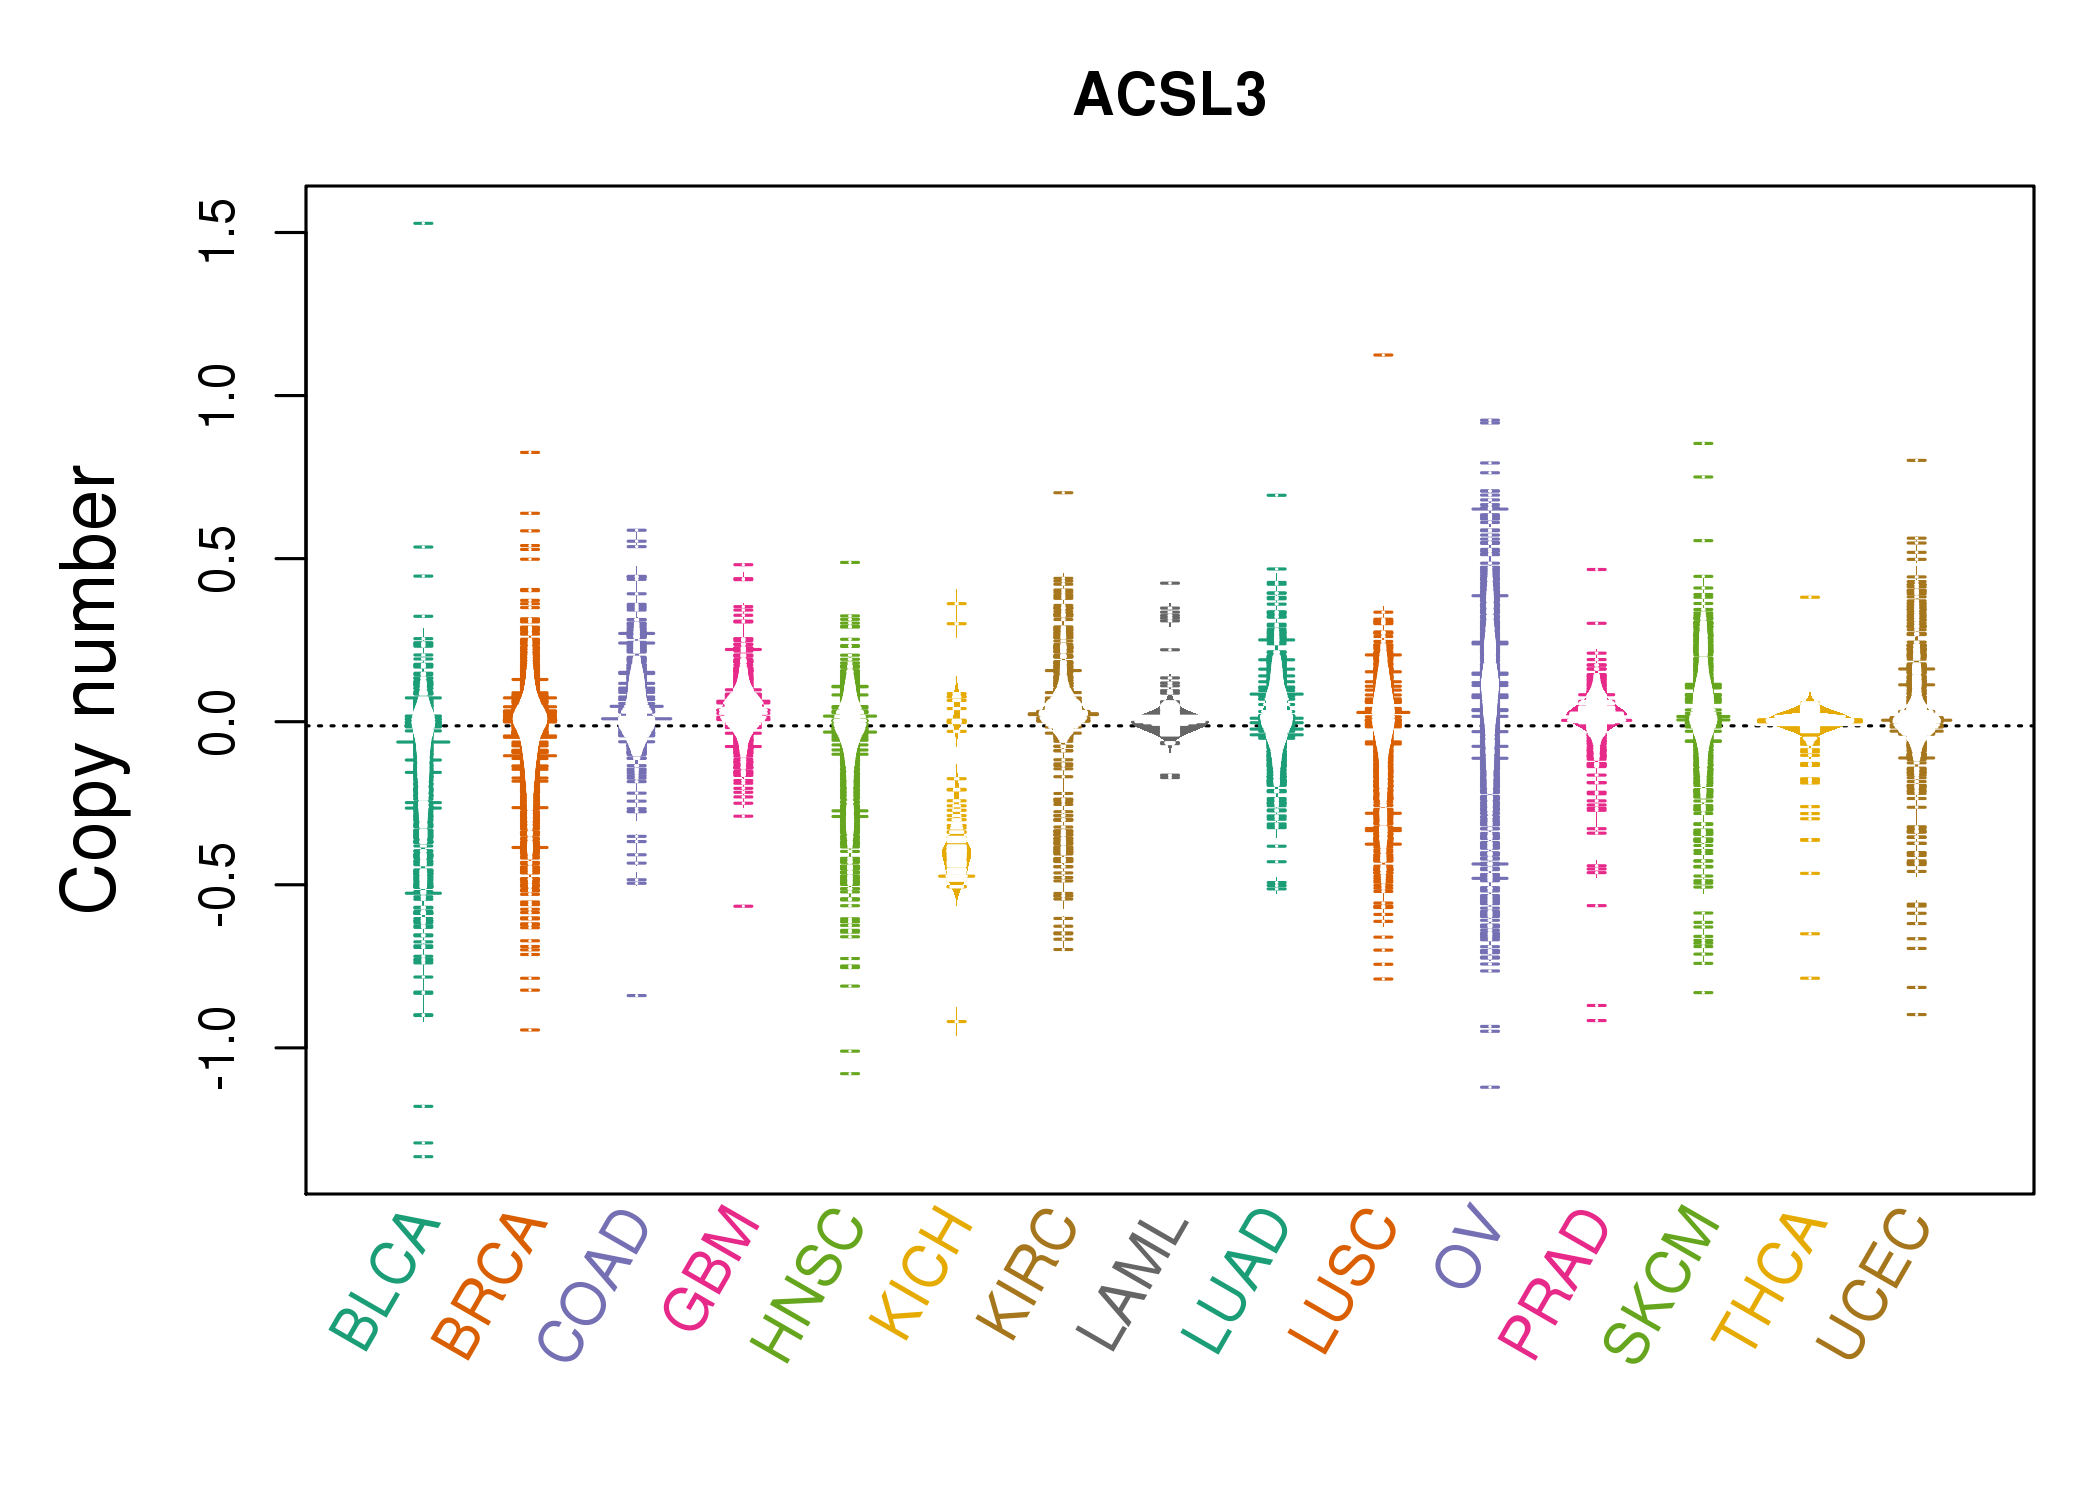 |
| cf) Tissue ID[Tissue type]: BLCA[Bladder Urothelial Carcinoma], BRCA[Breast invasive carcinoma], CESC[Cervical squamous cell carcinoma and endocervical adenocarcinoma], COAD[Colon adenocarcinoma], GBM[Glioblastoma multiforme], Glioma Low Grade, HNSC[Head and Neck squamous cell carcinoma], KICH[Kidney Chromophobe], KIRC[Kidney renal clear cell carcinoma], KIRP[Kidney renal papillary cell carcinoma], LAML[Acute Myeloid Leukemia], LUAD[Lung adenocarcinoma], LUSC[Lung squamous cell carcinoma], OV[Ovarian serous cystadenocarcinoma ], PAAD[Pancreatic adenocarcinoma], PRAD[Prostate adenocarcinoma], SKCM[Skin Cutaneous Melanoma], STAD[Stomach adenocarcinoma], THCA[Thyroid carcinoma], UCEC[Uterine Corpus Endometrial Carcinoma] |
| Top |
| Gene Expression for ACSL3 |
| * CCLE gene expression data were extracted from CCLE_Expression_Entrez_2012-10-18.res: Gene-centric RMA-normalized mRNA expression data. |
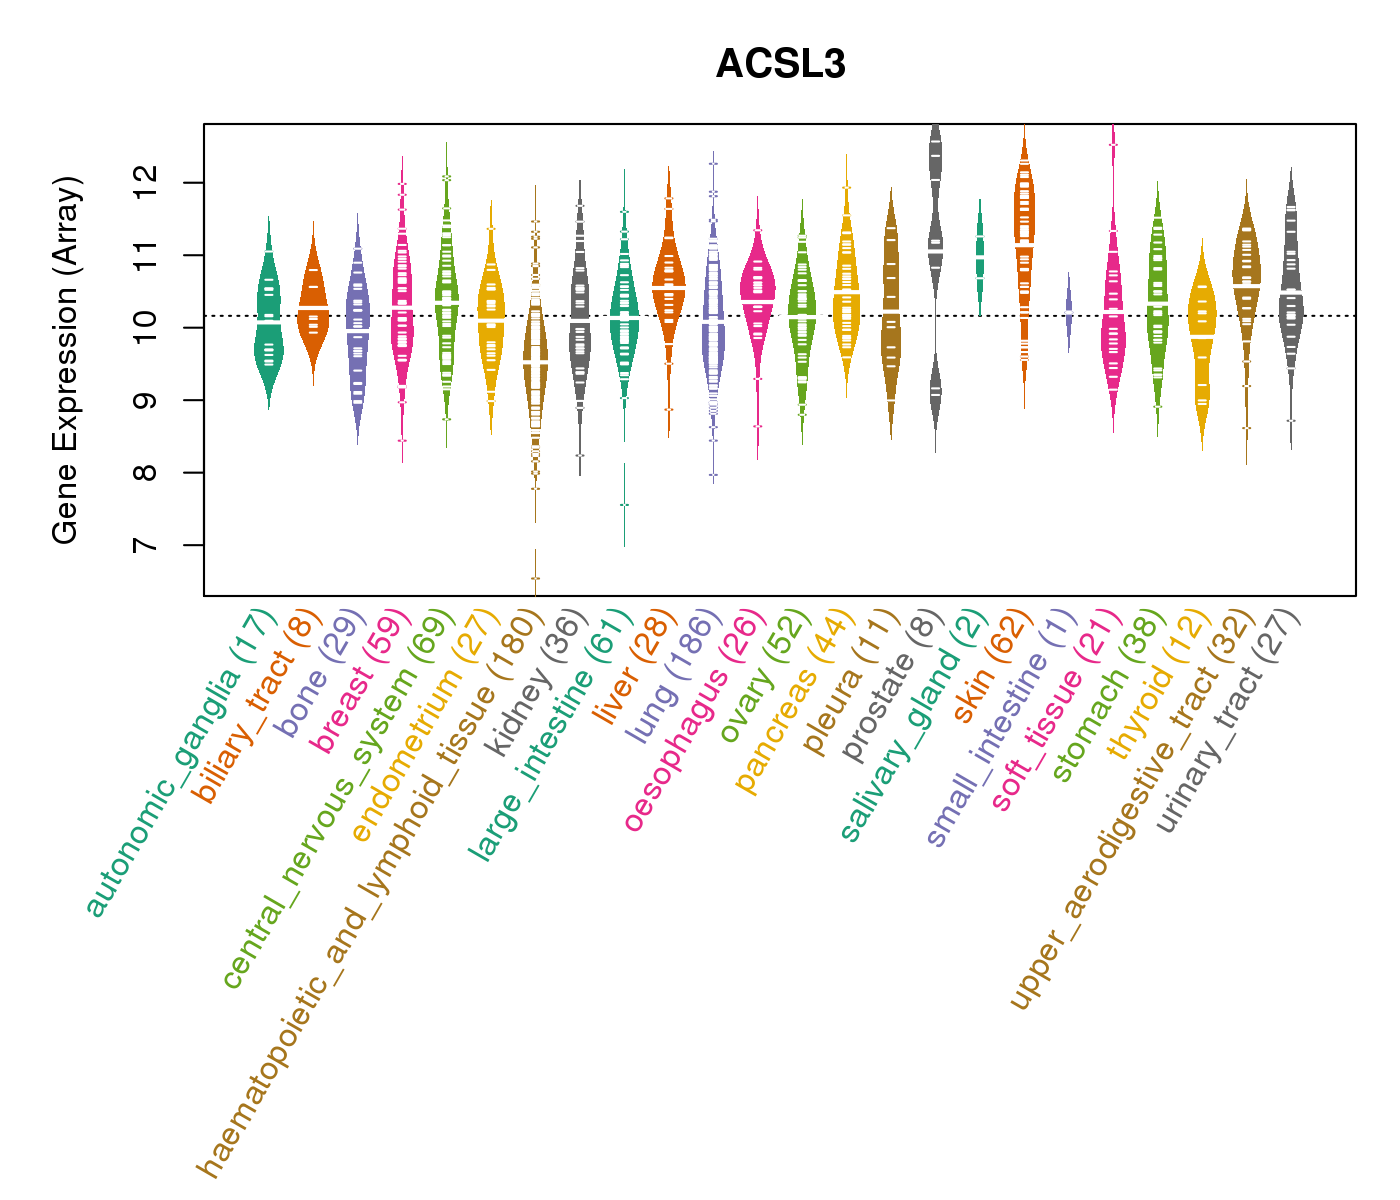 |
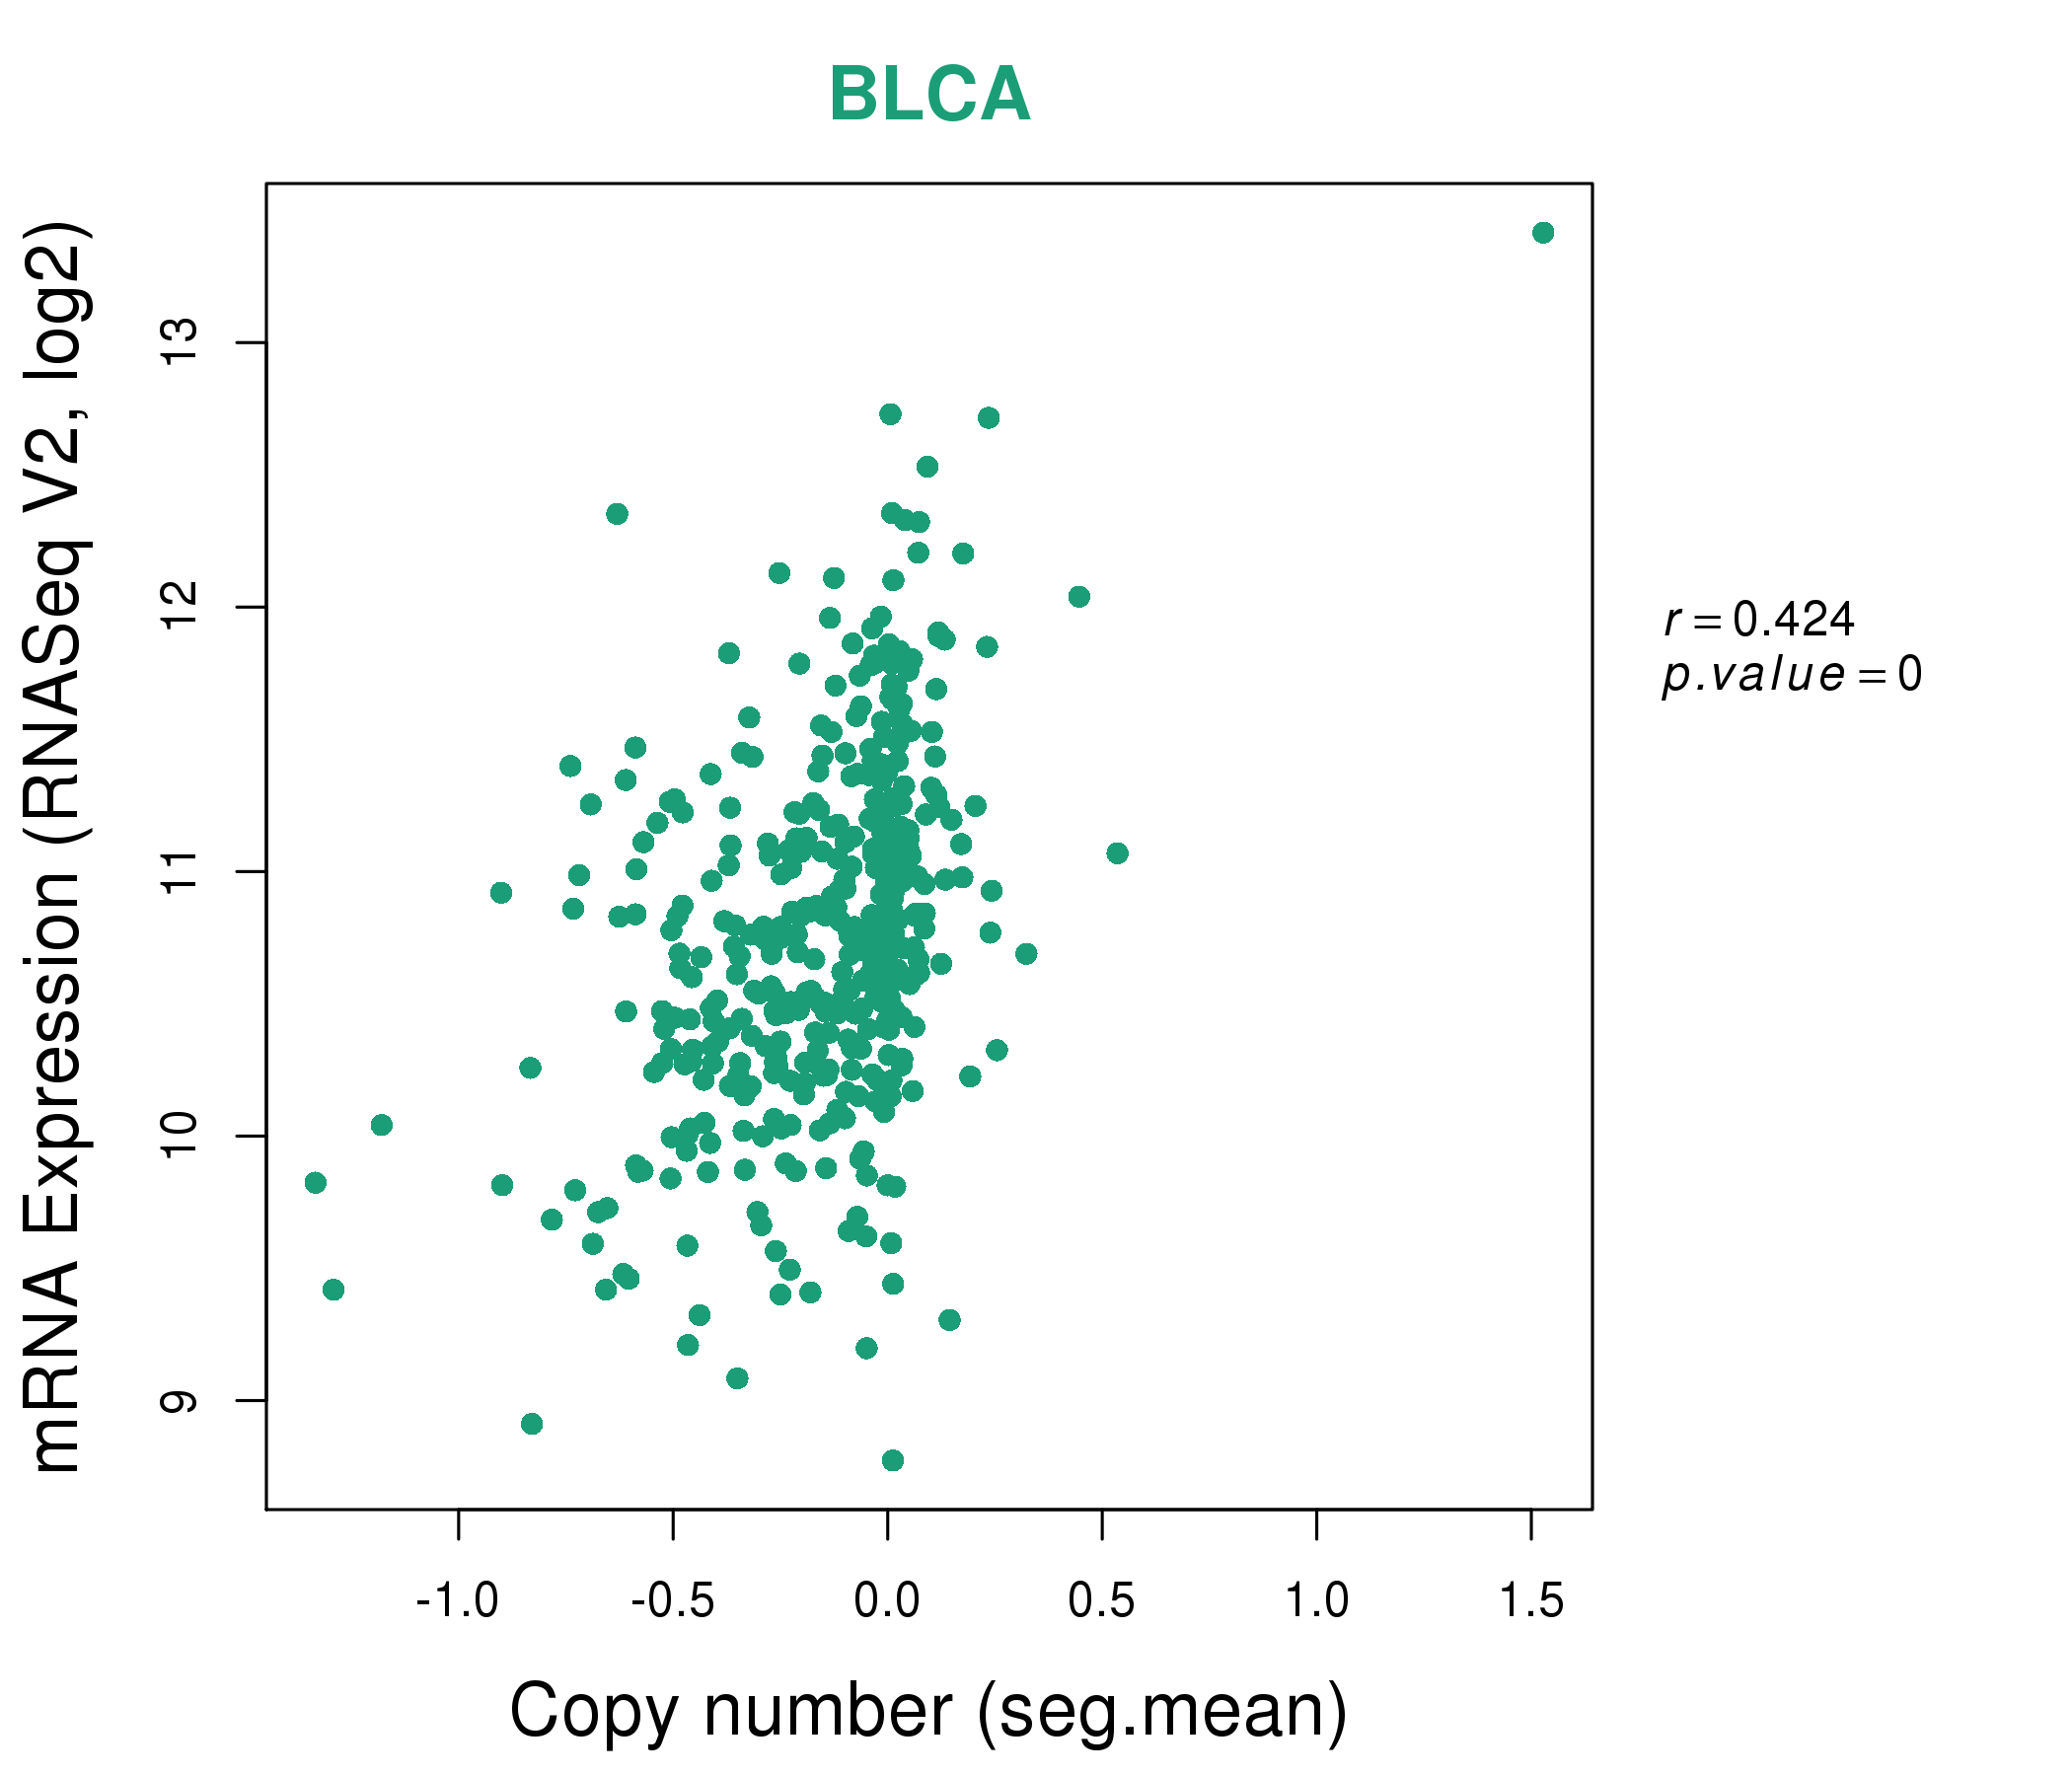
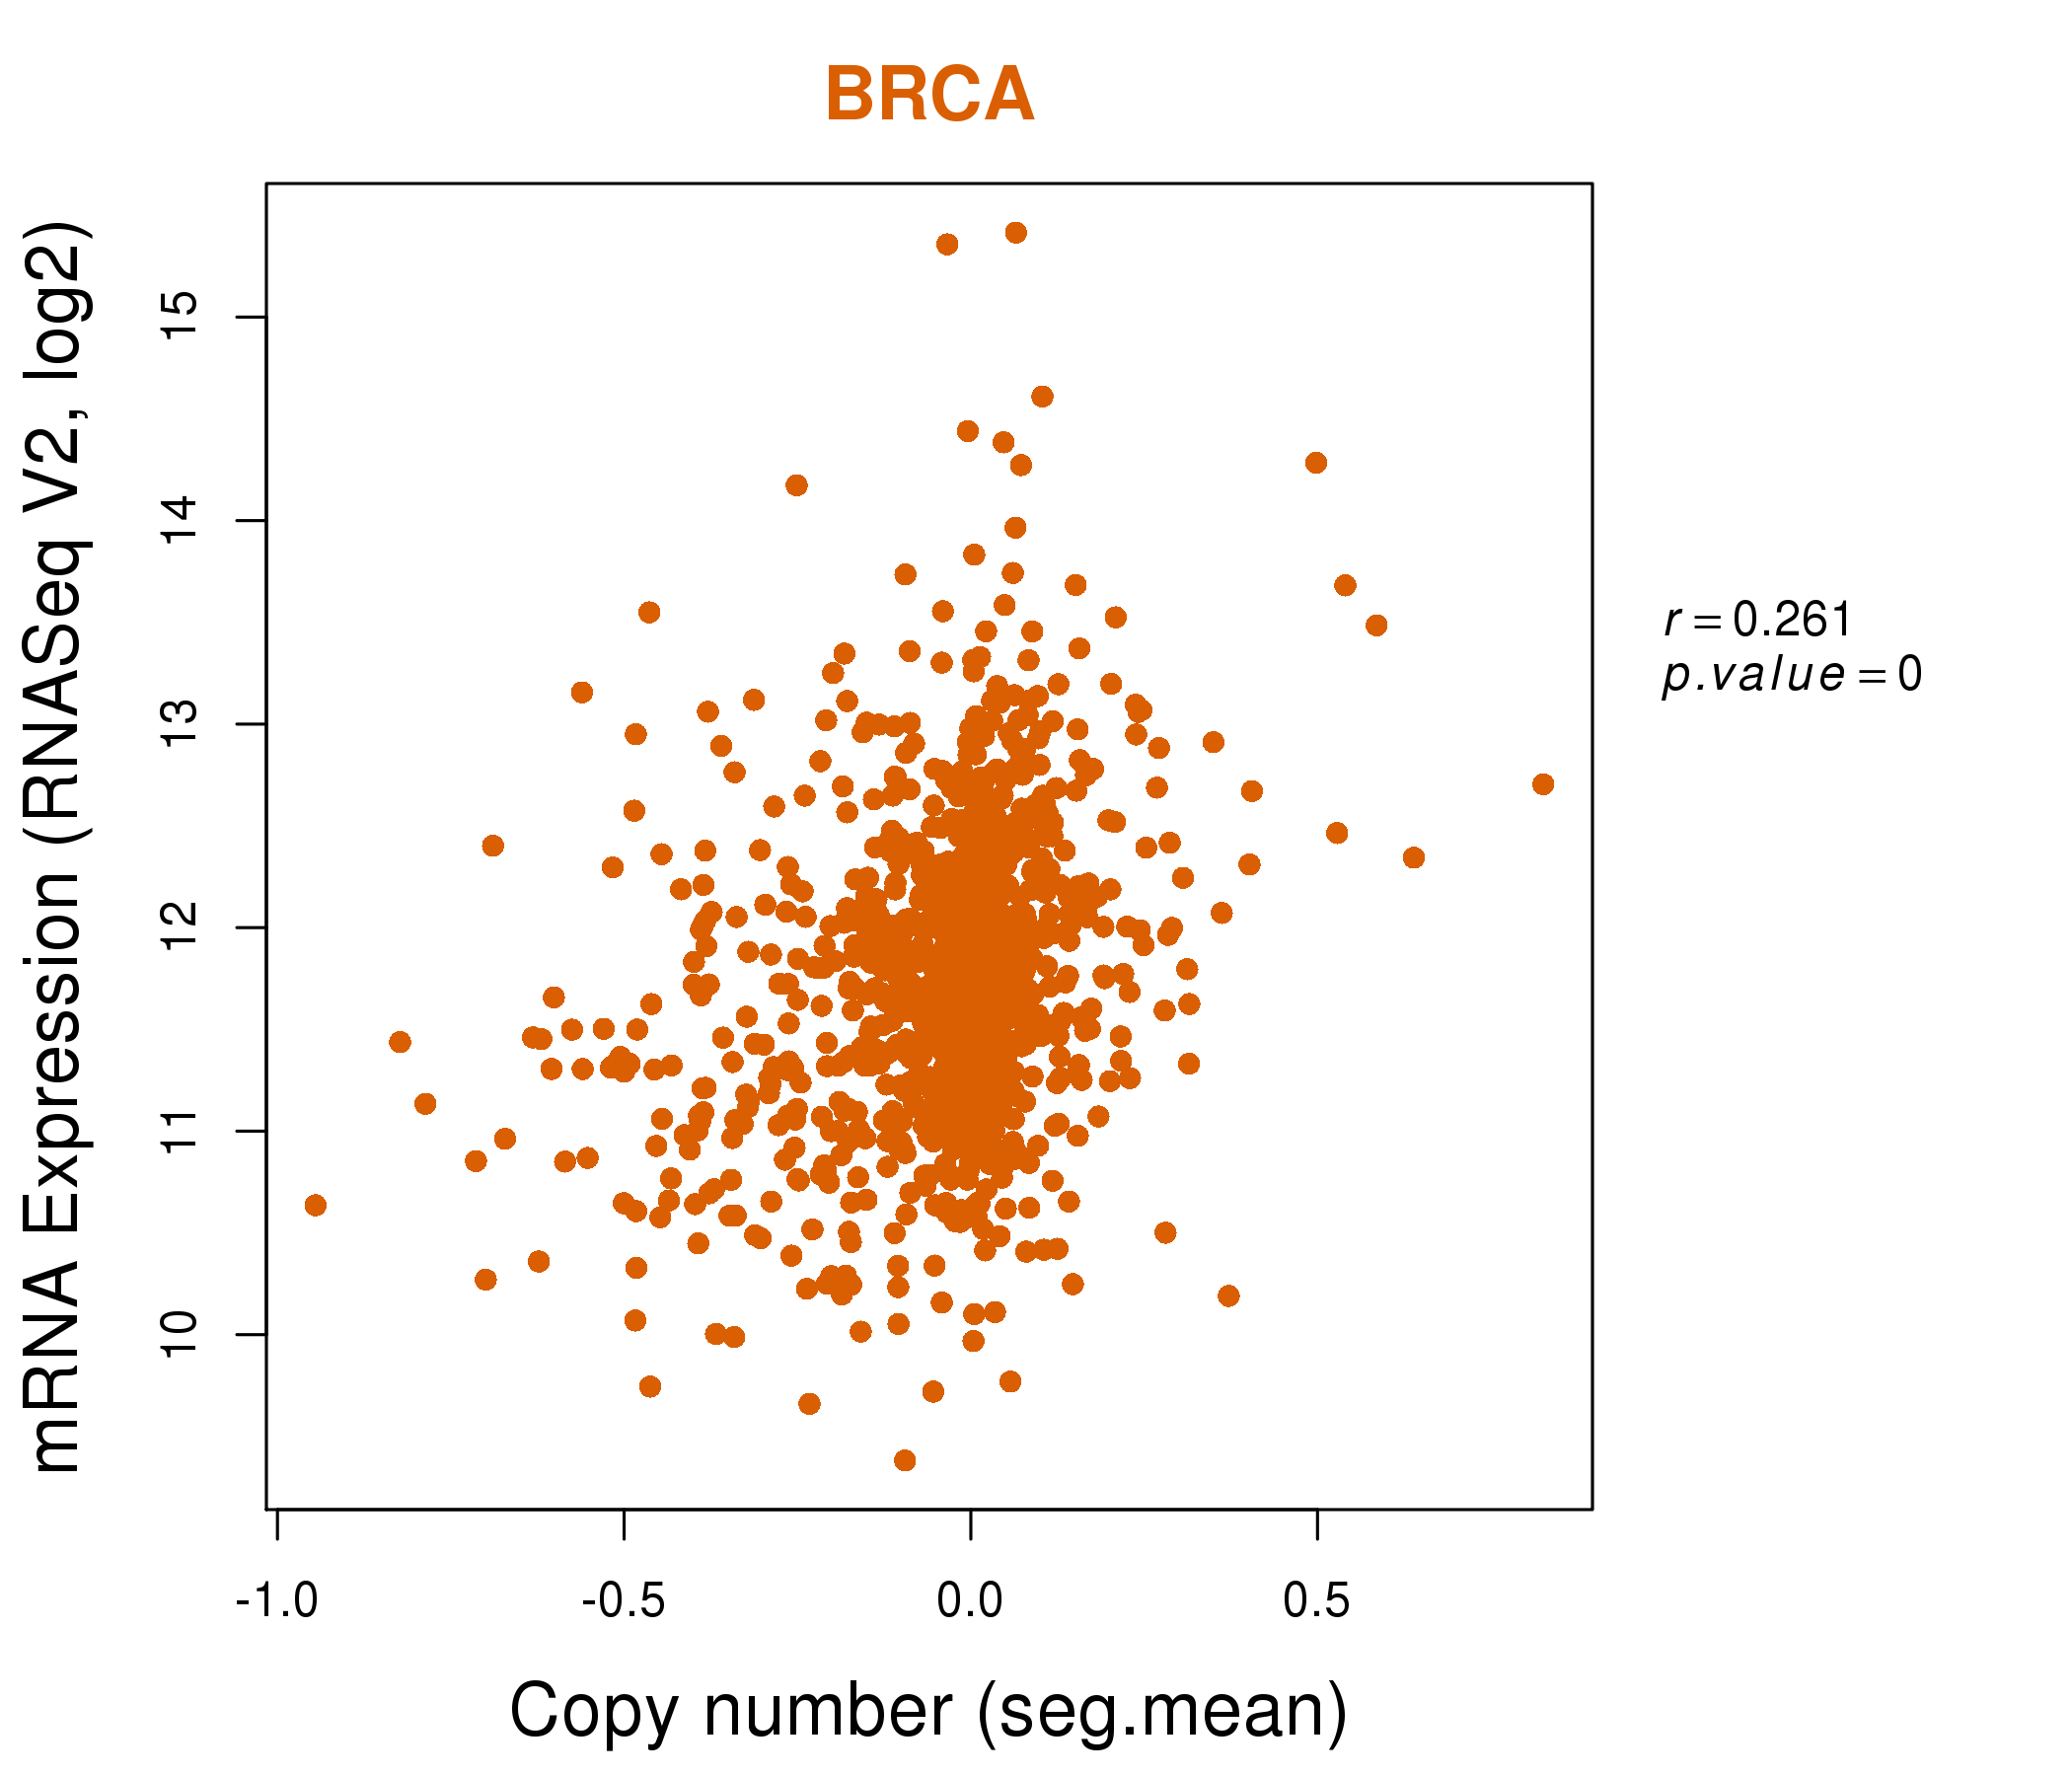
| * Normalized gene expression data of RNASeqV2 was extracted from TCGA using R package TCGA-Assembler. The URLs of all public data files on TCGA DCC data server were gathered at Jan-05-2015. Only eight cancer types have enough normal control samples for differential expression analysis. (t test, adjusted p<0.05 (using Benjamini-Hochberg FDR)) |
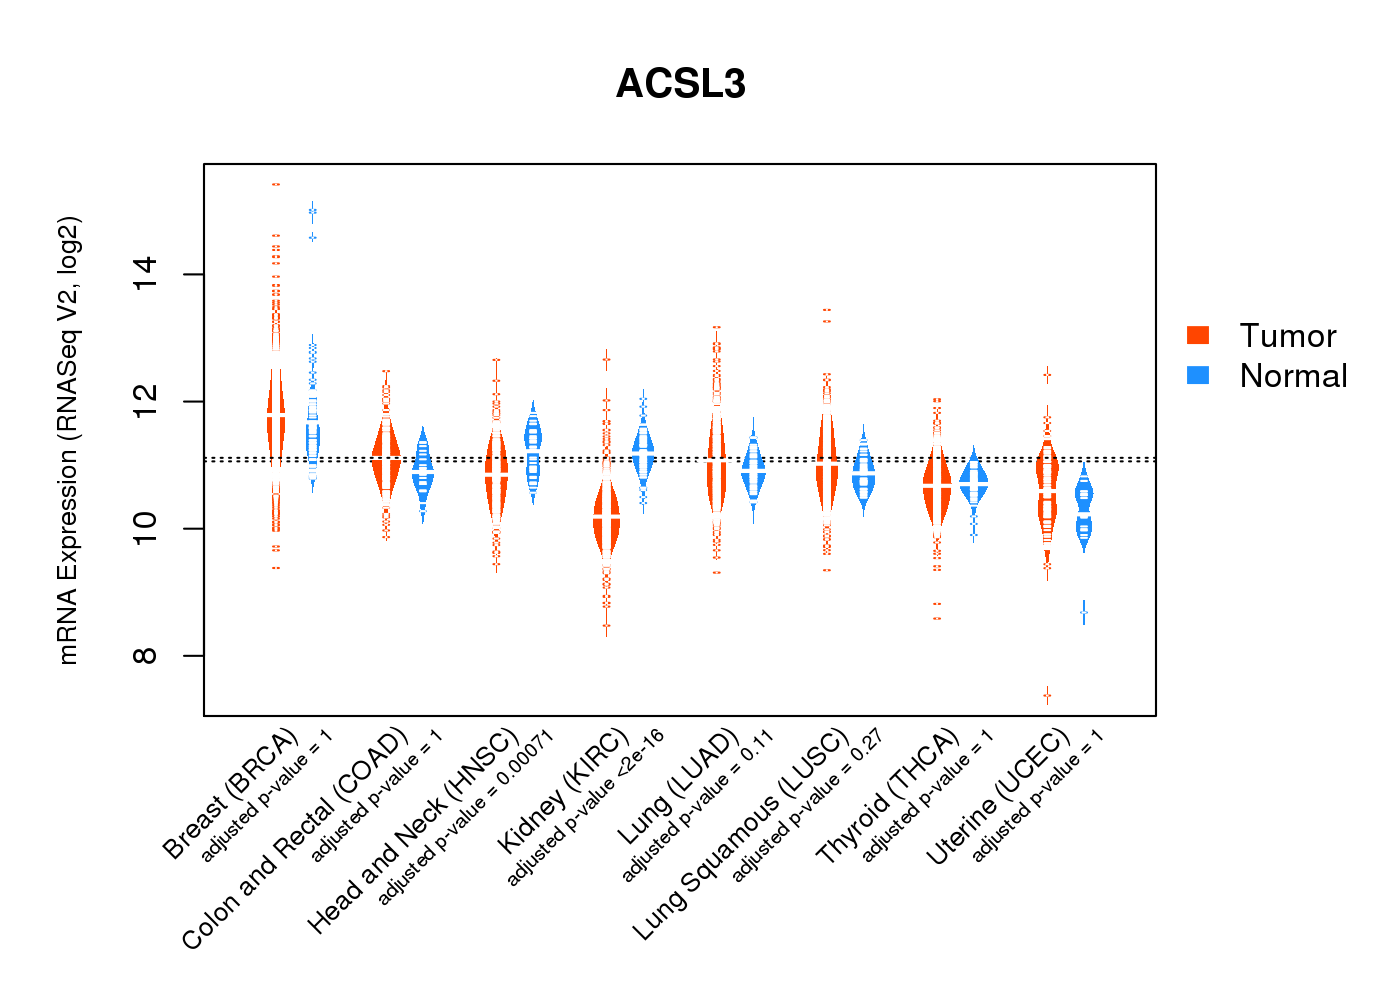 |
| Top |
| * This plots show the correlation between CNV and gene expression. |
: Open all plots for all cancer types
 |
|
 |
|

| Top |
| Gene-Gene Network Information |
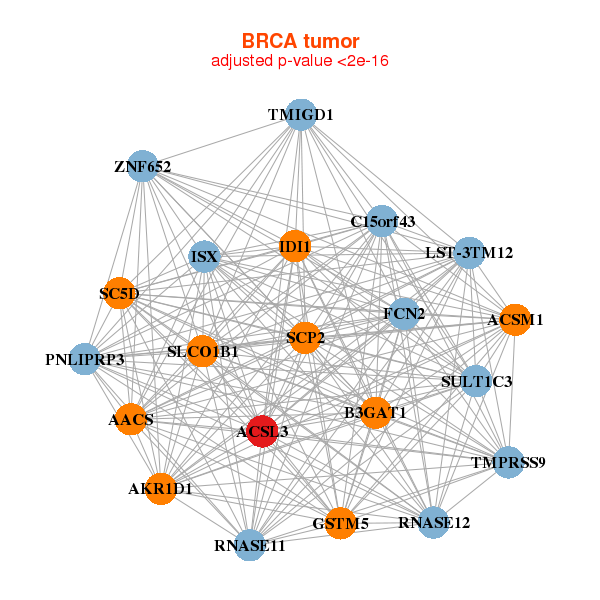
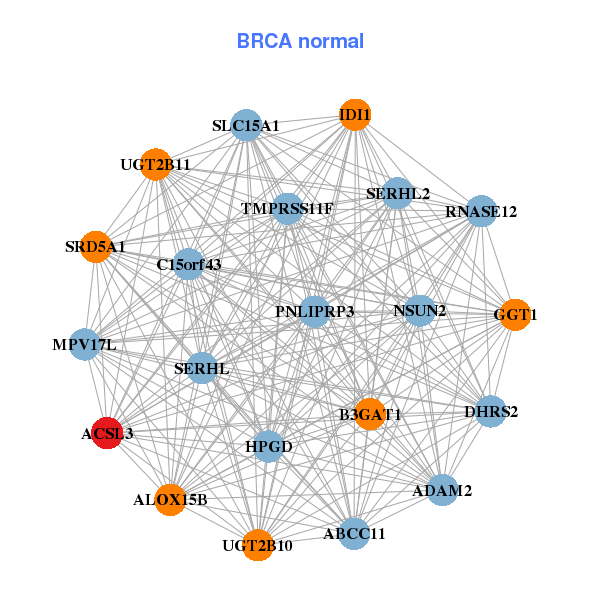
| * Co-Expression network figures were drawn using R package igraph. Only the top 20 genes with the highest correlations were shown. Red circle: input gene, orange circle: cell metabolism gene, sky circle: other gene |
: Open all plots for all cancer types
 |
| ||||
| AACS,ACSL3,ACSM1,AKR1D1,B3GAT1,C15orf43,FCN2, GSTM5,IDI1,ISX,LST-3TM12,PNLIPRP3,RNASE11,RNASE12, SC5D,SCP2,SLCO1B1,SULT1C3,TMIGD1,TMPRSS9,ZNF652 | ABCC11,ACSL3,ADAM2,ALOX15B,B3GAT1,C15orf43,DHRS2, GGT1,HPGD,IDI1,MPV17L,NSUN2,PNLIPRP3,RNASE12, SERHL2,SERHL,SLC15A1,SRD5A1,TMPRSS11F,UGT2B10,UGT2B11 | ||||
 |
| ||||
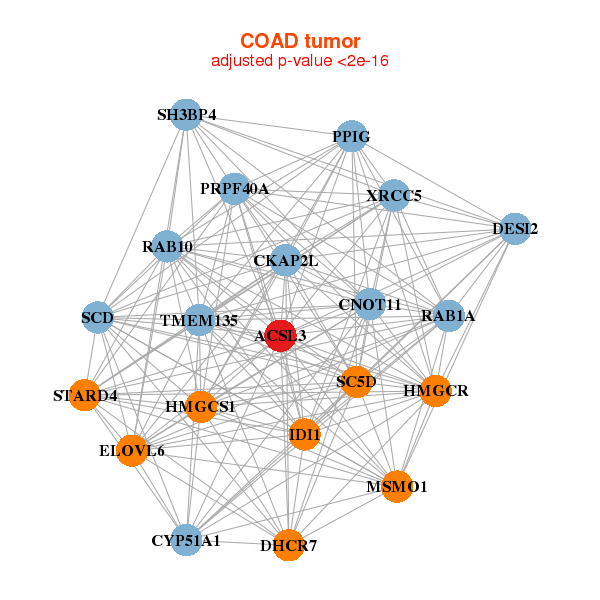
| ACSL3,CNOT11,CKAP2L,CYP51A1,DHCR7,ELOVL6,HMGCR, HMGCS1,IDI1,PPIG,DESI2,PRPF40A,RAB10,RAB1A, MSMO1,SC5D,SCD,SH3BP4,STARD4,TMEM135,XRCC5 | ACBD3,ACSL3,AP2B1,ASCC3,ATR,CKAP4,CYP51A1, DHCR7,DNAJC10,EMP2,FGFBP1,GSPT1,HNRNPR,HSP90B1, KPNB1,LARP4,PDE11A,RDH11,SQLE,STT3A,UGGT1 |
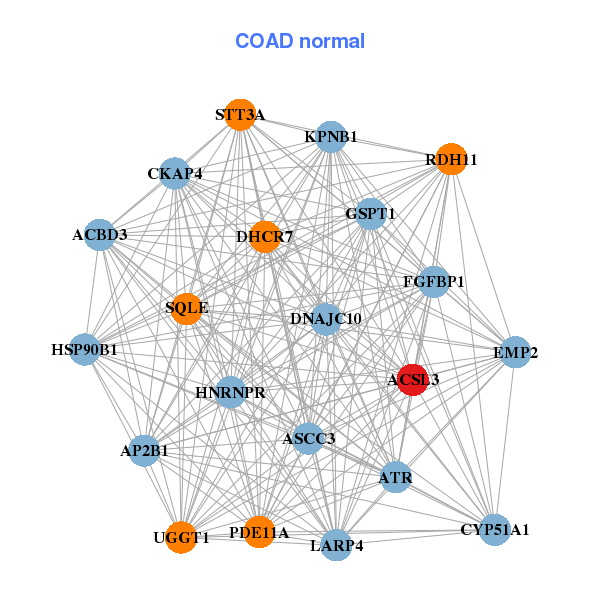
| * Co-Expression network figures were drawn using R package igraph. Only the top 20 genes with the highest correlations were shown. Red circle: input gene, orange circle: cell metabolism gene, sky circle: other gene |
: Open all plots for all cancer types
| Top |
: Open all interacting genes' information including KEGG pathway for all interacting genes from DAVID
| Top |
| Pharmacological Information for ACSL3 |
| DB Category | DB Name | DB's ID and Url link |
| Organism-specific databases | PharmGKB | PA27967; -. |
| Organism-specific databases | CTD | 2181; -. |
| * Gene Centered Interaction Network. |
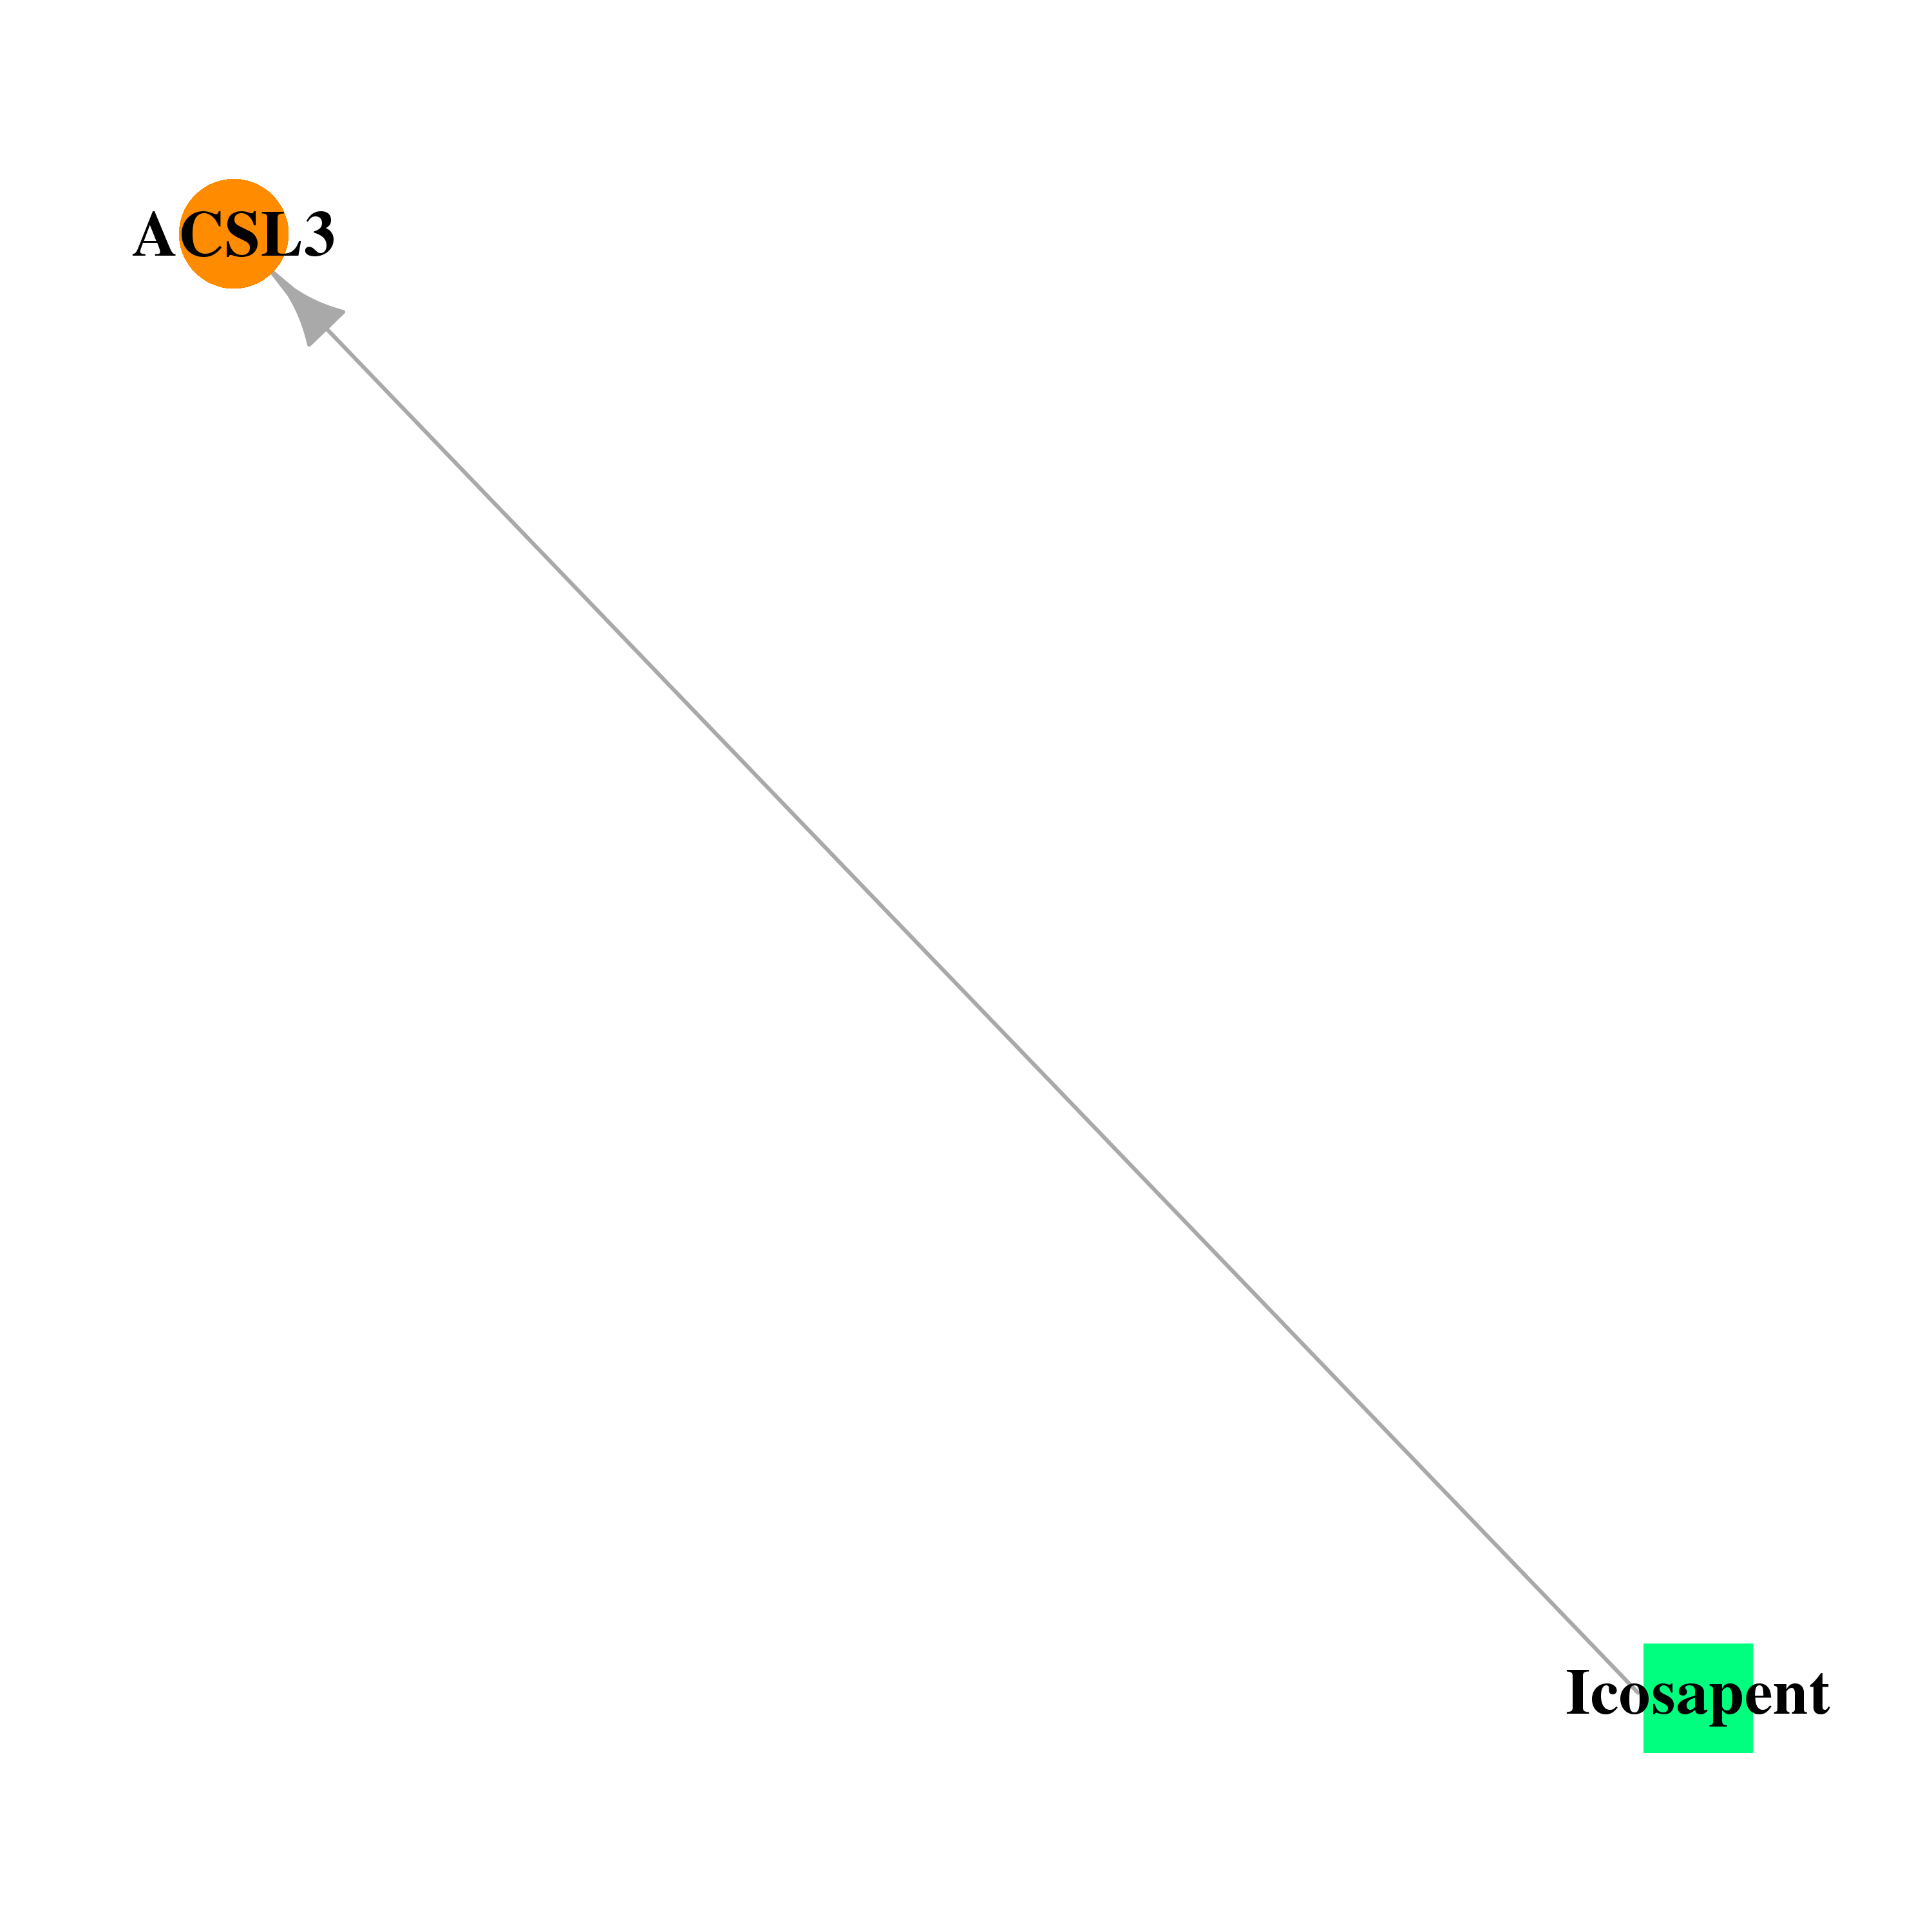 |
| * Drug Centered Interaction Network. |
| DrugBank ID | Target Name | Drug Groups | Generic Name | Drug Centered Network | Drug Structure |
| DB00159 | acyl-CoA synthetase long-chain family member 3 | approved; nutraceutical | Icosapent | 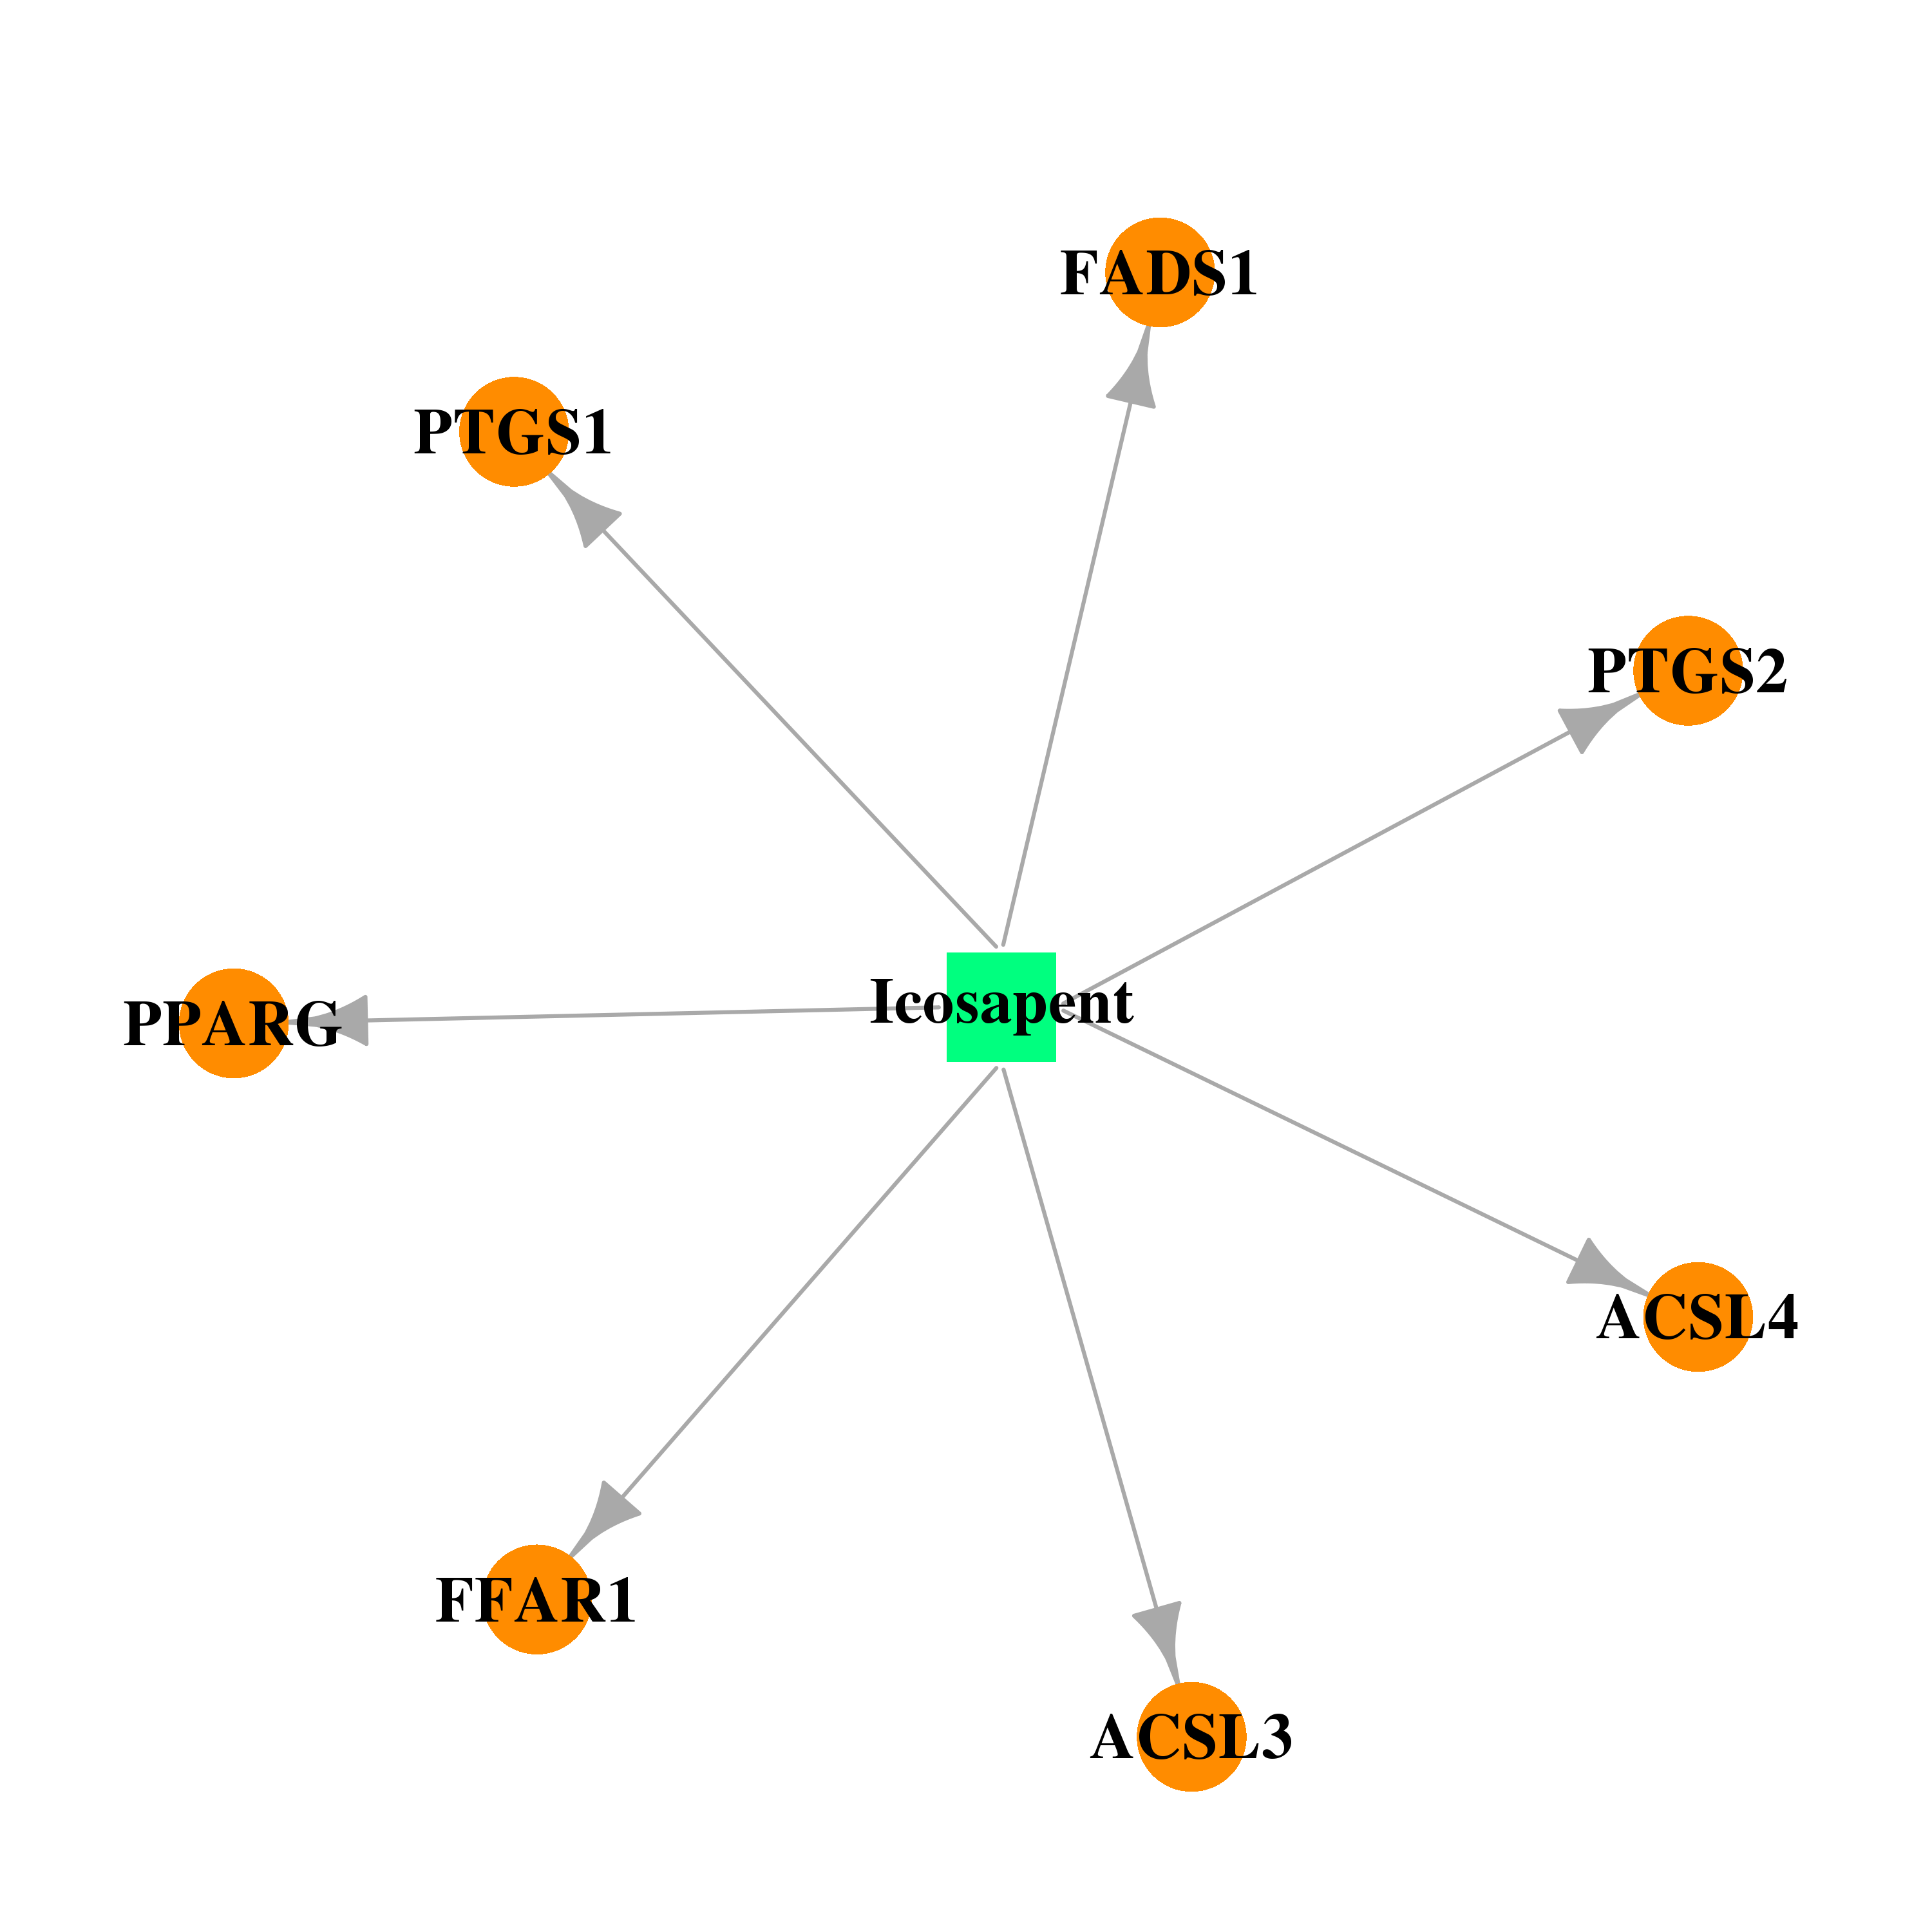 | 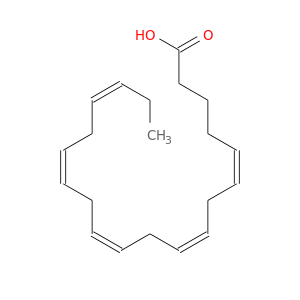 |
| Top |
| Cross referenced IDs for ACSL3 |
| * We obtained these cross-references from Uniprot database. It covers 150 different DBs, 18 categories. http://www.uniprot.org/help/cross_references_section |
: Open all cross reference information
|
Copyright © 2016-Present - The Univsersity of Texas Health Science Center at Houston @ |