|
||||||||||||||||||||
| |
| Phenotypic Information (metabolism pathway, cancer, disease, phenome) |
| |
| |
| Gene-Gene Network Information: Co-Expression Network, Interacting Genes & KEGG |
| |
|


| Gene Summary for FASN |
| Basic gene info. | Gene symbol | FASN |
| Gene name | fatty acid synthase | |
| Synonyms | FAS|OA-519|SDR27X1 | |
| Cytomap | UCSC genome browser: 17q25 | |
| Genomic location | chr17 :80036213-80056106 | |
| Type of gene | protein-coding | |
| RefGenes | NM_004104.4, | |
| Ensembl id | ENSG00000169710 | |
| Description | short chain dehydrogenase/reductase family 27X, member 1 | |
| Modification date | 20141207 | |
| dbXrefs | MIM : 600212 | |
| HGNC : HGNC | ||
| Ensembl : ENSG00000169710 | ||
| HPRD : 02567 | ||
| Vega : OTTHUMG00000178527 | ||
| Protein | UniProt: P49327 go to UniProt's Cross Reference DB Table | |
| Expression | CleanEX: HS_FASN | |
| BioGPS: 2194 | ||
| Gene Expression Atlas: ENSG00000169710 | ||
| The Human Protein Atlas: ENSG00000169710 | ||
| Pathway | NCI Pathway Interaction Database: FASN | |
| KEGG: FASN | ||
| REACTOME: FASN | ||
| ConsensusPathDB | ||
| Pathway Commons: FASN | ||
| Metabolism | MetaCyc: FASN | |
| HUMANCyc: FASN | ||
| Regulation | Ensembl's Regulation: ENSG00000169710 | |
| miRBase: chr17 :80,036,213-80,056,106 | ||
| TargetScan: NM_004104 | ||
| cisRED: ENSG00000169710 | ||
| Context | iHOP: FASN | |
| cancer metabolism search in PubMed: FASN | ||
| UCL Cancer Institute: FASN | ||
| Assigned class in ccmGDB | A - This gene has a literature evidence and it belongs to cancer gene. | |
| References showing role of FASN in cancer cell metabolism | 1. Chang L, Wu P, Senthilkumar R, Tian X, Liu H, et al. (2015) Loss of fatty acid synthase suppresses the malignant phenotype of colorectal cancer cells by down-regulating energy metabolism and mTOR signaling pathway. J Cancer Res Clin Oncol. doi: 10.1007/s00432-015-2000-8. go to article 2. Patel AV, Johansson G, Colbert MC, Dasgupta B, Ratner N (2015) Fatty acid synthase is a metabolic oncogene targetable in malignant peripheral nerve sheath tumors. Neuro Oncol. doi: 10.1093/neuonc/nov076. go to article 3. Benjamin DI, Li DS, Lowe W, Heuer T, Kemble G, et al. (2015) Diacylglycerol Metabolism and Signaling Is a Driving Force Underlying FASN Inhibitor Sensitivity in Cancer Cells. ACS Chem Biol 10: 1616-1623. doi: 10.1021/acschembio.5b00240. go to article 4. Lee YJ, Choi HS, Seo MJ, Jeon HJ, Kim KJ, et al. (2015) Kaempferol suppresses lipid accumulation by inhibiting early adipogenesis in 3T3-L1 cells and zebrafish. Food Funct. doi: 10.1039/c5fo00481k. go to article 5. Loubiere C, Goiran T, Laurent K, Djabari Z, Tanti JF, et al. (2015) Metformin-induced energy deficiency leads to the inhibition of lipogenesis in prostate cancer cells. Oncotarget 6: 15652-15661. go to article | |
| Top |
| Phenotypic Information for FASN(metabolism pathway, cancer, disease, phenome) |
| Cancer | CGAP: FASN |
| Familial Cancer Database: FASN | |
| * This gene is included in those cancer gene databases. |
|
|
|
|
|
|
| ||||||||||||||
Oncogene 1 | Significant driver gene in | |||||||||||||||||||
| cf) number; DB name 1 Oncogene; http://nar.oxfordjournals.org/content/35/suppl_1/D721.long, 2 Tumor Suppressor gene; https://bioinfo.uth.edu/TSGene/, 3 Cancer Gene Census; http://www.nature.com/nrc/journal/v4/n3/abs/nrc1299.html, 4 CancerGenes; http://nar.oxfordjournals.org/content/35/suppl_1/D721.long, 5 Network of Cancer Gene; http://ncg.kcl.ac.uk/index.php, 1Therapeutic Vulnerabilities in Cancer; http://cbio.mskcc.org/cancergenomics/statius/ |
| REACTOME_METABOLISM_OF_VITAMINS_AND_COFACTORS REACTOME_INTEGRATION_OF_ENERGY_METABOLISM REACTOME_METABOLISM_OF_LIPIDS_AND_LIPOPROTEINS | |
| OMIM | 600212; gene. 600212; gene. |
| Orphanet | |
| Disease | KEGG Disease: FASN |
| MedGen: FASN (Human Medical Genetics with Condition) | |
| ClinVar: FASN | |
| Phenotype | MGI: FASN (International Mouse Phenotyping Consortium) |
| PhenomicDB: FASN | |
| Mutations for FASN |
| * Under tables are showing count per each tissue to give us broad intuition about tissue specific mutation patterns.You can go to the detailed page for each mutation database's web site. |
| - Statistics for Tissue and Mutation type | Top |
 |
| - For Inter-chromosomal Variations |
| There's no inter-chromosomal structural variation. |
| - For Intra-chromosomal Variations |
| There's no intra-chromosomal structural variation. |
| Sample | Symbol_a | Chr_a | Start_a | End_a | Symbol_b | Chr_b | Start_b | End_b |
| cf) Tissue number; Tissue name (1;Breast, 2;Central_nervous_system, 3;Haematopoietic_and_lymphoid_tissue, 4;Large_intestine, 5;Liver, 6;Lung, 7;Ovary, 8;Pancreas, 9;Prostate, 10;Skin, 11;Soft_tissue, 12;Upper_aerodigestive_tract) |
| * From mRNA Sanger sequences, Chitars2.0 arranged chimeric transcripts. This table shows FASN related fusion information. |
| ID | Head Gene | Tail Gene | Accession | Gene_a | qStart_a | qEnd_a | Chromosome_a | tStart_a | tEnd_a | Gene_a | qStart_a | qEnd_a | Chromosome_a | tStart_a | tEnd_a |
| BG982750 | C19orf6 | 5 | 290 | 19 | 1011617 | 1012147 | FASN | 280 | 416 | 17 | 80046844 | 80046980 | |
| BE818191 | FASN | 16 | 164 | 17 | 80050813 | 80051160 | LAMB1 | 155 | 309 | 7 | 107601021 | 107601731 | |
| BM710952 | HTT | 5 | 177 | 4 | 3243627 | 3243805 | FASN | 161 | 287 | 17 | 80036843 | 80036969 | |
| AF155114 | FBXO9 | 1 | 1719 | 6 | 52930247 | 52962684 | FASN | 1715 | 2716 | 17 | 80036214 | 80037572 | |
| AF172068 | FASN | 1 | 352 | 17 | 80046335 | 80046976 | ESR1 | 341 | 1218 | 6 | 152265458 | 152420101 | |
| AI970549 | LOC100507424 | 3 | 73 | 12 | 2966846 | 2966916 | FASN | 71 | 749 | 17 | 80040912 | 80042485 | |
| AF172069 | FASN | 1 | 352 | 17 | 80046335 | 80046976 | ESR1 | 341 | 1218 | 6 | 152265458 | 152420101 | |
| BE818234 | FASN | 4 | 152 | 17 | 80050813 | 80051160 | LAMB1 | 143 | 297 | 7 | 107601021 | 107601731 | |
| BG982743 | C19orf6 | 31 | 310 | 19 | 1011625 | 1012147 | FASN | 300 | 436 | 17 | 80046844 | 80046980 | |
| Top |
| There's no copy number variation information in COSMIC data for this gene. |
| Top |
|
 |
| Top |
| Stat. for Non-Synonymous SNVs (# total SNVs=121) | (# total SNVs=66) |
 |  |
(# total SNVs=6) | (# total SNVs=2) |
 |  |
| Top |
| * When you move the cursor on each content, you can see more deailed mutation information on the Tooltip. Those are primary_site,primary_histology,mutation(aa),pubmedID. |
| GRCh37 position | Mutation(aa) | Unique sampleID count |
| chr17:80040808-80040808 | p.R1917C | 4 |
| chr17:80039692-80039692 | p.G2064fs*10 | 2 |
| chr17:80049433-80049433 | p.G386V | 2 |
| chr17:80041705-80041705 | p.A1721T | 2 |
| chr17:80046702-80046702 | p.M785I | 2 |
| chr17:80045689-80045689 | p.P972L | 2 |
| chr17:80040837-80040837 | p.R1907H | 2 |
| chr17:80049217-80049217 | p.A458V | 2 |
| chr17:80040405-80040405 | p.V1973L | 2 |
| chr17:80047180-80047180 | p.F682L | 2 |
| Top |
|
 |
| Point Mutation/ Tissue ID | 1 | 2 | 3 | 4 | 5 | 6 | 7 | 8 | 9 | 10 | 11 | 12 | 13 | 14 | 15 | 16 | 17 | 18 | 19 | 20 |
| # sample | 2 | 8 | 2 | 17 | 1 | 6 | 4 | 4 | 12 | 7 | 1 | 1 | 1 | 17 | 15 | 1 | 14 | |||
| # mutation | 2 | 8 | 2 | 18 | 1 | 7 | 4 | 4 | 12 | 7 | 1 | 1 | 1 | 21 | 18 | 1 | 22 | |||
| nonsynonymous SNV | 2 | 5 | 2 | 14 | 4 | 3 | 3 | 10 | 2 | 1 | 1 | 1 | 12 | 10 | 1 | 11 | ||||
| synonymous SNV | 3 | 4 | 1 | 3 | 1 | 1 | 2 | 5 | 9 | 8 | 11 |
| cf) Tissue ID; Tissue type (1; BLCA[Bladder Urothelial Carcinoma], 2; BRCA[Breast invasive carcinoma], 3; CESC[Cervical squamous cell carcinoma and endocervical adenocarcinoma], 4; COAD[Colon adenocarcinoma], 5; GBM[Glioblastoma multiforme], 6; Glioma Low Grade, 7; HNSC[Head and Neck squamous cell carcinoma], 8; KICH[Kidney Chromophobe], 9; KIRC[Kidney renal clear cell carcinoma], 10; KIRP[Kidney renal papillary cell carcinoma], 11; LAML[Acute Myeloid Leukemia], 12; LUAD[Lung adenocarcinoma], 13; LUSC[Lung squamous cell carcinoma], 14; OV[Ovarian serous cystadenocarcinoma ], 15; PAAD[Pancreatic adenocarcinoma], 16; PRAD[Prostate adenocarcinoma], 17; SKCM[Skin Cutaneous Melanoma], 18:STAD[Stomach adenocarcinoma], 19:THCA[Thyroid carcinoma], 20:UCEC[Uterine Corpus Endometrial Carcinoma]) |
| Top |
| * We represented just top 10 SNVs. When you move the cursor on each content, you can see more deailed mutation information on the Tooltip. Those are primary_site, primary_histology, mutation(aa), pubmedID. |
| Genomic Position | Mutation(aa) | Unique sampleID count |
| chr17:80046702 | p.M785I | 2 |
| chr17:80049217 | p.A458V | 2 |
| chr17:80045689 | p.P972L | 2 |
| chr17:80049304 | p.R429H | 2 |
| chr17:80048890 | p.N1191N | 1 |
| chr17:80038074 | p.R942H | 1 |
| chr17:80041413 | p.A2460V | 1 |
| chr17:80044956 | p.P742H | 1 |
| chr17:80045900 | p.A2194E | 1 |
| chr17:80049393 | p.R425R | 1 |
| * Copy number data were extracted from TCGA using R package TCGA-Assembler. The URLs of all public data files on TCGA DCC data server were gathered on Jan-05-2015. Function ProcessCNAData in TCGA-Assembler package was used to obtain gene-level copy number value which is calculated as the average copy number of the genomic region of a gene. |
 |
| cf) Tissue ID[Tissue type]: BLCA[Bladder Urothelial Carcinoma], BRCA[Breast invasive carcinoma], CESC[Cervical squamous cell carcinoma and endocervical adenocarcinoma], COAD[Colon adenocarcinoma], GBM[Glioblastoma multiforme], Glioma Low Grade, HNSC[Head and Neck squamous cell carcinoma], KICH[Kidney Chromophobe], KIRC[Kidney renal clear cell carcinoma], KIRP[Kidney renal papillary cell carcinoma], LAML[Acute Myeloid Leukemia], LUAD[Lung adenocarcinoma], LUSC[Lung squamous cell carcinoma], OV[Ovarian serous cystadenocarcinoma ], PAAD[Pancreatic adenocarcinoma], PRAD[Prostate adenocarcinoma], SKCM[Skin Cutaneous Melanoma], STAD[Stomach adenocarcinoma], THCA[Thyroid carcinoma], UCEC[Uterine Corpus Endometrial Carcinoma] |
| Top |
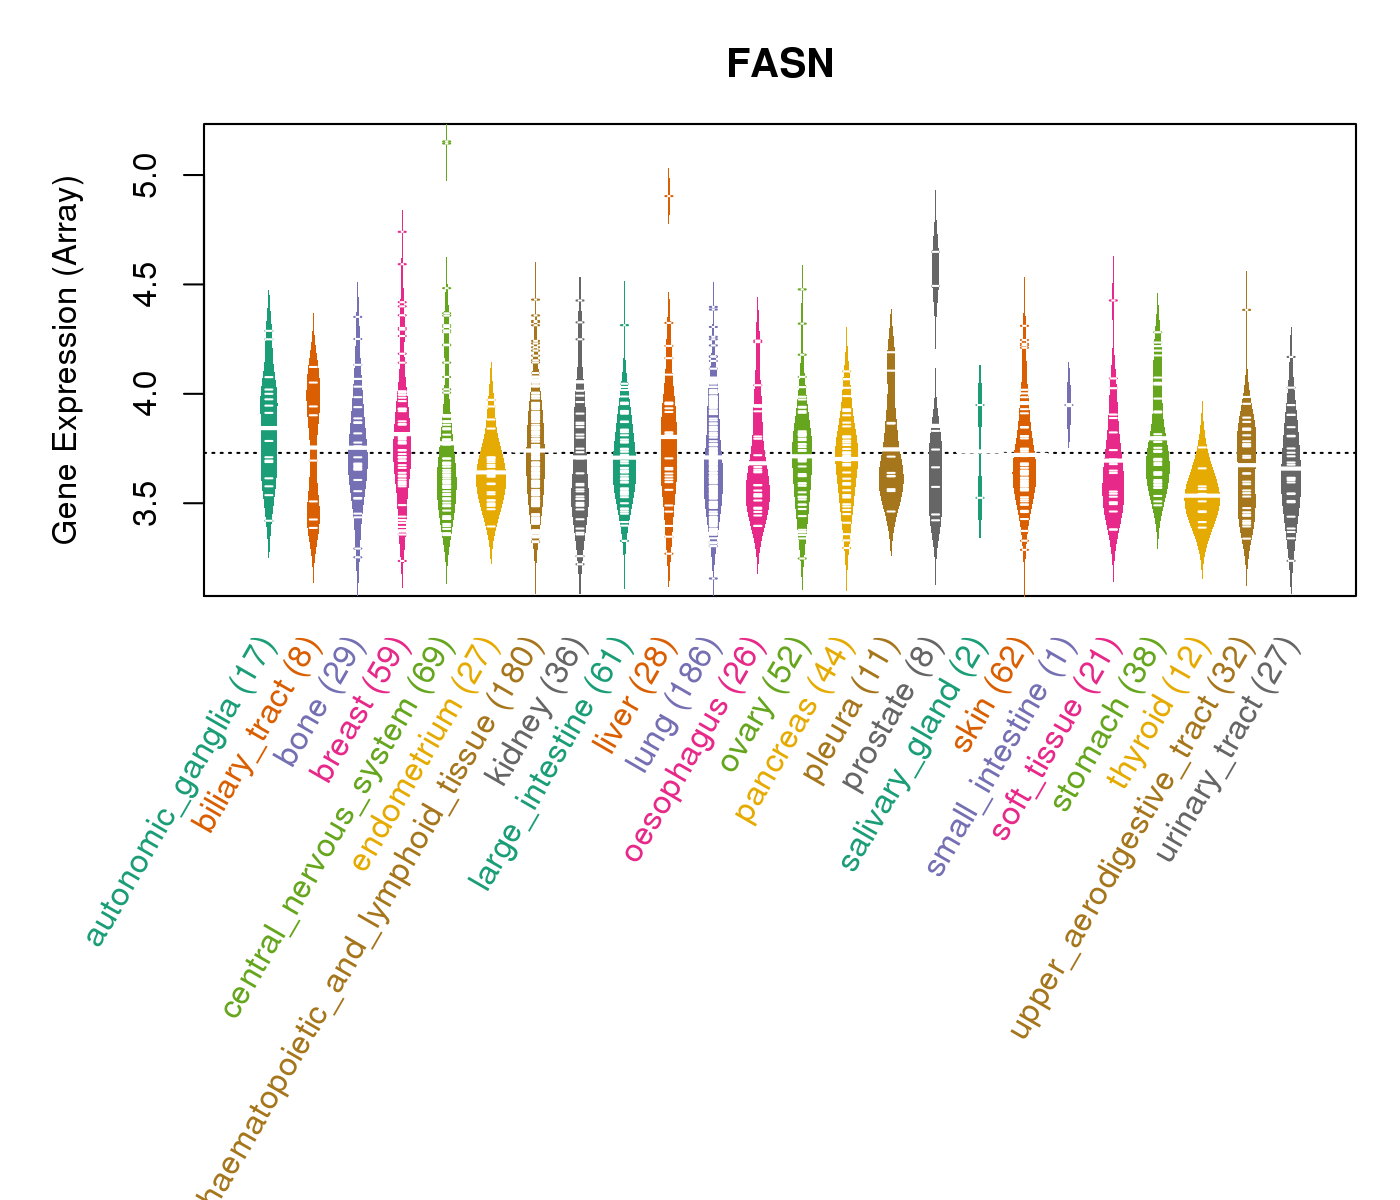
| Gene Expression for FASN |
| * CCLE gene expression data were extracted from CCLE_Expression_Entrez_2012-10-18.res: Gene-centric RMA-normalized mRNA expression data. |
 |
| Top |
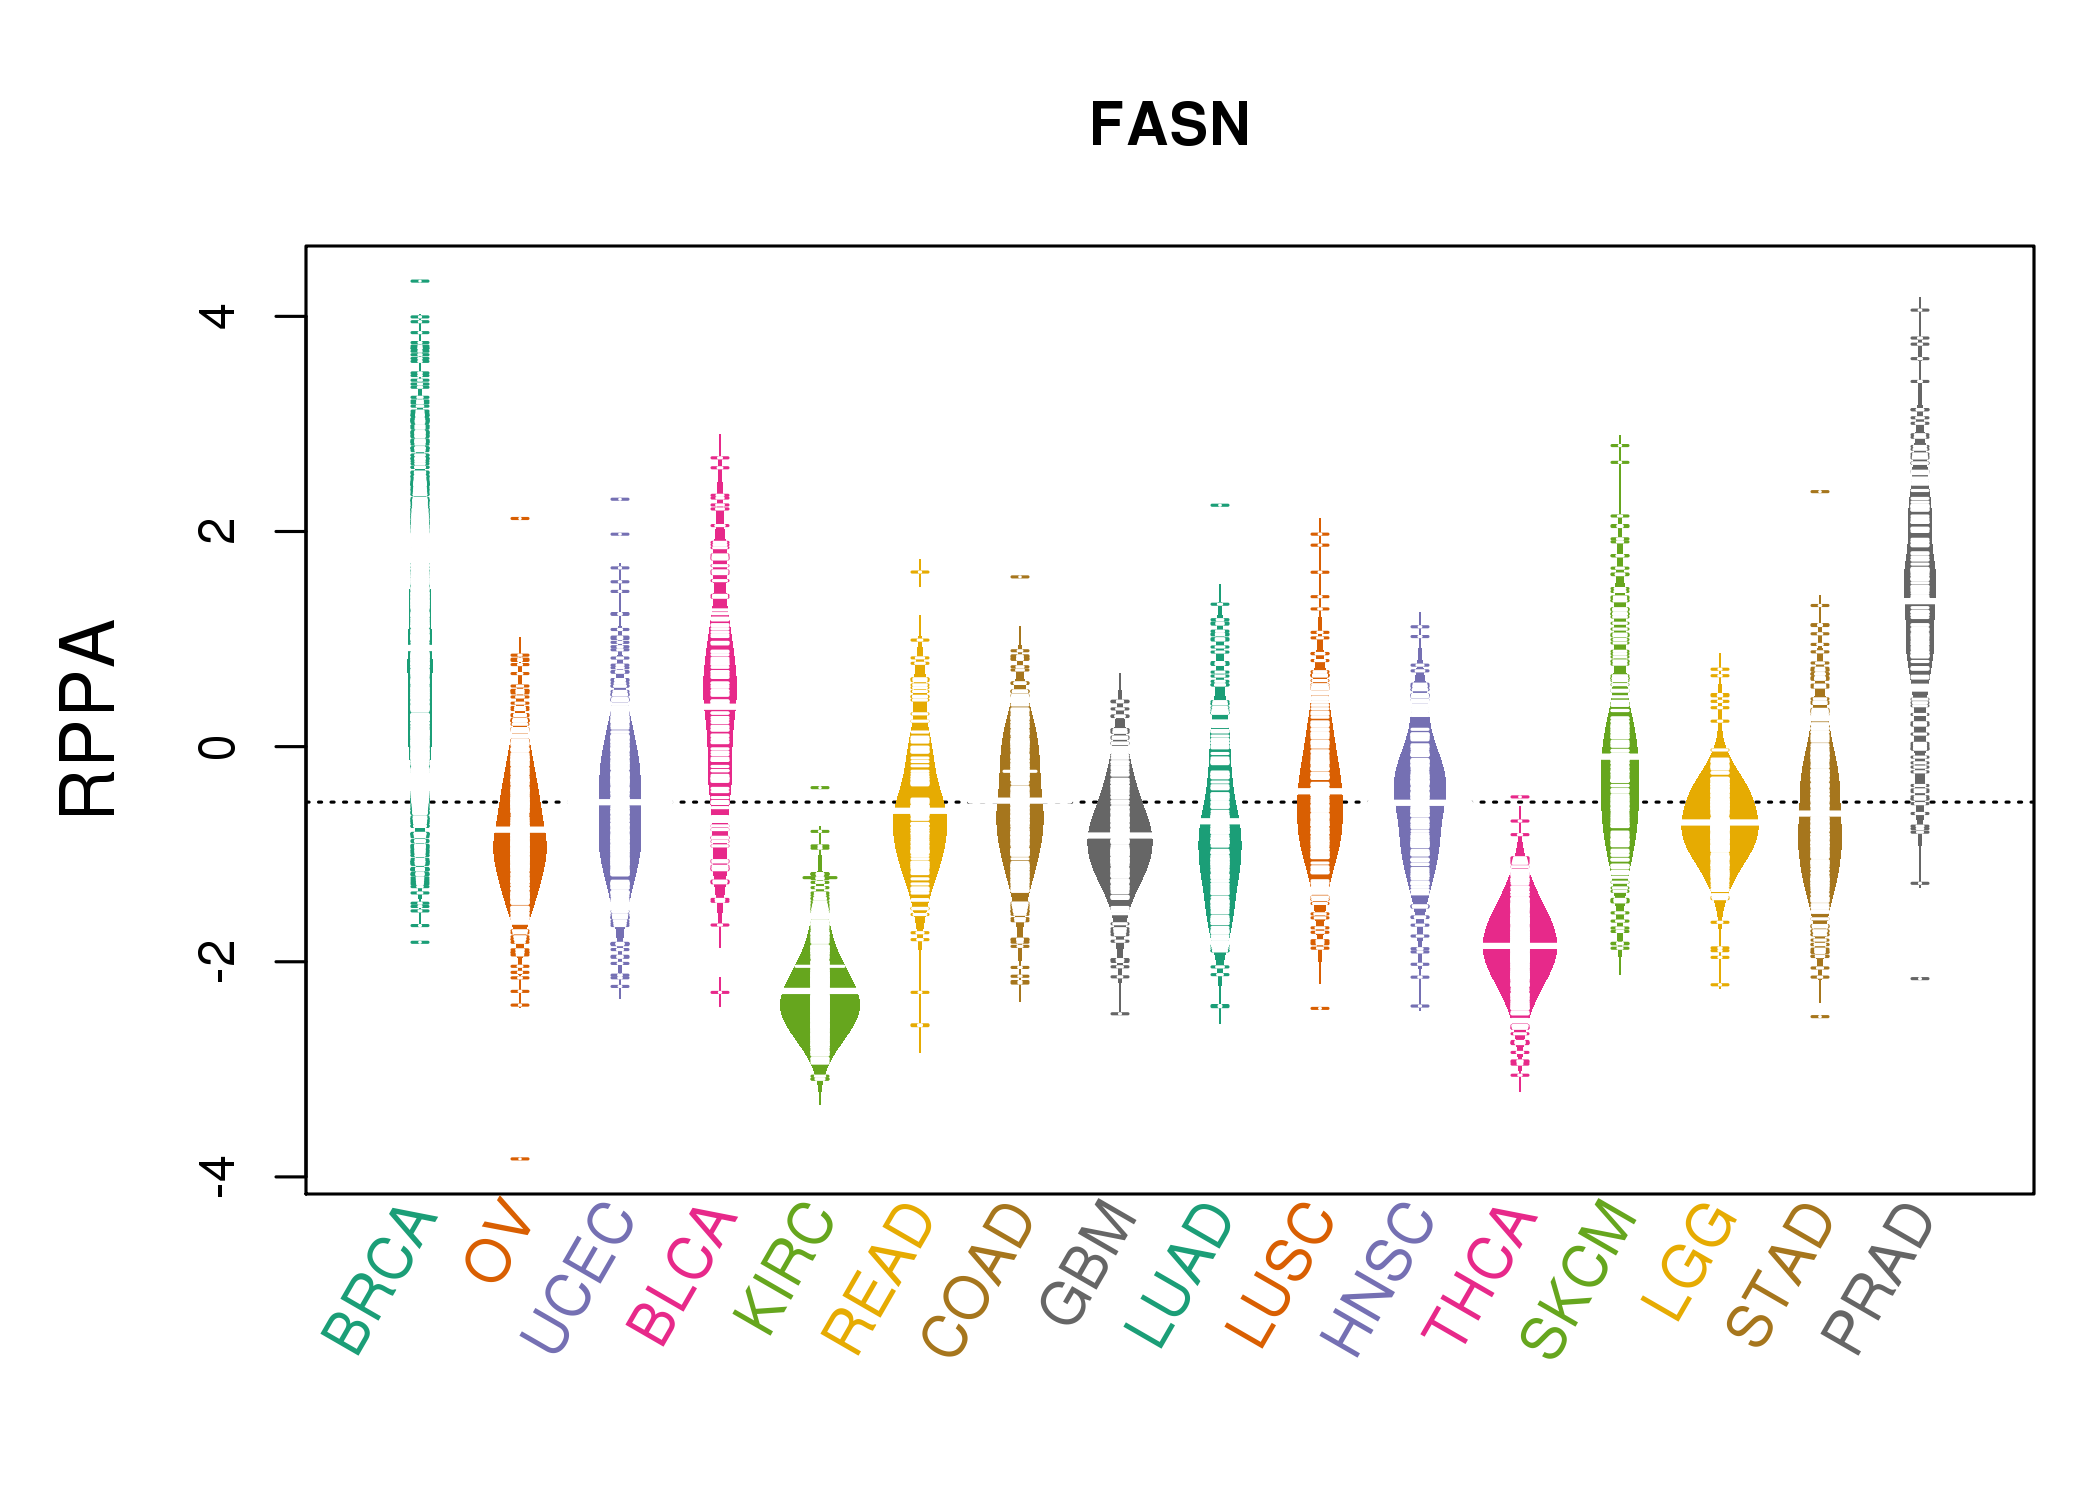
| *RPPA protein expression data were extracted from TCPA (The Cancer Proteome Atlas). Normalized data based on replicated based normalization (RBN) was used to draw following figures. |
 |
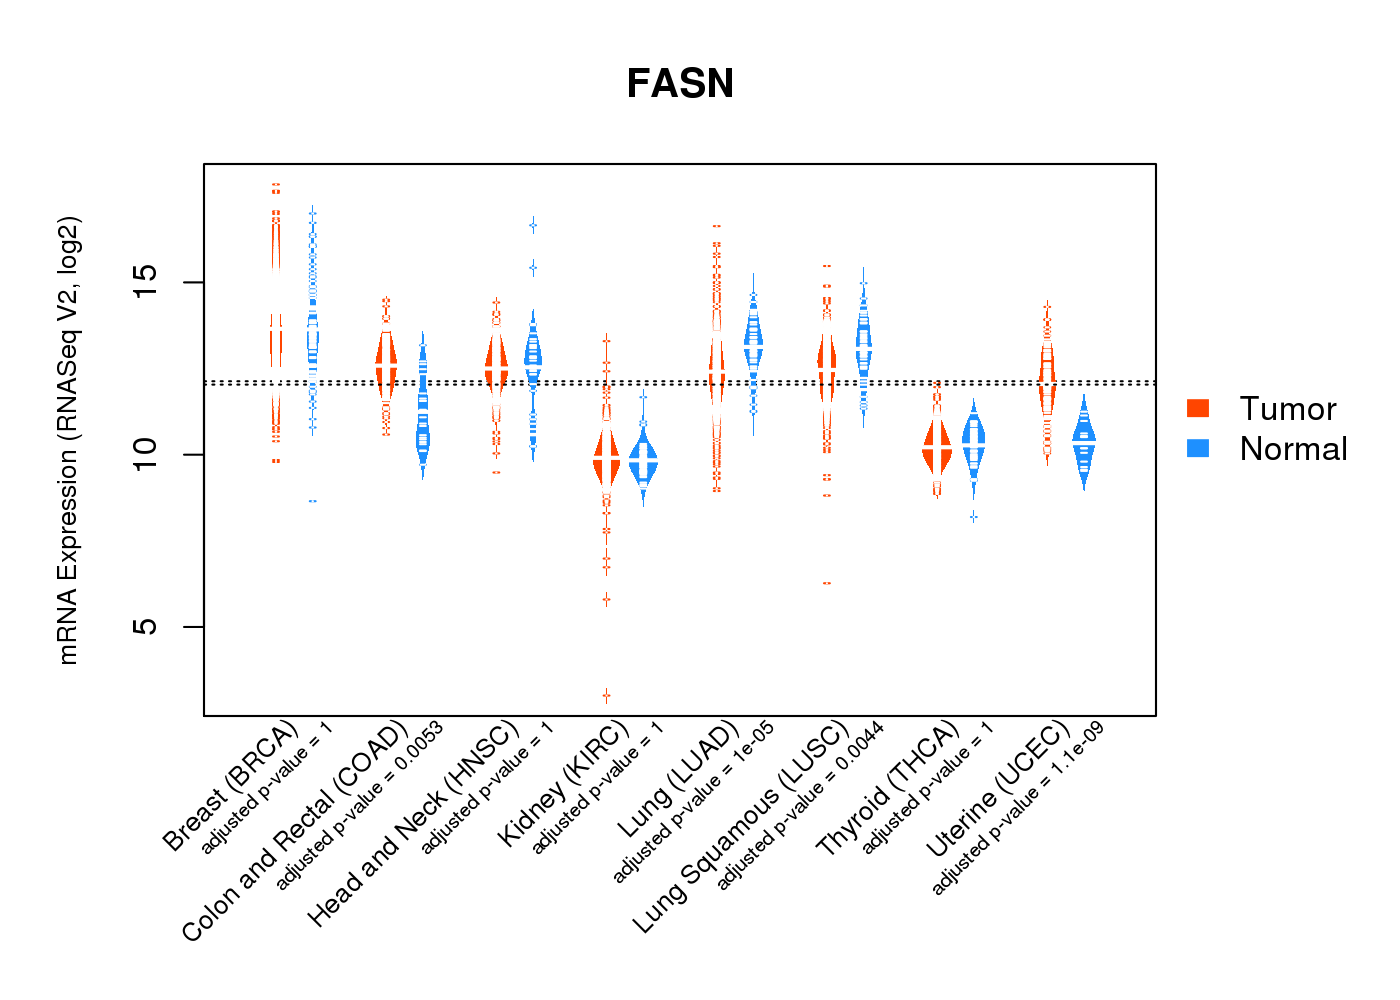
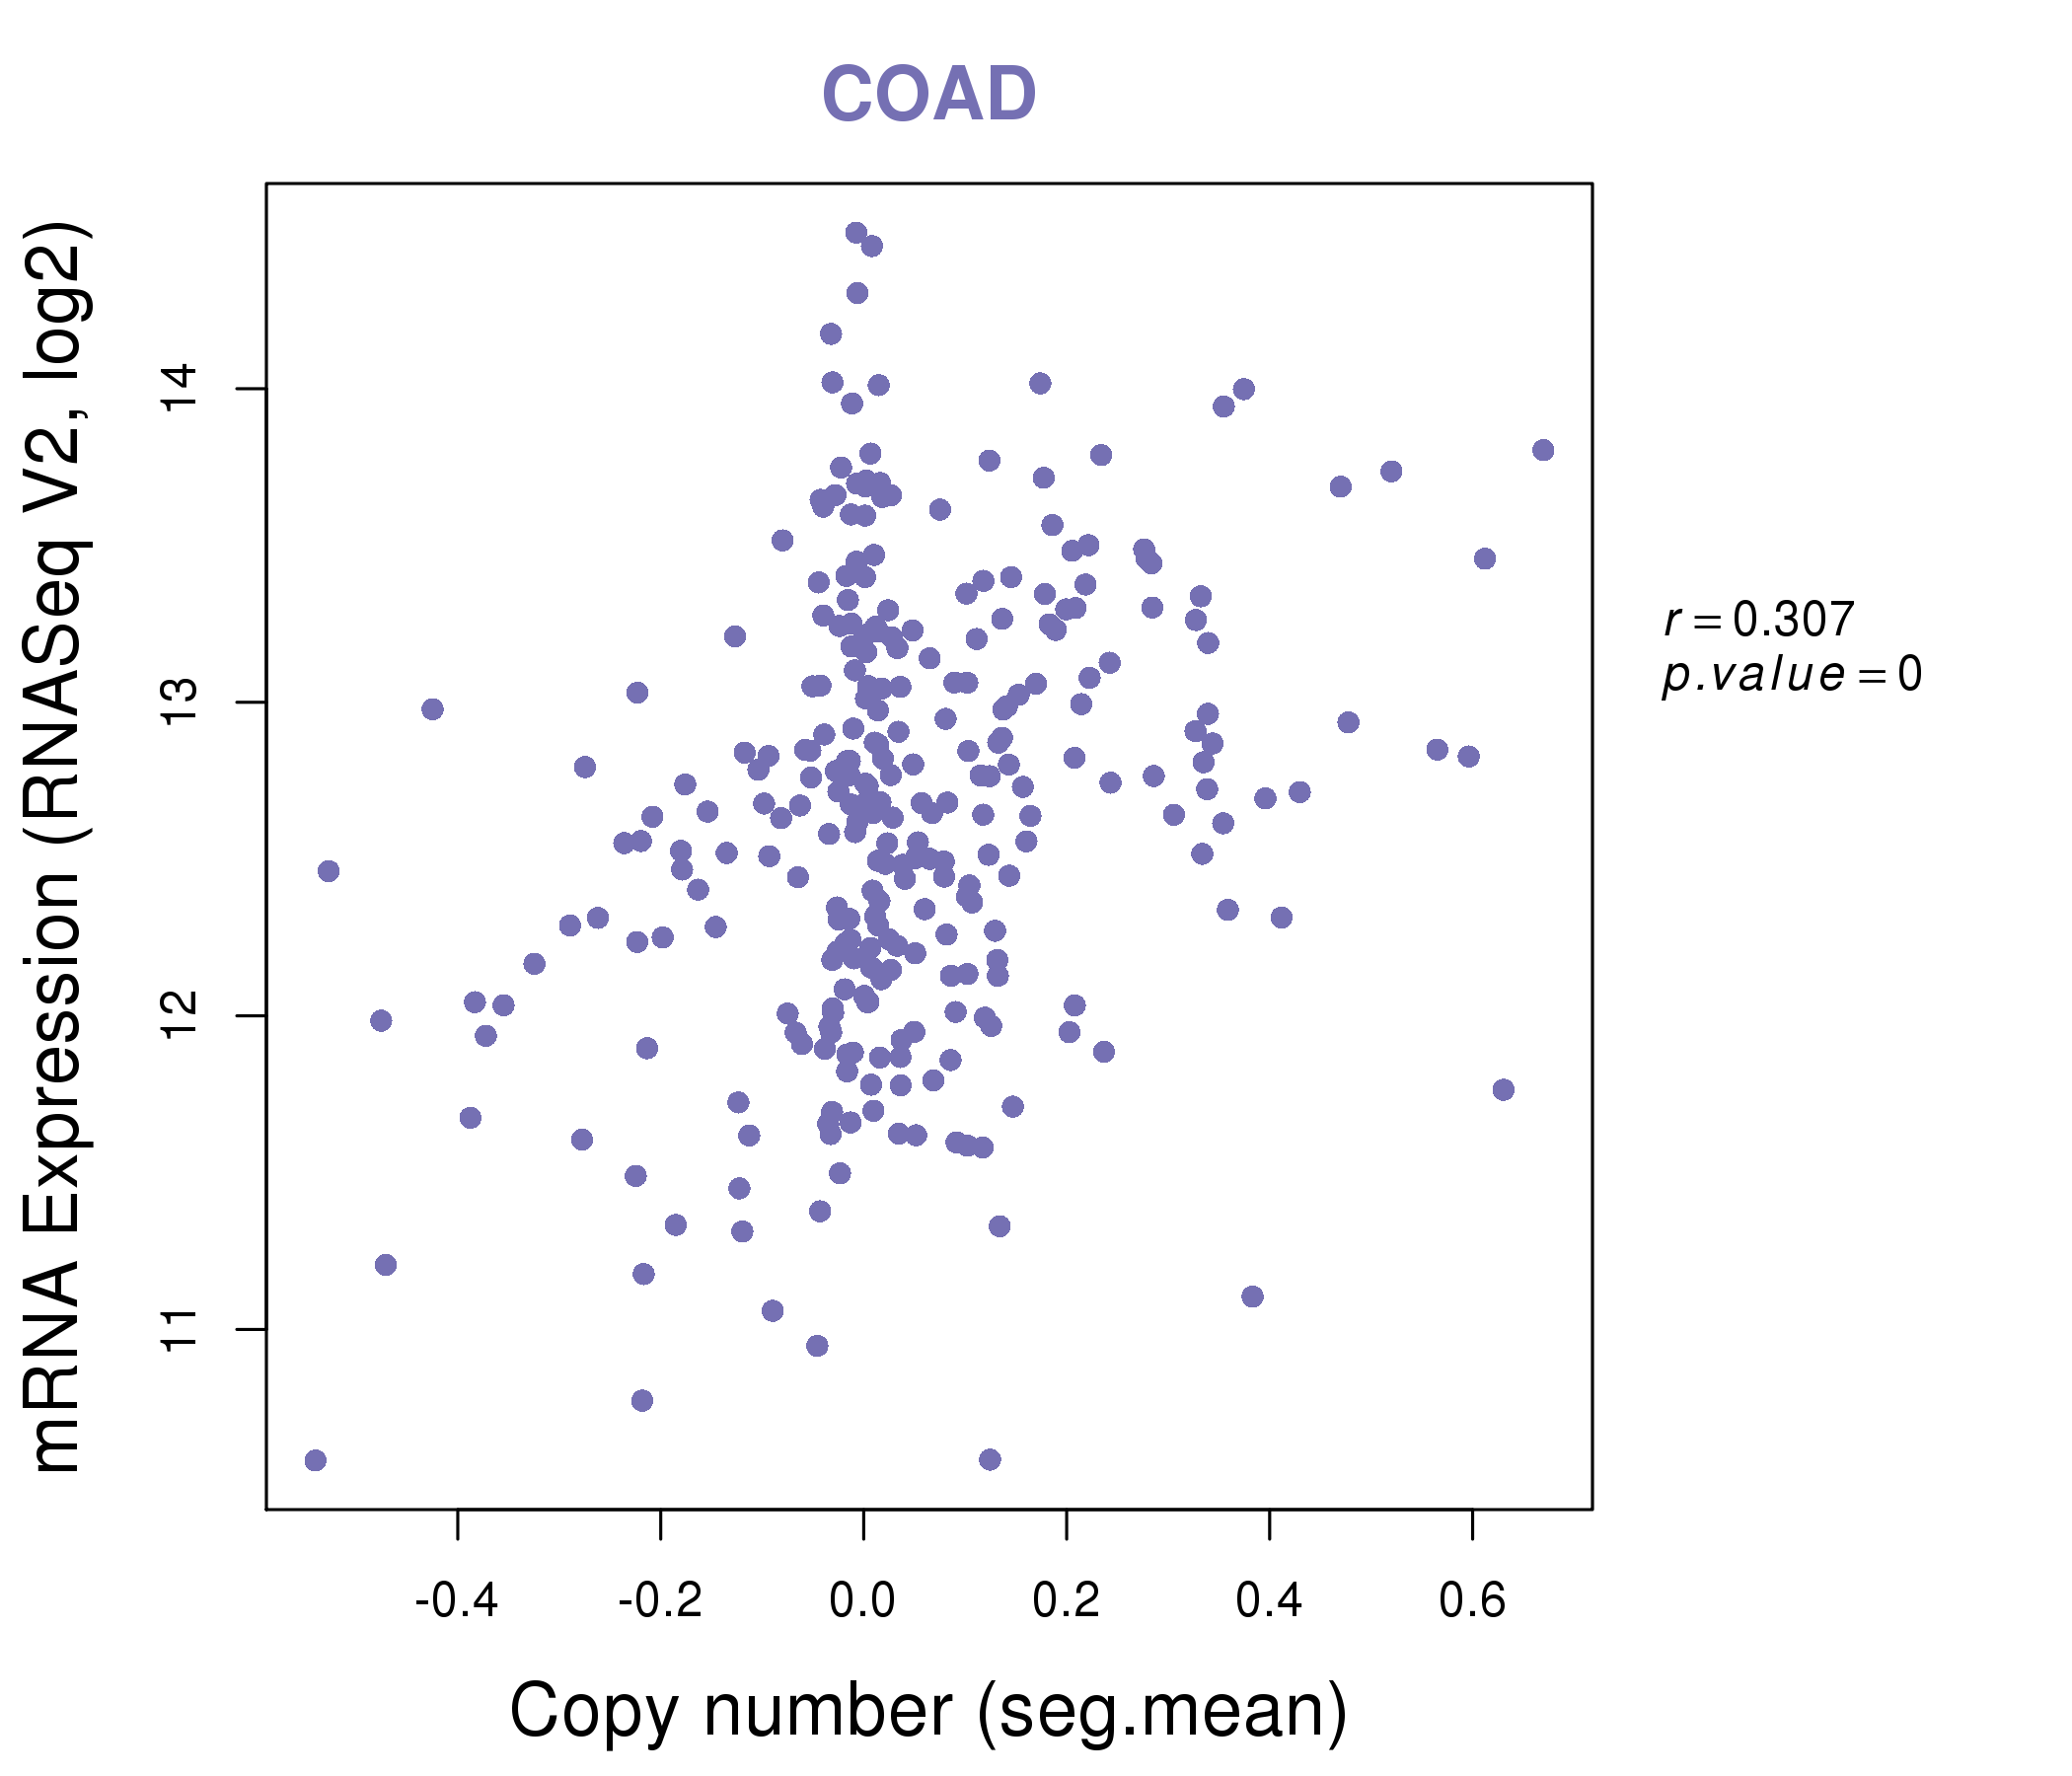
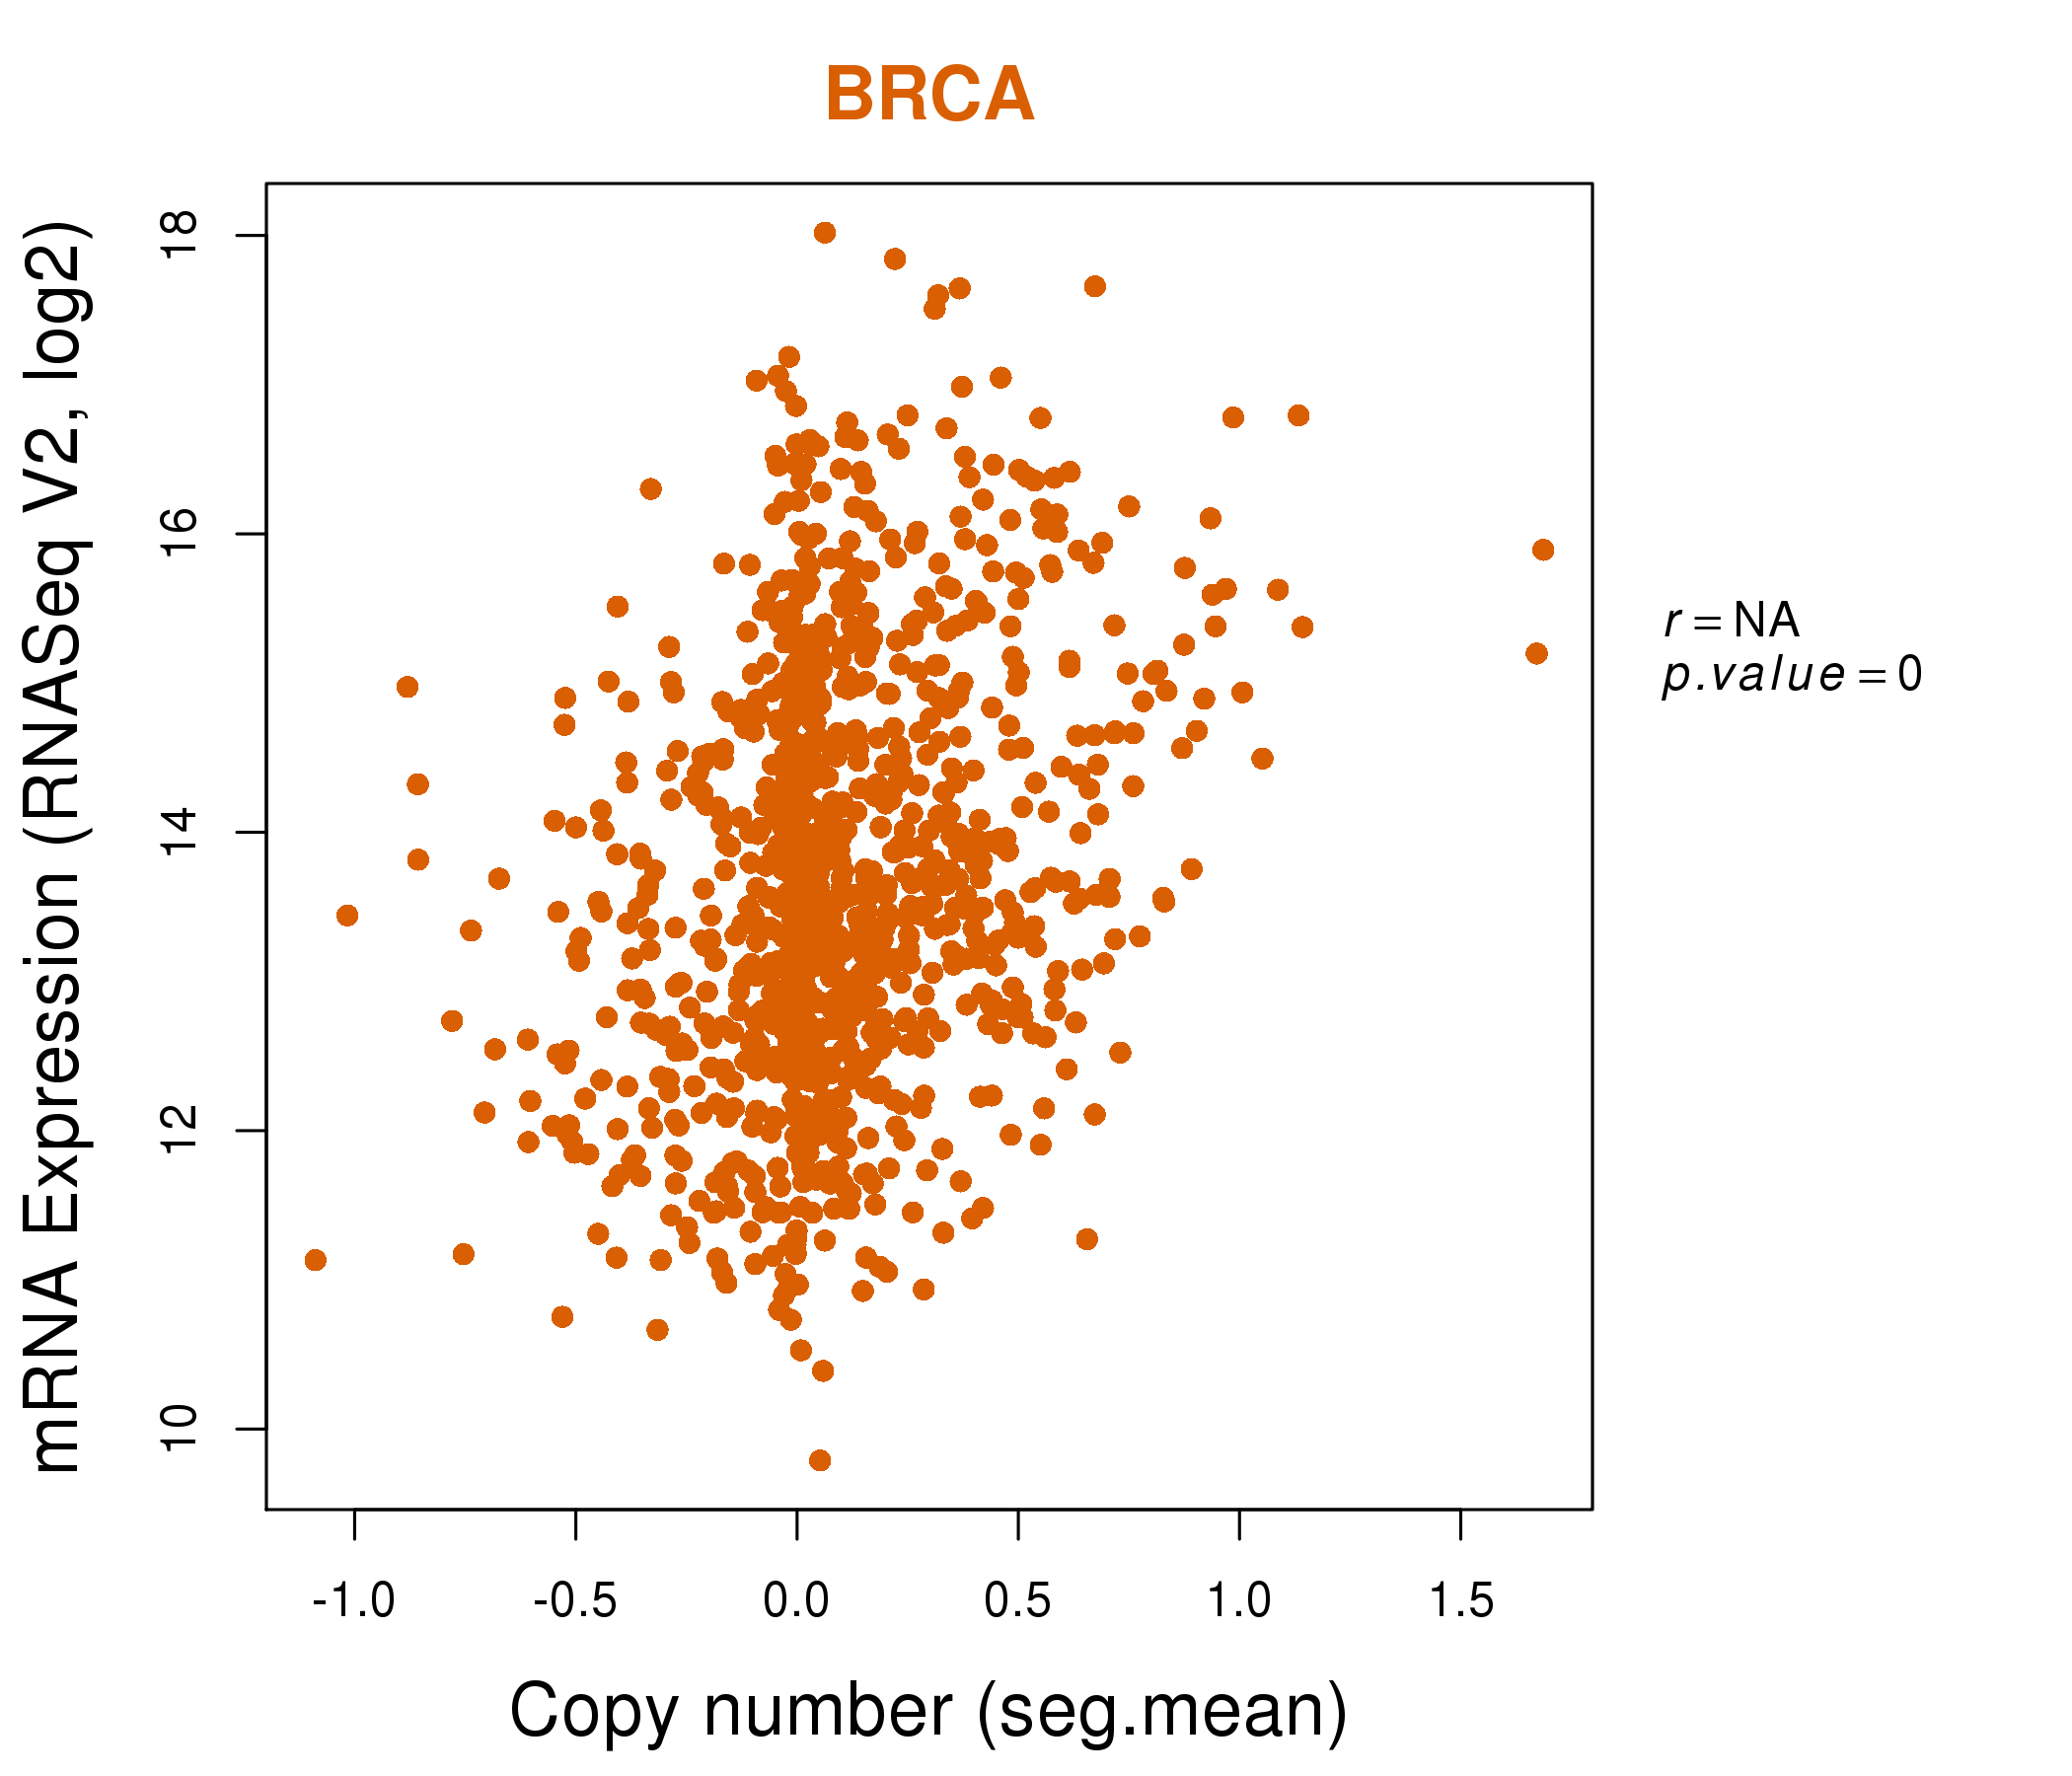
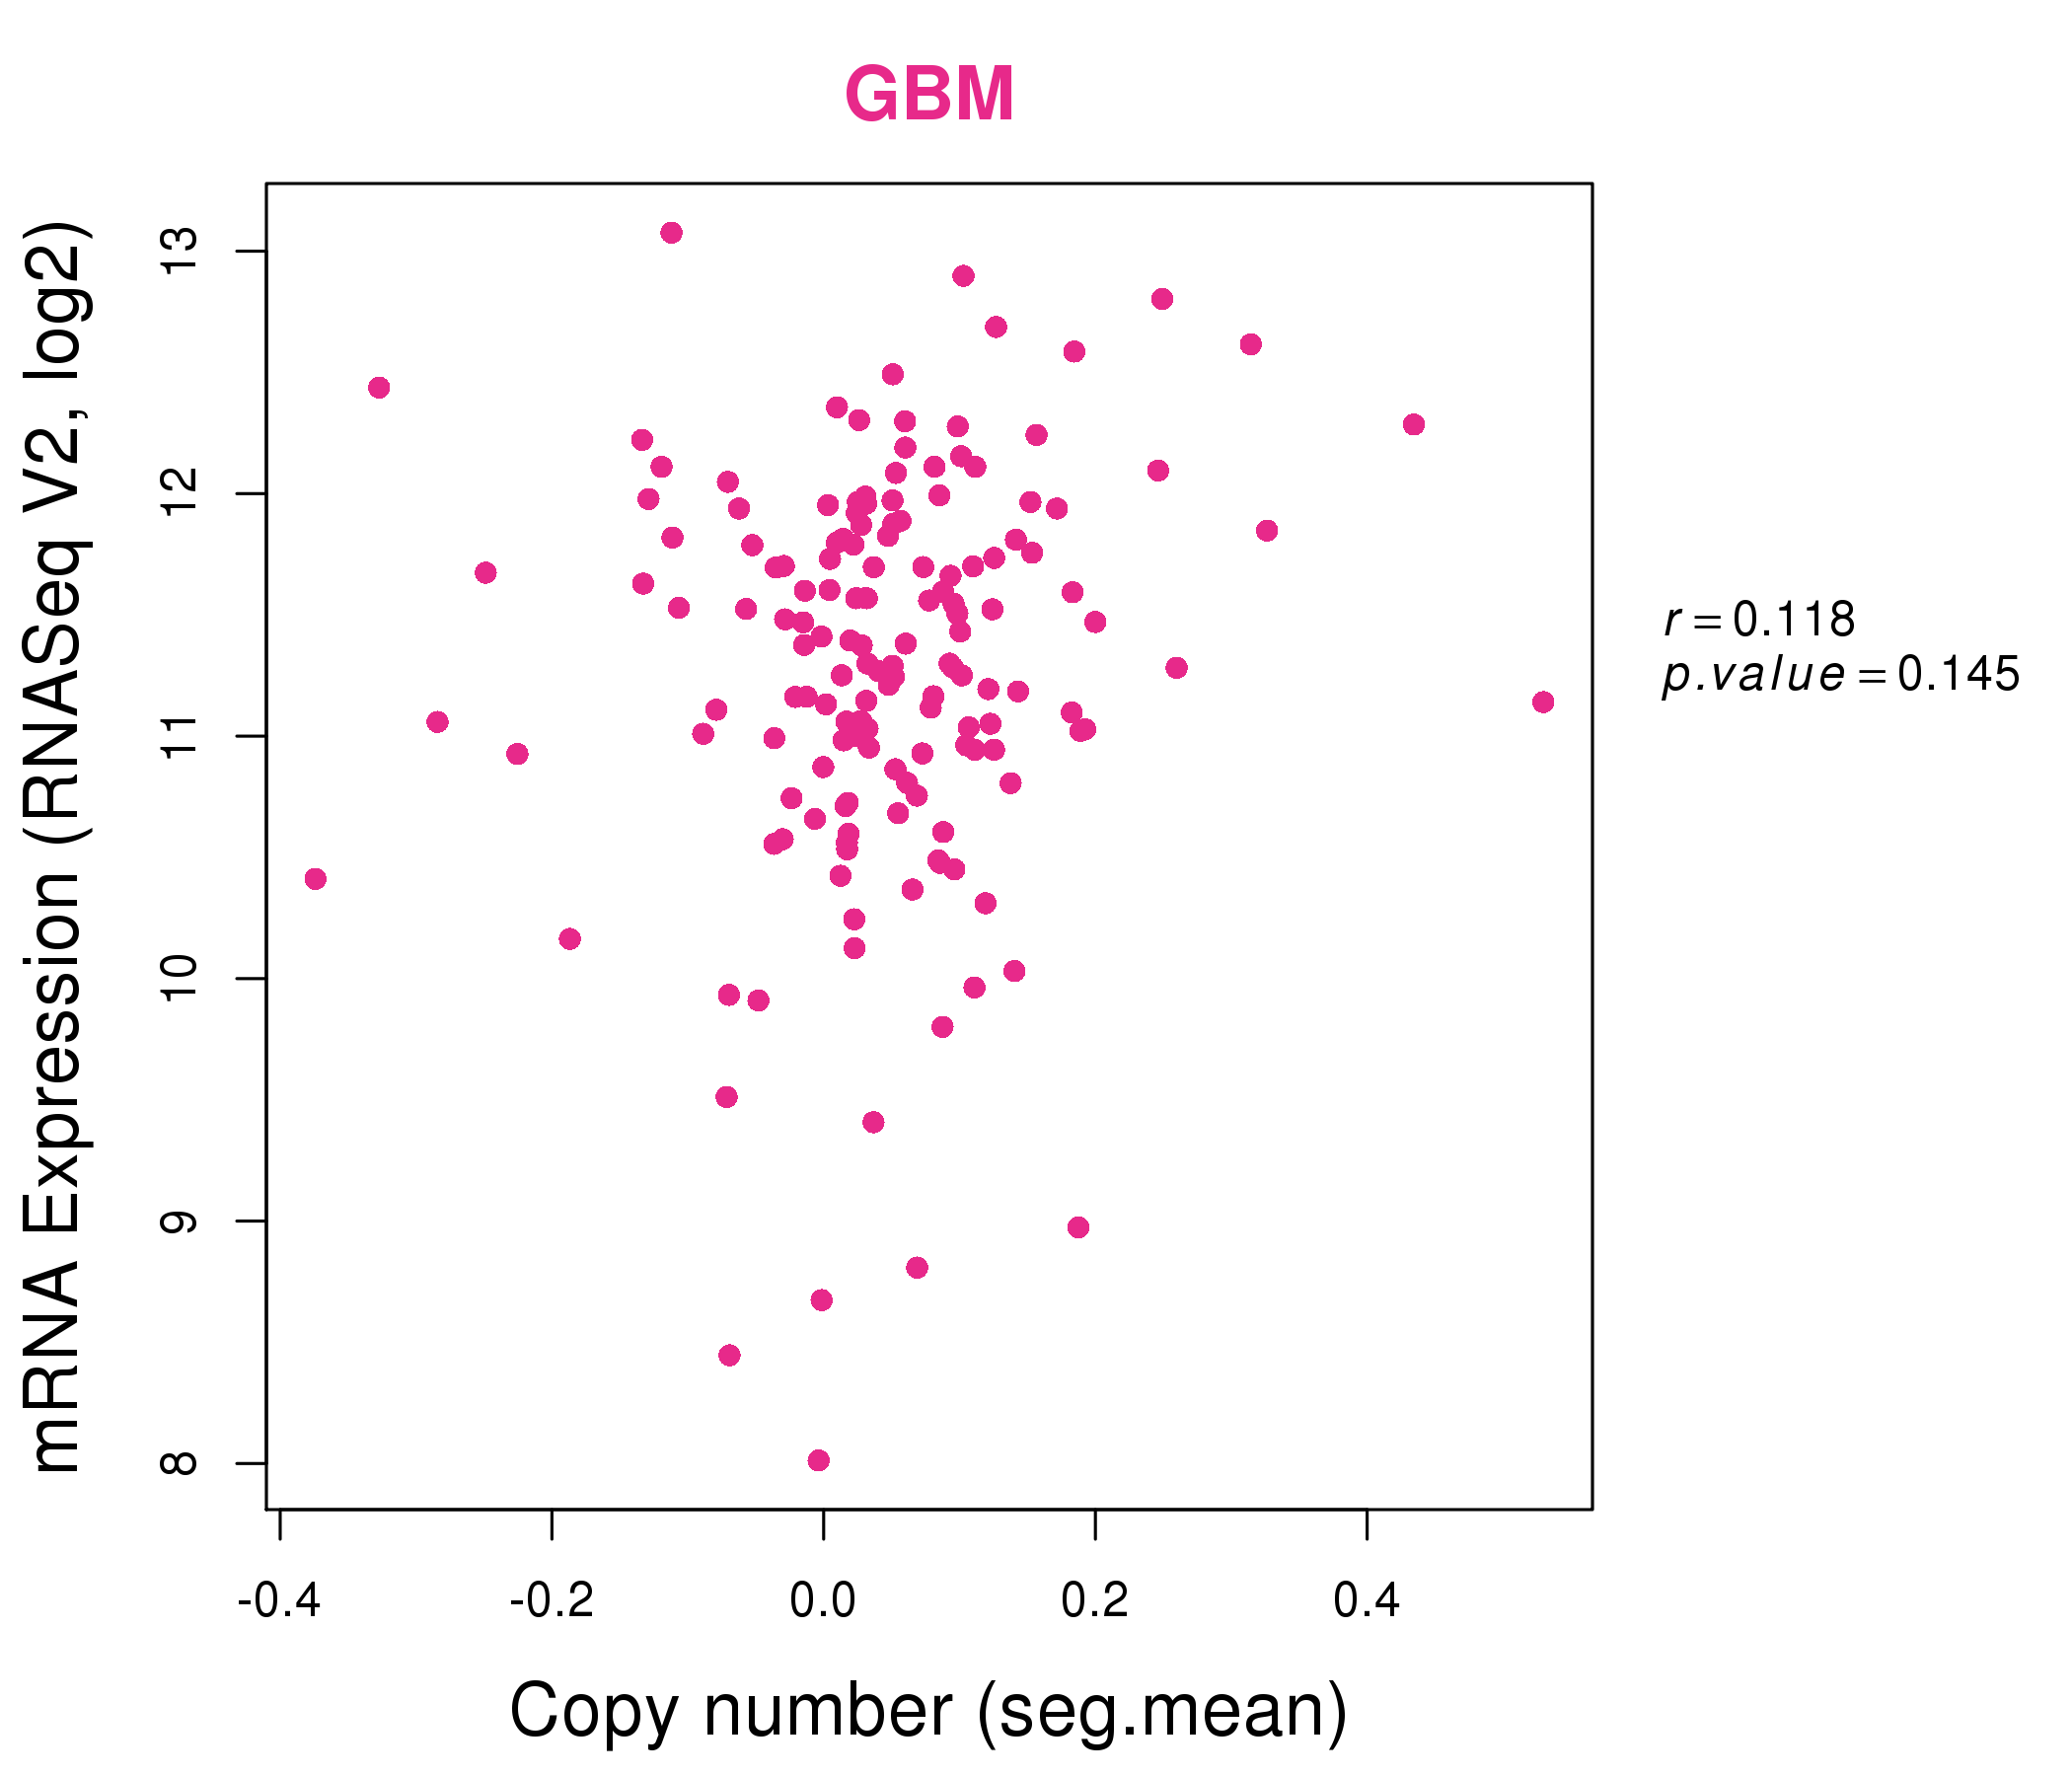
| * Normalized gene expression data of RNASeqV2 was extracted from TCGA using R package TCGA-Assembler. The URLs of all public data files on TCGA DCC data server were gathered at Jan-05-2015. Only eight cancer types have enough normal control samples for differential expression analysis. (t test, adjusted p<0.05 (using Benjamini-Hochberg FDR)) |
 |
| Top |
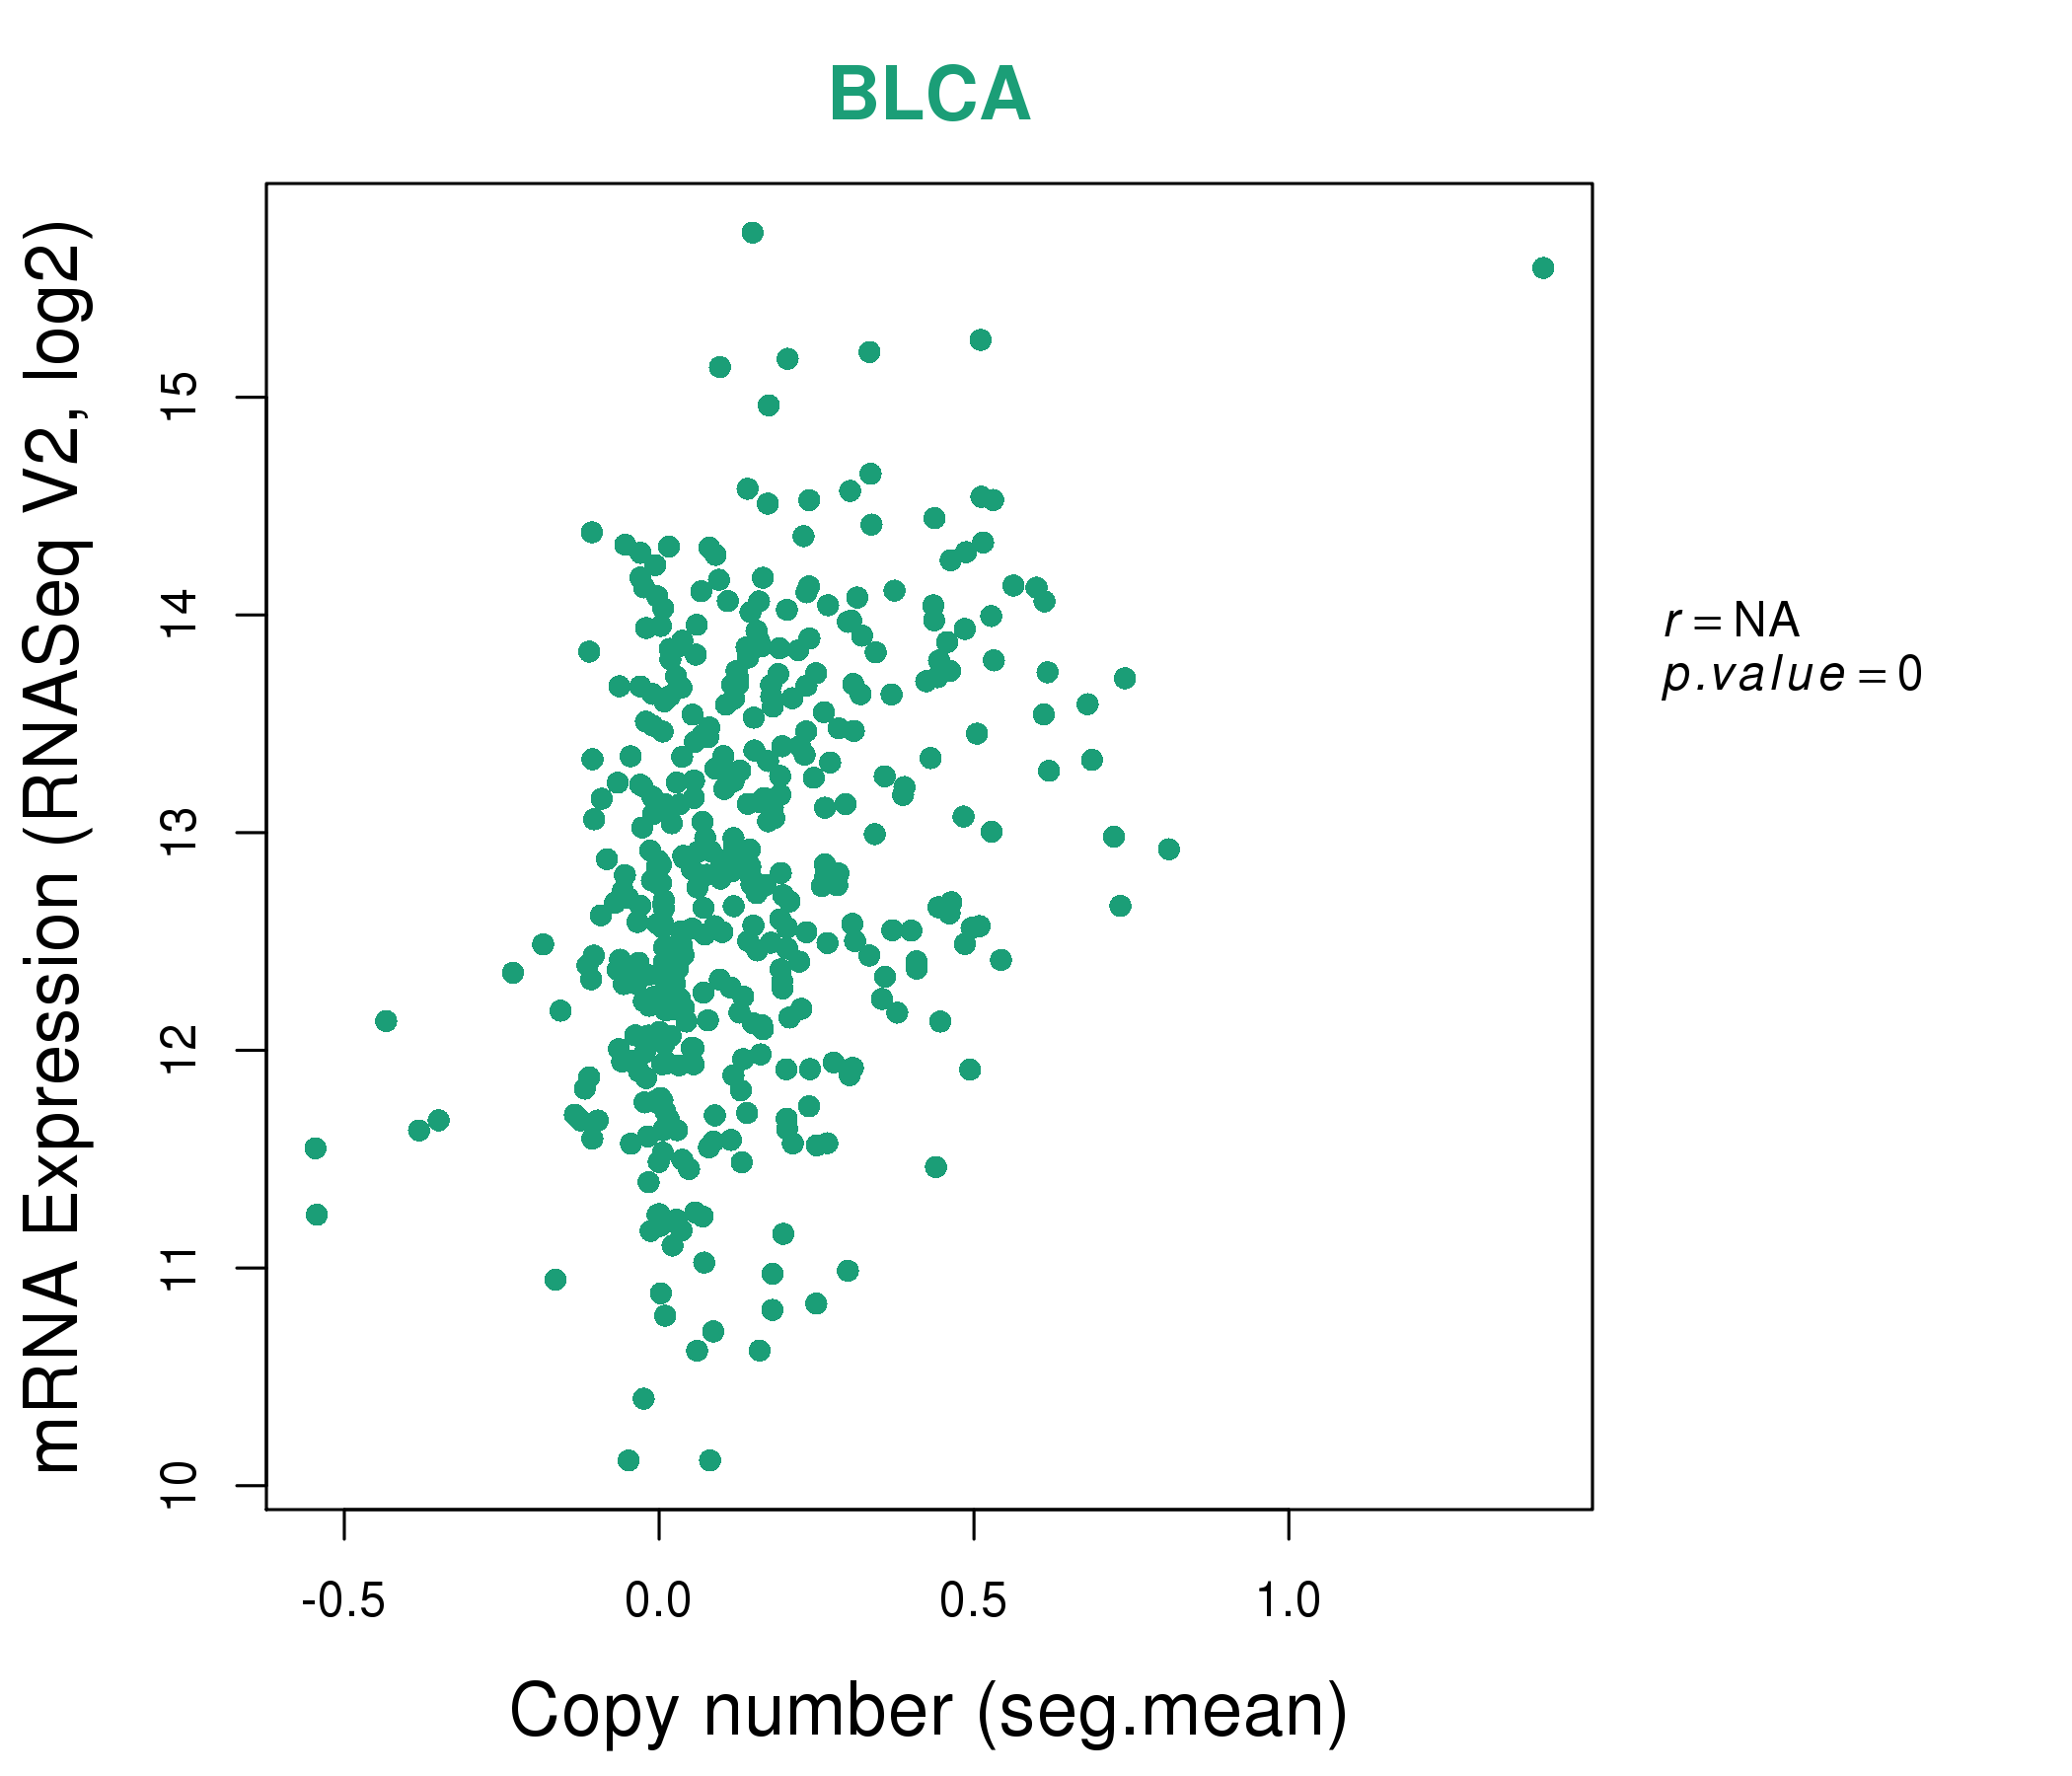
| * This plots show the correlation between CNV and gene expression. |
: Open all plots for all cancer types
 |
|
 |
|
| Top |
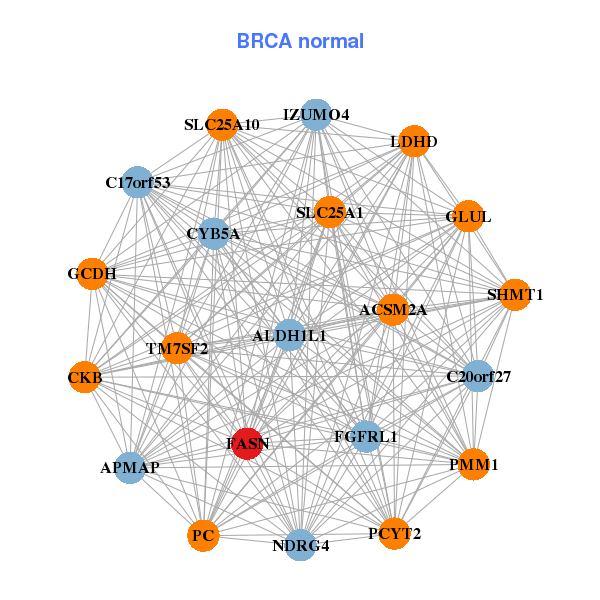
| Gene-Gene Network Information |
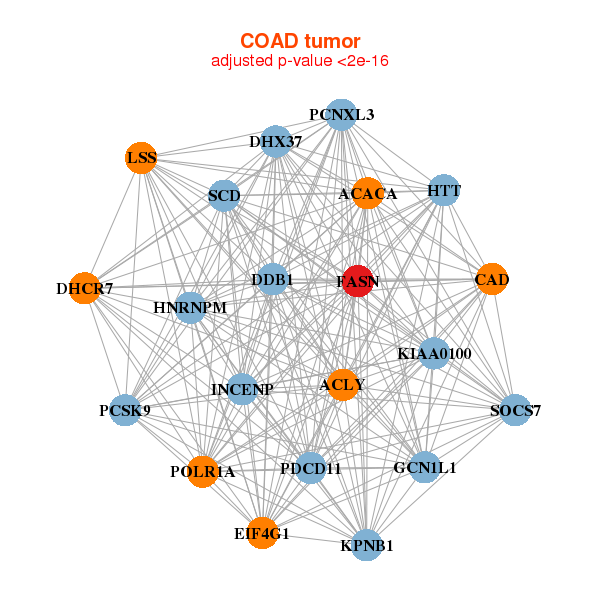
| * Co-Expression network figures were drawn using R package igraph. Only the top 20 genes with the highest correlations were shown. Red circle: input gene, orange circle: cell metabolism gene, sky circle: other gene |
: Open all plots for all cancer types
 |
| ||||
| ACACA,ALDH4A1,ALOX15B,CCDC57,DCXR,ELOVL5,ETNK2, FASN,FKBP5,GGT1,GGTLC1,GNMT,MPV17L,MVK, SCD,SERHL2,SLC26A3,SLC26A6,SREBF1,ZBTB16,ZNF689 | ACSM2A,ALDH1L1,C17orf53,IZUMO4,C20orf27,APMAP,CKB, CYB5A,FASN,FGFRL1,GCDH,GLUL,LDHD,NDRG4, PC,PCYT2,PMM1,SHMT1,SLC25A10,SLC25A1,TM7SF2 | ||||
 |
| ||||
| ACACA,ACLY,CAD,DDB1,DHCR7,DHX37,EIF4G1, FASN,GCN1L1,HNRNPM,HTT,INCENP,KIAA0100,KPNB1, LSS,PCNXL3,PCSK9,PDCD11,POLR1A,SCD,SOCS7 | ACACA,ACSL1,ALPL,CAD,DHCR7,AGO2,FASN, LARP1,LSS,MUC4,MUC5B,PKP4,PLXNA1,POLR1A, PRKDC,RANGAP1,SCD,SPTBN2,TNKS1BP1,URB1,USP31 |

| * Co-Expression network figures were drawn using R package igraph. Only the top 20 genes with the highest correlations were shown. Red circle: input gene, orange circle: cell metabolism gene, sky circle: other gene |
: Open all plots for all cancer types
| Top |
: Open all interacting genes' information including KEGG pathway for all interacting genes from DAVID
| Top |
| Pharmacological Information for FASN |
| DB Category | DB Name | DB's ID and Url link |
| Chemistry | BindingDB | P49327; -. |
| Chemistry | ChEMBL | CHEMBL4158; -. |
| Chemistry | BindingDB | P49327; -. |
| Chemistry | ChEMBL | CHEMBL4158; -. |
| Organism-specific databases | PharmGKB | PA28006; -. |
| Organism-specific databases | PharmGKB | PA28006; -. |
| Organism-specific databases | CTD | 2194; -. |
| Organism-specific databases | CTD | 2194; -. |
| * Gene Centered Interaction Network. |
 |
| * Drug Centered Interaction Network. |
| DrugBank ID | Target Name | Drug Groups | Generic Name | Drug Centered Network | Drug Structure |
| DB01034 | fatty acid synthase | approved | Cerulenin | 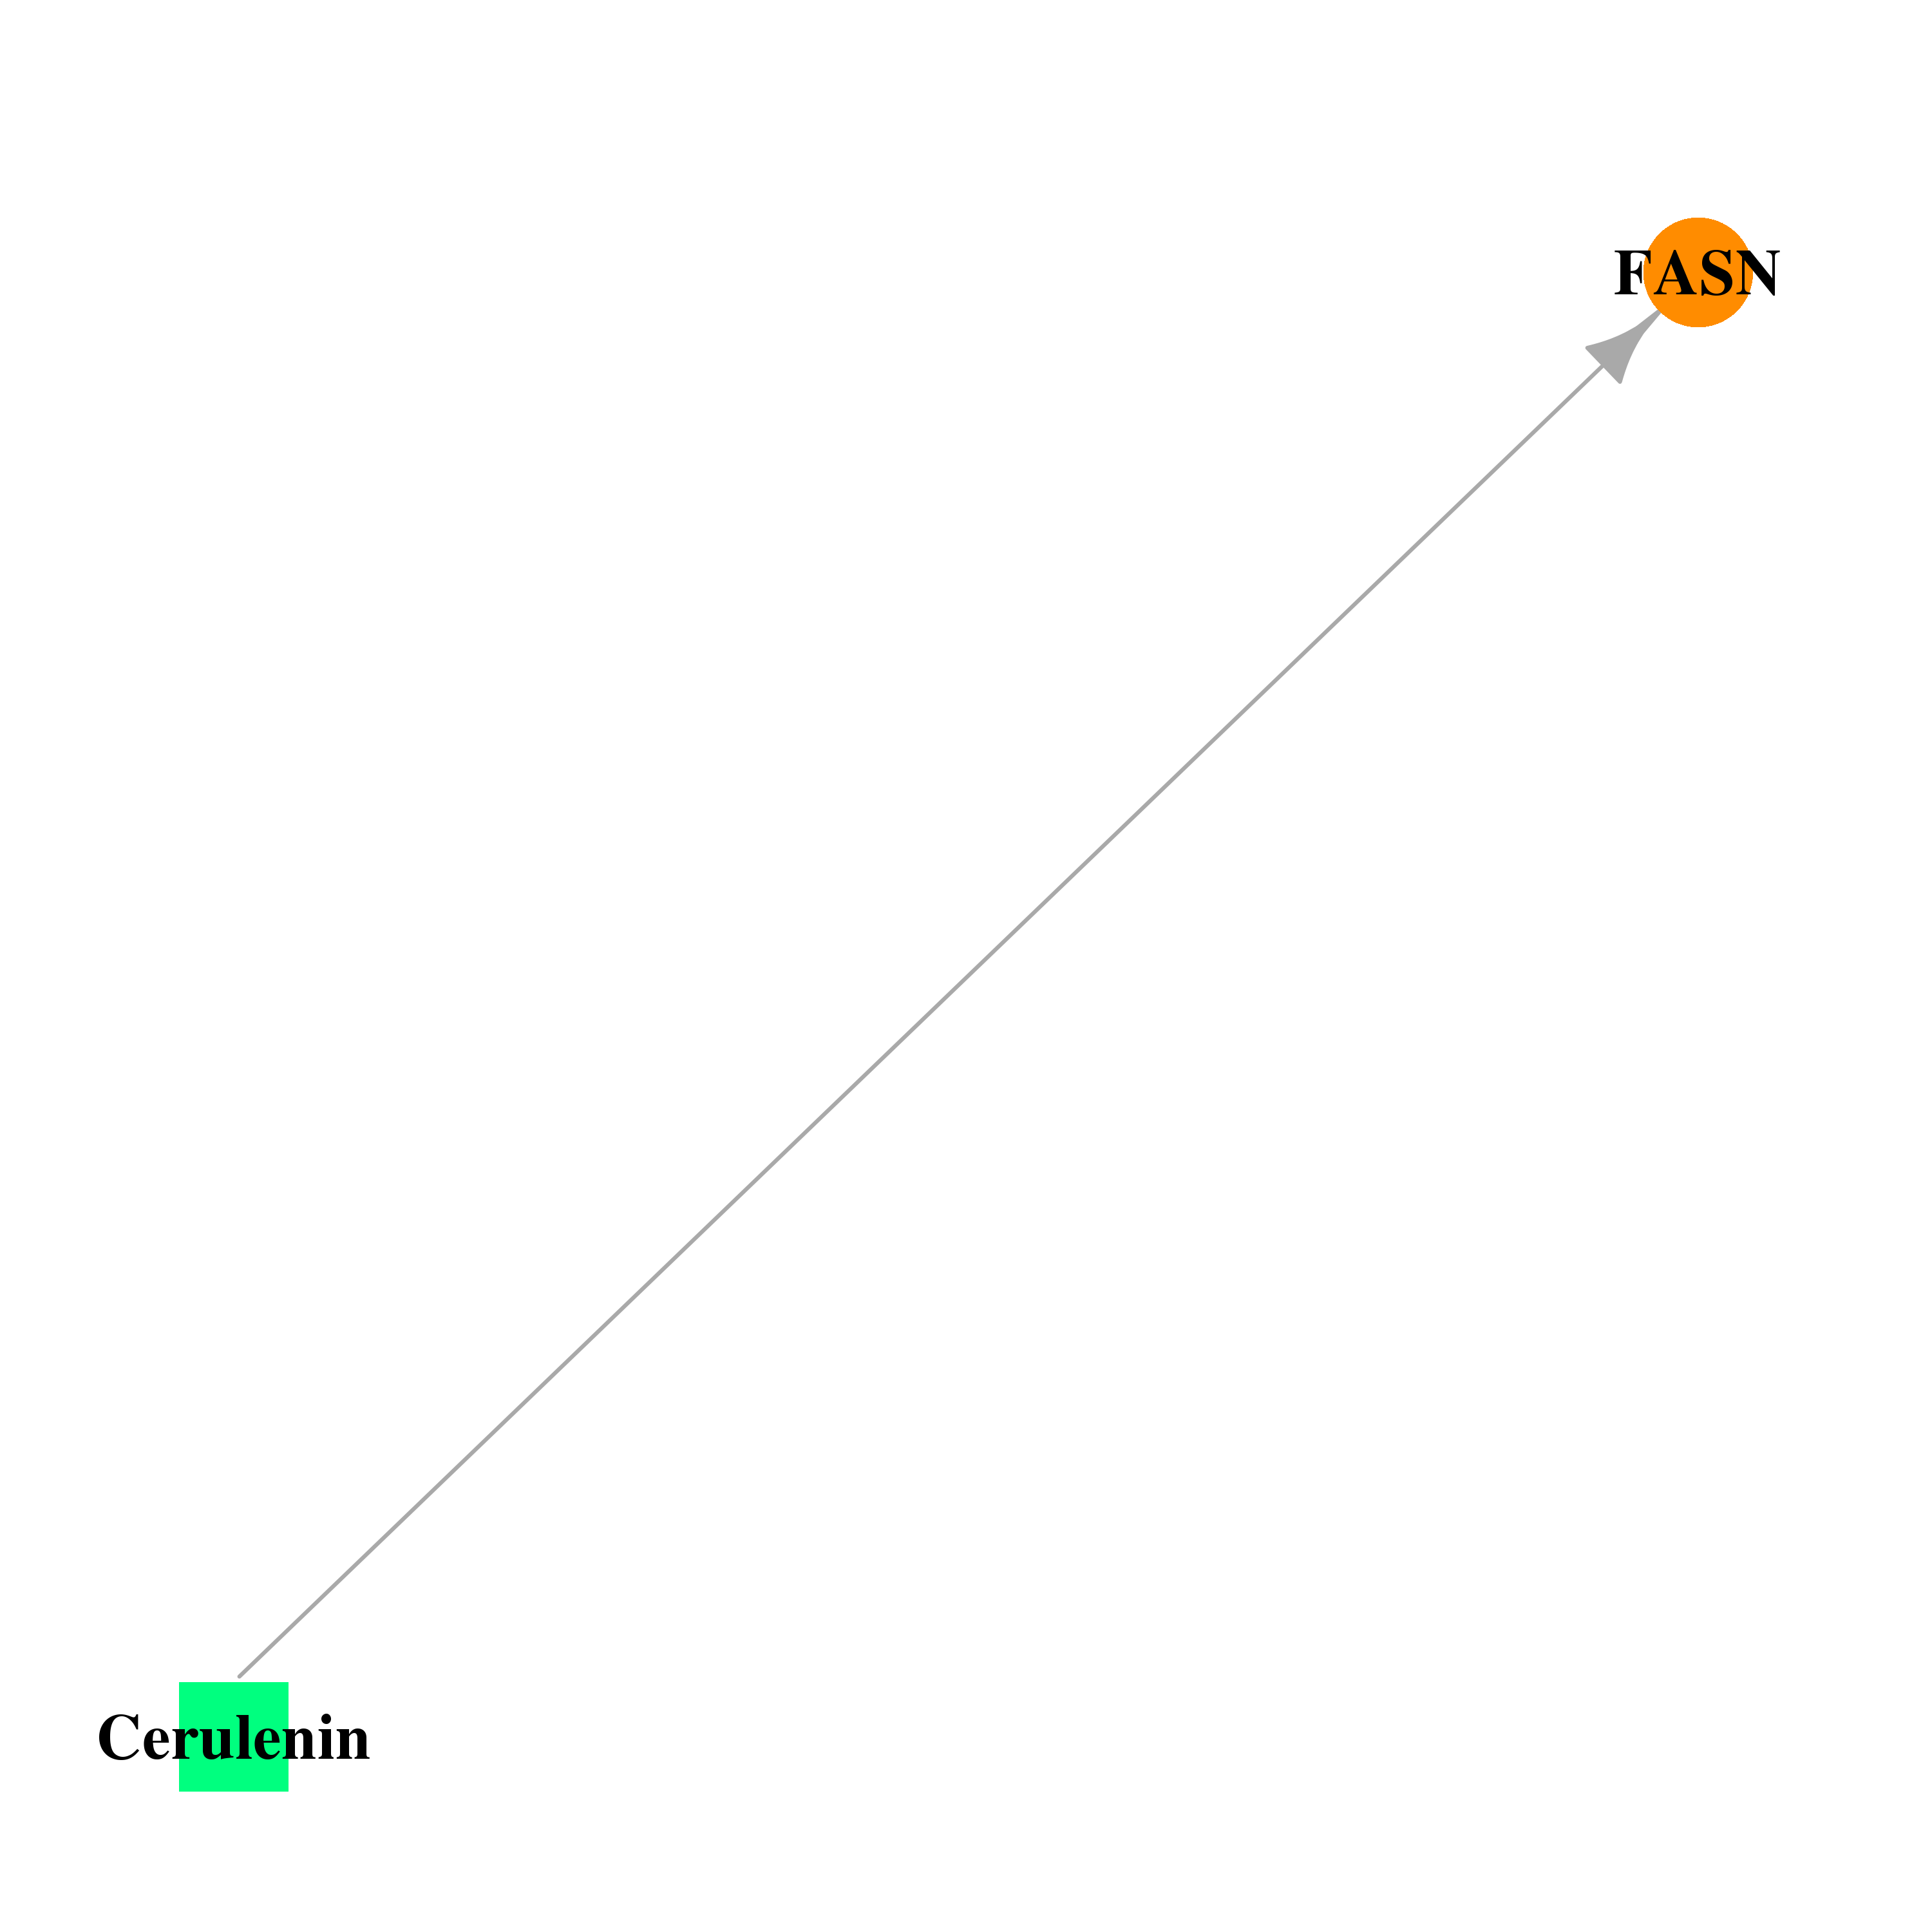 | 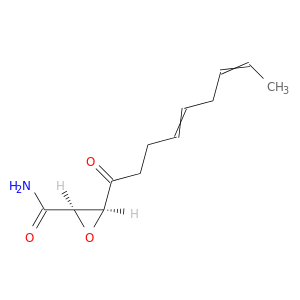 |
| DB01083 | fatty acid synthase | approved; investigational | Orlistat |  |  |
| DB00363 | fatty acid synthase | approved | Clozapine | 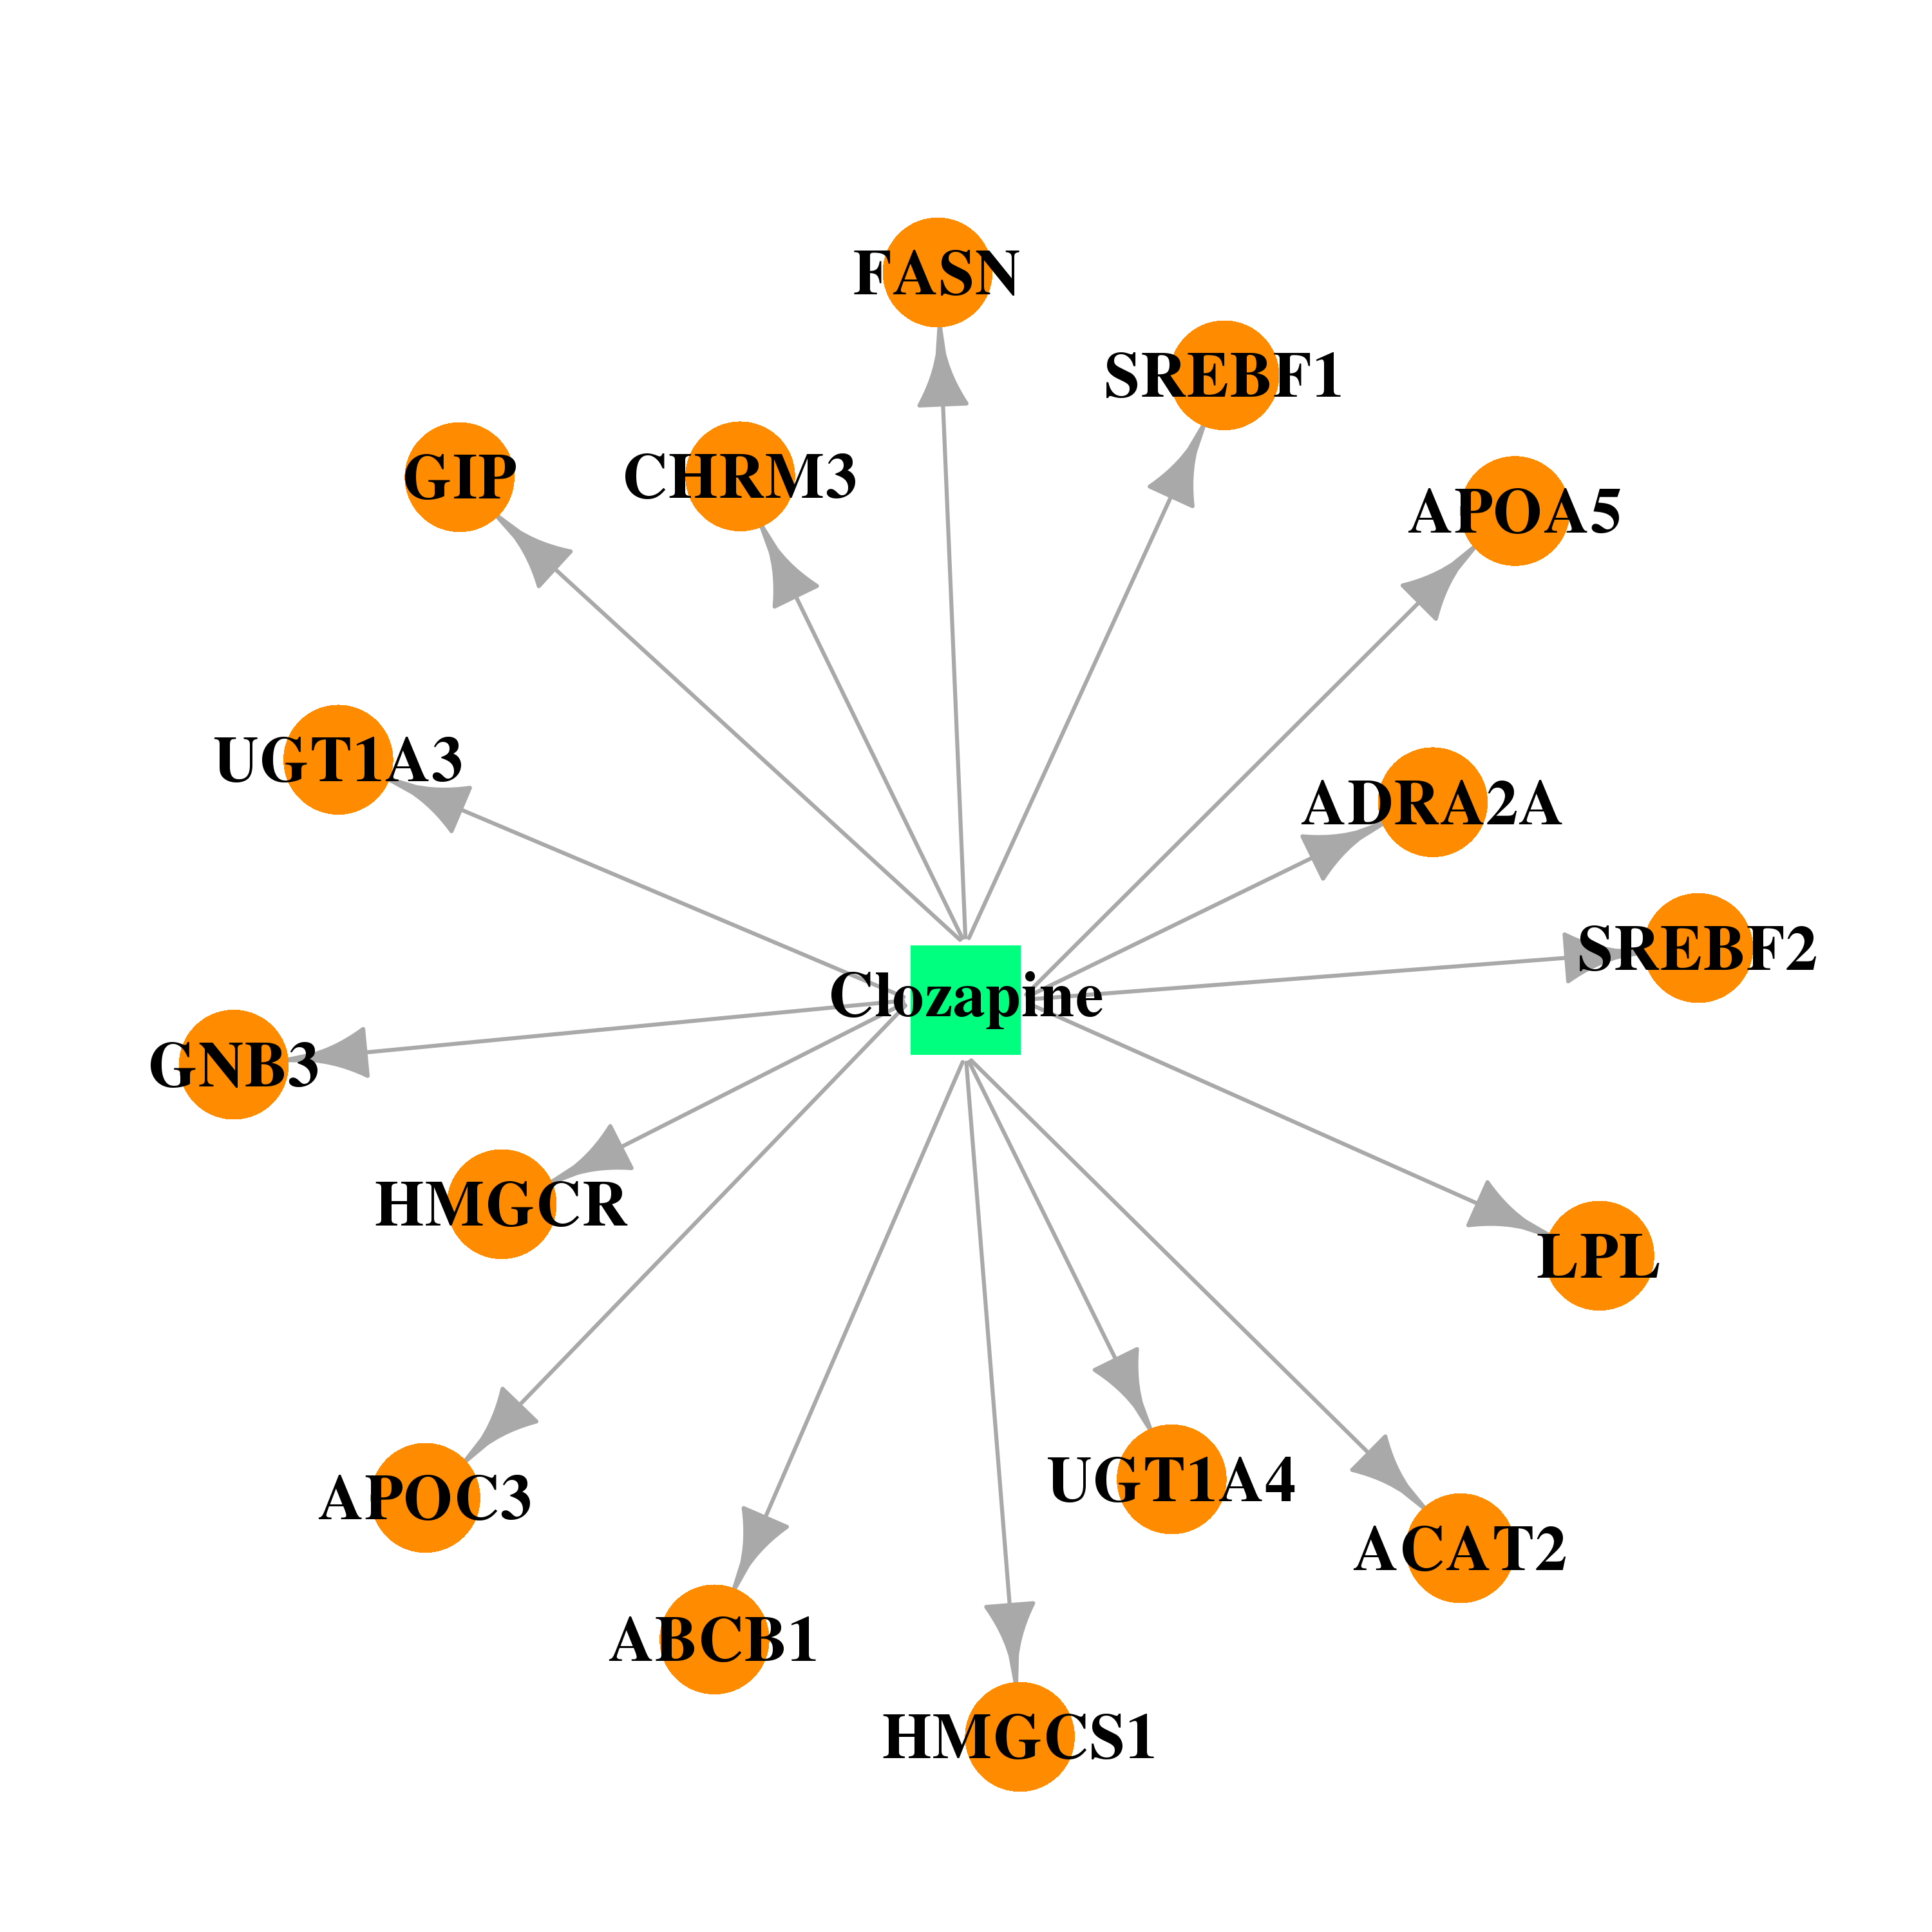 |  |
| DB00502 | fatty acid synthase | approved | Haloperidol |  |  |
| Top |
| Cross referenced IDs for FASN |
| * We obtained these cross-references from Uniprot database. It covers 150 different DBs, 18 categories. http://www.uniprot.org/help/cross_references_section |
: Open all cross reference information
|
Copyright © 2016-Present - The Univsersity of Texas Health Science Center at Houston @ |