|
|||||||||||||||||||||||||||||||||||||||||||||||||||||||||||||||||||||||||||||||||||||||||||||||||||||||||||||||||||||||||||||||||||||||||||||||||||||||||||||||||||||||||||||||||||||||||||||||||||||||||||||||||||||||||||||||||||||||||||||||||||||||||||||||||||||||||||||||||||||||||||||||||||||||||||||||||||||||
| |
| Phenotypic Information (metabolism pathway, cancer, disease, phenome) |
| |
| |
| Gene-Gene Network Information: Co-Expression Network, Interacting Genes & KEGG |
| |
|


| Gene Summary for MED19 |
| Basic gene info. | Gene symbol | MED19 |
| Gene name | mediator complex subunit 19 | |
| Synonyms | DT2P1G7|LCMR1 | |
| Cytomap | UCSC genome browser: 11q12.1 | |
| Genomic location | chr11 :57471186-57479673 | |
| Type of gene | protein-coding | |
| RefGenes | NM_153450.1, | |
| Ensembl id | ENSG00000156603 | |
| Description | lung cancer metastasis-related protein 1mediator of RNA polymerase II transcription subunit 19mediator of RNA polymerase II transcription, subunit 19 homolog | |
| Modification date | 20141207 | |
| dbXrefs | MIM : 612385 | |
| HGNC : HGNC | ||
| Ensembl : ENSG00000156603 | ||
| HPRD : 17477 | ||
| Vega : OTTHUMG00000167199 | ||
| Protein | UniProt: go to UniProt's Cross Reference DB Table | |
| Expression | CleanEX: HS_MED19 | |
| BioGPS: 219541 | ||
| Gene Expression Atlas: ENSG00000156603 | ||
| The Human Protein Atlas: ENSG00000156603 | ||
| Pathway | NCI Pathway Interaction Database: MED19 | |
| KEGG: MED19 | ||
| REACTOME: MED19 | ||
| ConsensusPathDB | ||
| Pathway Commons: MED19 | ||
| Metabolism | MetaCyc: MED19 | |
| HUMANCyc: MED19 | ||
| Regulation | Ensembl's Regulation: ENSG00000156603 | |
| miRBase: chr11 :57,471,186-57,479,673 | ||
| TargetScan: NM_153450 | ||
| cisRED: ENSG00000156603 | ||
| Context | iHOP: MED19 | |
| cancer metabolism search in PubMed: MED19 | ||
| UCL Cancer Institute: MED19 | ||
| Assigned class in ccmGDB | C | |
| Top |
| Phenotypic Information for MED19(metabolism pathway, cancer, disease, phenome) |
| Cancer | CGAP: MED19 |
| Familial Cancer Database: MED19 | |
| * This gene is included in those cancer gene databases. |
|
|
|
|
|
| . | |||||||||||||||||||||||||||||||||||||||||||||||||||||||||||||||||||||||||||||||||||||||||||||||||||||||||||||||||||||||||||||||||||||||||||||||||||||||||||||||||||||||||||||||||||||||||||||||||||||||||||||||||||||||||||||||||||||||||||||||||||||||||||||||||||||||||||||||||||||||||||||||||||||||||||||||||
Oncogene 1 | Significant driver gene in | ||||||||||||||||||||||||||||||||||||||||||||||||||||||||||||||||||||||||||||||||||||||||||||||||||||||||||||||||||||||||||||||||||||||||||||||||||||||||||||||||||||||||||||||||||||||||||||||||||||||||||||||||||||||||||||||||||||||||||||||||||||||||||||||||||||||||||||||||||||||||||||||||||||||||||||||||||||||
| cf) number; DB name 1 Oncogene; http://nar.oxfordjournals.org/content/35/suppl_1/D721.long, 2 Tumor Suppressor gene; https://bioinfo.uth.edu/TSGene/, 3 Cancer Gene Census; http://www.nature.com/nrc/journal/v4/n3/abs/nrc1299.html, 4 CancerGenes; http://nar.oxfordjournals.org/content/35/suppl_1/D721.long, 5 Network of Cancer Gene; http://ncg.kcl.ac.uk/index.php, 1Therapeutic Vulnerabilities in Cancer; http://cbio.mskcc.org/cancergenomics/statius/ |
| REACTOME_METABOLISM_OF_LIPIDS_AND_LIPOPROTEINS | |
| OMIM | |
| Orphanet | |
| Disease | KEGG Disease: MED19 |
| MedGen: MED19 (Human Medical Genetics with Condition) | |
| ClinVar: MED19 | |
| Phenotype | MGI: MED19 (International Mouse Phenotyping Consortium) |
| PhenomicDB: MED19 | |
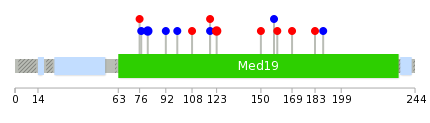
| Mutations for MED19 |
| * Under tables are showing count per each tissue to give us broad intuition about tissue specific mutation patterns.You can go to the detailed page for each mutation database's web site. |
| There's no structural variation information in COSMIC data for this gene. |
| * From mRNA Sanger sequences, Chitars2.0 arranged chimeric transcripts. This table shows MED19 related fusion information. |
| ID | Head Gene | Tail Gene | Accession | Gene_a | qStart_a | qEnd_a | Chromosome_a | tStart_a | tEnd_a | Gene_a | qStart_a | qEnd_a | Chromosome_a | tStart_a | tEnd_a |
| Top |
| Mutation type/ Tissue ID | brca | cns | cerv | endome | haematopo | kidn | Lintest | liver | lung | ns | ovary | pancre | prost | skin | stoma | thyro | urina | |||
| Total # sample | 1 | 1 | ||||||||||||||||||
| GAIN (# sample) | 1 | 1 | ||||||||||||||||||
| LOSS (# sample) |
| cf) Tissue ID; Tissue type (1; Breast, 2; Central_nervous_system, 3; Cervix, 4; Endometrium, 5; Haematopoietic_and_lymphoid_tissue, 6; Kidney, 7; Large_intestine, 8; Liver, 9; Lung, 10; NS, 11; Ovary, 12; Pancreas, 13; Prostate, 14; Skin, 15; Stomach, 16; Thyroid, 17; Urinary_tract) |
| Top |
|
 |
| Top |
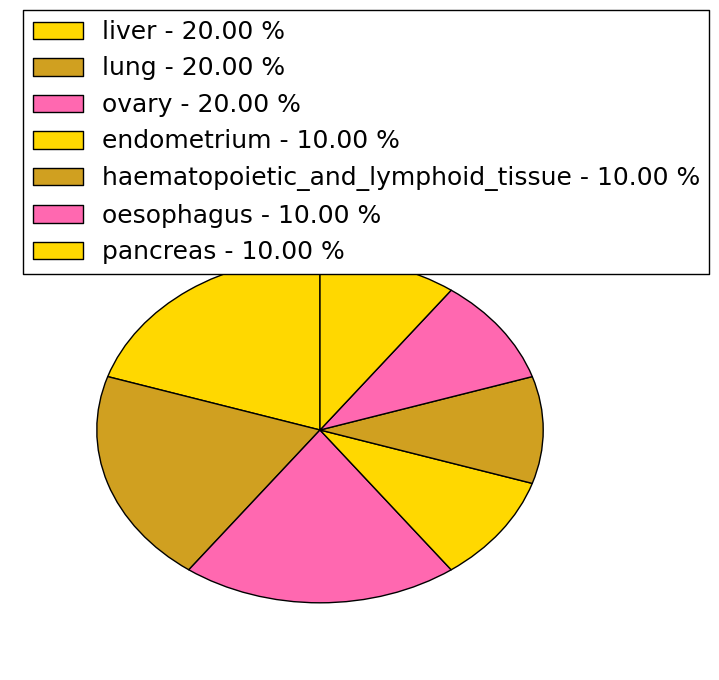
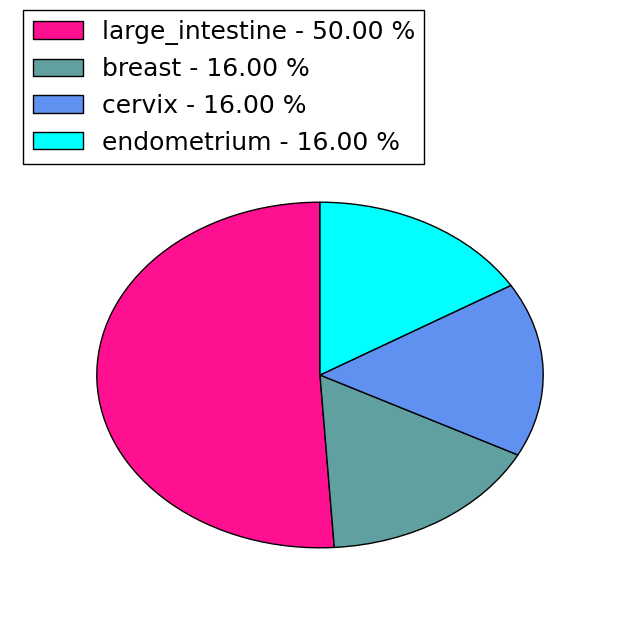
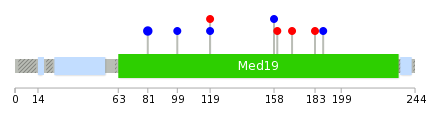
| Stat. for Non-Synonymous SNVs (# total SNVs=10) | (# total SNVs=6) |
 |  |
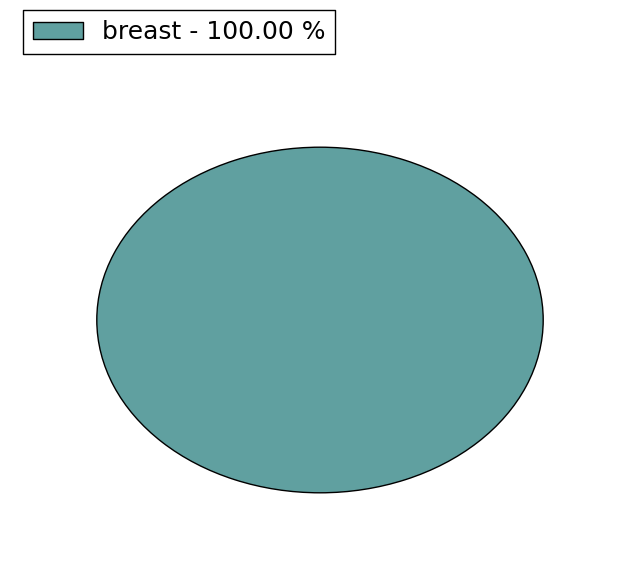
(# total SNVs=0) | (# total SNVs=1) |
 |
| Top |
| * When you move the cursor on each content, you can see more deailed mutation information on the Tooltip. Those are primary_site,primary_histology,mutation(aa),pubmedID. |
| GRCh37 position | Mutation(aa) | Unique sampleID count |
| chr11:57472676-57472676 | p.T81T | 2 |
| chr11:57472551-57472551 | p.D123A | 2 |
| chr11:57472215-57472215 | p.R183C | 1 |
| chr11:57472643-57472643 | p.A92A | 1 |
| chr11:57472256-57472256 | p.Q169L | 1 |
| chr11:57472283-57472283 | p.P160Q | 1 |
| chr11:57472688-57472688 | p.L77L | 1 |
| chr11:57472445-57472445 | p.P158P | 1 |
| chr11:57472693-57472693 | p.E76Q | 1 |
| chr11:57472466-57472467 | p.F152fs*25 | 1 |
| Top |
|
 |
| Point Mutation/ Tissue ID | 1 | 2 | 3 | 4 | 5 | 6 | 7 | 8 | 9 | 10 | 11 | 12 | 13 | 14 | 15 | 16 | 17 | 18 | 19 | 20 |
| # sample | 1 | 3 | 1 | 2 | 1 | 2 | ||||||||||||||
| # mutation | 1 | 3 | 1 | 2 | 1 | 2 | ||||||||||||||
| nonsynonymous SNV | 1 | 2 | 1 | |||||||||||||||||
| synonymous SNV | 1 | 3 | 1 | 1 |
| cf) Tissue ID; Tissue type (1; BLCA[Bladder Urothelial Carcinoma], 2; BRCA[Breast invasive carcinoma], 3; CESC[Cervical squamous cell carcinoma and endocervical adenocarcinoma], 4; COAD[Colon adenocarcinoma], 5; GBM[Glioblastoma multiforme], 6; Glioma Low Grade, 7; HNSC[Head and Neck squamous cell carcinoma], 8; KICH[Kidney Chromophobe], 9; KIRC[Kidney renal clear cell carcinoma], 10; KIRP[Kidney renal papillary cell carcinoma], 11; LAML[Acute Myeloid Leukemia], 12; LUAD[Lung adenocarcinoma], 13; LUSC[Lung squamous cell carcinoma], 14; OV[Ovarian serous cystadenocarcinoma ], 15; PAAD[Pancreatic adenocarcinoma], 16; PRAD[Prostate adenocarcinoma], 17; SKCM[Skin Cutaneous Melanoma], 18:STAD[Stomach adenocarcinoma], 19:THCA[Thyroid carcinoma], 20:UCEC[Uterine Corpus Endometrial Carcinoma]) |
| Top |
| * We represented just top 10 SNVs. When you move the cursor on each content, you can see more deailed mutation information on the Tooltip. Those are primary_site, primary_histology, mutation(aa), pubmedID. |
| Genomic Position | Mutation(aa) | Unique sampleID count |
| chr11:57472676 | p.T81T | 2 |
| chr11:57472215 | p.R183S | 1 |
| chr11:57472256 | p.Q169L | 1 |
| chr11:57472283 | p.P160Q | 1 |
| chr11:57472445 | p.P158P | 1 |
| chr11:57472562 | p.P119P | 1 |
| chr11:57472563 | p.P119L | 1 |
| chr11:57472622 | p.K99K | 1 |
| chr11:57472198 | p.V188V | 1 |
| * Copy number data were extracted from TCGA using R package TCGA-Assembler. The URLs of all public data files on TCGA DCC data server were gathered on Jan-05-2015. Function ProcessCNAData in TCGA-Assembler package was used to obtain gene-level copy number value which is calculated as the average copy number of the genomic region of a gene. |
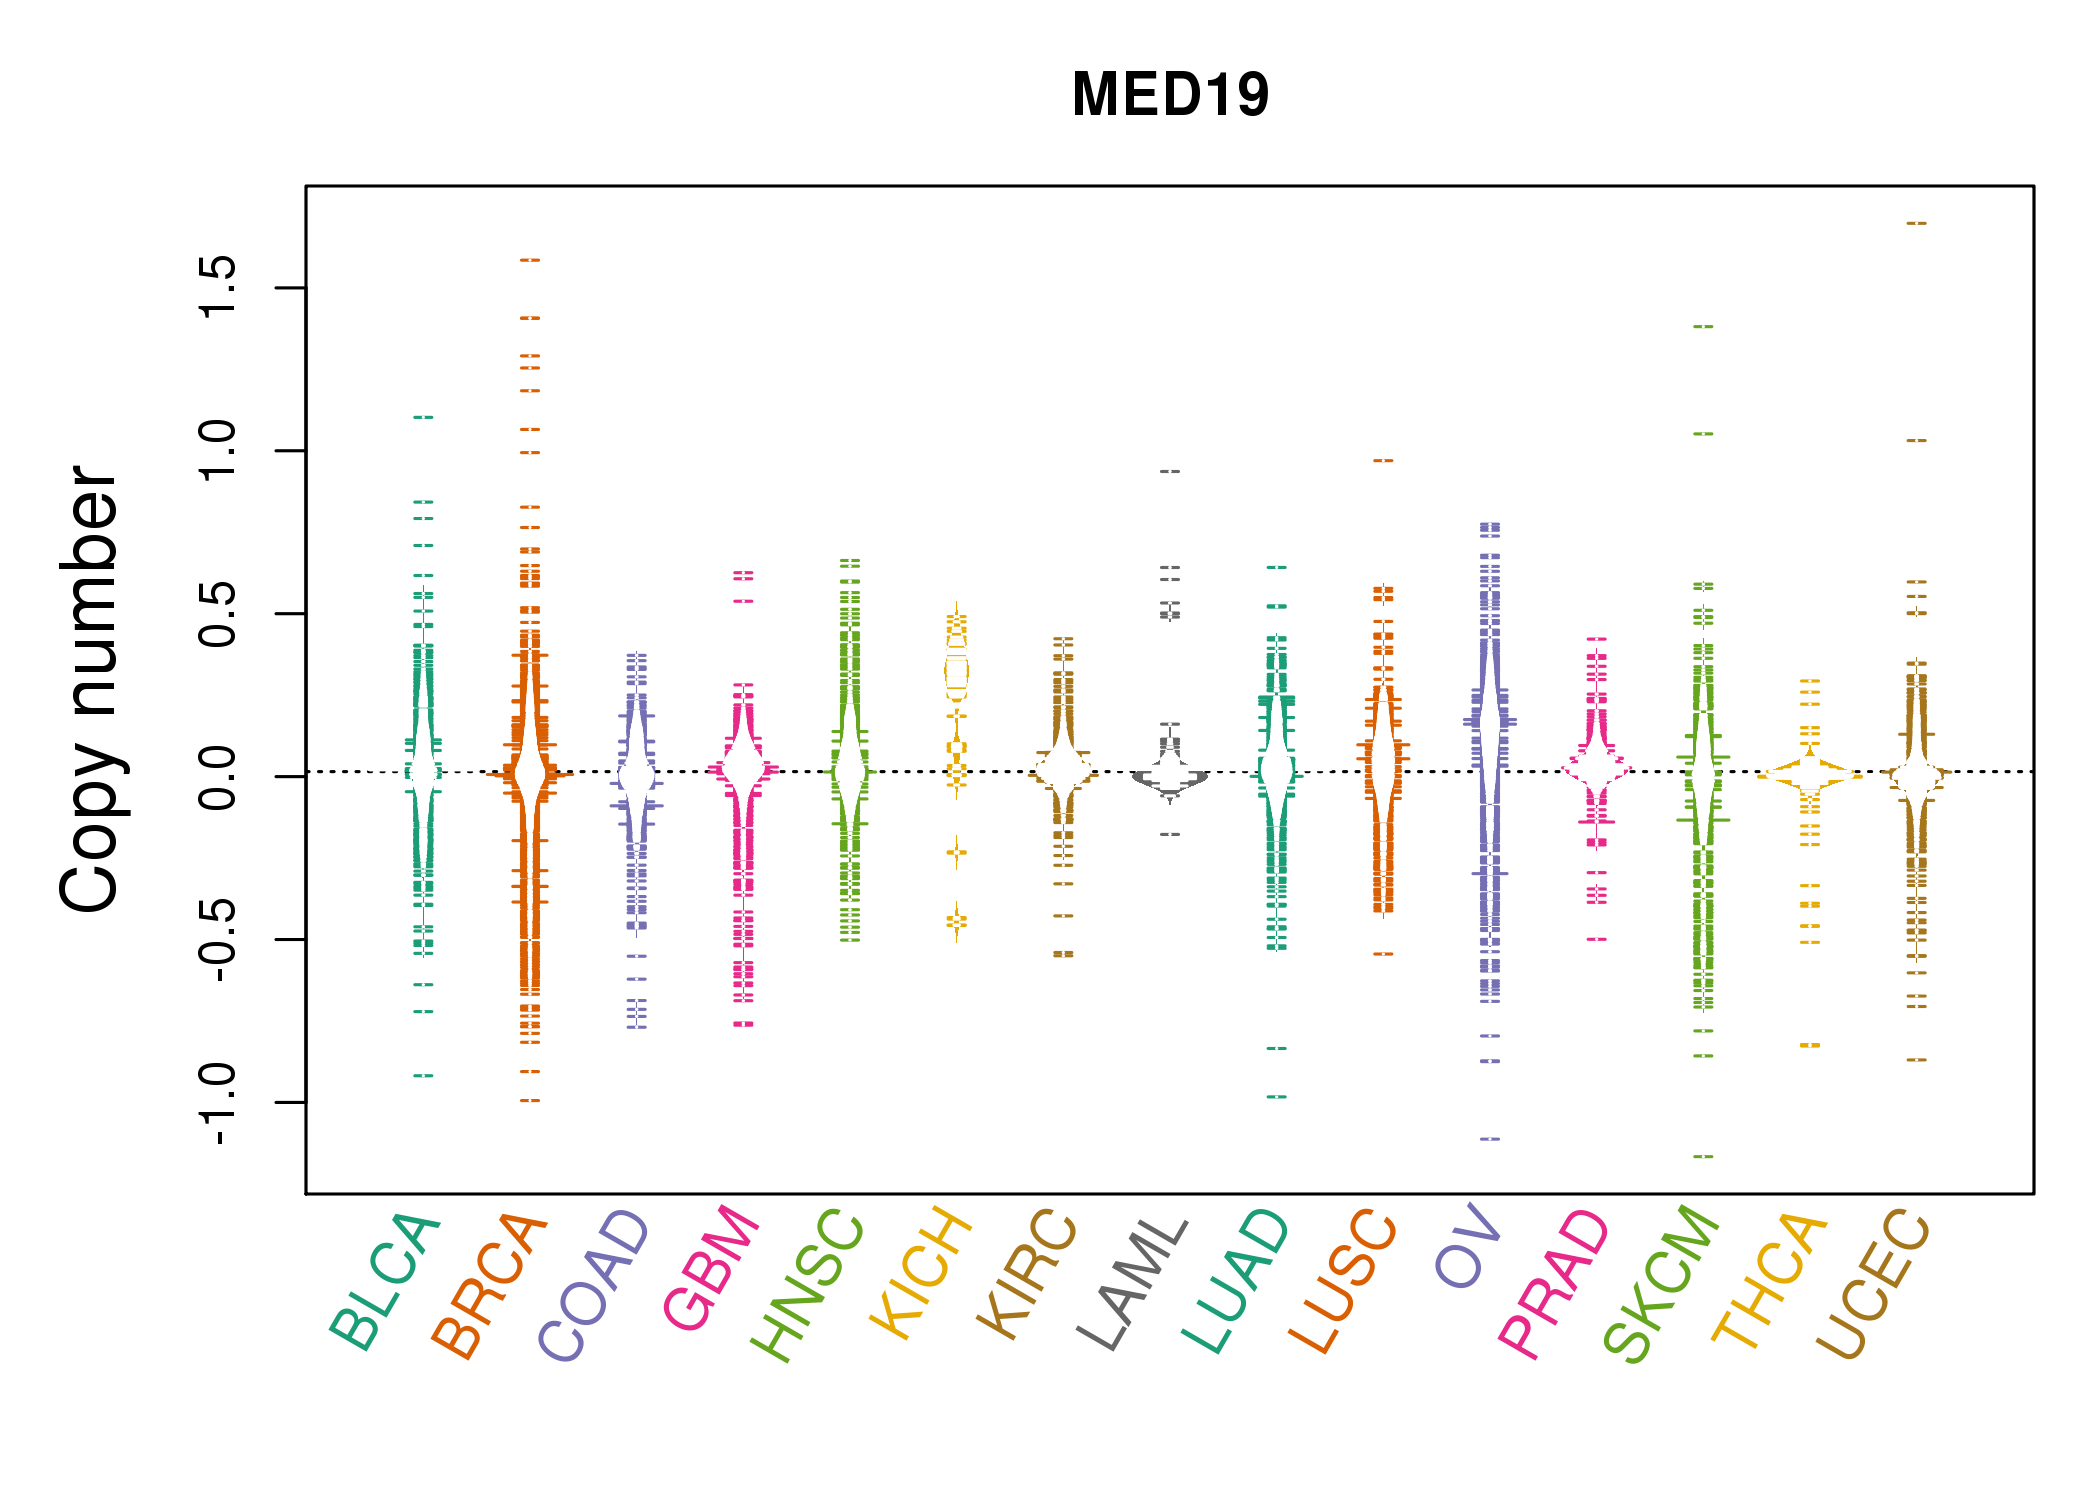 |
| cf) Tissue ID[Tissue type]: BLCA[Bladder Urothelial Carcinoma], BRCA[Breast invasive carcinoma], CESC[Cervical squamous cell carcinoma and endocervical adenocarcinoma], COAD[Colon adenocarcinoma], GBM[Glioblastoma multiforme], Glioma Low Grade, HNSC[Head and Neck squamous cell carcinoma], KICH[Kidney Chromophobe], KIRC[Kidney renal clear cell carcinoma], KIRP[Kidney renal papillary cell carcinoma], LAML[Acute Myeloid Leukemia], LUAD[Lung adenocarcinoma], LUSC[Lung squamous cell carcinoma], OV[Ovarian serous cystadenocarcinoma ], PAAD[Pancreatic adenocarcinoma], PRAD[Prostate adenocarcinoma], SKCM[Skin Cutaneous Melanoma], STAD[Stomach adenocarcinoma], THCA[Thyroid carcinoma], UCEC[Uterine Corpus Endometrial Carcinoma] |
| Top |
| Gene Expression for MED19 |
| * CCLE gene expression data were extracted from CCLE_Expression_Entrez_2012-10-18.res: Gene-centric RMA-normalized mRNA expression data. |
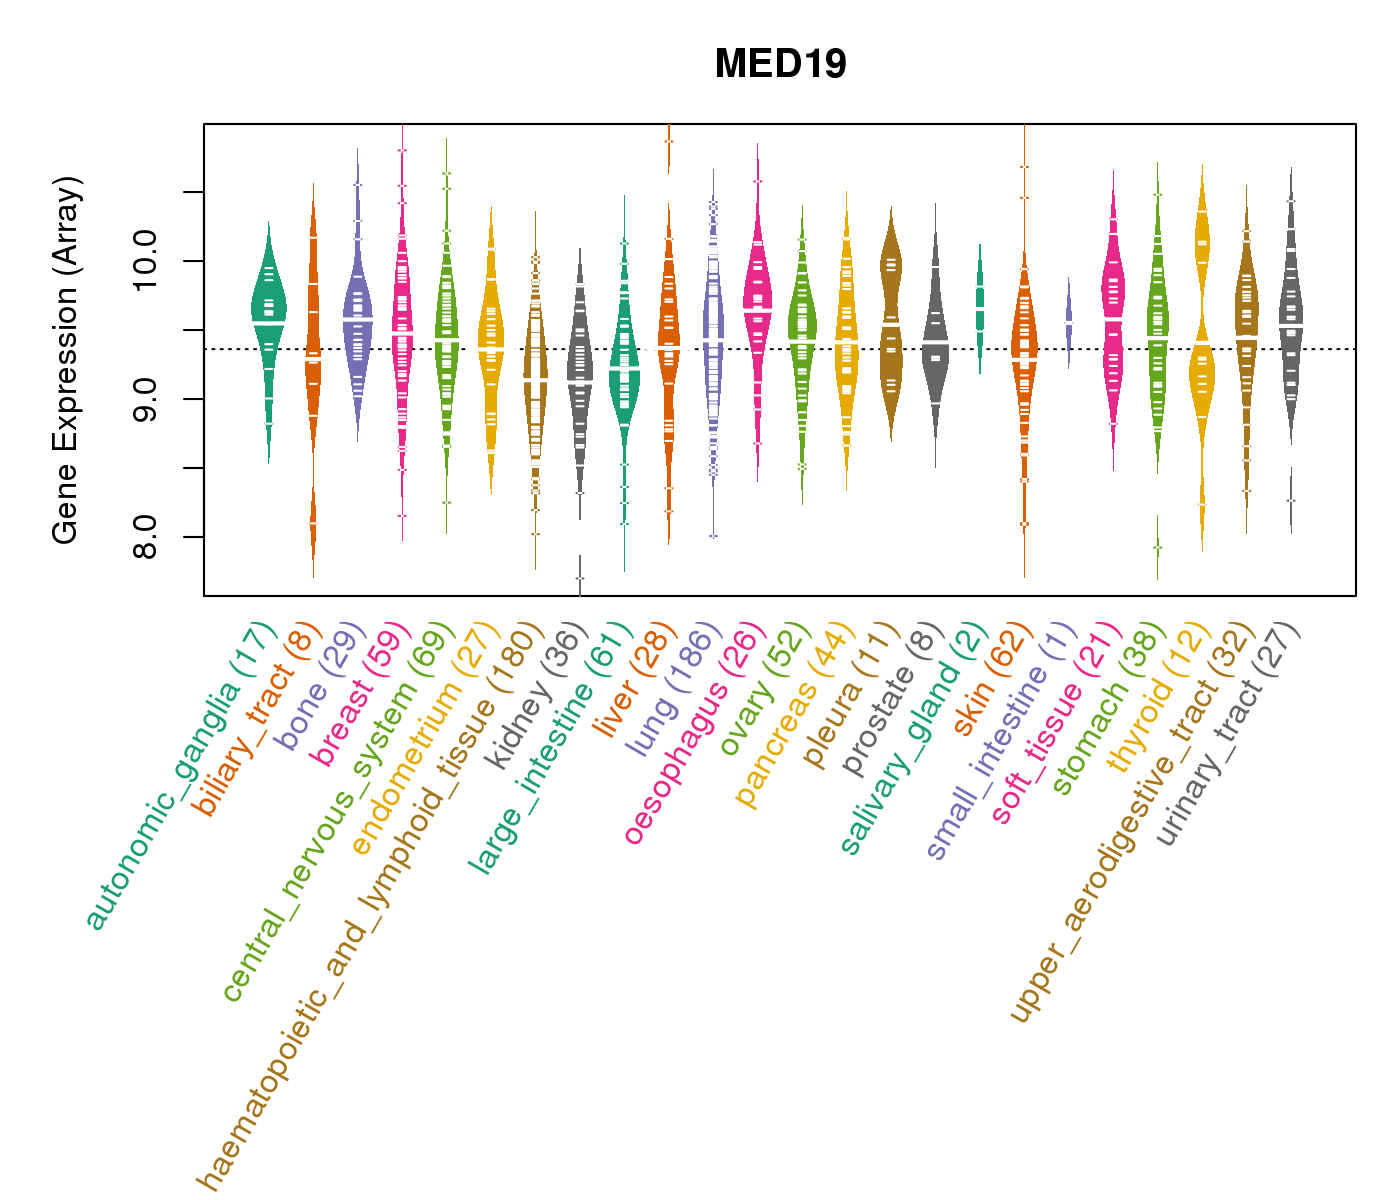 |
| * Normalized gene expression data of RNASeqV2 was extracted from TCGA using R package TCGA-Assembler. The URLs of all public data files on TCGA DCC data server were gathered at Jan-05-2015. Only eight cancer types have enough normal control samples for differential expression analysis. (t test, adjusted p<0.05 (using Benjamini-Hochberg FDR)) |
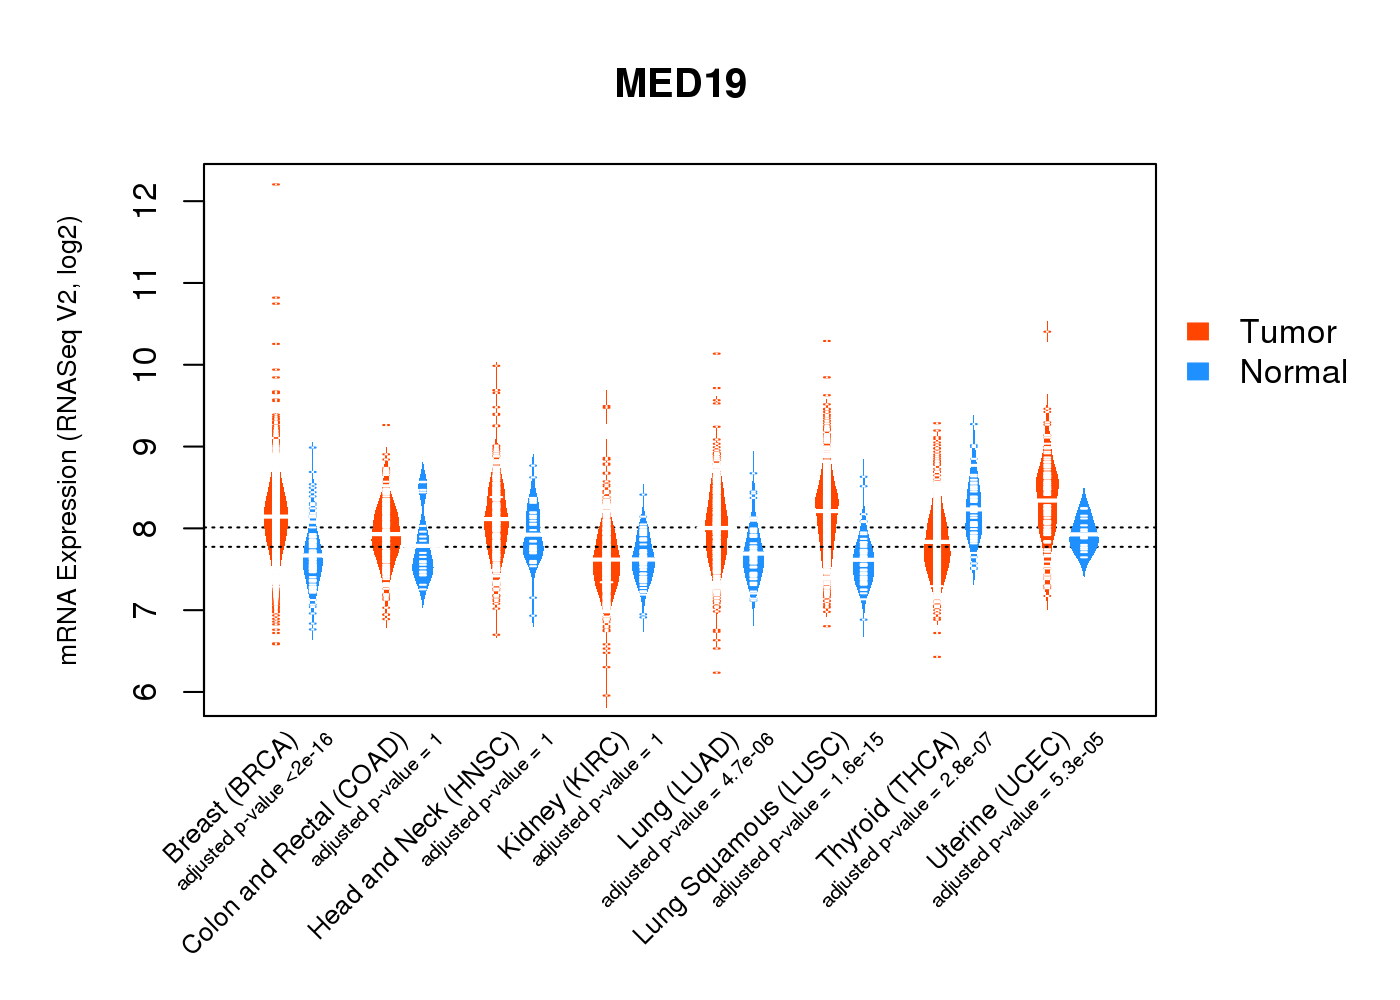 |
| Top |
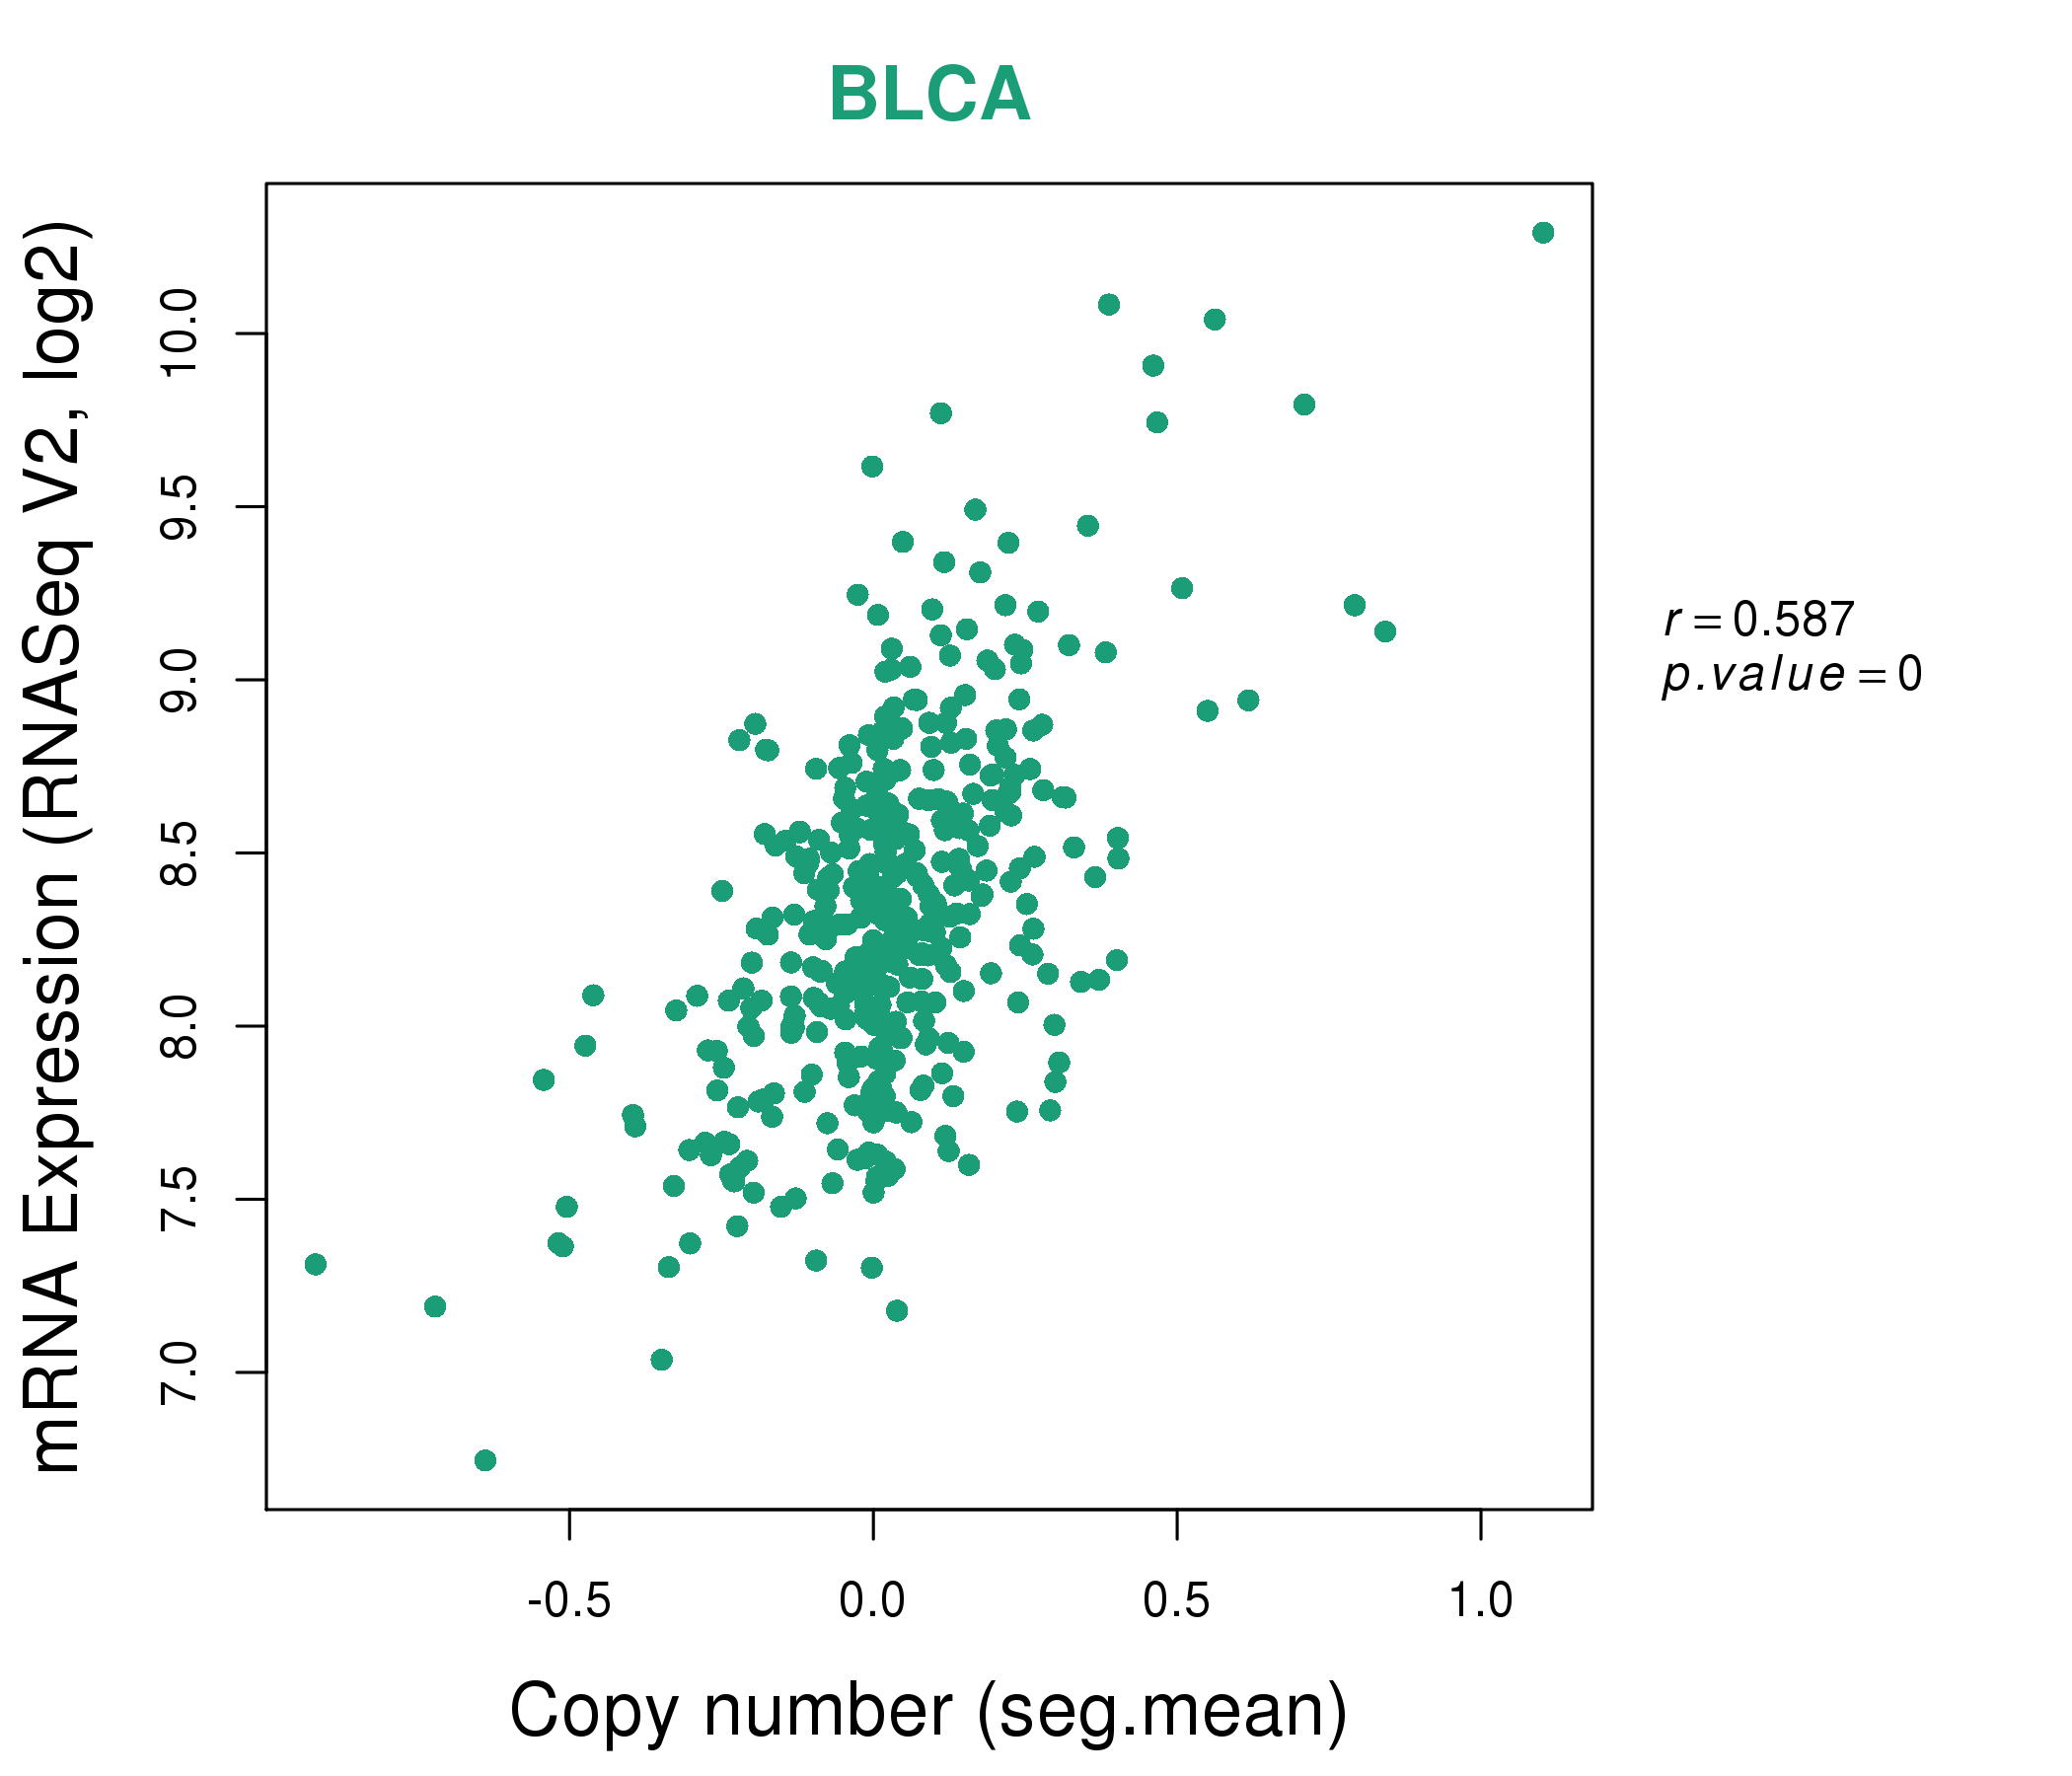
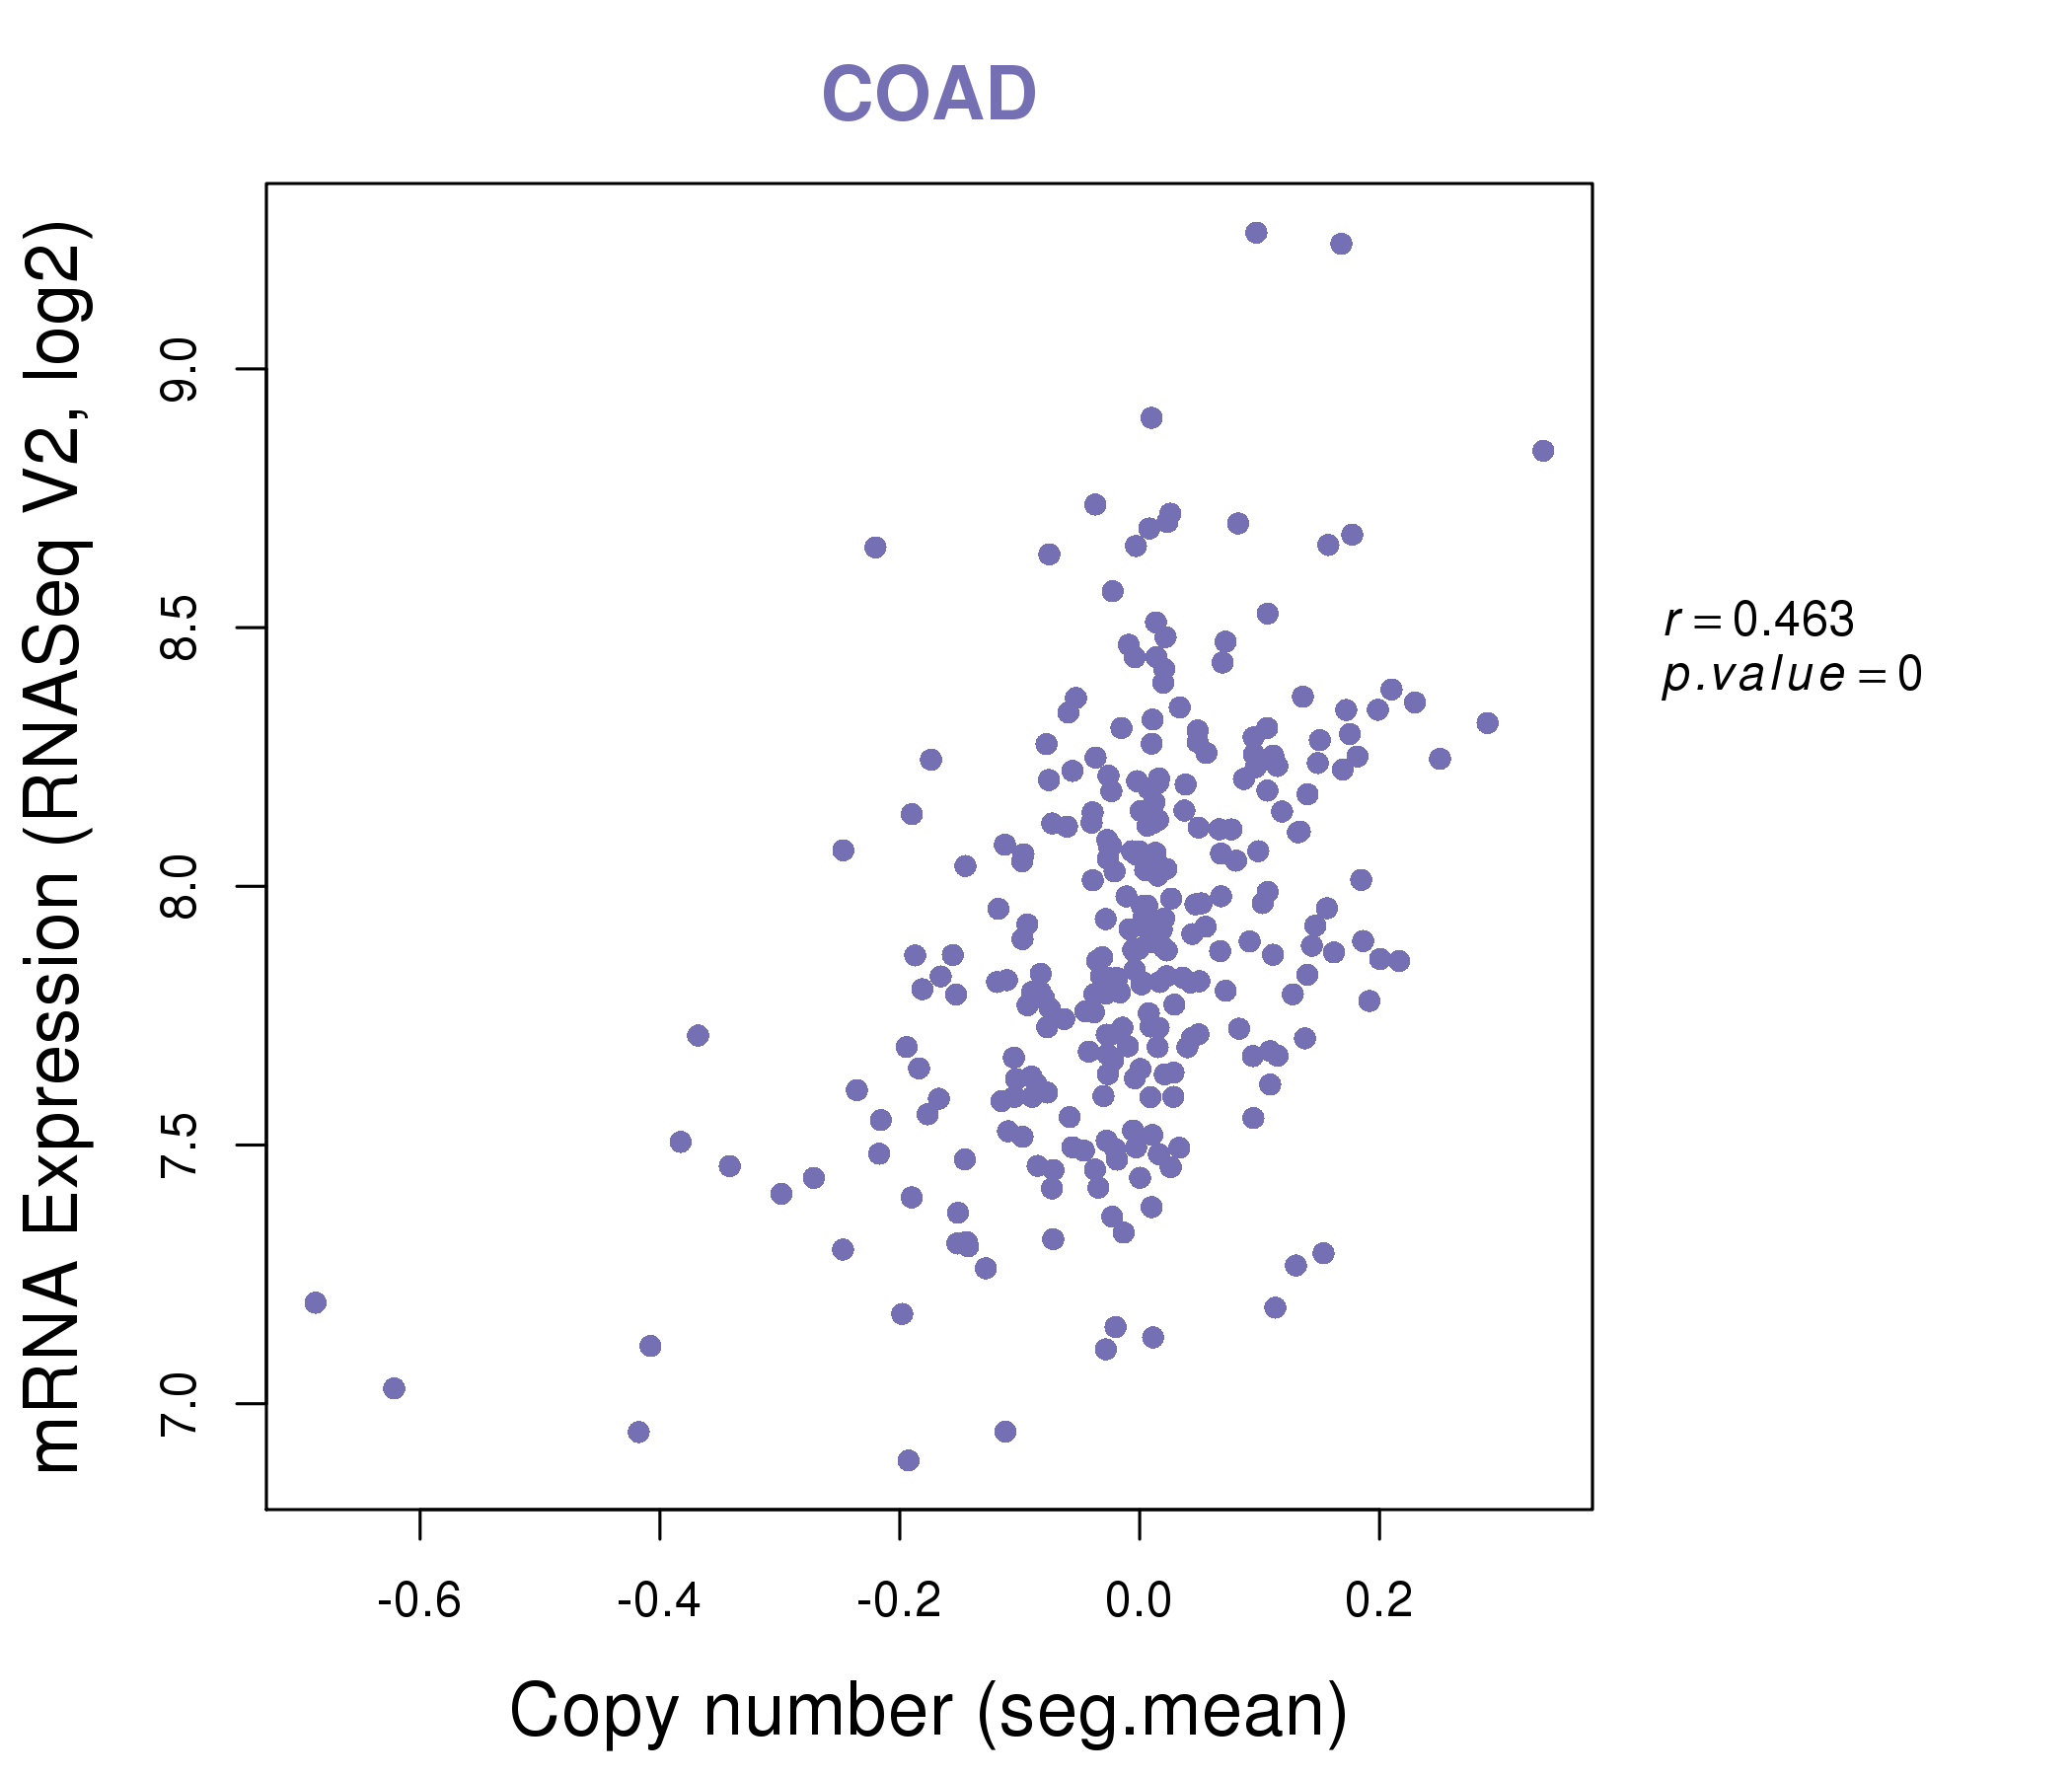
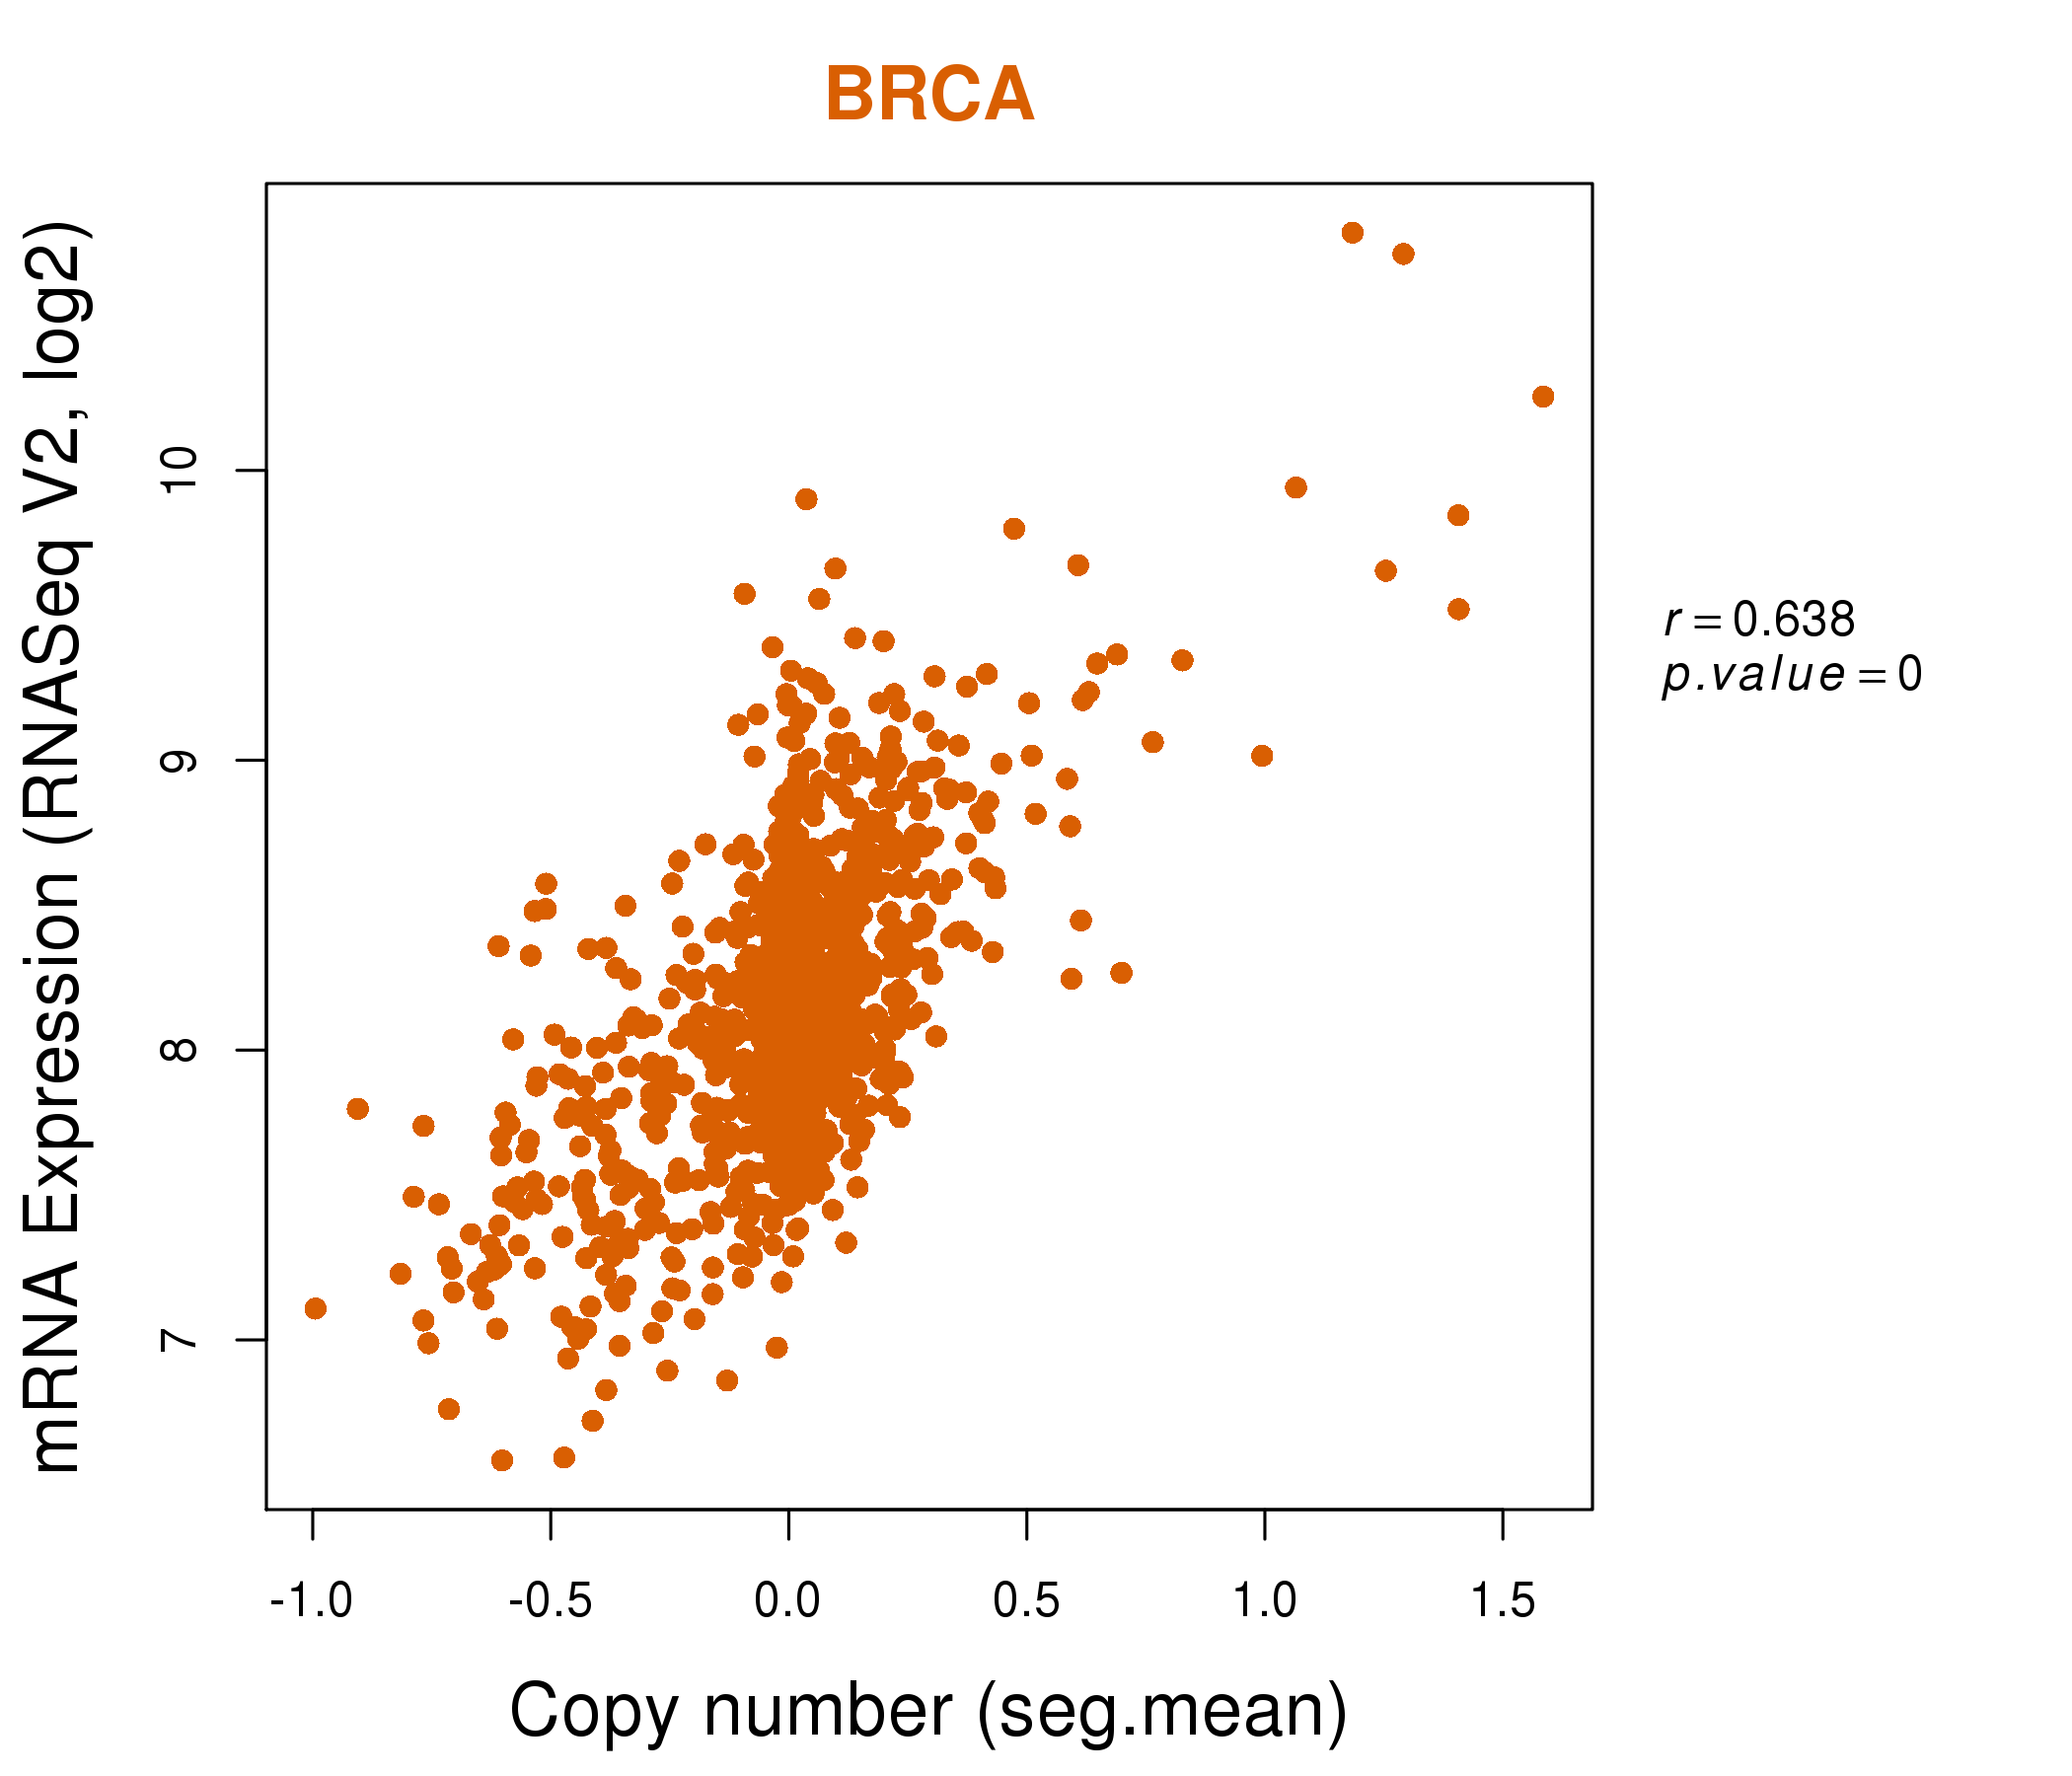
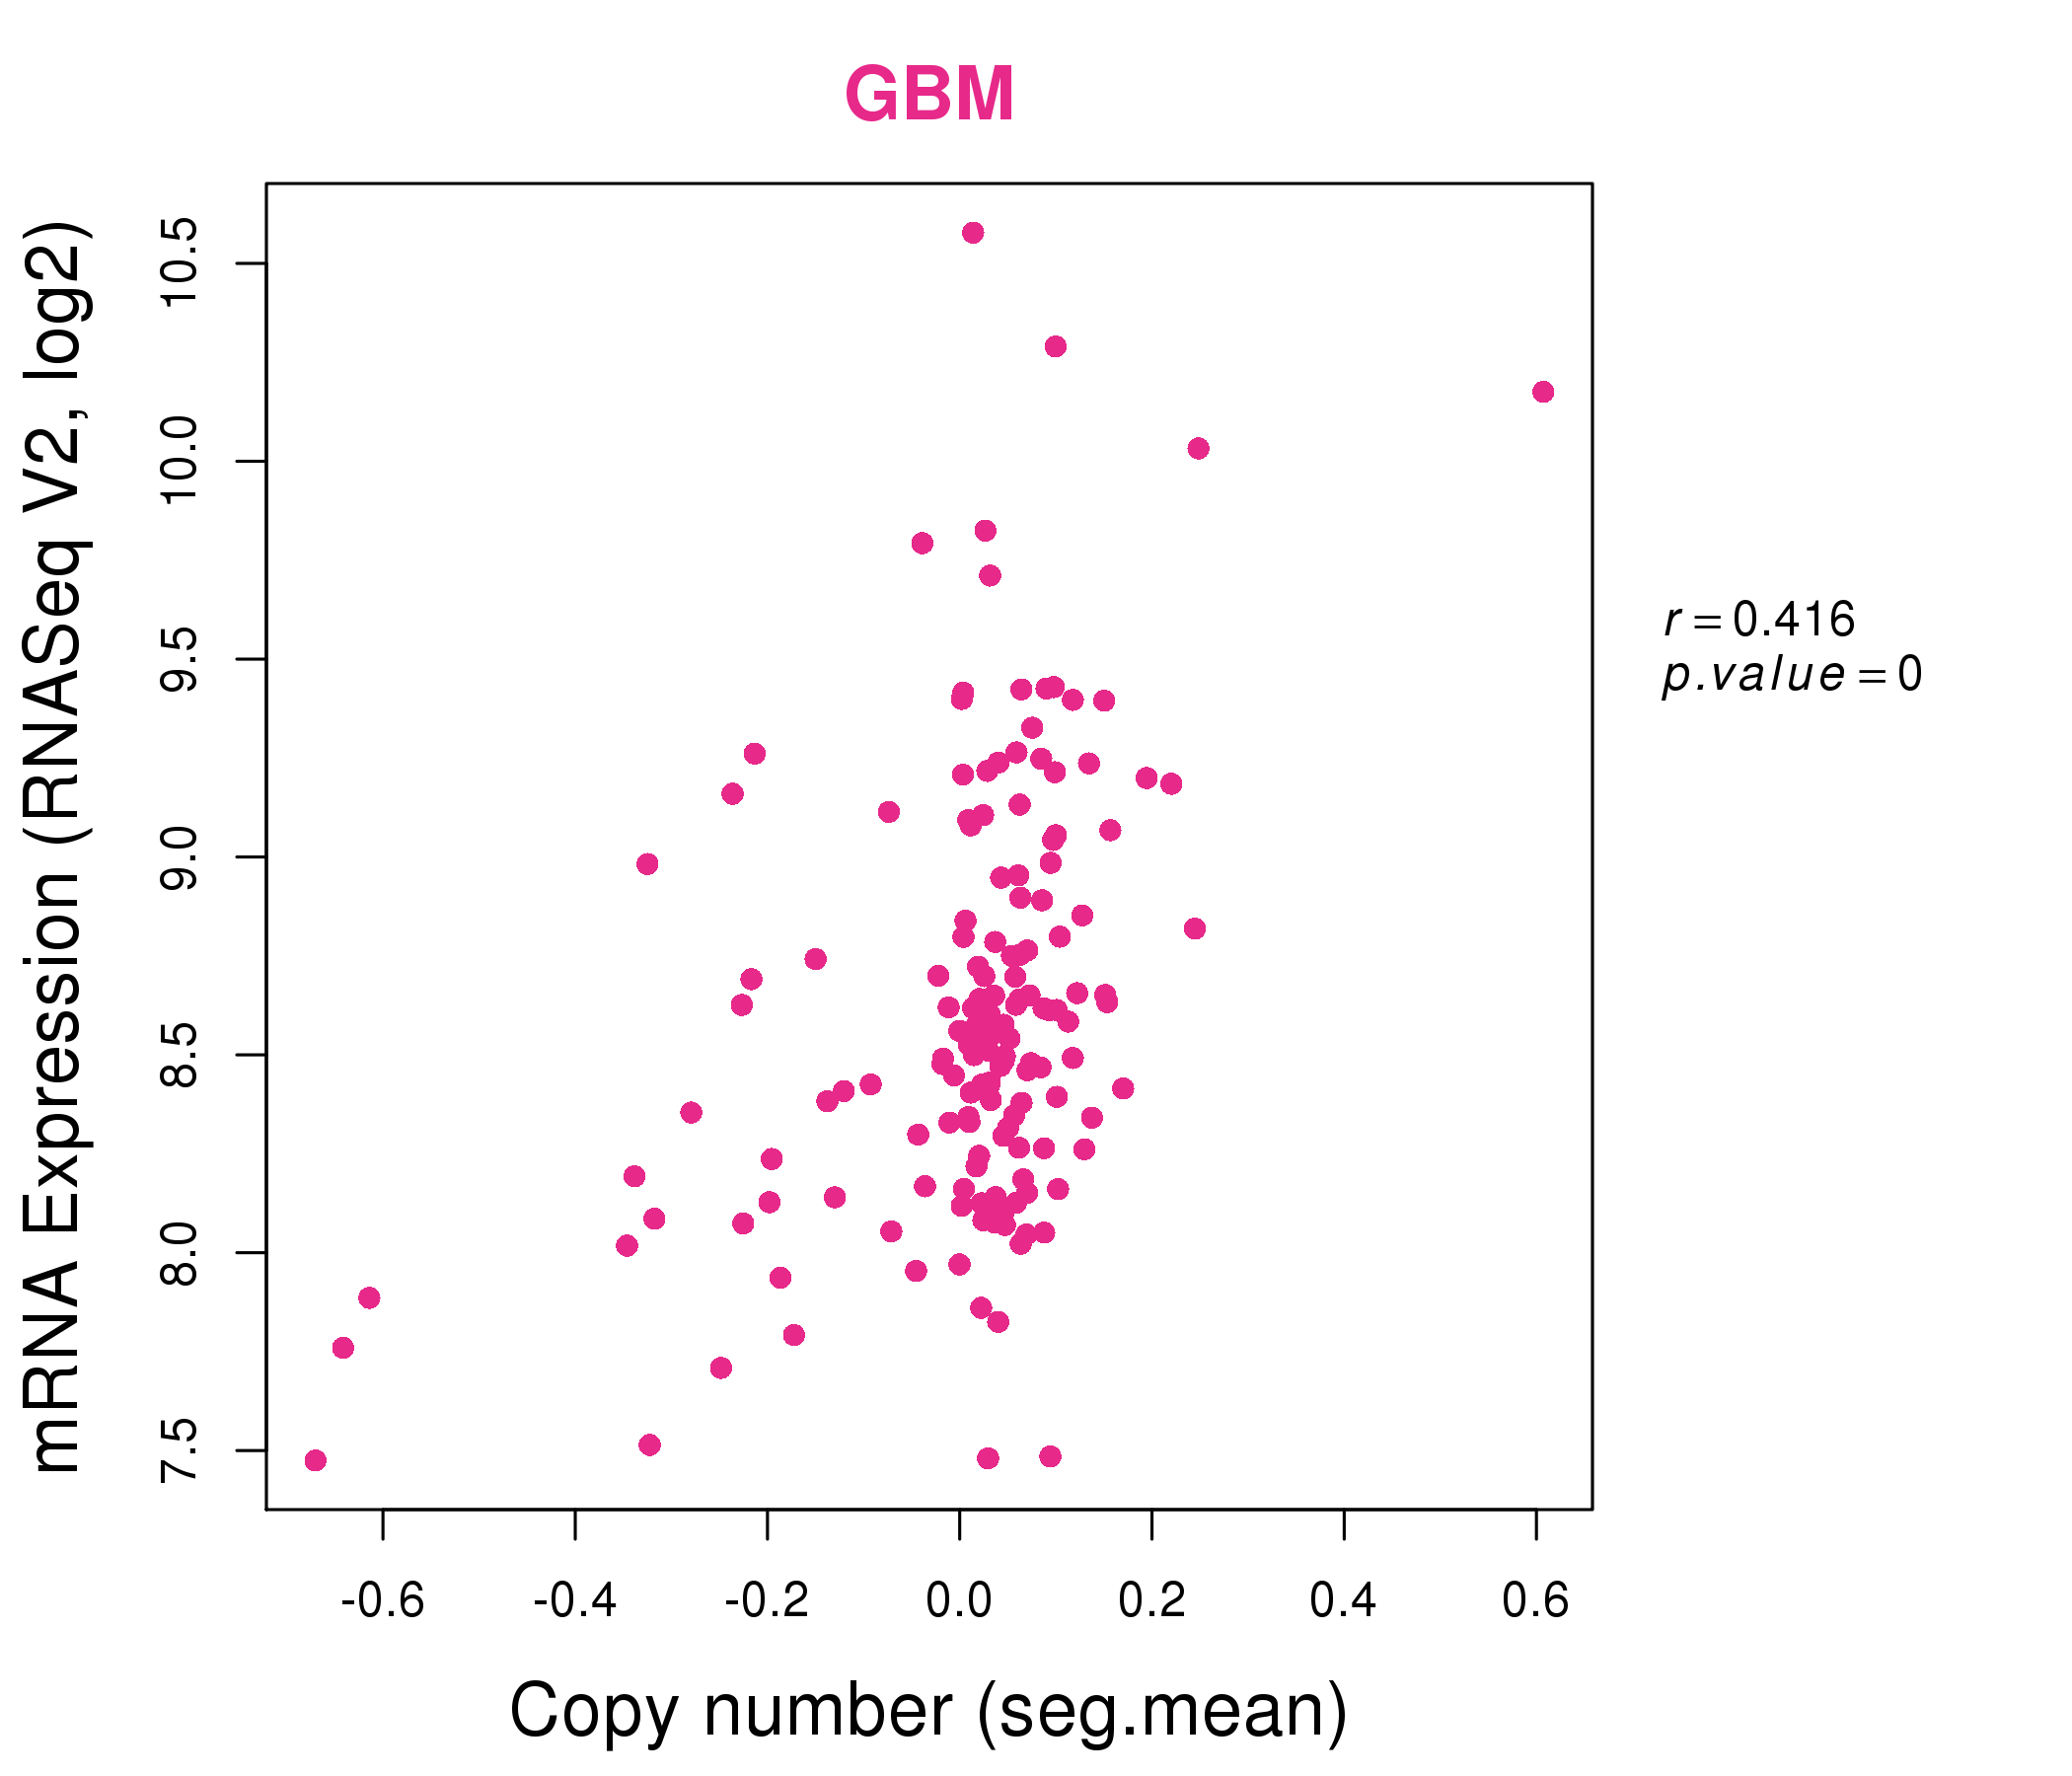
| * This plots show the correlation between CNV and gene expression. |
: Open all plots for all cancer types
 |
|
 |
|
| Top |
| Gene-Gene Network Information |
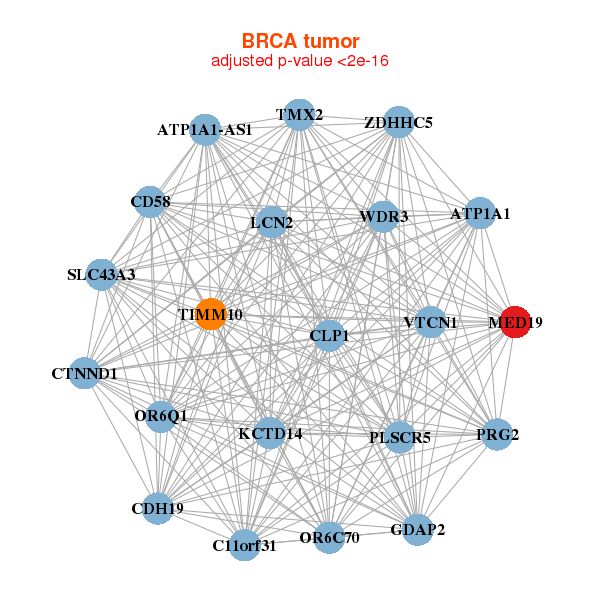
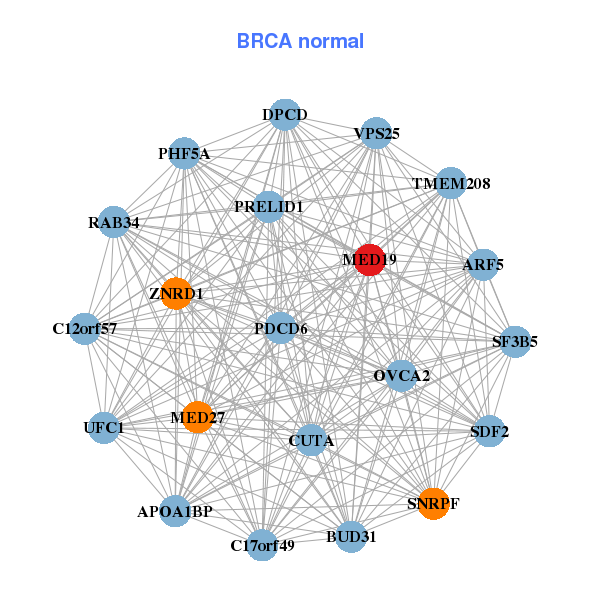
| * Co-Expression network figures were drawn using R package igraph. Only the top 20 genes with the highest correlations were shown. Red circle: input gene, orange circle: cell metabolism gene, sky circle: other gene |
: Open all plots for all cancer types
 |
|
| ATP1A1,C11orf31,ATP1A1-AS1,CD58,CDH19,CLP1,CTNND1, GDAP2,KCTD14,LCN2,MED19,OR6C70,OR6Q1,PLSCR5, PRG2,SLC43A3,TIMM10,TMX2,VTCN1,WDR3,ZDHHC5 | APOA1BP,ARF5,BUD31,C12orf57,C17orf49,CUTA,DPCD, MED19,MED27,OVCA2,PDCD6,PHF5A,PRELID1,RAB34, SDF2,SF3B5,SNRPF,TMEM208,UFC1,VPS25,ZNRD1 |
 |
|
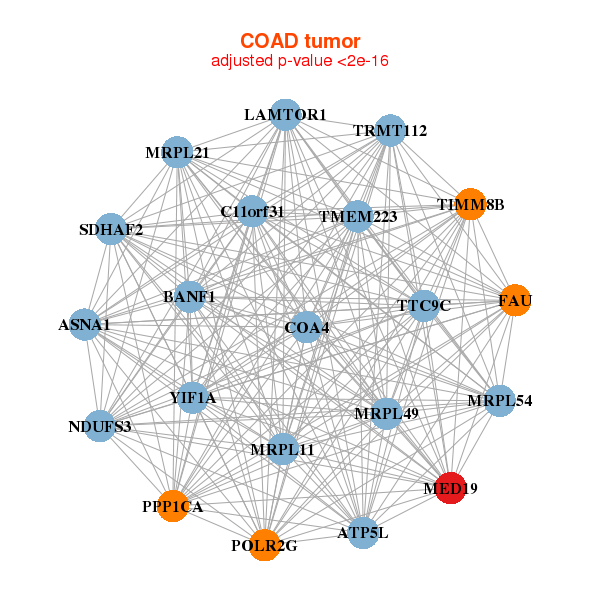
| ASNA1,ATP5L,BANF1,C11orf31,LAMTOR1,COA4,FAU, MED19,MRPL11,MRPL21,MRPL49,MRPL54,NDUFS3,POLR2G, PPP1CA,SDHAF2,TIMM8B,TMEM223,TRMT112,TTC9C,YIF1A | ASNA1,ATP6V0B,BID,BUD31,C1orf174,TIMMDC1,TMEM261, CHCHD2,DCTPP1,DPM3,FAM58A,FAM96B,LSM7,LYRM2, MED19,MRPL54,NDUFA7,RPSAP58,SERF2,SSR2,STOML2 |

| * Co-Expression network figures were drawn using R package igraph. Only the top 20 genes with the highest correlations were shown. Red circle: input gene, orange circle: cell metabolism gene, sky circle: other gene |
: Open all plots for all cancer types
| Top |
: Open all interacting genes' information including KEGG pathway for all interacting genes from DAVID
| Top |
| Pharmacological Information for MED19 |
| There's no related Drug. |
| Top |
| Cross referenced IDs for MED19 |
| * We obtained these cross-references from Uniprot database. It covers 150 different DBs, 18 categories. http://www.uniprot.org/help/cross_references_section |
: Open all cross reference information
|
Copyright © 2016-Present - The Univsersity of Texas Health Science Center at Houston @ |