|
||||||||||||||||||||
| |
| Phenotypic Information (metabolism pathway, cancer, disease, phenome) |
| |
| |
| Gene-Gene Network Information: Co-Expression Network, Interacting Genes & KEGG |
| |
|


| Gene Summary for FAU |
| Basic gene info. | Gene symbol | FAU |
| Gene name | Finkel-Biskis-Reilly murine sarcoma virus (FBR-MuSV) ubiquitously expressed | |
| Synonyms | FAU1|Fub1|Fubi|MNSFbeta|RPS30|S30|asr1 | |
| Cytomap | UCSC genome browser: 11q13 | |
| Genomic location | chr11 :64888098-64889672 | |
| Type of gene | protein-coding | |
| RefGenes | NM_001997.4, | |
| Ensembl id | ENSG00000149806 | |
| Description | 40S ribosomal protein S30FAU-encoded ubiquitin-like proteinFBR-MuSV-associated ubiquitously expressedFinkel-Biskis-Reilly murine sarcoma virus (FBR-MuSV) ubiquitously expressed (fox derived)monoclonal nonspecific suppressor factor betaribosomal prote | |
| Modification date | 20141207 | |
| dbXrefs | MIM : 134690 | |
| HGNC : HGNC | ||
| HPRD : 00002 | ||
| Protein | UniProt: P35544 go to UniProt's Cross Reference DB Table | |
| Expression | CleanEX: HS_FAU | |
| BioGPS: 2197 | ||
| Gene Expression Atlas: ENSG00000149806 | ||
| The Human Protein Atlas: ENSG00000149806 | ||
| Pathway | NCI Pathway Interaction Database: FAU | |
| KEGG: FAU | ||
| REACTOME: FAU | ||
| ConsensusPathDB | ||
| Pathway Commons: FAU | ||
| Metabolism | MetaCyc: FAU | |
| HUMANCyc: FAU | ||
| Regulation | Ensembl's Regulation: ENSG00000149806 | |
| miRBase: chr11 :64,888,098-64,889,672 | ||
| TargetScan: NM_001997 | ||
| cisRED: ENSG00000149806 | ||
| Context | iHOP: FAU | |
| cancer metabolism search in PubMed: FAU | ||
| UCL Cancer Institute: FAU | ||
| Assigned class in ccmGDB | B - This gene belongs to cancer gene. | |
| Top |
| Phenotypic Information for FAU(metabolism pathway, cancer, disease, phenome) |
| Cancer | CGAP: FAU |
| Familial Cancer Database: FAU | |
| * This gene is included in those cancer gene databases. |
|
|
|
|
|
| . | ||||||||||||||
Oncogene 1 | Significant driver gene in | |||||||||||||||||||
| cf) number; DB name 1 Oncogene; http://nar.oxfordjournals.org/content/35/suppl_1/D721.long, 2 Tumor Suppressor gene; https://bioinfo.uth.edu/TSGene/, 3 Cancer Gene Census; http://www.nature.com/nrc/journal/v4/n3/abs/nrc1299.html, 4 CancerGenes; http://nar.oxfordjournals.org/content/35/suppl_1/D721.long, 5 Network of Cancer Gene; http://ncg.kcl.ac.uk/index.php, 1Therapeutic Vulnerabilities in Cancer; http://cbio.mskcc.org/cancergenomics/statius/ |
| REACTOME_METABOLISM_OF_PROTEINS REACTOME_METABOLISM_OF_MRNA REACTOME_METABOLISM_OF_RNA | |
| OMIM | 134690; gene. |
| Orphanet | |
| Disease | KEGG Disease: FAU |
| MedGen: FAU (Human Medical Genetics with Condition) | |
| ClinVar: FAU | |
| Phenotype | MGI: FAU (International Mouse Phenotyping Consortium) |
| PhenomicDB: FAU | |
| Mutations for FAU |
| * Under tables are showing count per each tissue to give us broad intuition about tissue specific mutation patterns.You can go to the detailed page for each mutation database's web site. |
| There's no structural variation information in COSMIC data for this gene. |
| * From mRNA Sanger sequences, Chitars2.0 arranged chimeric transcripts. This table shows FAU related fusion information. |
| ID | Head Gene | Tail Gene | Accession | Gene_a | qStart_a | qEnd_a | Chromosome_a | tStart_a | tEnd_a | Gene_a | qStart_a | qEnd_a | Chromosome_a | tStart_a | tEnd_a |
| BG251227 | APOL6 | 1 | 98 | 22 | 36058447 | 36058545 | FAU | 98 | 543 | 11 | 64888106 | 64889283 | |
| X75315 | FAU | 1 | 64 | 11 | 64888171 | 64888234 | MIR5095 | 57 | 1434 | 20 | 55966720 | 55983642 | |
| BG472330 | FAU | 20 | 163 | 11 | 64888161 | 64888479 | BAD | 164 | 768 | 11 | 64037652 | 64052162 | |
| AJ712941 | FAU | 9 | 74 | 11 | 64888257 | 64888496 | PLIN3 | 64 | 335 | 19 | 4838947 | 4839219 | |
| BG479472 | FAU | 21 | 165 | 11 | 64888161 | 64888479 | BAD | 166 | 617 | 11 | 64039085 | 64052162 | |
| AA071465 | FAU | 22 | 74 | 11 | 64888102 | 64888154 | CNOT2 | 66 | 491 | 12 | 70747715 | 70748140 | |
| AA469444 | PRKDC | 14 | 39 | 8 | 48792396 | 48792421 | FAU | 37 | 427 | 11 | 64888102 | 64889225 | |
| BG491927 | FAU | 20 | 101 | 11 | 64888178 | 64888260 | CALR | 98 | 950 | 19 | 13050328 | 13054606 | |
| BM990847 | FAU | 18 | 86 | 11 | 64888102 | 64888170 | MRPL16 | 78 | 563 | 11 | 59573821 | 59574306 | |
| DR979128 | PTPRD | 1 | 89 | 9 | 8316051 | 8316140 | FAU | 78 | 152 | 11 | 64888106 | 64888180 | |
| CN275873 | ANKRD11 | 6 | 646 | 16 | 89348352 | 89348995 | FAU | 633 | 799 | 11 | 64888108 | 64888275 | |
| Top |
| There's no copy number variation information in COSMIC data for this gene. |
| Top |
|
 |
| Top |
| Stat. for Non-Synonymous SNVs (# total SNVs=12) | (# total SNVs=5) |
 |  |
(# total SNVs=0) | (# total SNVs=0) |
| Top |
| * When you move the cursor on each content, you can see more deailed mutation information on the Tooltip. Those are primary_site,primary_histology,mutation(aa),pubmedID. |
| GRCh37 position | Mutation(aa) | Unique sampleID count |
| chr11:64888248-64888250 | p.K102delK | 2 |
| chr11:64888518-64888518 | p.? | 2 |
| chr11:64888169-64888169 | p.P129H | 2 |
| chr11:64888211-64888211 | p.R115H | 1 |
| chr11:64889083-64889083 | p.E37* | 1 |
| chr11:64888220-64888220 | p.Y112C | 1 |
| chr11:64889126-64889126 | p.? | 1 |
| chr11:64889260-64889260 | p.E9V | 1 |
| chr11:64888252-64888252 | p.K101K | 1 |
| chr11:64889268-64889268 | p.R6R | 1 |
| Top |
|
 |
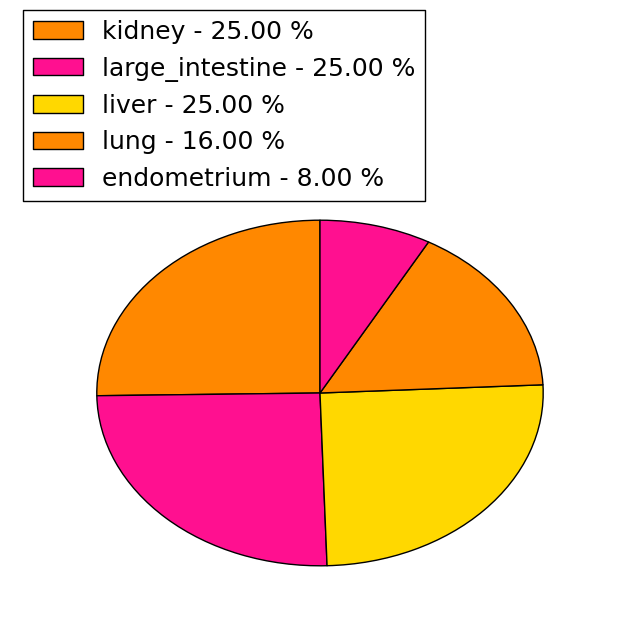
| Point Mutation/ Tissue ID | 1 | 2 | 3 | 4 | 5 | 6 | 7 | 8 | 9 | 10 | 11 | 12 | 13 | 14 | 15 | 16 | 17 | 18 | 19 | 20 |
| # sample | 2 | 2 | 1 | 1 | 1 | 1 | 1 | 2 | ||||||||||||
| # mutation | 2 | 2 | 1 | 1 | 1 | 1 | 1 | 2 | ||||||||||||
| nonsynonymous SNV | 2 | 2 | 1 | 1 | 1 | 1 | 1 | |||||||||||||
| synonymous SNV | 1 | 1 |
| cf) Tissue ID; Tissue type (1; BLCA[Bladder Urothelial Carcinoma], 2; BRCA[Breast invasive carcinoma], 3; CESC[Cervical squamous cell carcinoma and endocervical adenocarcinoma], 4; COAD[Colon adenocarcinoma], 5; GBM[Glioblastoma multiforme], 6; Glioma Low Grade, 7; HNSC[Head and Neck squamous cell carcinoma], 8; KICH[Kidney Chromophobe], 9; KIRC[Kidney renal clear cell carcinoma], 10; KIRP[Kidney renal papillary cell carcinoma], 11; LAML[Acute Myeloid Leukemia], 12; LUAD[Lung adenocarcinoma], 13; LUSC[Lung squamous cell carcinoma], 14; OV[Ovarian serous cystadenocarcinoma ], 15; PAAD[Pancreatic adenocarcinoma], 16; PRAD[Prostate adenocarcinoma], 17; SKCM[Skin Cutaneous Melanoma], 18:STAD[Stomach adenocarcinoma], 19:THCA[Thyroid carcinoma], 20:UCEC[Uterine Corpus Endometrial Carcinoma]) |
| Top |
| * We represented just top 10 SNVs. When you move the cursor on each content, you can see more deailed mutation information on the Tooltip. Those are primary_site, primary_histology, mutation(aa), pubmedID. |
| Genomic Position | Mutation(aa) | Unique sampleID count |
| chr11:64888220 | p.K92E | 1 |
| chr11:64888258 | p.L62P | 1 |
| chr11:64888455 | p.E37D | 1 |
| chr11:64889007 | p.P36S | 1 |
| chr11:64889081 | p.E9V | 1 |
| chr11:64889086 | p.L3L | 1 |
| chr11:64889260 | p.A131T | 1 |
| chr11:64889277 | p.K127M | 1 |
| chr11:64888164 | p.N118N | 1 |
| chr11:64888175 | p.Y112C | 1 |
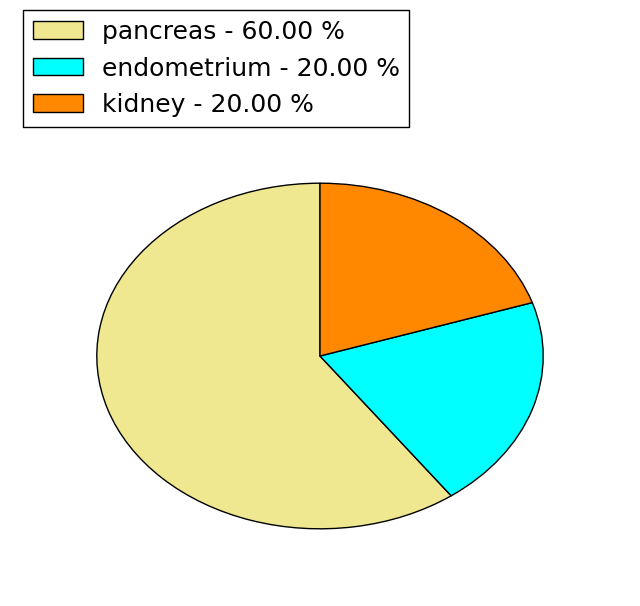
| * Copy number data were extracted from TCGA using R package TCGA-Assembler. The URLs of all public data files on TCGA DCC data server were gathered on Jan-05-2015. Function ProcessCNAData in TCGA-Assembler package was used to obtain gene-level copy number value which is calculated as the average copy number of the genomic region of a gene. |
 |
| cf) Tissue ID[Tissue type]: BLCA[Bladder Urothelial Carcinoma], BRCA[Breast invasive carcinoma], CESC[Cervical squamous cell carcinoma and endocervical adenocarcinoma], COAD[Colon adenocarcinoma], GBM[Glioblastoma multiforme], Glioma Low Grade, HNSC[Head and Neck squamous cell carcinoma], KICH[Kidney Chromophobe], KIRC[Kidney renal clear cell carcinoma], KIRP[Kidney renal papillary cell carcinoma], LAML[Acute Myeloid Leukemia], LUAD[Lung adenocarcinoma], LUSC[Lung squamous cell carcinoma], OV[Ovarian serous cystadenocarcinoma ], PAAD[Pancreatic adenocarcinoma], PRAD[Prostate adenocarcinoma], SKCM[Skin Cutaneous Melanoma], STAD[Stomach adenocarcinoma], THCA[Thyroid carcinoma], UCEC[Uterine Corpus Endometrial Carcinoma] |
| Top |
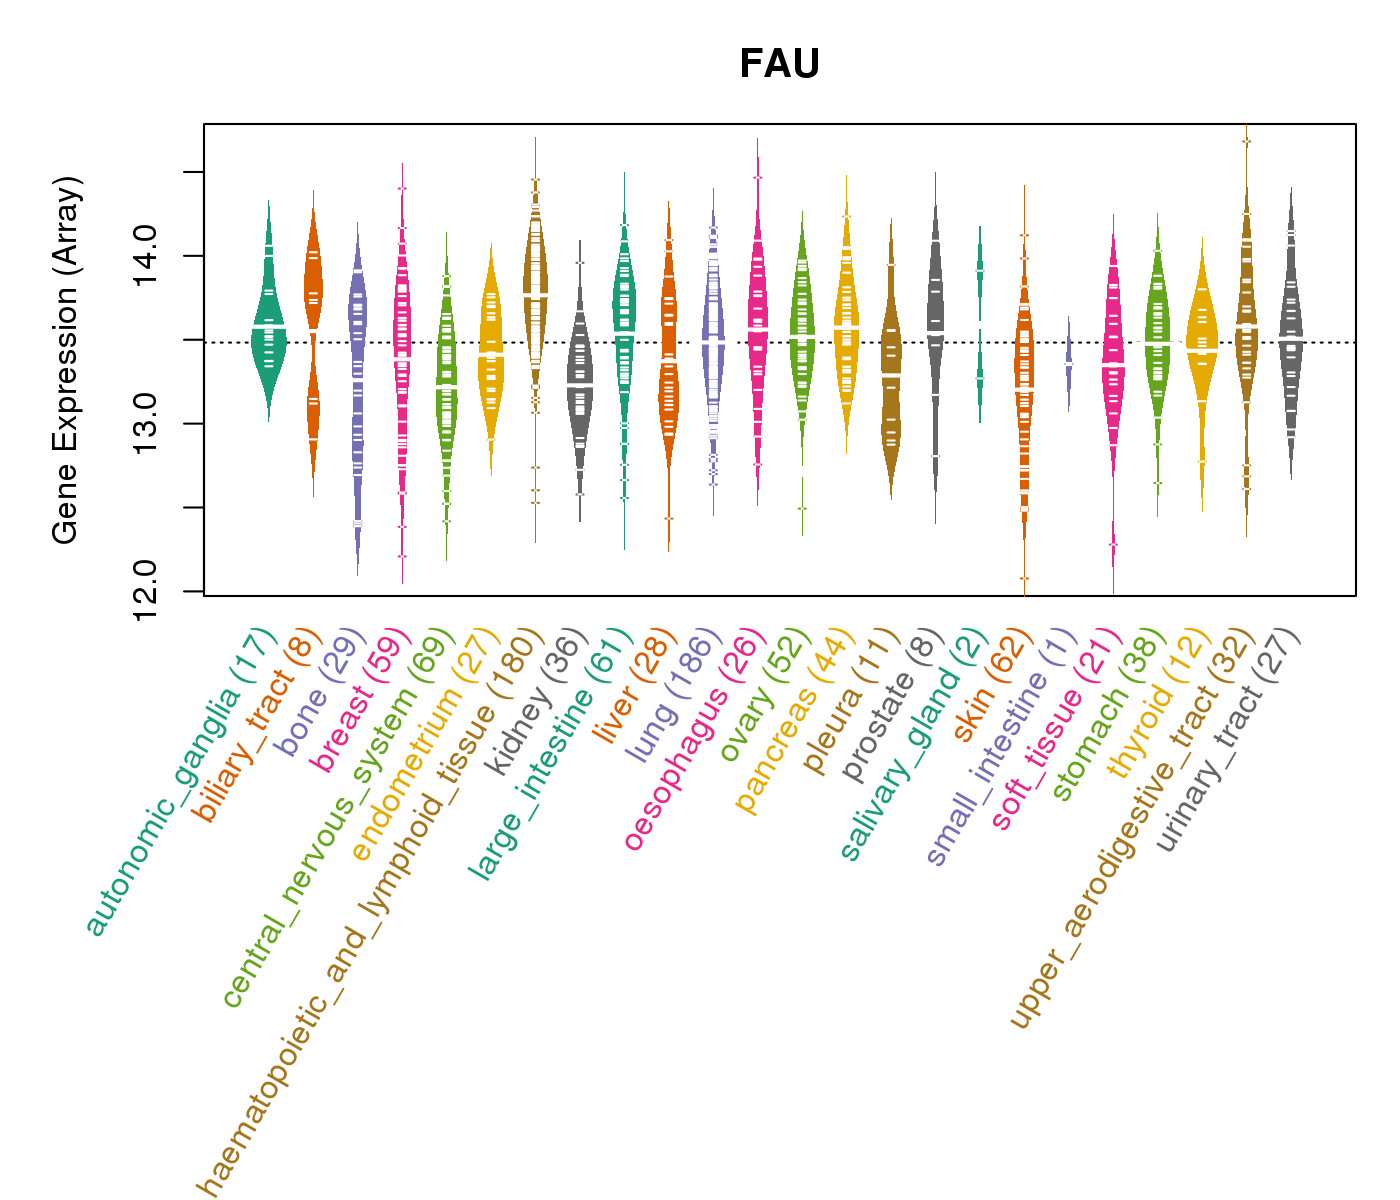
| Gene Expression for FAU |
| * CCLE gene expression data were extracted from CCLE_Expression_Entrez_2012-10-18.res: Gene-centric RMA-normalized mRNA expression data. |
 |
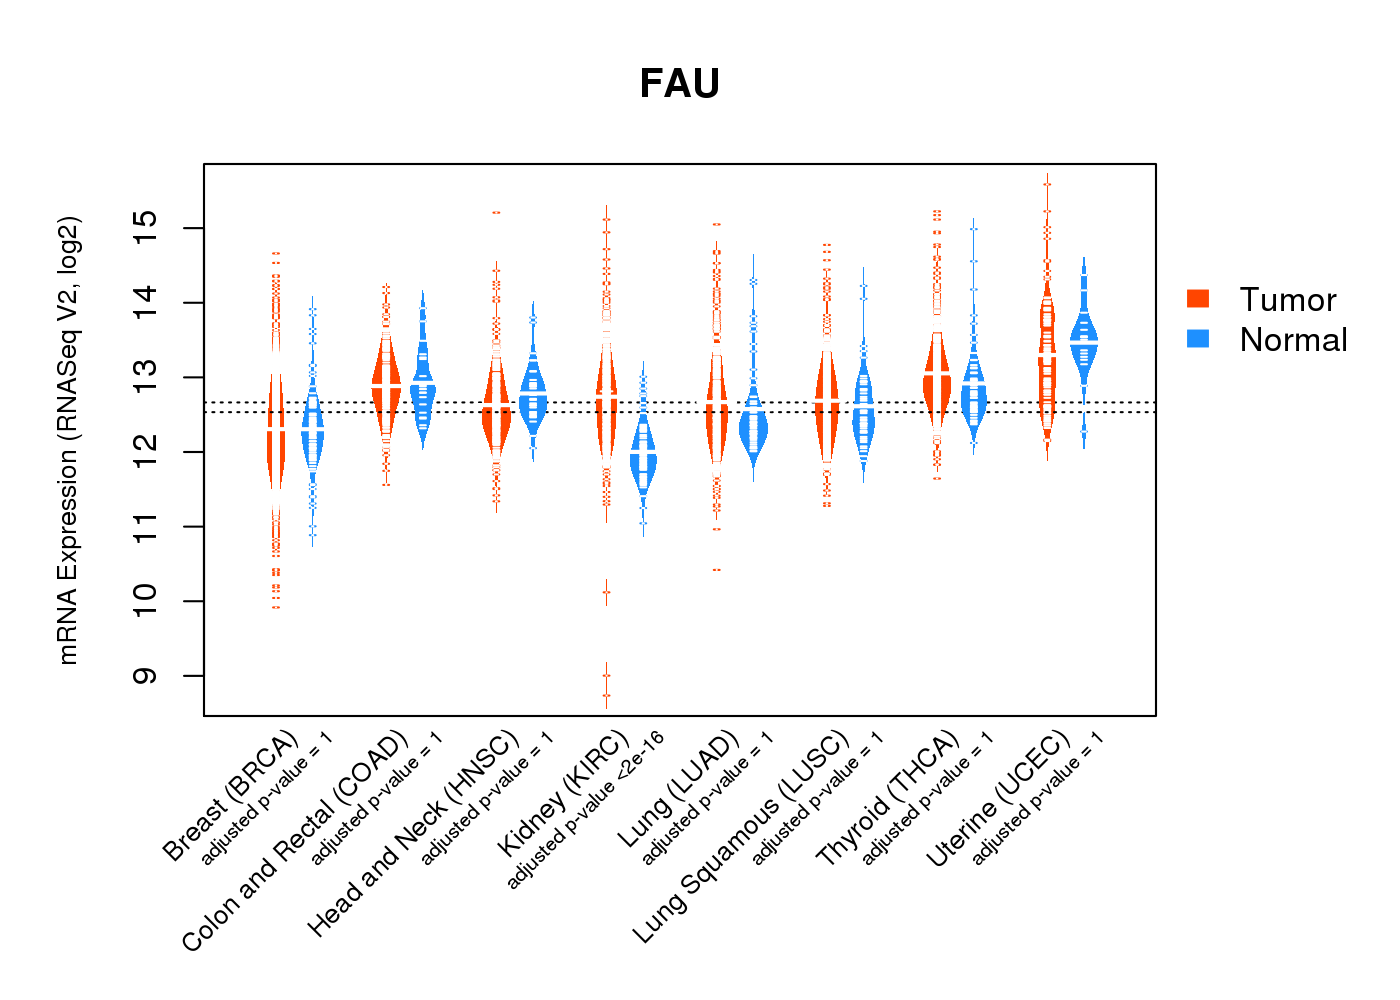
| * Normalized gene expression data of RNASeqV2 was extracted from TCGA using R package TCGA-Assembler. The URLs of all public data files on TCGA DCC data server were gathered at Jan-05-2015. Only eight cancer types have enough normal control samples for differential expression analysis. (t test, adjusted p<0.05 (using Benjamini-Hochberg FDR)) |
 |
| Top |
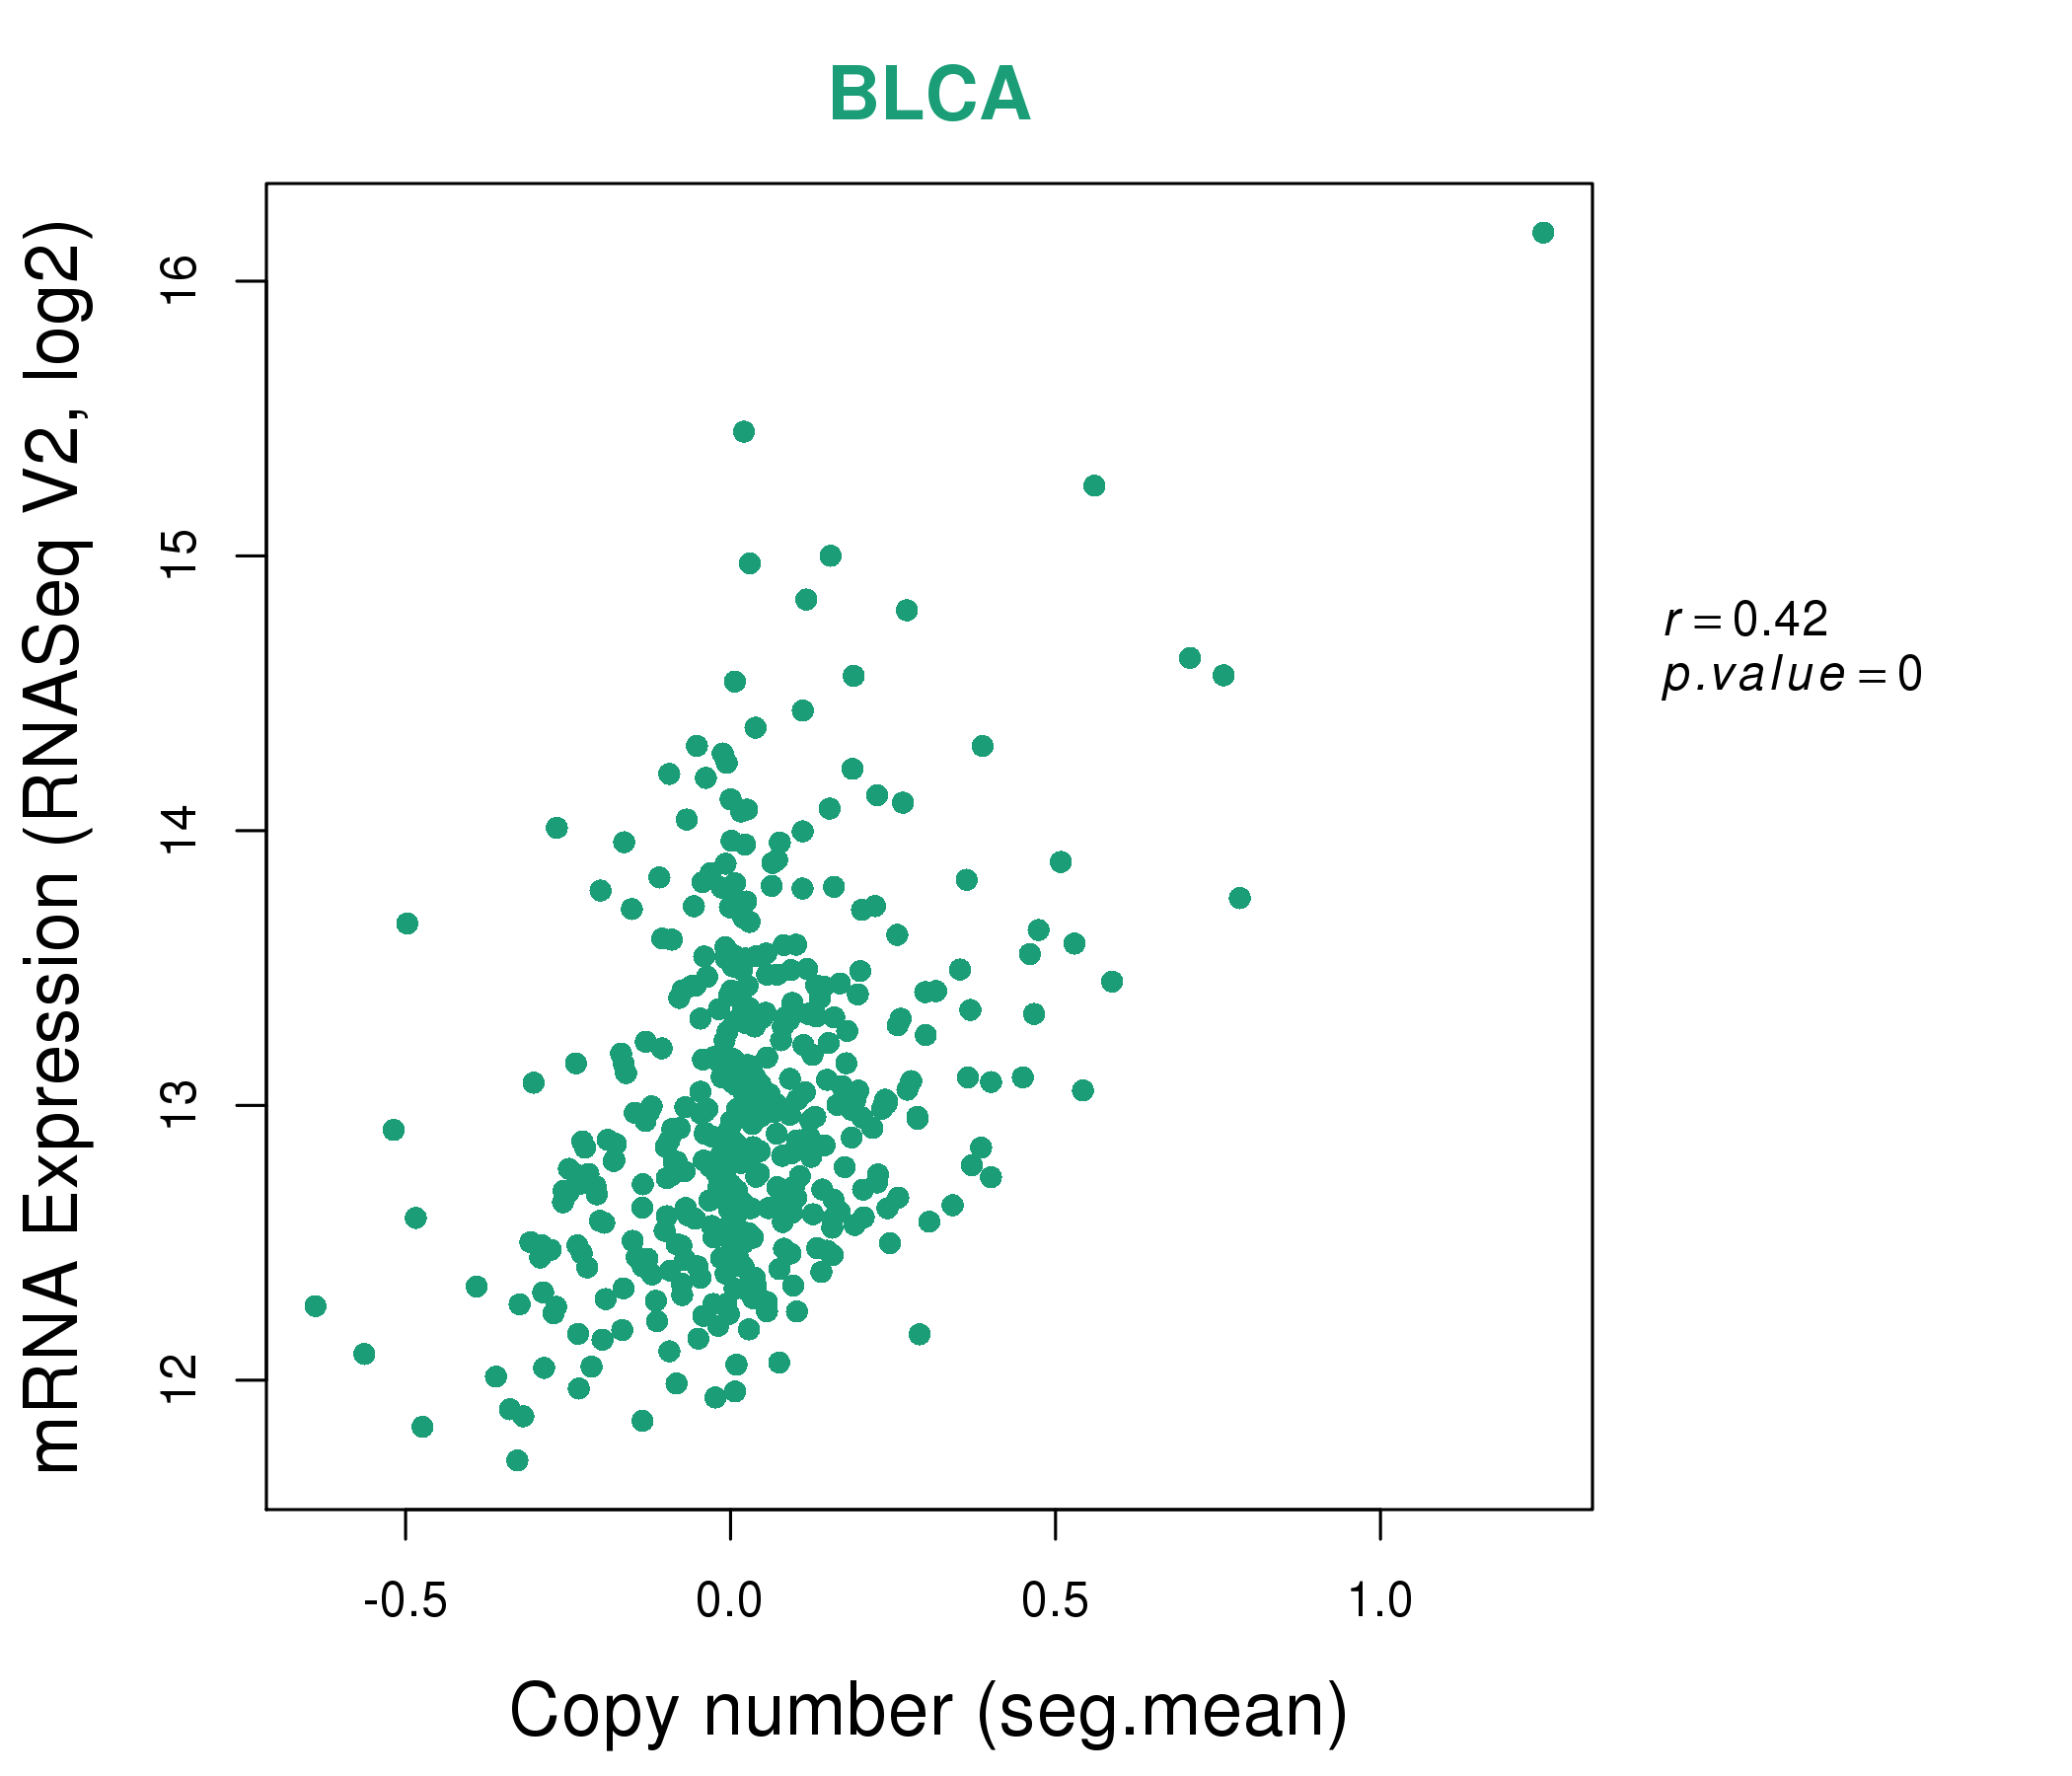
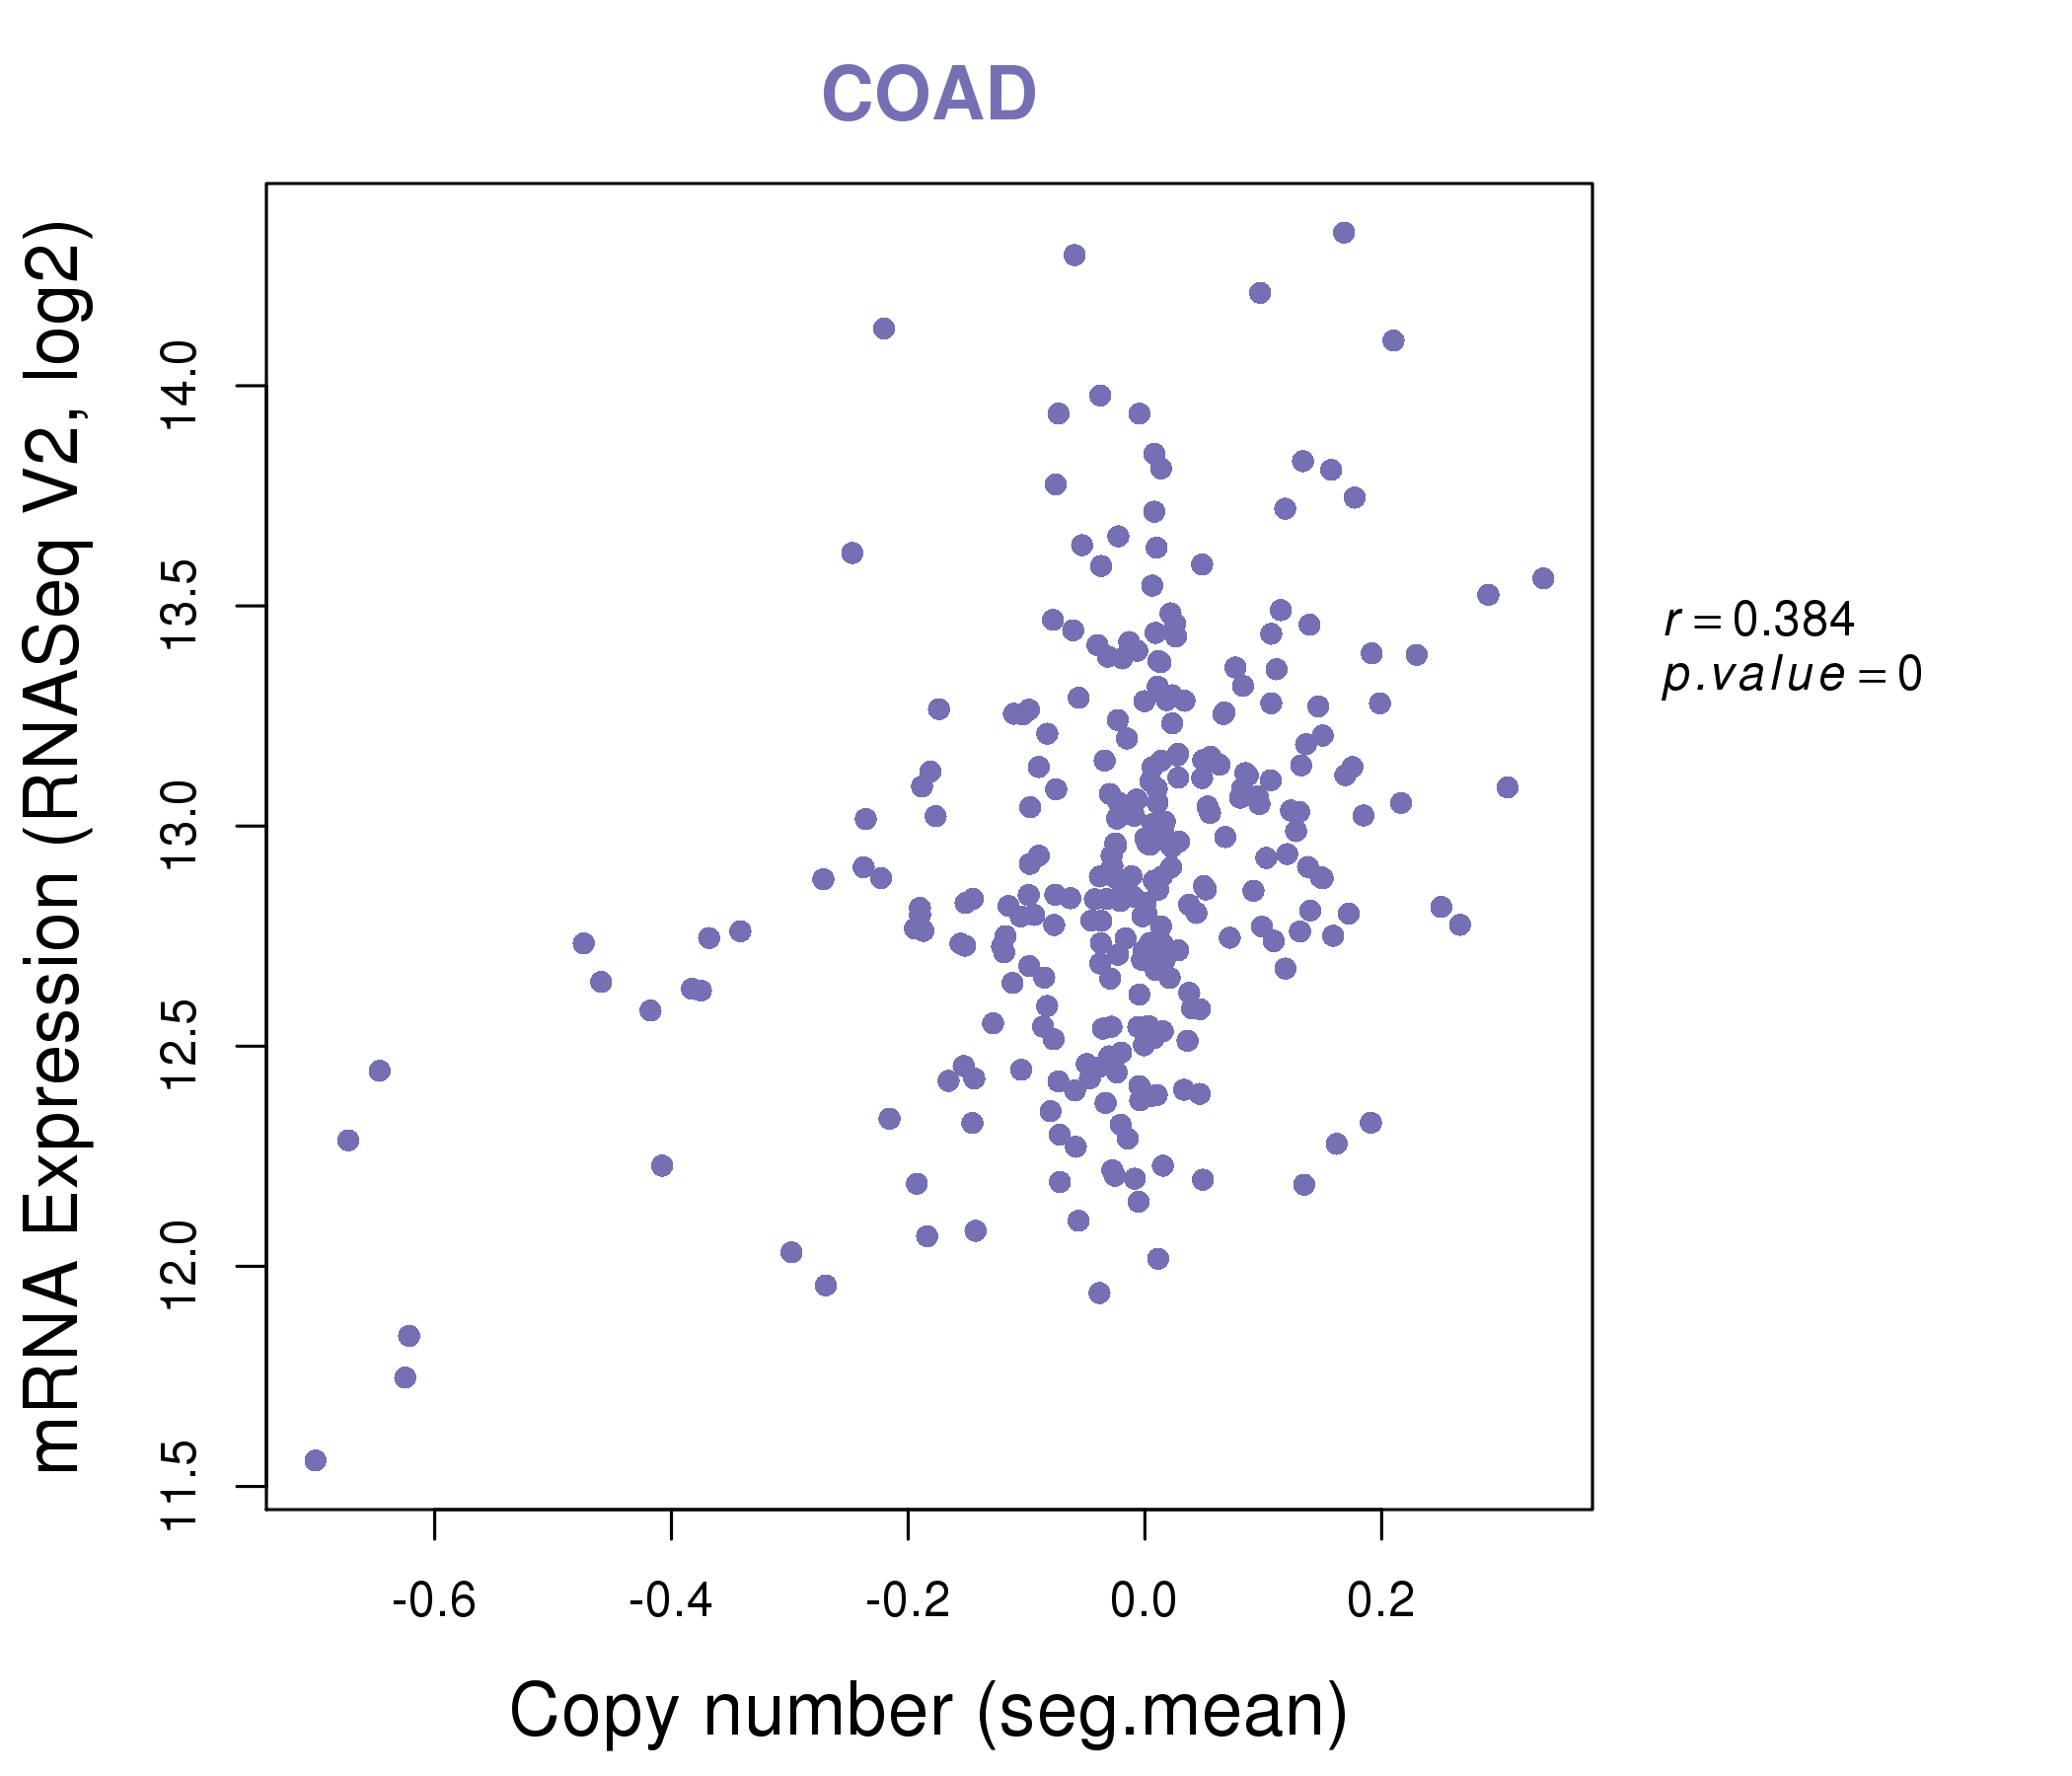
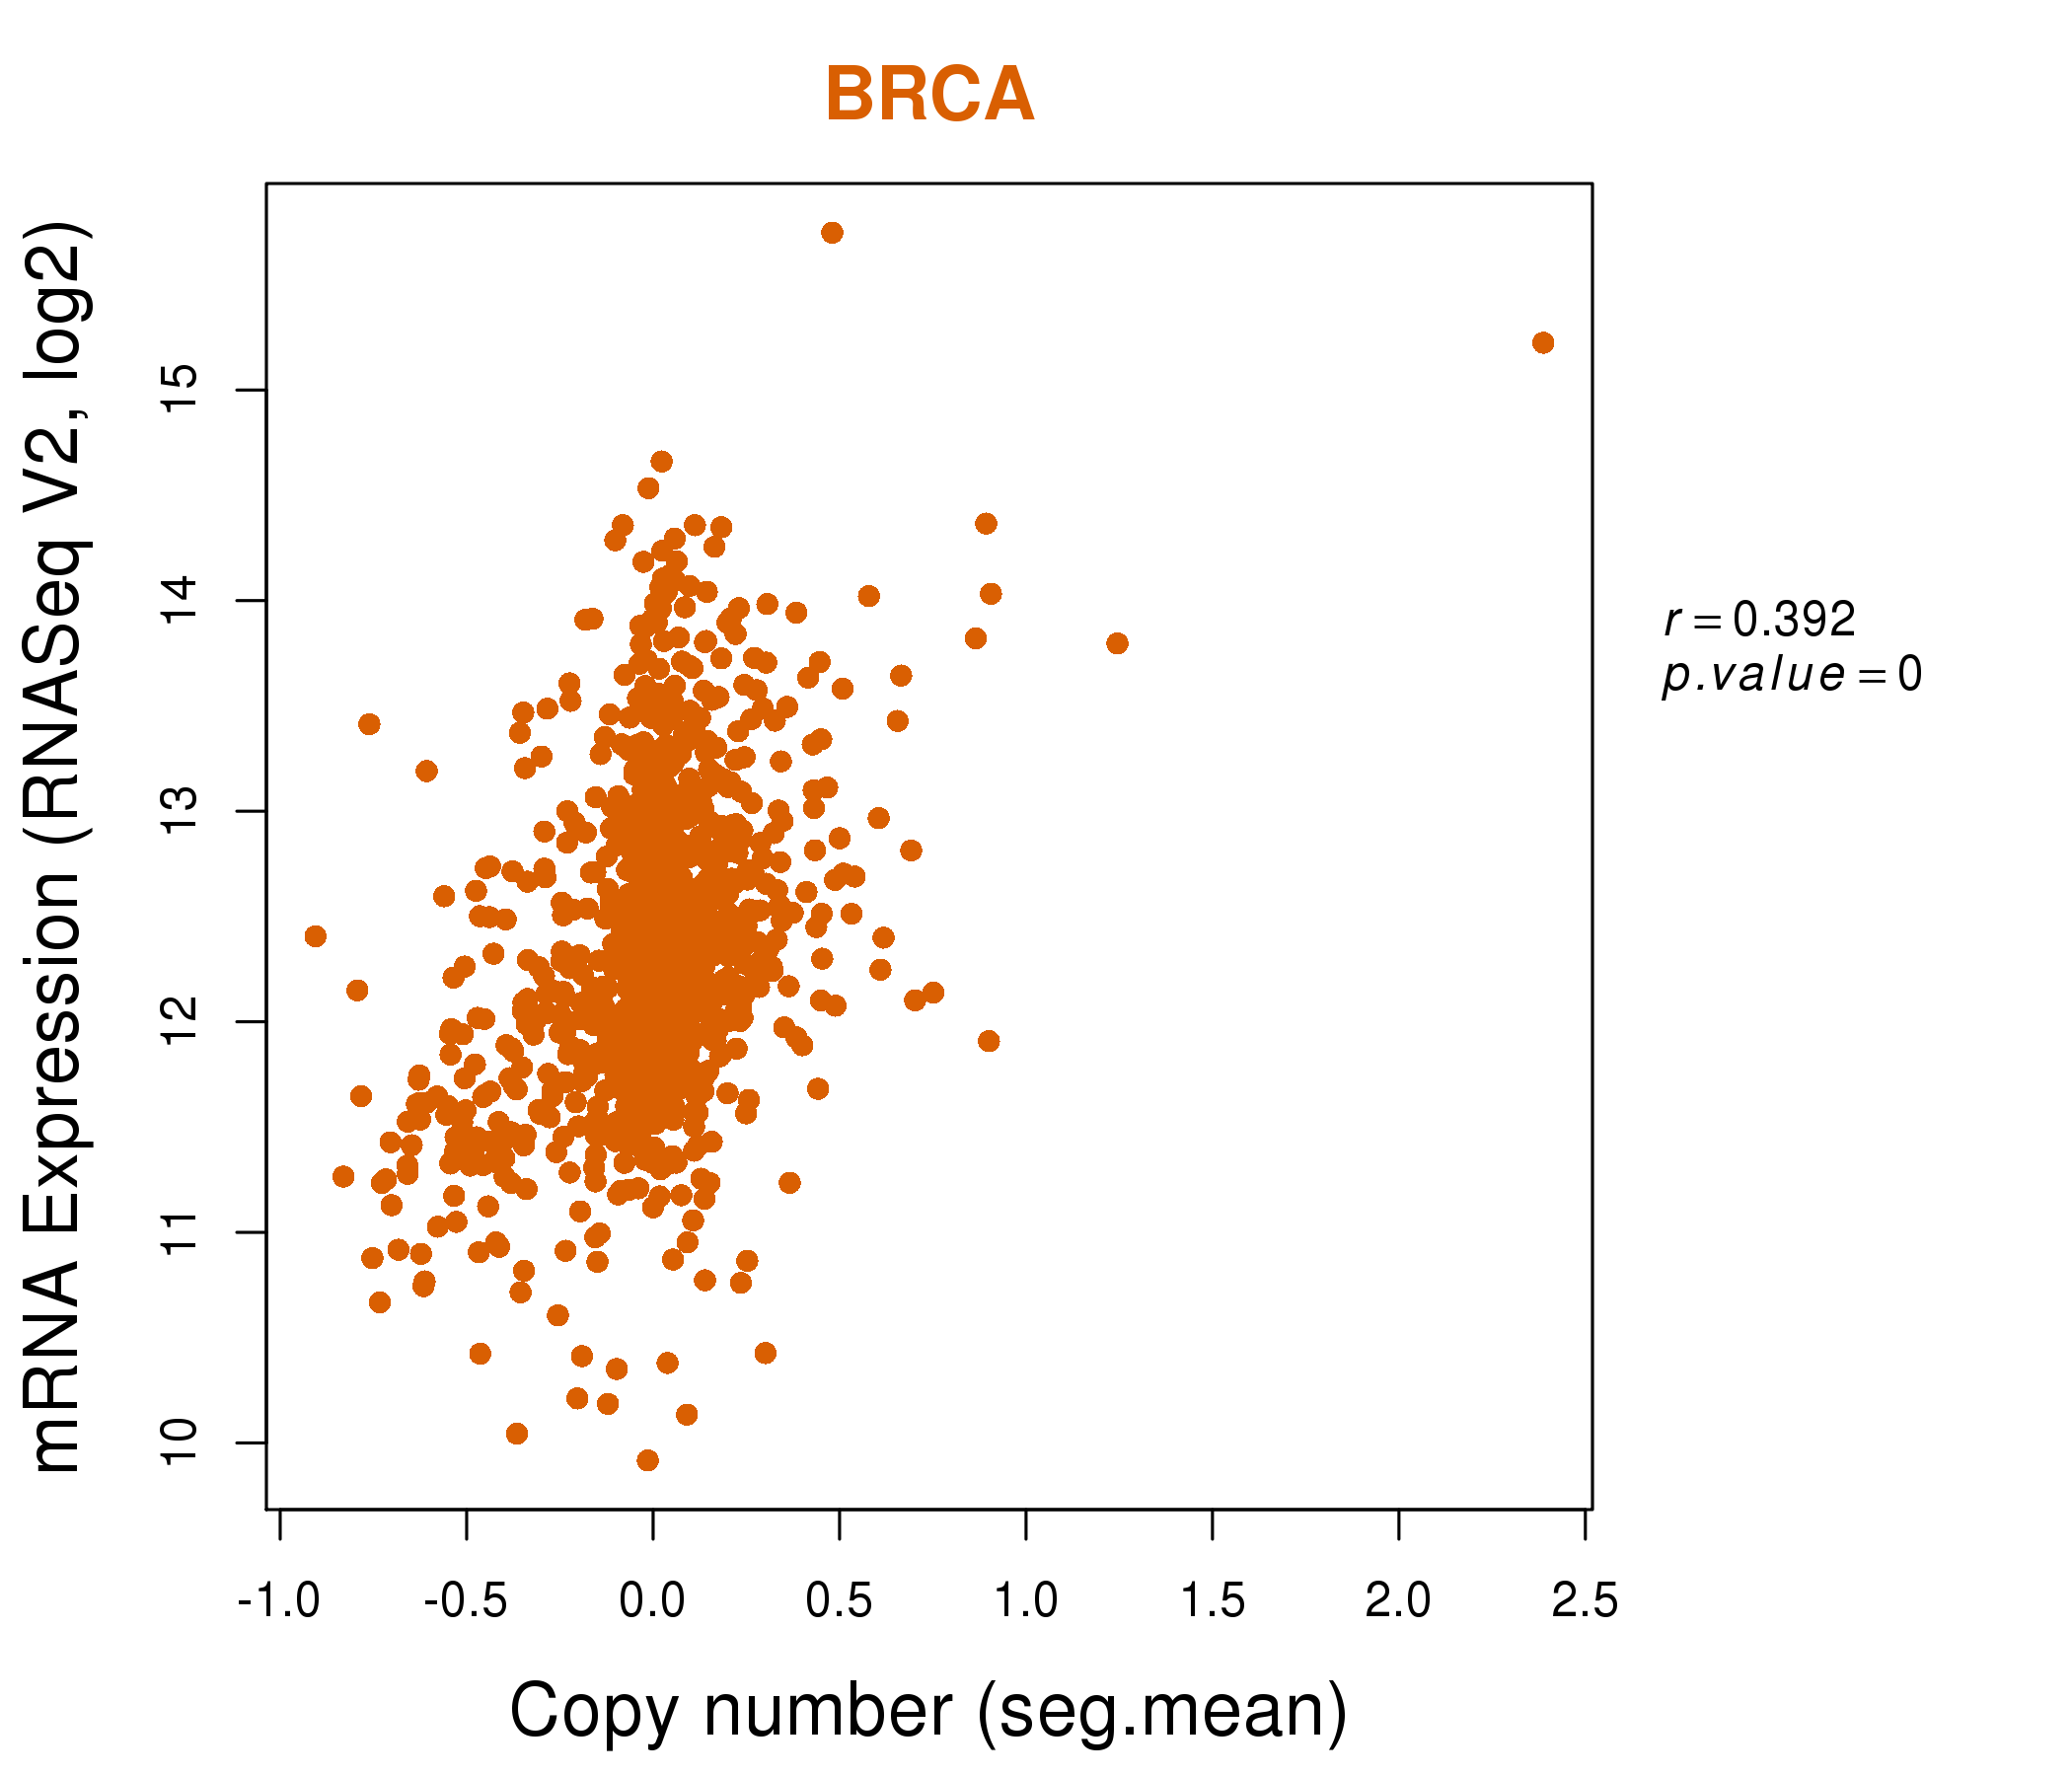
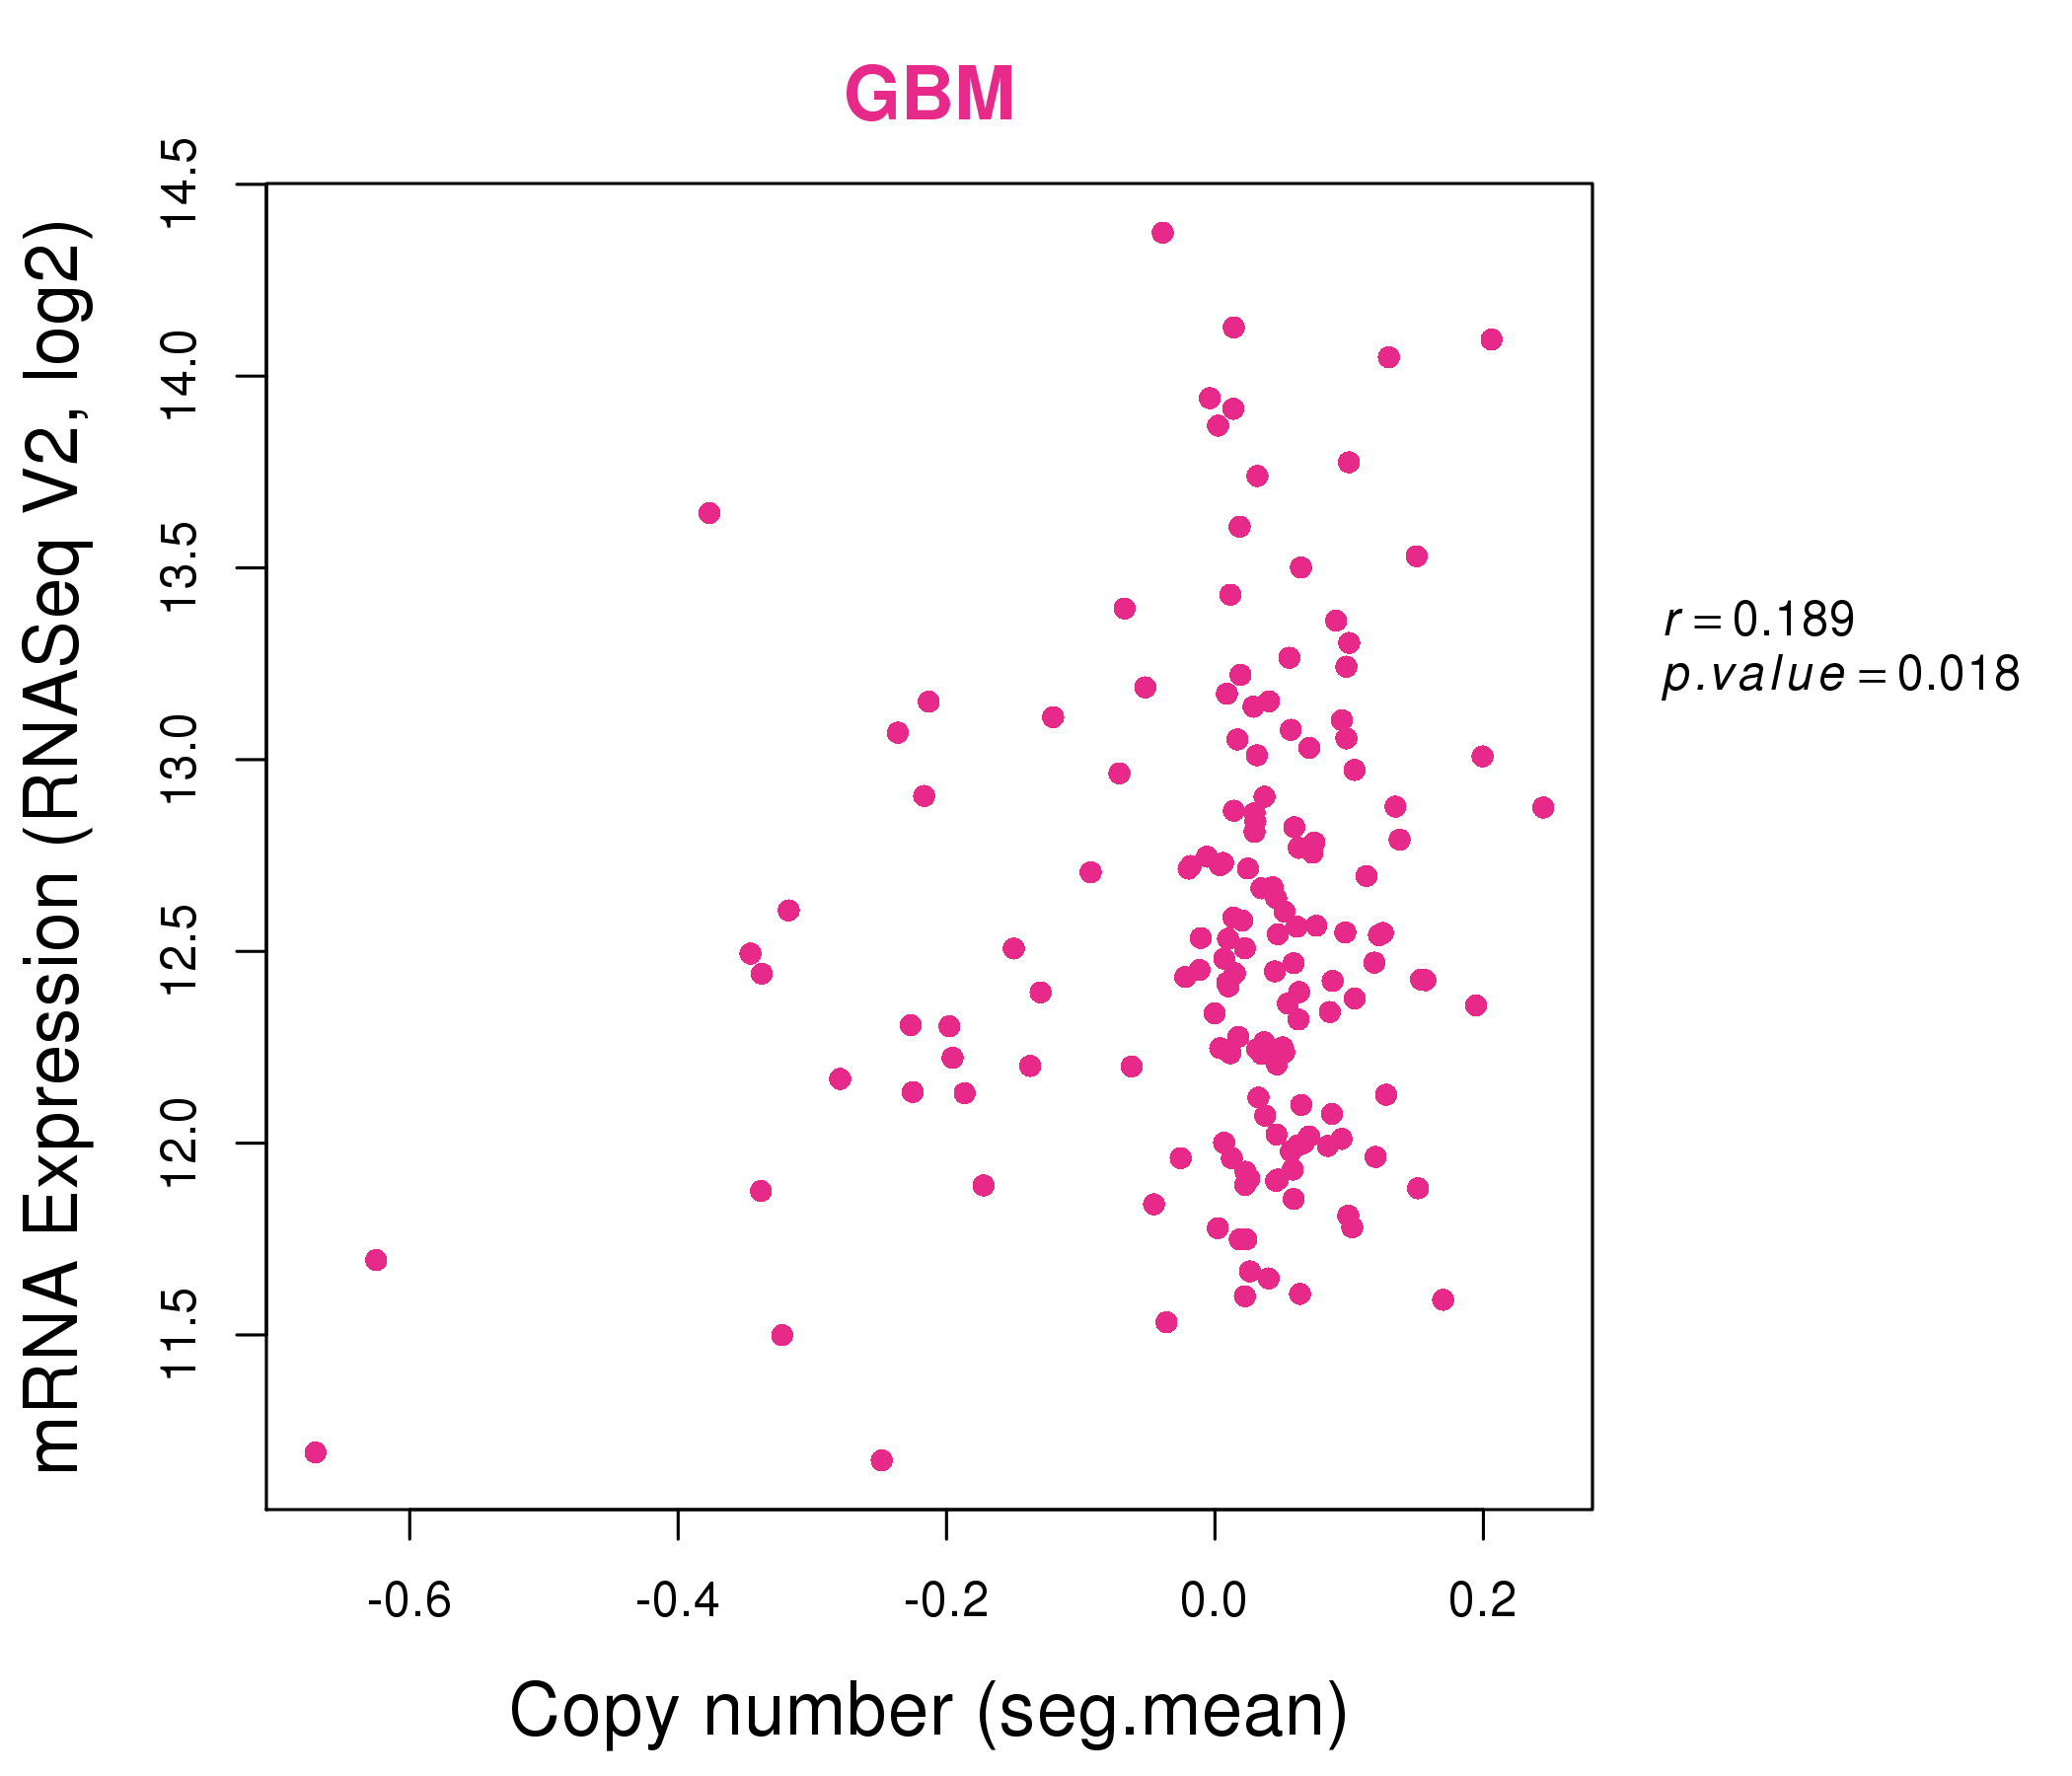
| * This plots show the correlation between CNV and gene expression. |
: Open all plots for all cancer types
 |
|
 |
|
| Top |
| Gene-Gene Network Information |
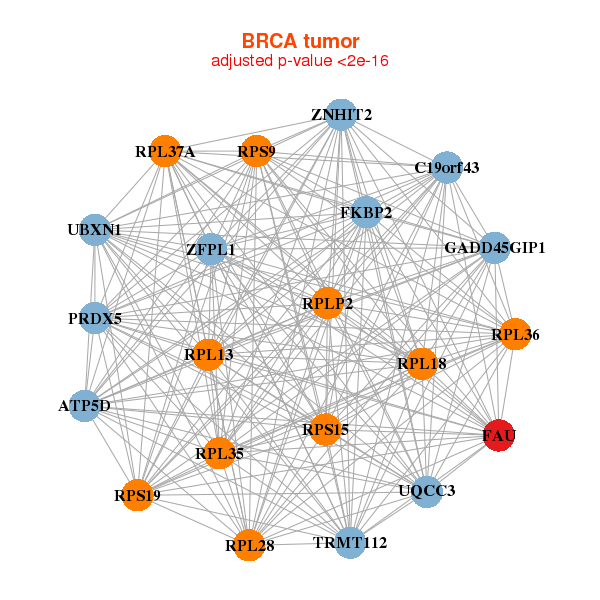
| * Co-Expression network figures were drawn using R package igraph. Only the top 20 genes with the highest correlations were shown. Red circle: input gene, orange circle: cell metabolism gene, sky circle: other gene |
: Open all plots for all cancer types
 |
|
| ATP5D,UQCC3,C19orf43,FAU,FKBP2,GADD45GIP1,PRDX5, RPL13,RPL18,RPL28,RPL35,RPL36,RPL37A,RPLP2, RPS15,RPS19,RPS9,TRMT112,UBXN1,ZFPL1,ZNHIT2 | C12orf10,EDF1,EEF1D,EIF3G,FAU,NME2,POLR2F, PQBP1,PRDX5,RFXANK,RPL13,RPL18,RPL19,RPL35, RPL36,RPL8,RPS15,RPS16,RPS9,SNRPD2,SURF2 |
 |
|
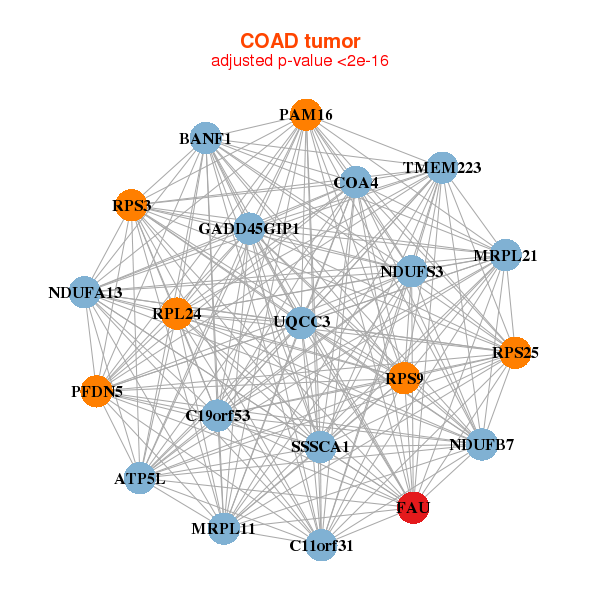
| ATP5L,BANF1,C11orf31,UQCC3,C19orf53,COA4,FAU, GADD45GIP1,MRPL11,MRPL21,NDUFA13,NDUFB7,NDUFS3,PFDN5, RPL24,RPS25,RPS3,RPS9,SSSCA1,PAM16,TMEM223 | ALKBH2,ANAPC11,C12orf57,C19orf53,FAU,FIS1,HAX1, MRPL40,MRPL43,OST4,PFDN5,RPL24,RPL35,RPL35A, RPL41,RPL5,RPS10,RPS11,RPS13,RPS5,SNRPD2 |
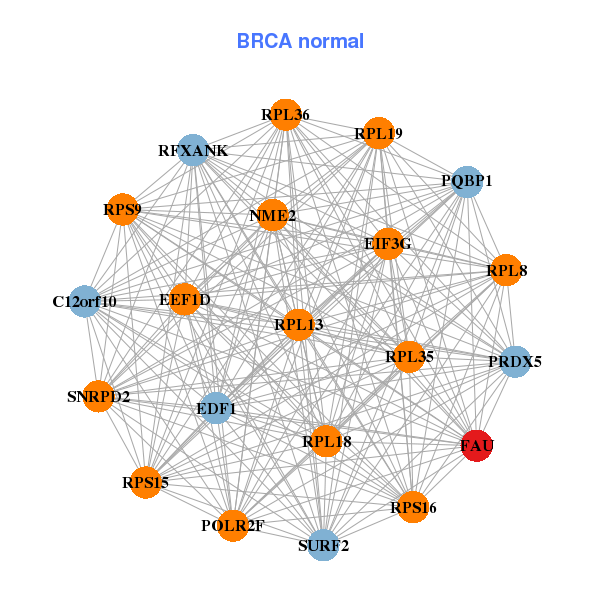
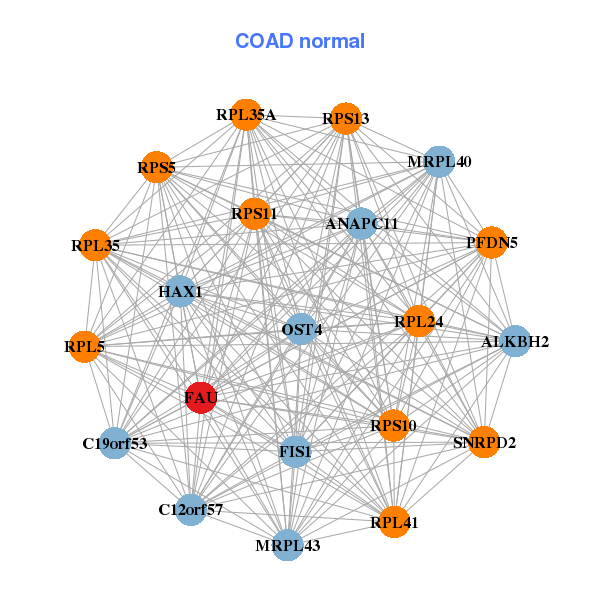
| * Co-Expression network figures were drawn using R package igraph. Only the top 20 genes with the highest correlations were shown. Red circle: input gene, orange circle: cell metabolism gene, sky circle: other gene |
: Open all plots for all cancer types
| Top |
: Open all interacting genes' information including KEGG pathway for all interacting genes from DAVID
| Top |
| Pharmacological Information for FAU |
| There's no related Drug. |
| Top |
| Cross referenced IDs for FAU |
| * We obtained these cross-references from Uniprot database. It covers 150 different DBs, 18 categories. http://www.uniprot.org/help/cross_references_section |
: Open all cross reference information
|
Copyright © 2016-Present - The Univsersity of Texas Health Science Center at Houston @ |