|
|||||||||||||||||||||||||||||||||||||||||||||||||||||||||||||||||||||||||||||||||||||||||||||||||||||||||||||||||||||||||||||||||||||||||||||||||||||||||||||||||||||||||||||||||||||||||||||||||||||||||||||||||||||||||||||||||||||||||||||||||||||||||||||||||||||||||||||||||||||||||||||||||||||||||||||||||||||||||||||||||||||||||||||||||||||||||||||||||||||||||||||||||||||||||||||
| |
| Phenotypic Information (metabolism pathway, cancer, disease, phenome) |
| |
| |
| Gene-Gene Network Information: Co-Expression Network, Interacting Genes & KEGG |
| |
|


| Gene Summary for FBP1 |
| Top |
| Phenotypic Information for FBP1(metabolism pathway, cancer, disease, phenome) |
| Cancer | CGAP: FBP1 |
| Familial Cancer Database: FBP1 | |
| * This gene is included in those cancer gene databases. |
|
|
|
|
|
|
| |||||||||||||||||||||||||||||||||||||||||||||||||||||||||||||||||||||||||||||||||||||||||||||||||||||||||||||||||||||||||||||||||||||||||||||||||||||||||||||||||||||||||||||||||||||||||||||||||||||||||||||||||||||||||||||||||||||||||||||||||||||||||||||||||||||||||||||||||||||||||||||||||||||||||||||||||||||||||||||||||||||||||||||||||||||||||||||||||||||||||||||||||||||||
Oncogene 1 | Significant driver gene in | ||||||||||||||||||||||||||||||||||||||||||||||||||||||||||||||||||||||||||||||||||||||||||||||||||||||||||||||||||||||||||||||||||||||||||||||||||||||||||||||||||||||||||||||||||||||||||||||||||||||||||||||||||||||||||||||||||||||||||||||||||||||||||||||||||||||||||||||||||||||||||||||||||||||||||||||||||||||||||||||||||||||||||||||||||||||||||||||||||||||||||||||||||||||||||||
| cf) number; DB name 1 Oncogene; http://nar.oxfordjournals.org/content/35/suppl_1/D721.long, 2 Tumor Suppressor gene; https://bioinfo.uth.edu/TSGene/, 3 Cancer Gene Census; http://www.nature.com/nrc/journal/v4/n3/abs/nrc1299.html, 4 CancerGenes; http://nar.oxfordjournals.org/content/35/suppl_1/D721.long, 5 Network of Cancer Gene; http://ncg.kcl.ac.uk/index.php, 1Therapeutic Vulnerabilities in Cancer; http://cbio.mskcc.org/cancergenomics/statius/ |
| KEGG_GLYCOLYSIS_GLUCONEOGENESIS KEGG_FRUCTOSE_AND_MANNOSE_METABOLISM REACTOME_METABOLISM_OF_CARBOHYDRATES REACTOME_GLUCOSE_METABOLISM | |
| OMIM | |
| Orphanet | |
| Disease | KEGG Disease: FBP1 |
| MedGen: FBP1 (Human Medical Genetics with Condition) | |
| ClinVar: FBP1 | |
| Phenotype | MGI: FBP1 (International Mouse Phenotyping Consortium) |
| PhenomicDB: FBP1 | |
| Mutations for FBP1 |
| * Under tables are showing count per each tissue to give us broad intuition about tissue specific mutation patterns.You can go to the detailed page for each mutation database's web site. |
| There's no structural variation information in COSMIC data for this gene. |
| * From mRNA Sanger sequences, Chitars2.0 arranged chimeric transcripts. This table shows FBP1 related fusion information. |
| ID | Head Gene | Tail Gene | Accession | Gene_a | qStart_a | qEnd_a | Chromosome_a | tStart_a | tEnd_a | Gene_a | qStart_a | qEnd_a | Chromosome_a | tStart_a | tEnd_a |
| BF806754 | FBP1 | 13 | 107 | 9 | 97365682 | 97365780 | AHCTF1 | 101 | 283 | 1 | 247075362 | 247075544 | |
| Top |
| Mutation type/ Tissue ID | brca | cns | cerv | endome | haematopo | kidn | Lintest | liver | lung | ns | ovary | pancre | prost | skin | stoma | thyro | urina | |||
| Total # sample | 1 | 1 | 1 | |||||||||||||||||
| GAIN (# sample) | ||||||||||||||||||||
| LOSS (# sample) | 1 | 1 | 1 |
| cf) Tissue ID; Tissue type (1; Breast, 2; Central_nervous_system, 3; Cervix, 4; Endometrium, 5; Haematopoietic_and_lymphoid_tissue, 6; Kidney, 7; Large_intestine, 8; Liver, 9; Lung, 10; NS, 11; Ovary, 12; Pancreas, 13; Prostate, 14; Skin, 15; Stomach, 16; Thyroid, 17; Urinary_tract) |
| Top |
|
 |
| Top |
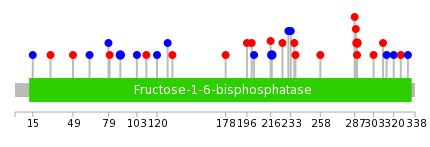
| Stat. for Non-Synonymous SNVs (# total SNVs=13) | (# total SNVs=8) |
 |  |
(# total SNVs=0) | (# total SNVs=0) |
| Top |
| * When you move the cursor on each content, you can see more deailed mutation information on the Tooltip. Those are primary_site,primary_histology,mutation(aa),pubmedID. |
| GRCh37 position | Mutation(aa) | Unique sampleID count |
| chr9:97369151-97369151 | p.A217A | 2 |
| chr9:97382677-97382677 | p.S89S | 2 |
| chr9:97365813-97365813 | p.M289I | 2 |
| chr9:97367856-97367856 | p.D236E | 1 |
| chr9:97380089-97380089 | p.C129C | 1 |
| chr9:97365720-97365720 | p.G320G | 1 |
| chr9:97369103-97369103 | p.F233F | 1 |
| chr9:97380116-97380116 | p.P120P | 1 |
| chr9:97365738-97365738 | p.R314R | 1 |
| chr9:97369109-97369109 | p.K231K | 1 |
| Top |
|
 |
| Point Mutation/ Tissue ID | 1 | 2 | 3 | 4 | 5 | 6 | 7 | 8 | 9 | 10 | 11 | 12 | 13 | 14 | 15 | 16 | 17 | 18 | 19 | 20 |
| # sample | 1 | 1 | 4 | 1 | 3 | 1 | 4 | 5 | 3 | |||||||||||
| # mutation | 1 | 1 | 4 | 1 | 3 | 1 | 4 | 5 | 3 | |||||||||||
| nonsynonymous SNV | 1 | 1 | 2 | 1 | 1 | 2 | 2 | 2 | ||||||||||||
| synonymous SNV | 2 | 1 | 2 | 2 | 3 | 1 |
| cf) Tissue ID; Tissue type (1; BLCA[Bladder Urothelial Carcinoma], 2; BRCA[Breast invasive carcinoma], 3; CESC[Cervical squamous cell carcinoma and endocervical adenocarcinoma], 4; COAD[Colon adenocarcinoma], 5; GBM[Glioblastoma multiforme], 6; Glioma Low Grade, 7; HNSC[Head and Neck squamous cell carcinoma], 8; KICH[Kidney Chromophobe], 9; KIRC[Kidney renal clear cell carcinoma], 10; KIRP[Kidney renal papillary cell carcinoma], 11; LAML[Acute Myeloid Leukemia], 12; LUAD[Lung adenocarcinoma], 13; LUSC[Lung squamous cell carcinoma], 14; OV[Ovarian serous cystadenocarcinoma ], 15; PAAD[Pancreatic adenocarcinoma], 16; PRAD[Prostate adenocarcinoma], 17; SKCM[Skin Cutaneous Melanoma], 18:STAD[Stomach adenocarcinoma], 19:THCA[Thyroid carcinoma], 20:UCEC[Uterine Corpus Endometrial Carcinoma]) |
| Top |
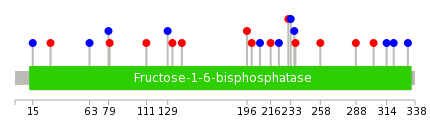
| * We represented just top 10 SNVs. When you move the cursor on each content, you can see more deailed mutation information on the Tooltip. Those are primary_site, primary_histology, mutation(aa), pubmedID. |
| Genomic Position | Mutation(aa) | Unique sampleID count |
| chr9:97369181 | p.V303L,FBP1 | 1 |
| chr9:97401548 | p.D80N,FBP1 | 1 |
| chr9:97365738 | p.V288F,FBP1 | 1 |
| chr9:97369204 | p.N79N,FBP1 | 1 |
| chr9:97365773 | p.V258F,FBP1 | 1 |
| chr9:97369216 | p.S63S,FBP1 | 1 |
| chr9:97365818 | p.N237I,FBP1 | 1 |
| chr9:97380054 | p.E30K,FBP1 | 1 |
| chr9:97367792 | p.D236D,FBP1 | 1 |
| chr9:97380079 | p.T15T,FBP1 | 1 |
| * Copy number data were extracted from TCGA using R package TCGA-Assembler. The URLs of all public data files on TCGA DCC data server were gathered on Jan-05-2015. Function ProcessCNAData in TCGA-Assembler package was used to obtain gene-level copy number value which is calculated as the average copy number of the genomic region of a gene. |
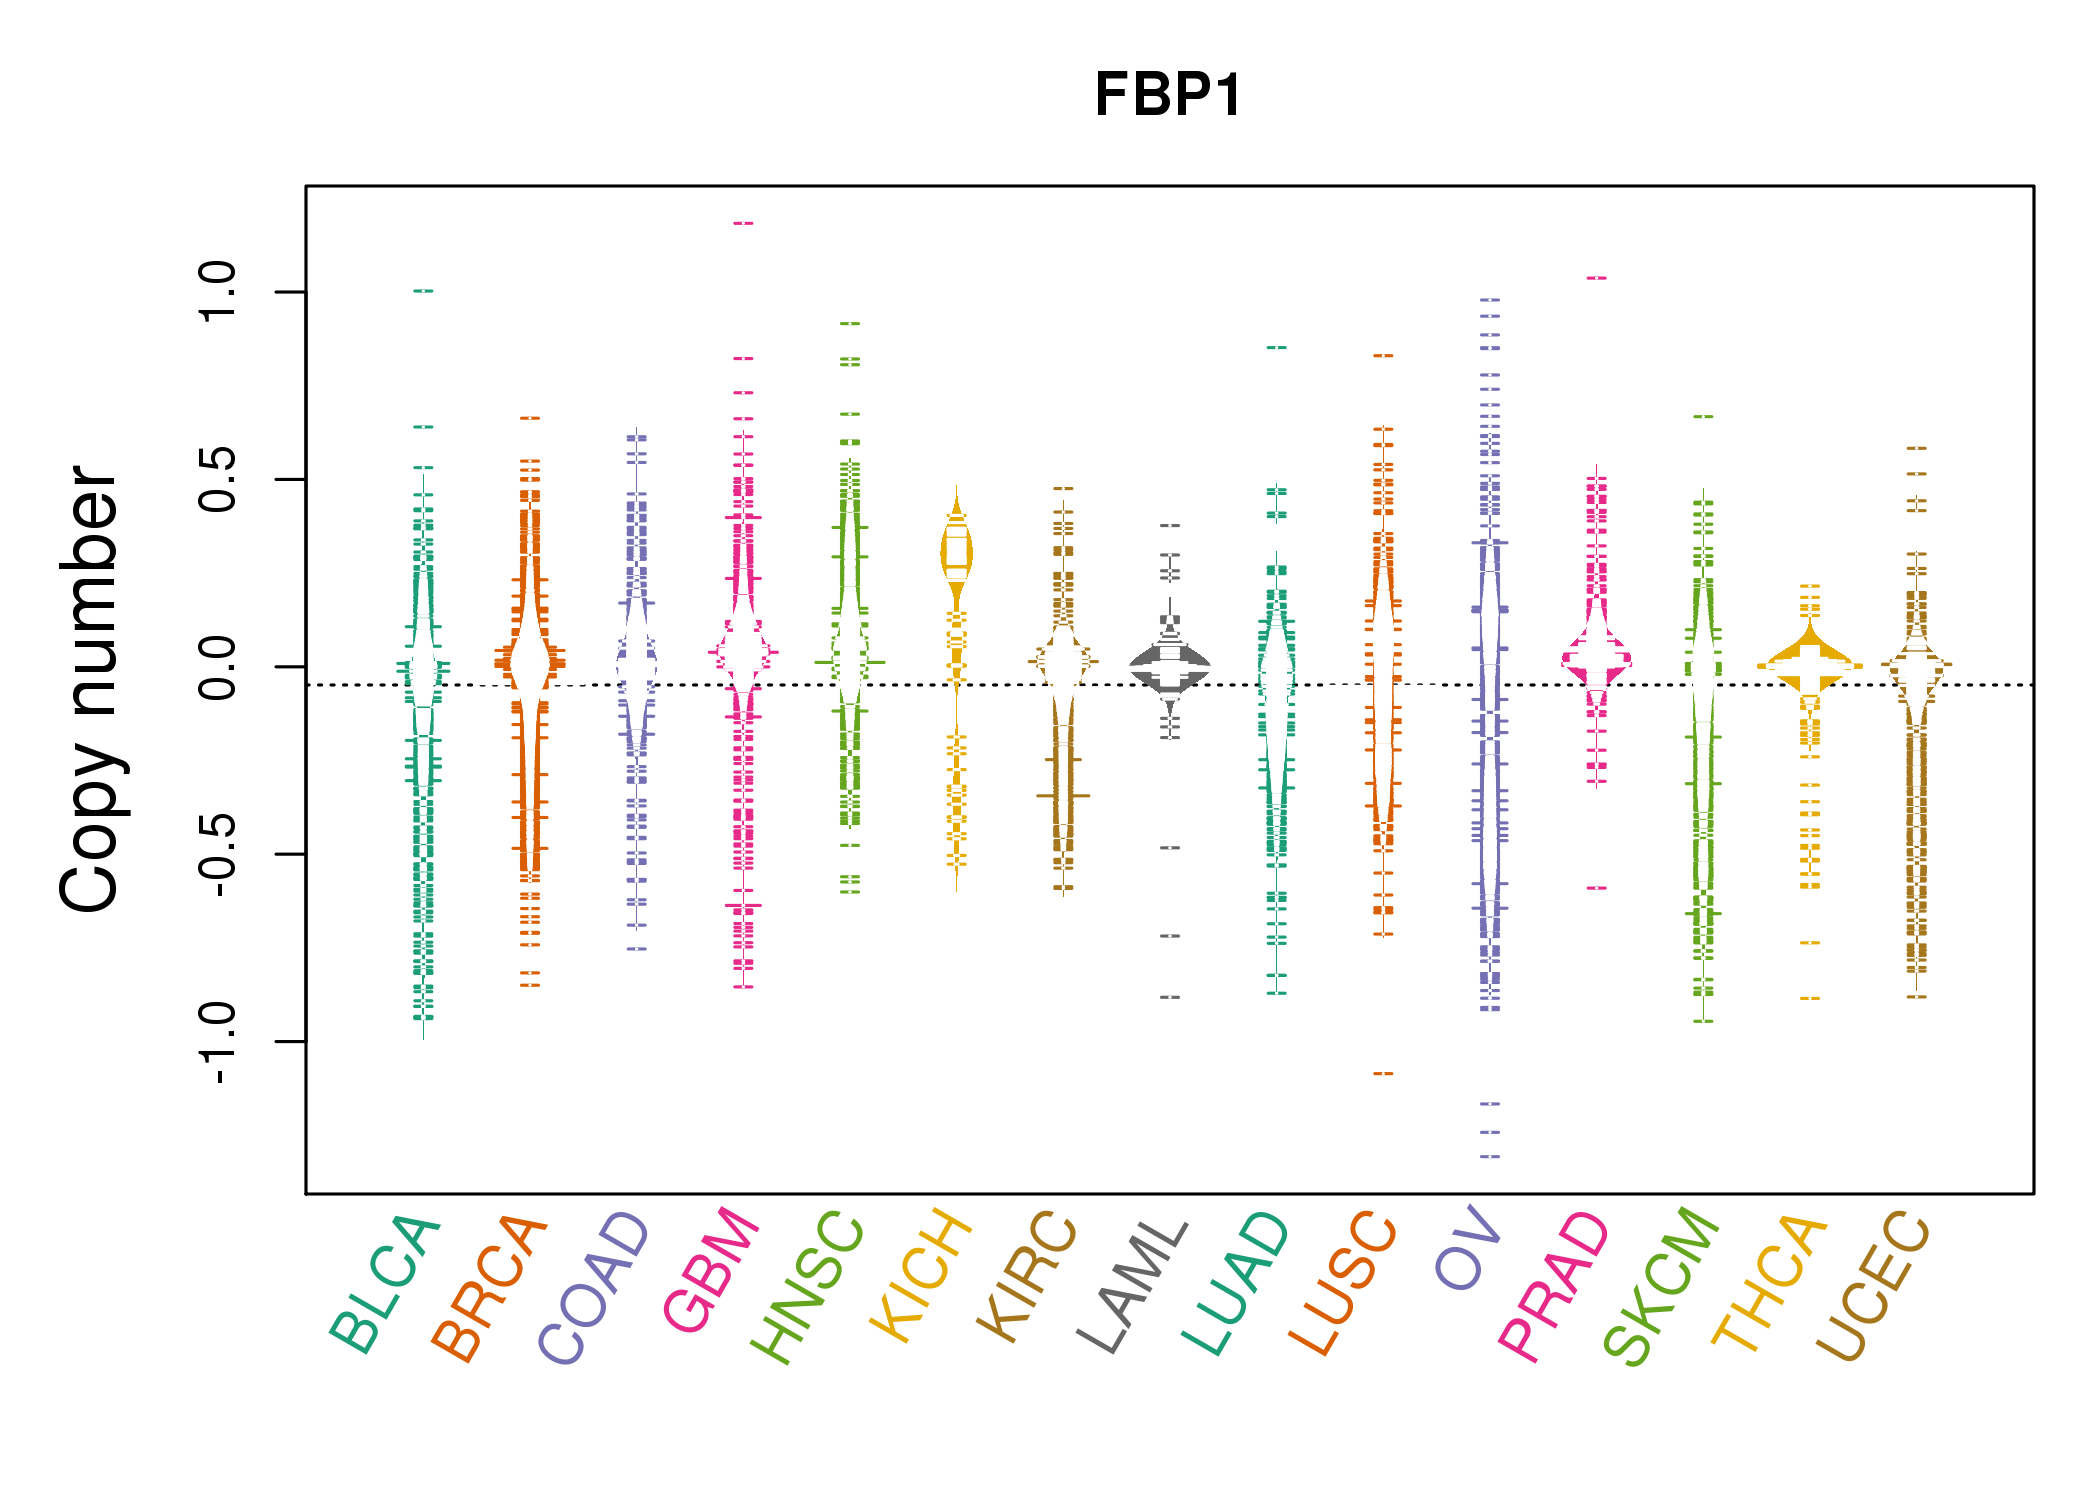 |
| cf) Tissue ID[Tissue type]: BLCA[Bladder Urothelial Carcinoma], BRCA[Breast invasive carcinoma], CESC[Cervical squamous cell carcinoma and endocervical adenocarcinoma], COAD[Colon adenocarcinoma], GBM[Glioblastoma multiforme], Glioma Low Grade, HNSC[Head and Neck squamous cell carcinoma], KICH[Kidney Chromophobe], KIRC[Kidney renal clear cell carcinoma], KIRP[Kidney renal papillary cell carcinoma], LAML[Acute Myeloid Leukemia], LUAD[Lung adenocarcinoma], LUSC[Lung squamous cell carcinoma], OV[Ovarian serous cystadenocarcinoma ], PAAD[Pancreatic adenocarcinoma], PRAD[Prostate adenocarcinoma], SKCM[Skin Cutaneous Melanoma], STAD[Stomach adenocarcinoma], THCA[Thyroid carcinoma], UCEC[Uterine Corpus Endometrial Carcinoma] |
| Top |
| Gene Expression for FBP1 |
| * CCLE gene expression data were extracted from CCLE_Expression_Entrez_2012-10-18.res: Gene-centric RMA-normalized mRNA expression data. |
 |
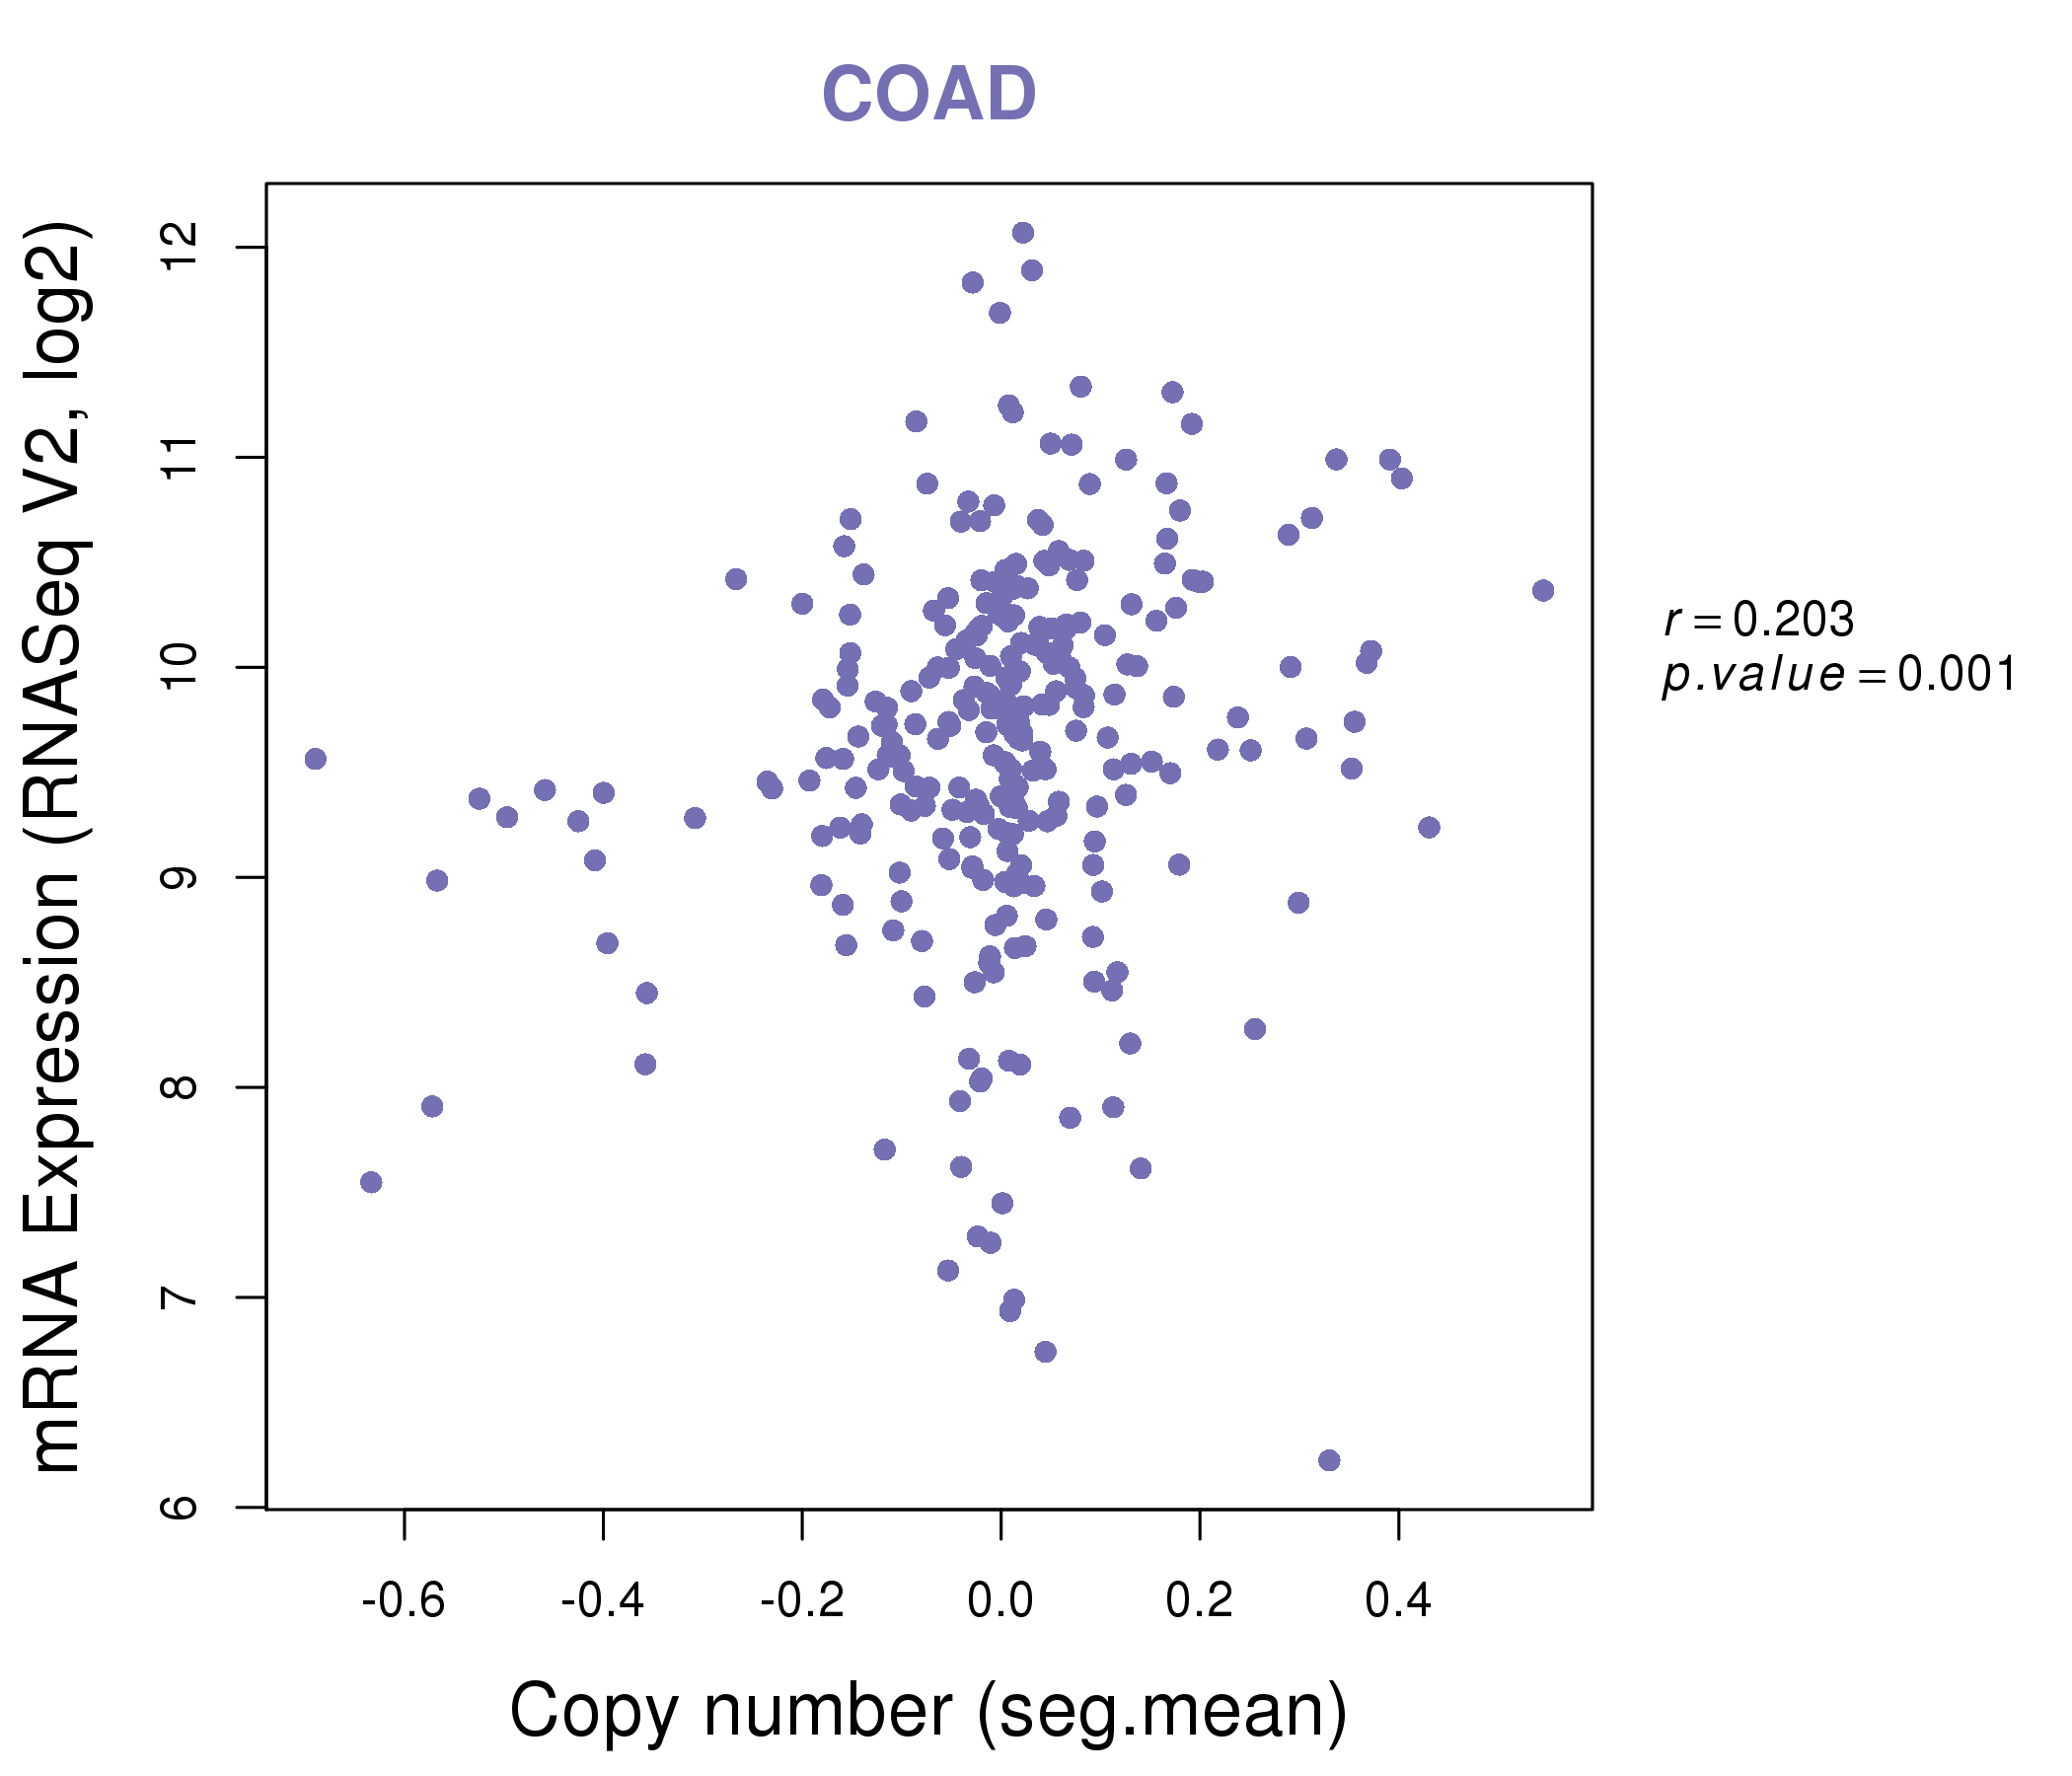
| * Normalized gene expression data of RNASeqV2 was extracted from TCGA using R package TCGA-Assembler. The URLs of all public data files on TCGA DCC data server were gathered at Jan-05-2015. Only eight cancer types have enough normal control samples for differential expression analysis. (t test, adjusted p<0.05 (using Benjamini-Hochberg FDR)) |
 |
| Top |
| * This plots show the correlation between CNV and gene expression. |
: Open all plots for all cancer types
 |
|
 |
|


| Top |
| Gene-Gene Network Information |
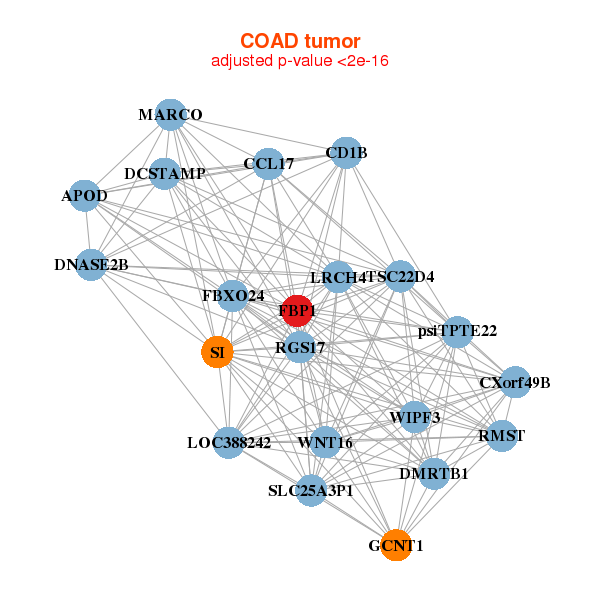
| * Co-Expression network figures were drawn using R package igraph. Only the top 20 genes with the highest correlations were shown. Red circle: input gene, orange circle: cell metabolism gene, sky circle: other gene |
: Open all plots for all cancer types
 |
| ||||
| ARFIP2,COQ4,COQ6,FAAH,FBP1,G6PC3,GAMT, GATA3,CCDC183,MDP1,MLPH,MOAP1,NECAB3,OCEL1, P4HTM,PRR15,RAB17,SIGIRR,SPDEF,TMEM141,ZNF467 | AIFM3,ATP6AP1,ATP6V0B,BIK,CCDC159,CLN3,FBP1, GAA,NEU1,P2RX4,RAB17,RNASET2,RNPEP,RPS6KA1, SLC26A11,STXBP2,SULT2B1,TBC1D2,TMED3,TMEM141,VAMP8 | ||||
 |
| ||||
| APOD,CCL17,CD1B,CXorf49B,DMRTB1,DNASE2B,FBP1, FBXO24,SLC25A3P1,GCNT1,LOC388242,LRCH4,MARCO,psiTPTE22, RGS17,RMST,SI,DCSTAMP,TSC22D4,WIPF3,WNT16 | ABCC2,ABCG5,ABCG8,ACE,ALDOB,ERICH4,CYP2D6, DAK,DHDH,DPEP1,FBP1,GSTA1,GSTA2,MGAM, NAT8,NR0B2,REEP6,SHBG,SLC10A2,SLC5A4,TREH |


| * Co-Expression network figures were drawn using R package igraph. Only the top 20 genes with the highest correlations were shown. Red circle: input gene, orange circle: cell metabolism gene, sky circle: other gene |
: Open all plots for all cancer types
| Top |
: Open all interacting genes' information including KEGG pathway for all interacting genes from DAVID
| Top |
| Pharmacological Information for FBP1 |
| DB Category | DB Name | DB's ID and Url link |
| * Gene Centered Interaction Network. |
 |
| * Drug Centered Interaction Network. |
| DrugBank ID | Target Name | Drug Groups | Generic Name | Drug Centered Network | Drug Structure |
| DB00131 | fructose-1,6-bisphosphatase 1 | approved; nutraceutical | Adenosine monophosphate | 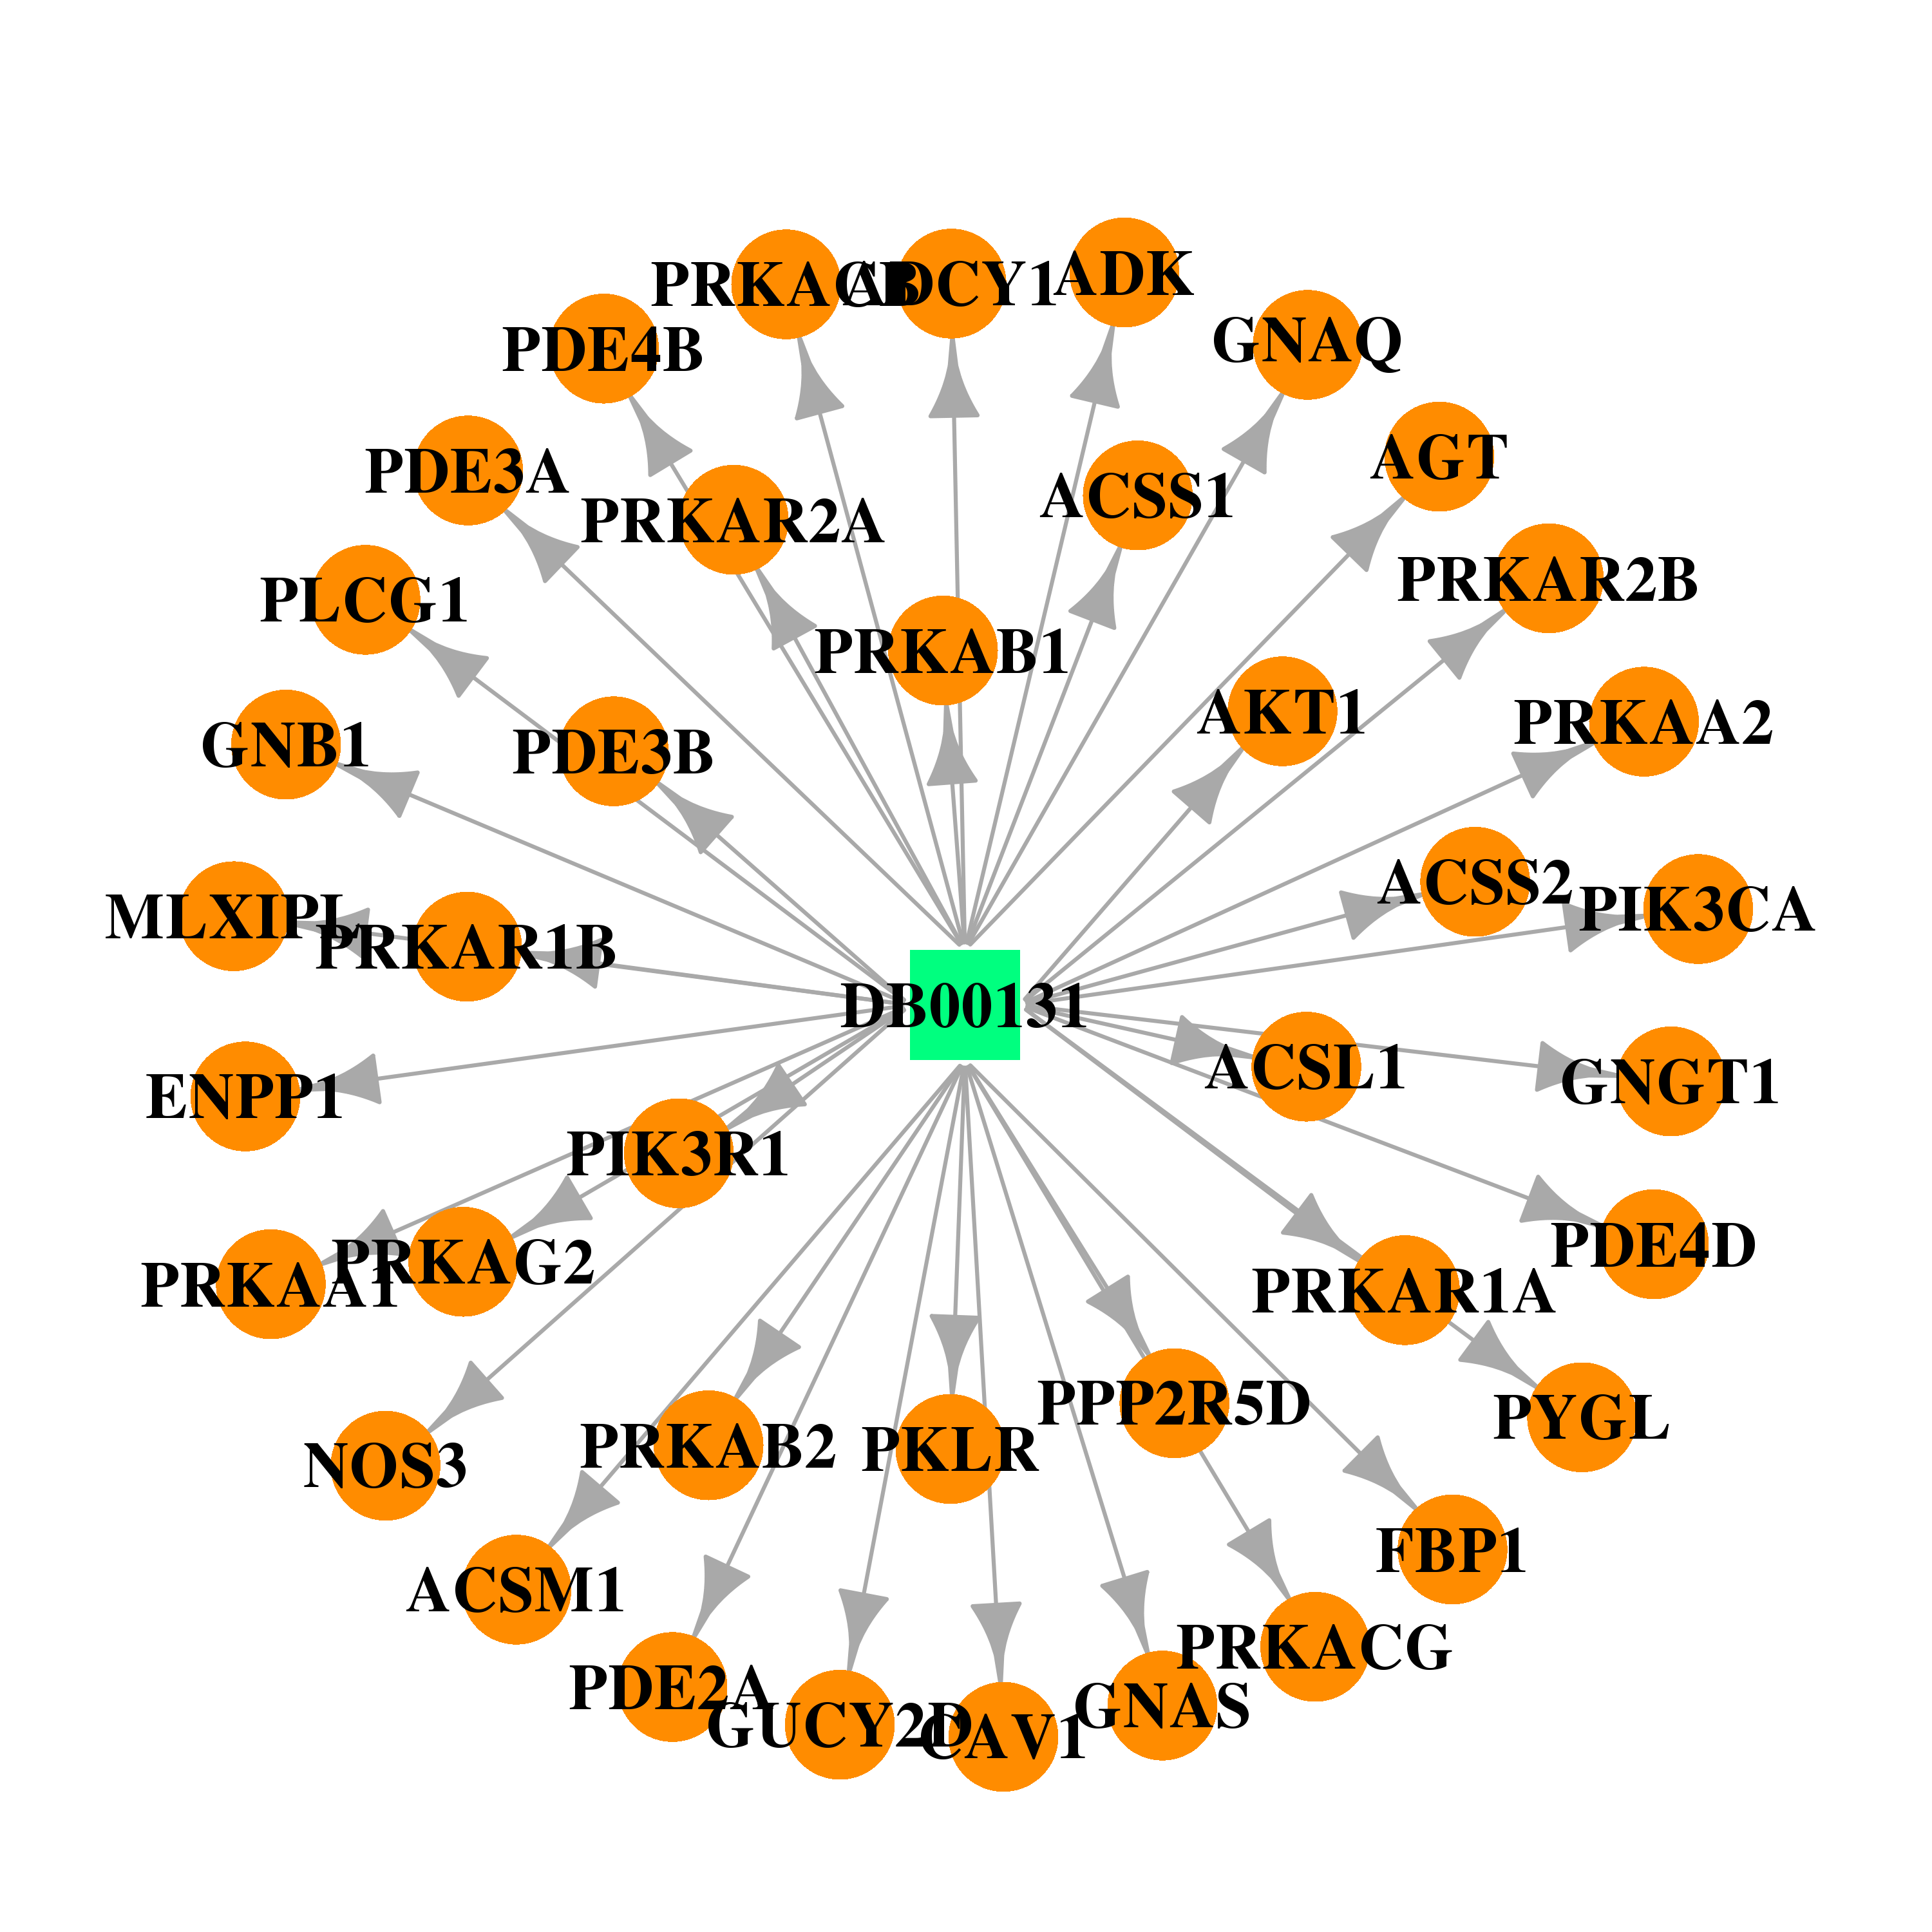 | 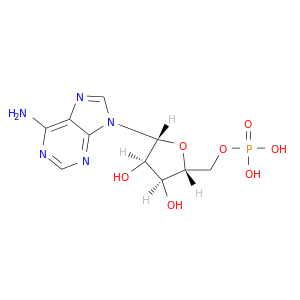 |
| DB02778 | fructose-1,6-bisphosphatase 1 | experimental | 2,5-Anhydroglucitol-1,6-Biphosphate | 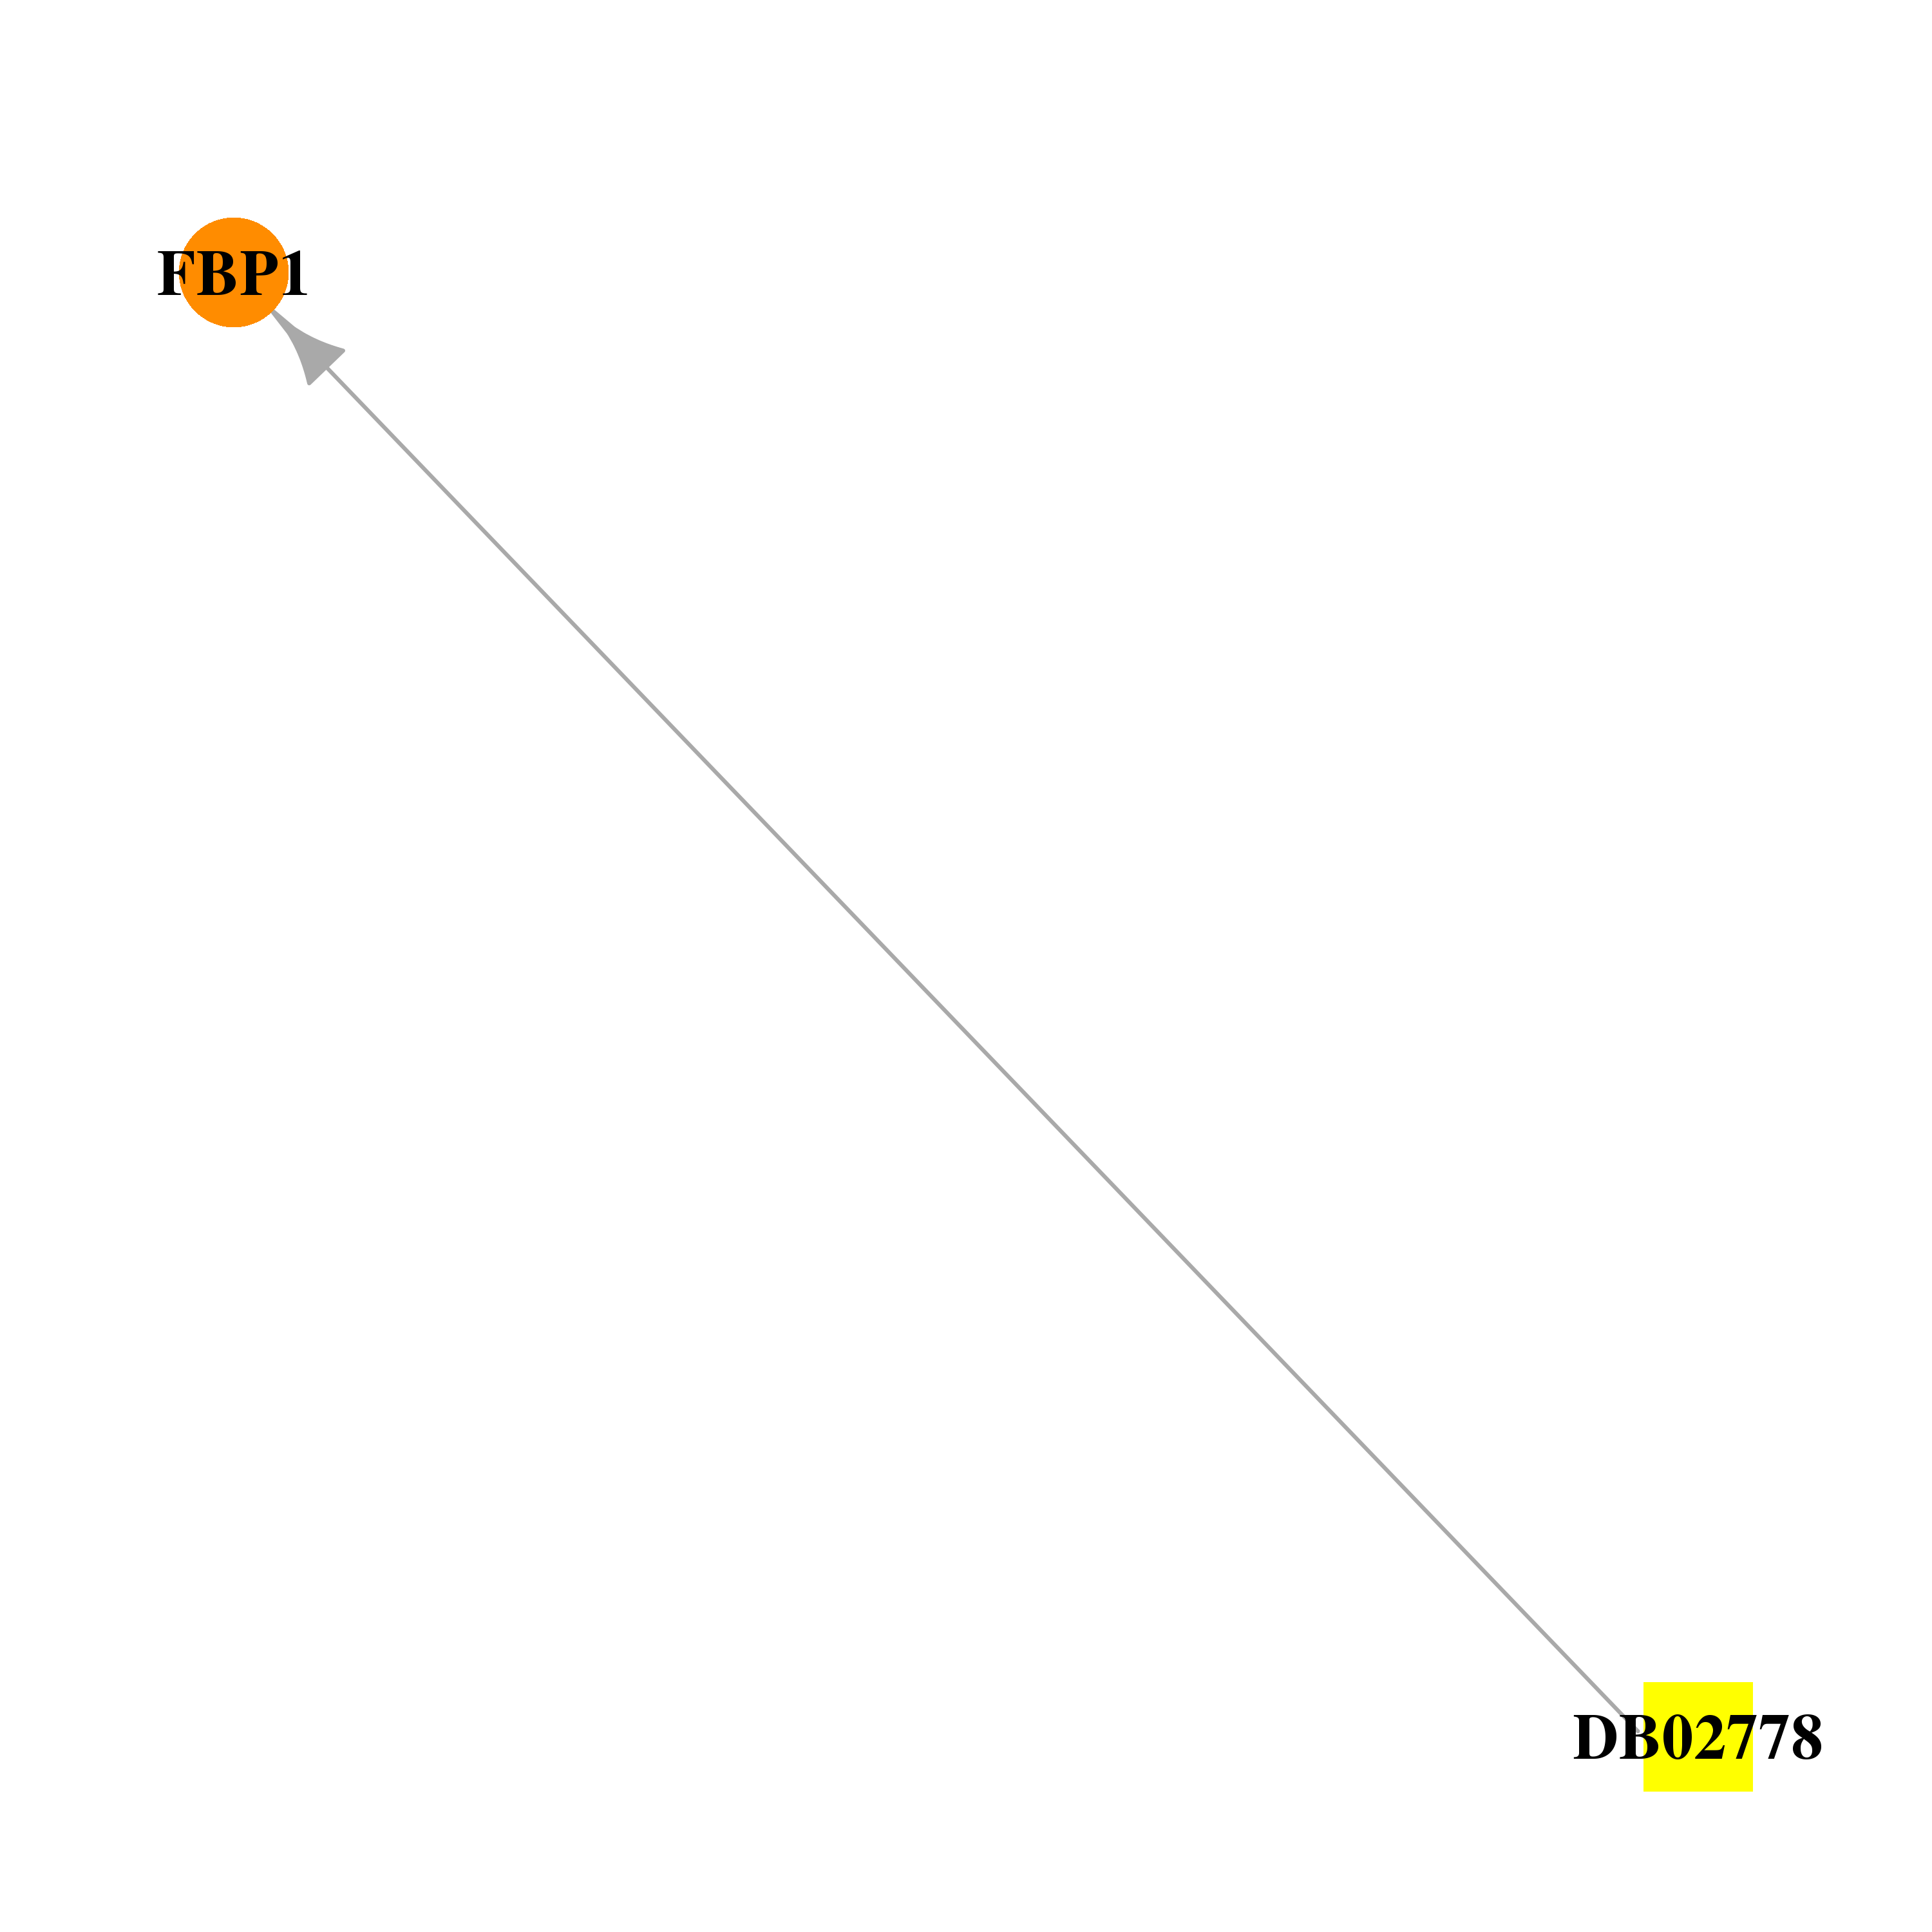 |  |
| DB02848 | fructose-1,6-bisphosphatase 1 | experimental | {4-[3-(6,7-Diethoxy-Quinazolin-4-Ylamino)-Phenyl]-Thiazol-2-Yl}-Methanol | 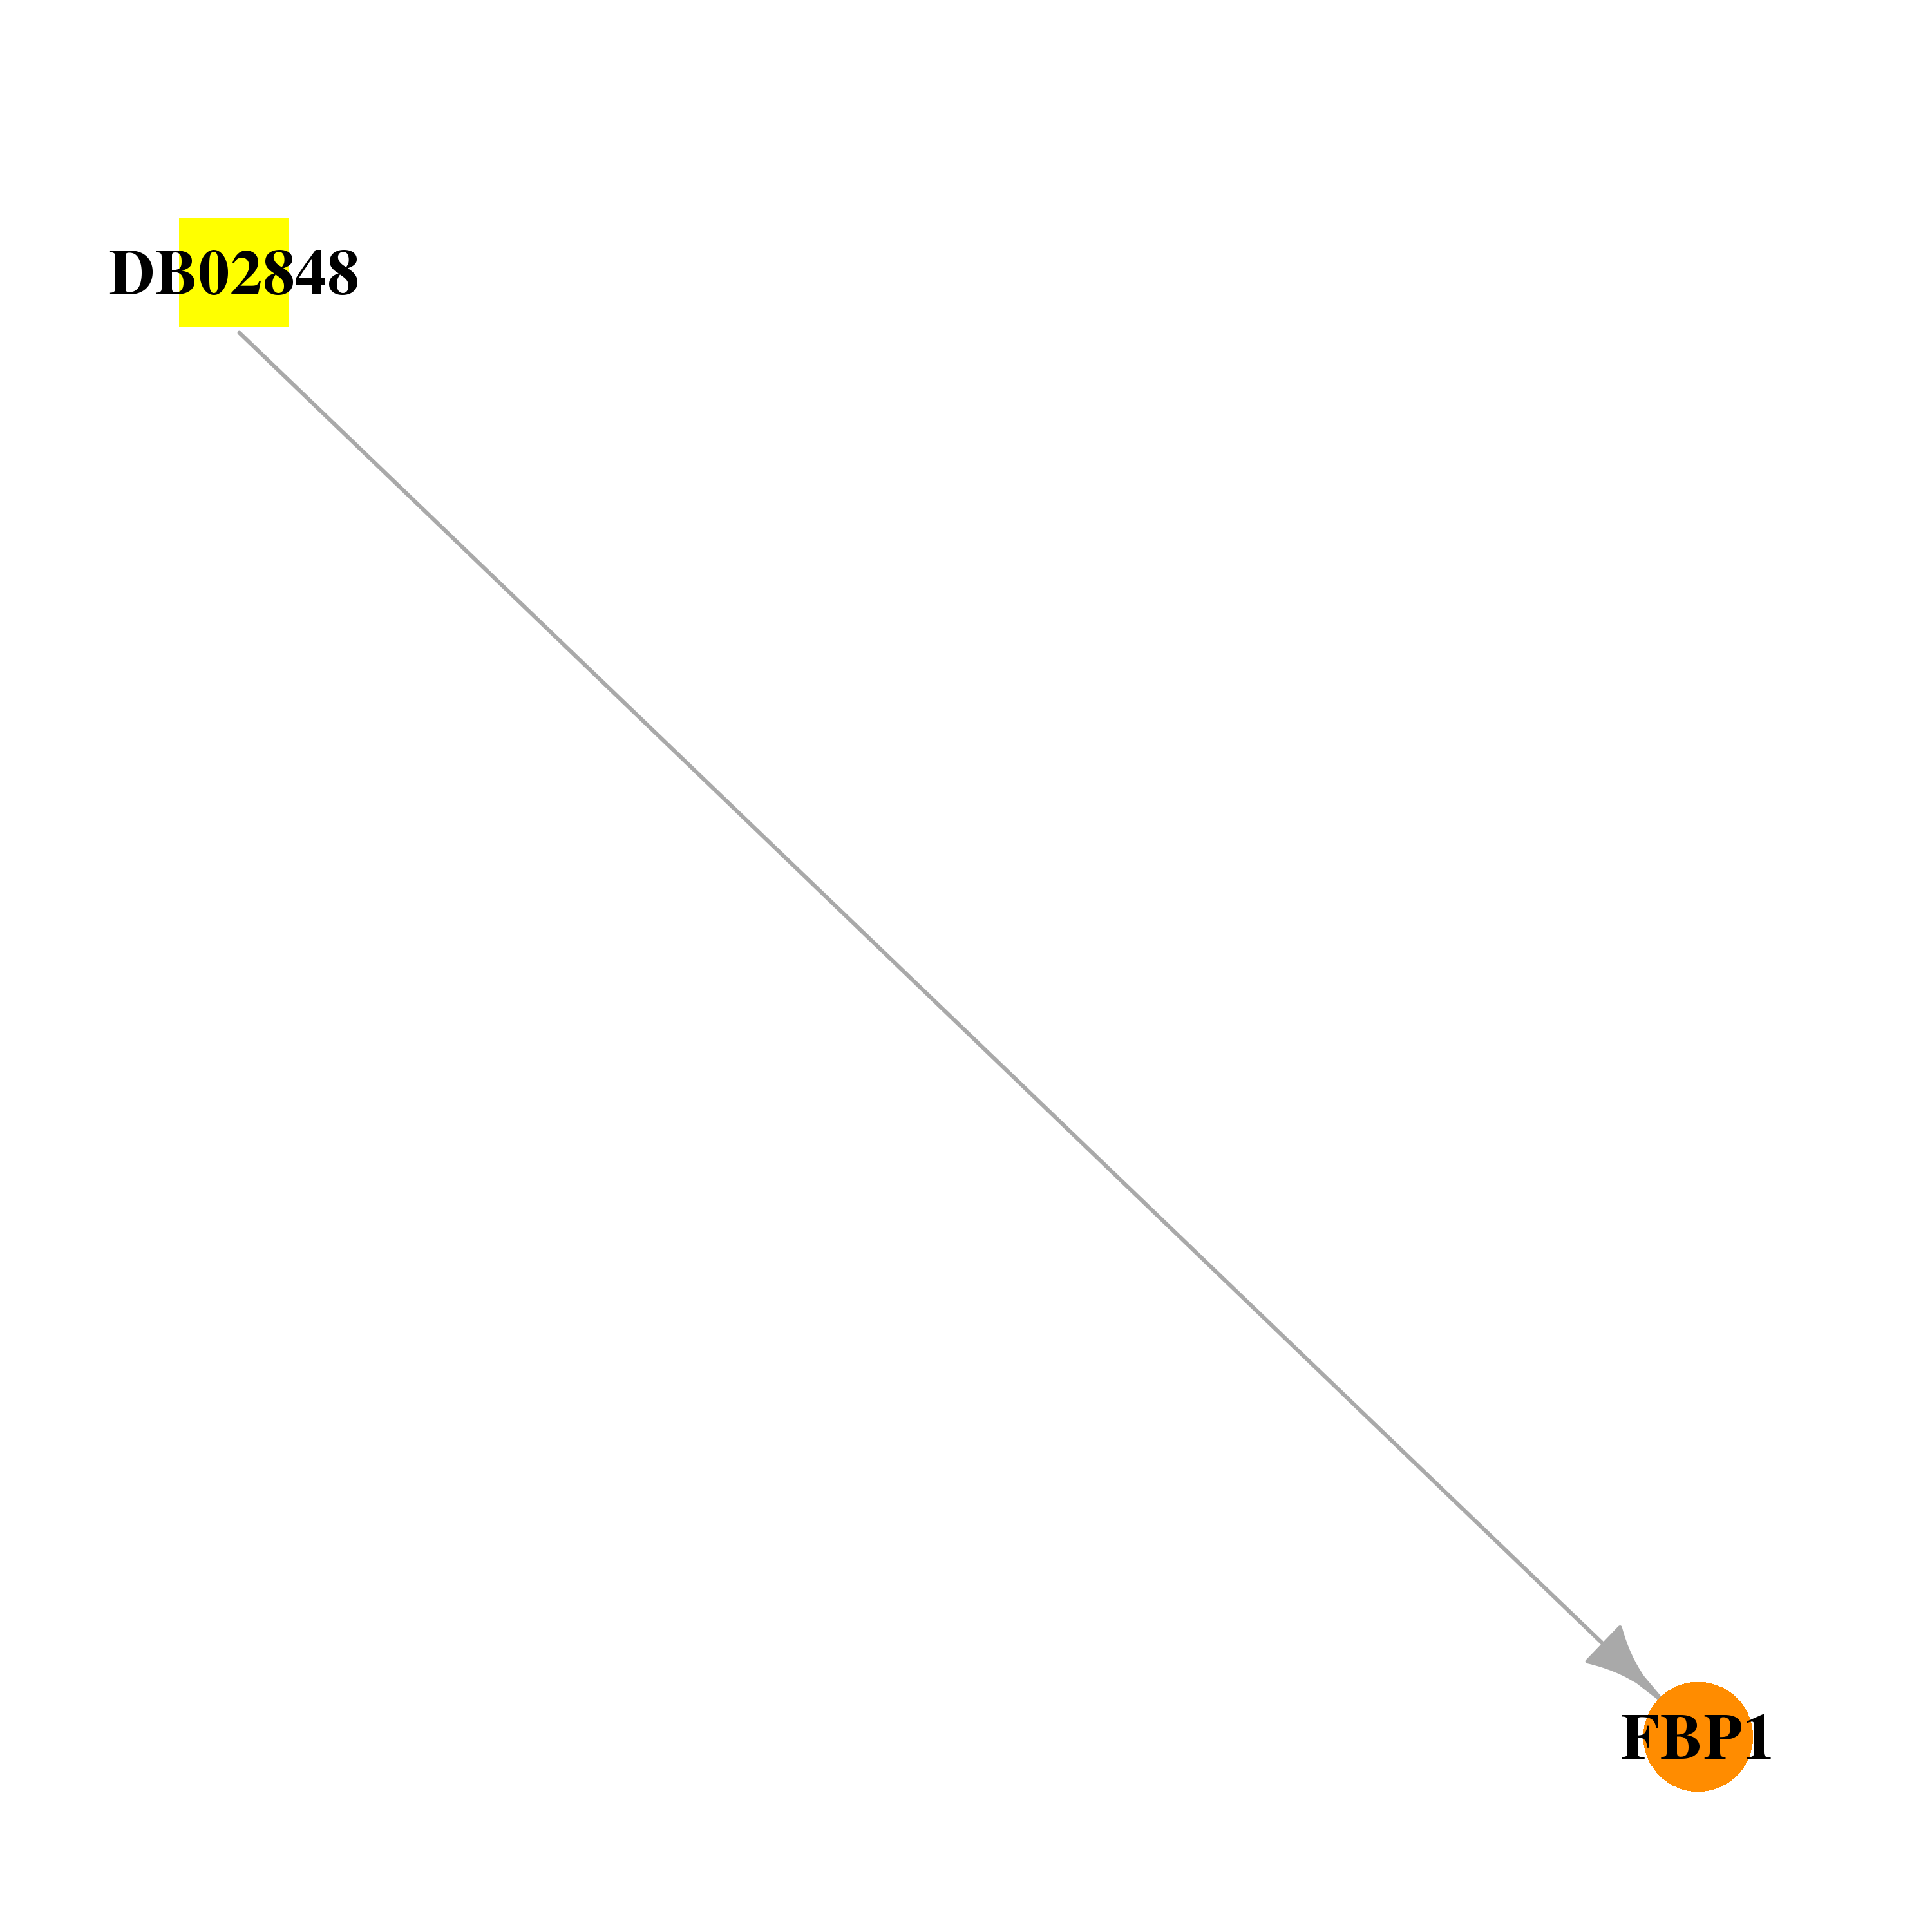 |  |
| DB04175 | fructose-1,6-bisphosphatase 1 | experimental | Mdl-29951 | 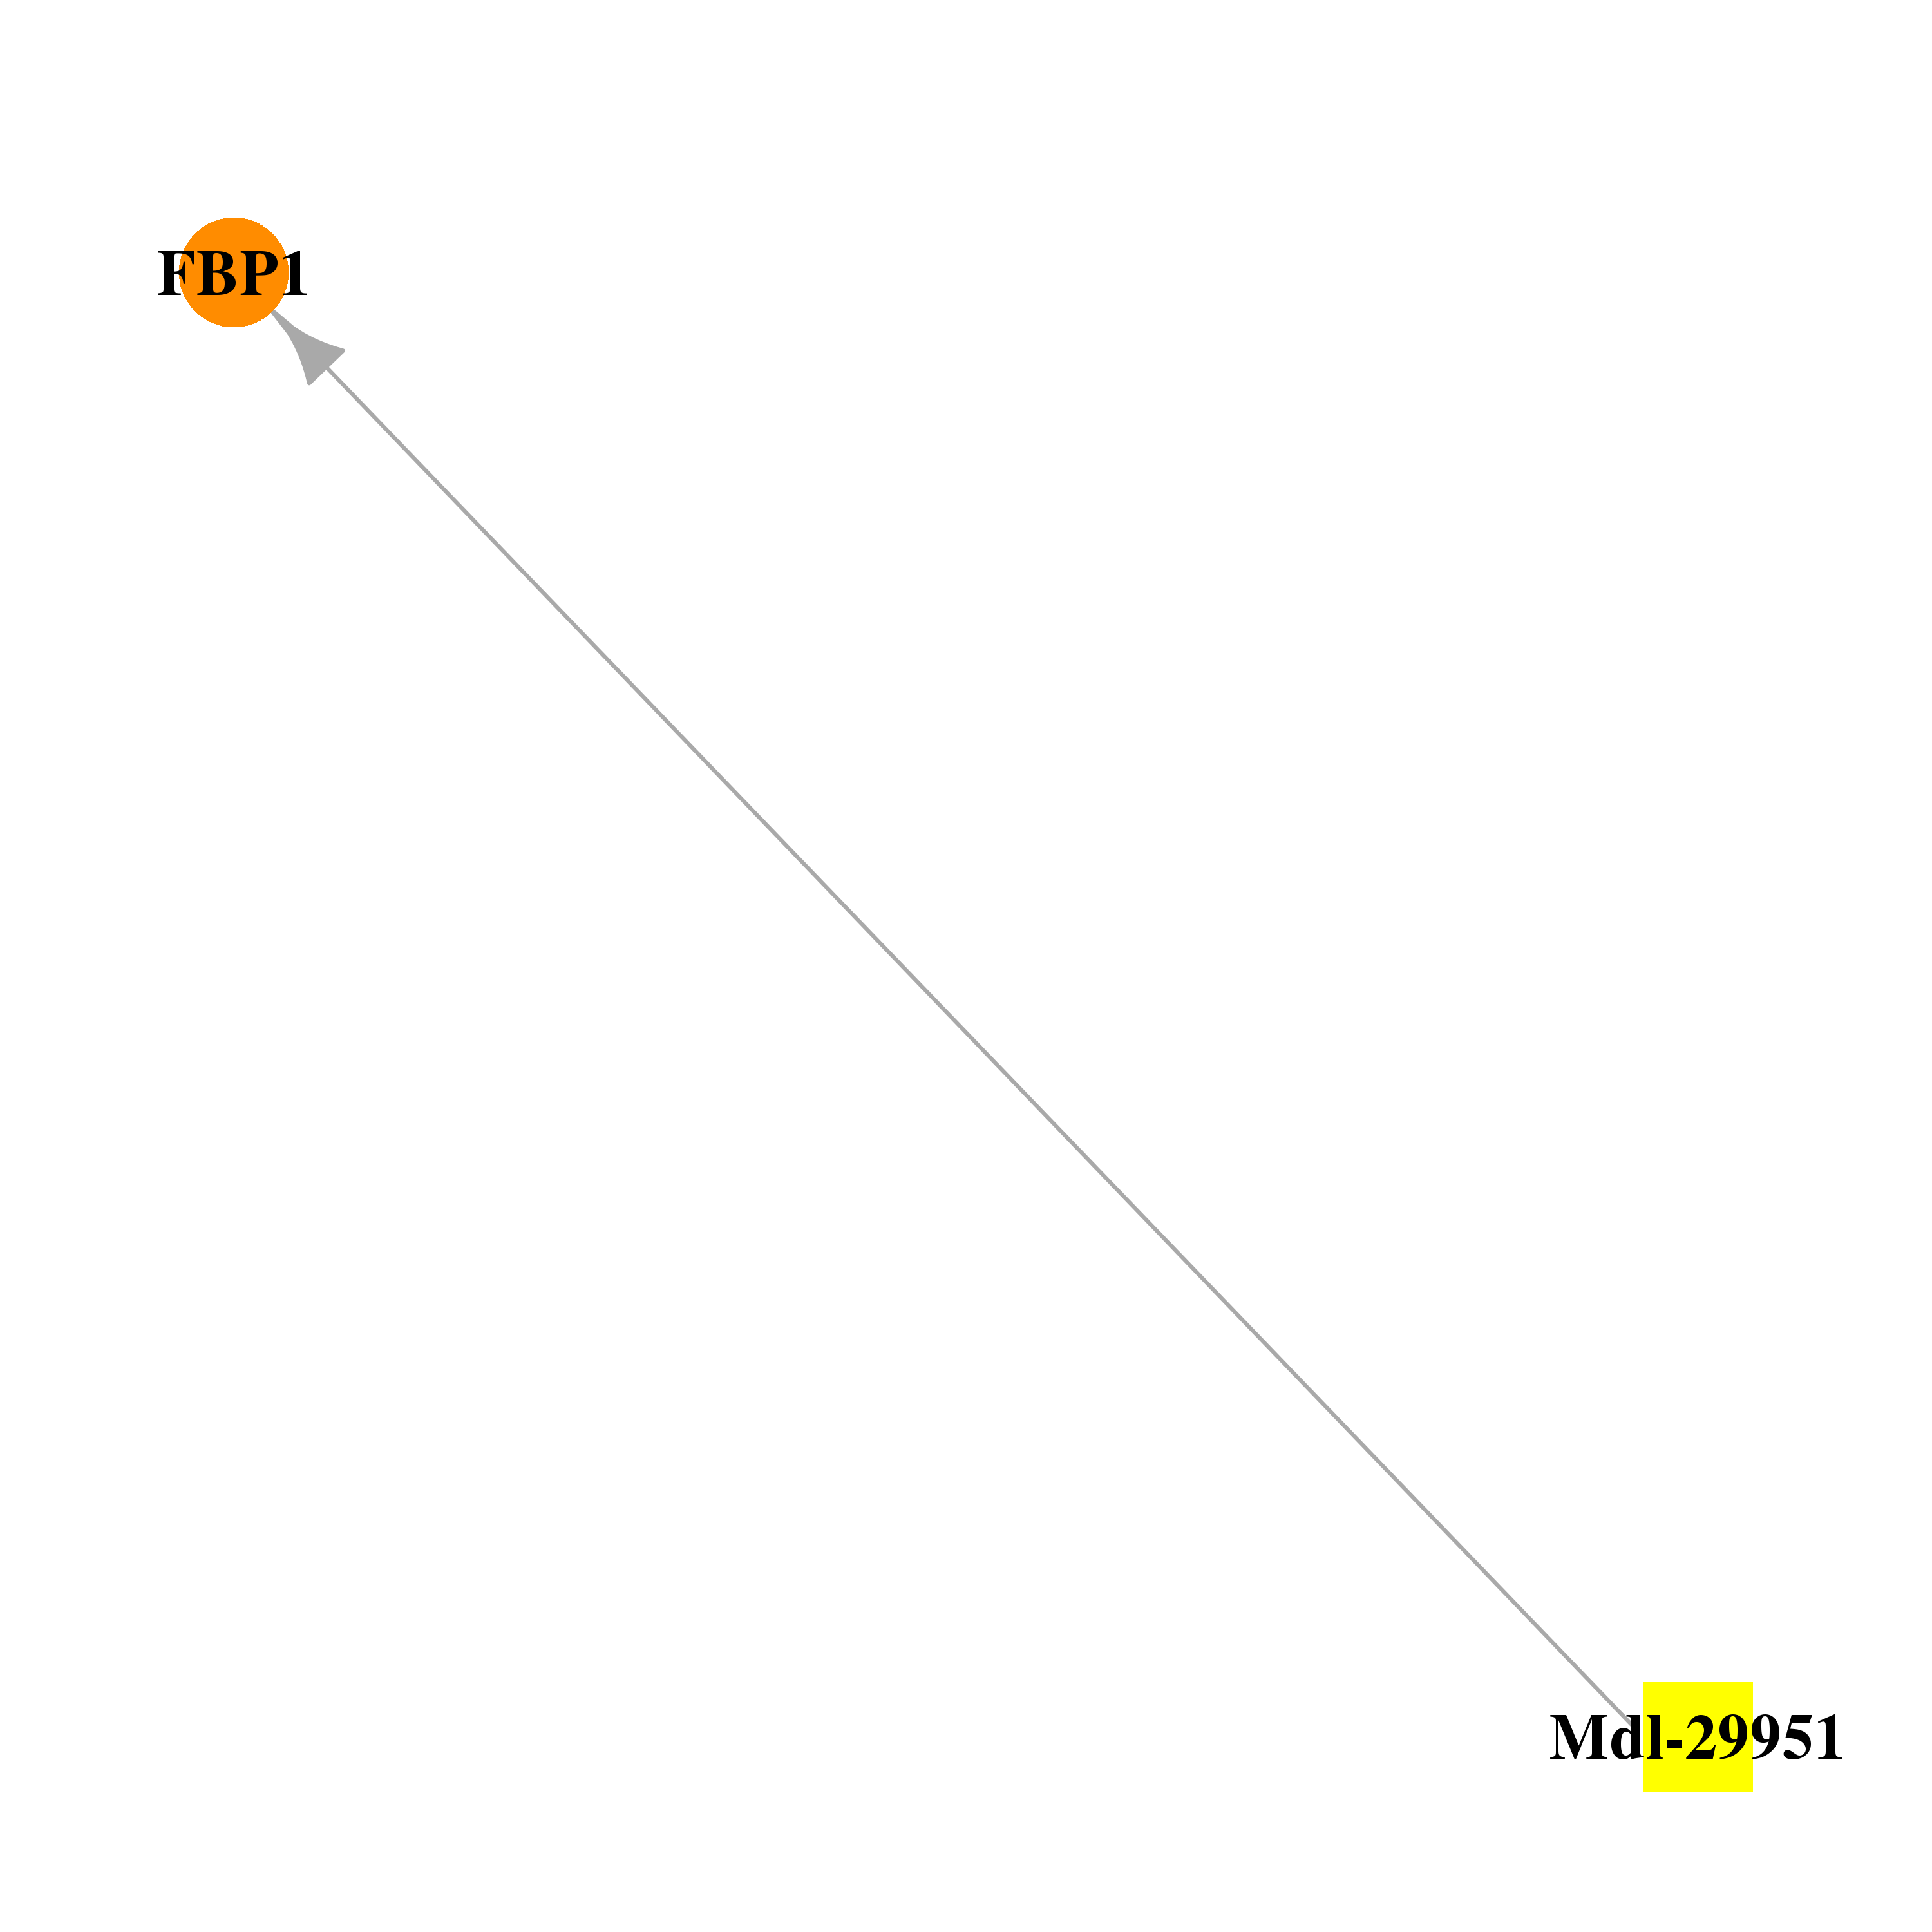 |  |
| DB04493 | fructose-1,6-bisphosphatase 1 | experimental | Fructose-6-Phosphate | 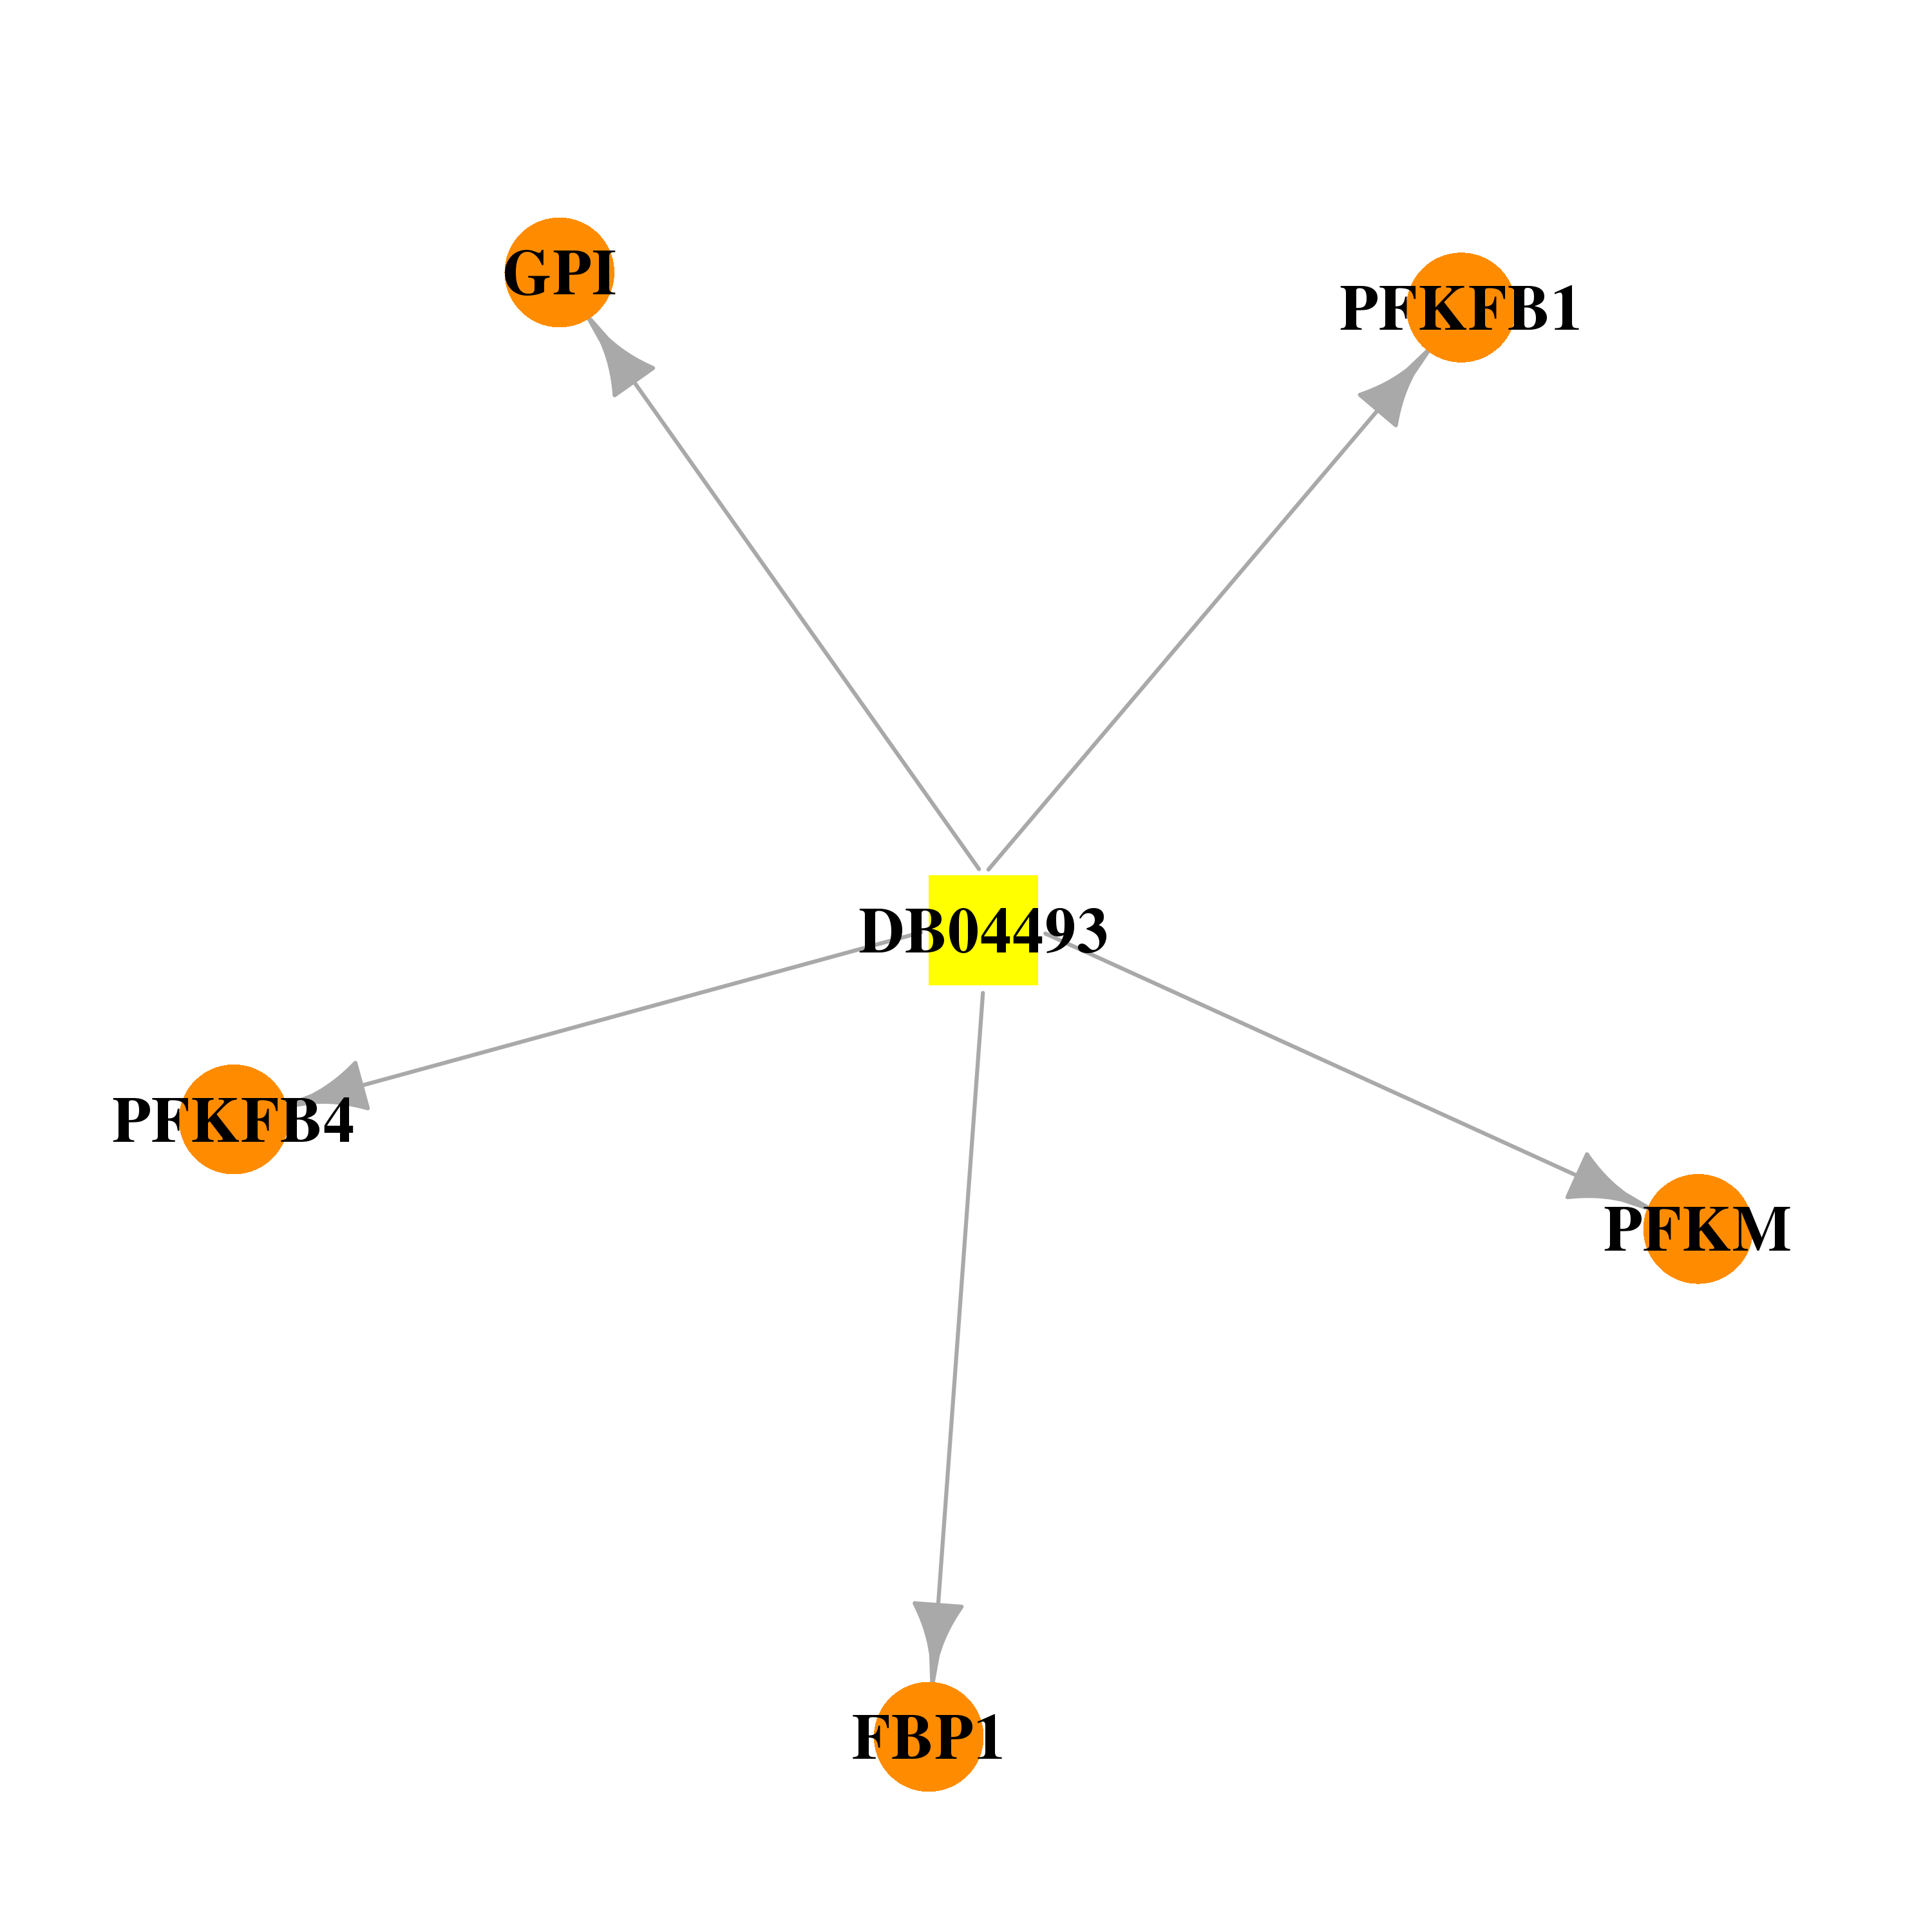 | 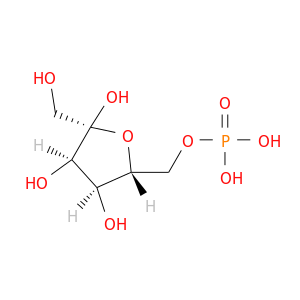 |
| DB07270 | fructose-1,6-bisphosphatase 1 | experimental | N-[7-(3-AMINOPHENYL)-5-METHOXY-1,3-BENZOXAZOL-2-YL]-2,5-DICHLOROBENZENESULFONAMIDE |  |  |
| DB07312 | fructose-1,6-bisphosphatase 1 | experimental | 2,5-DICHLORO-N-(5-CHLORO-1,3-BENZOXAZOL-2-YL)BENZENESULFONAMIDE |  | 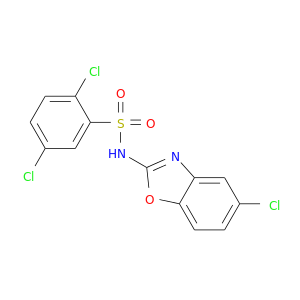 |
| DB07321 | fructose-1,6-bisphosphatase 1 | experimental | 2,5-DICHLORO-N-[5-METHOXY-7-(6-METHOXYPYRIDIN-3-YL)-1,3-BENZOXAZOL-2-YL]BENZENESULFONAMIDE | 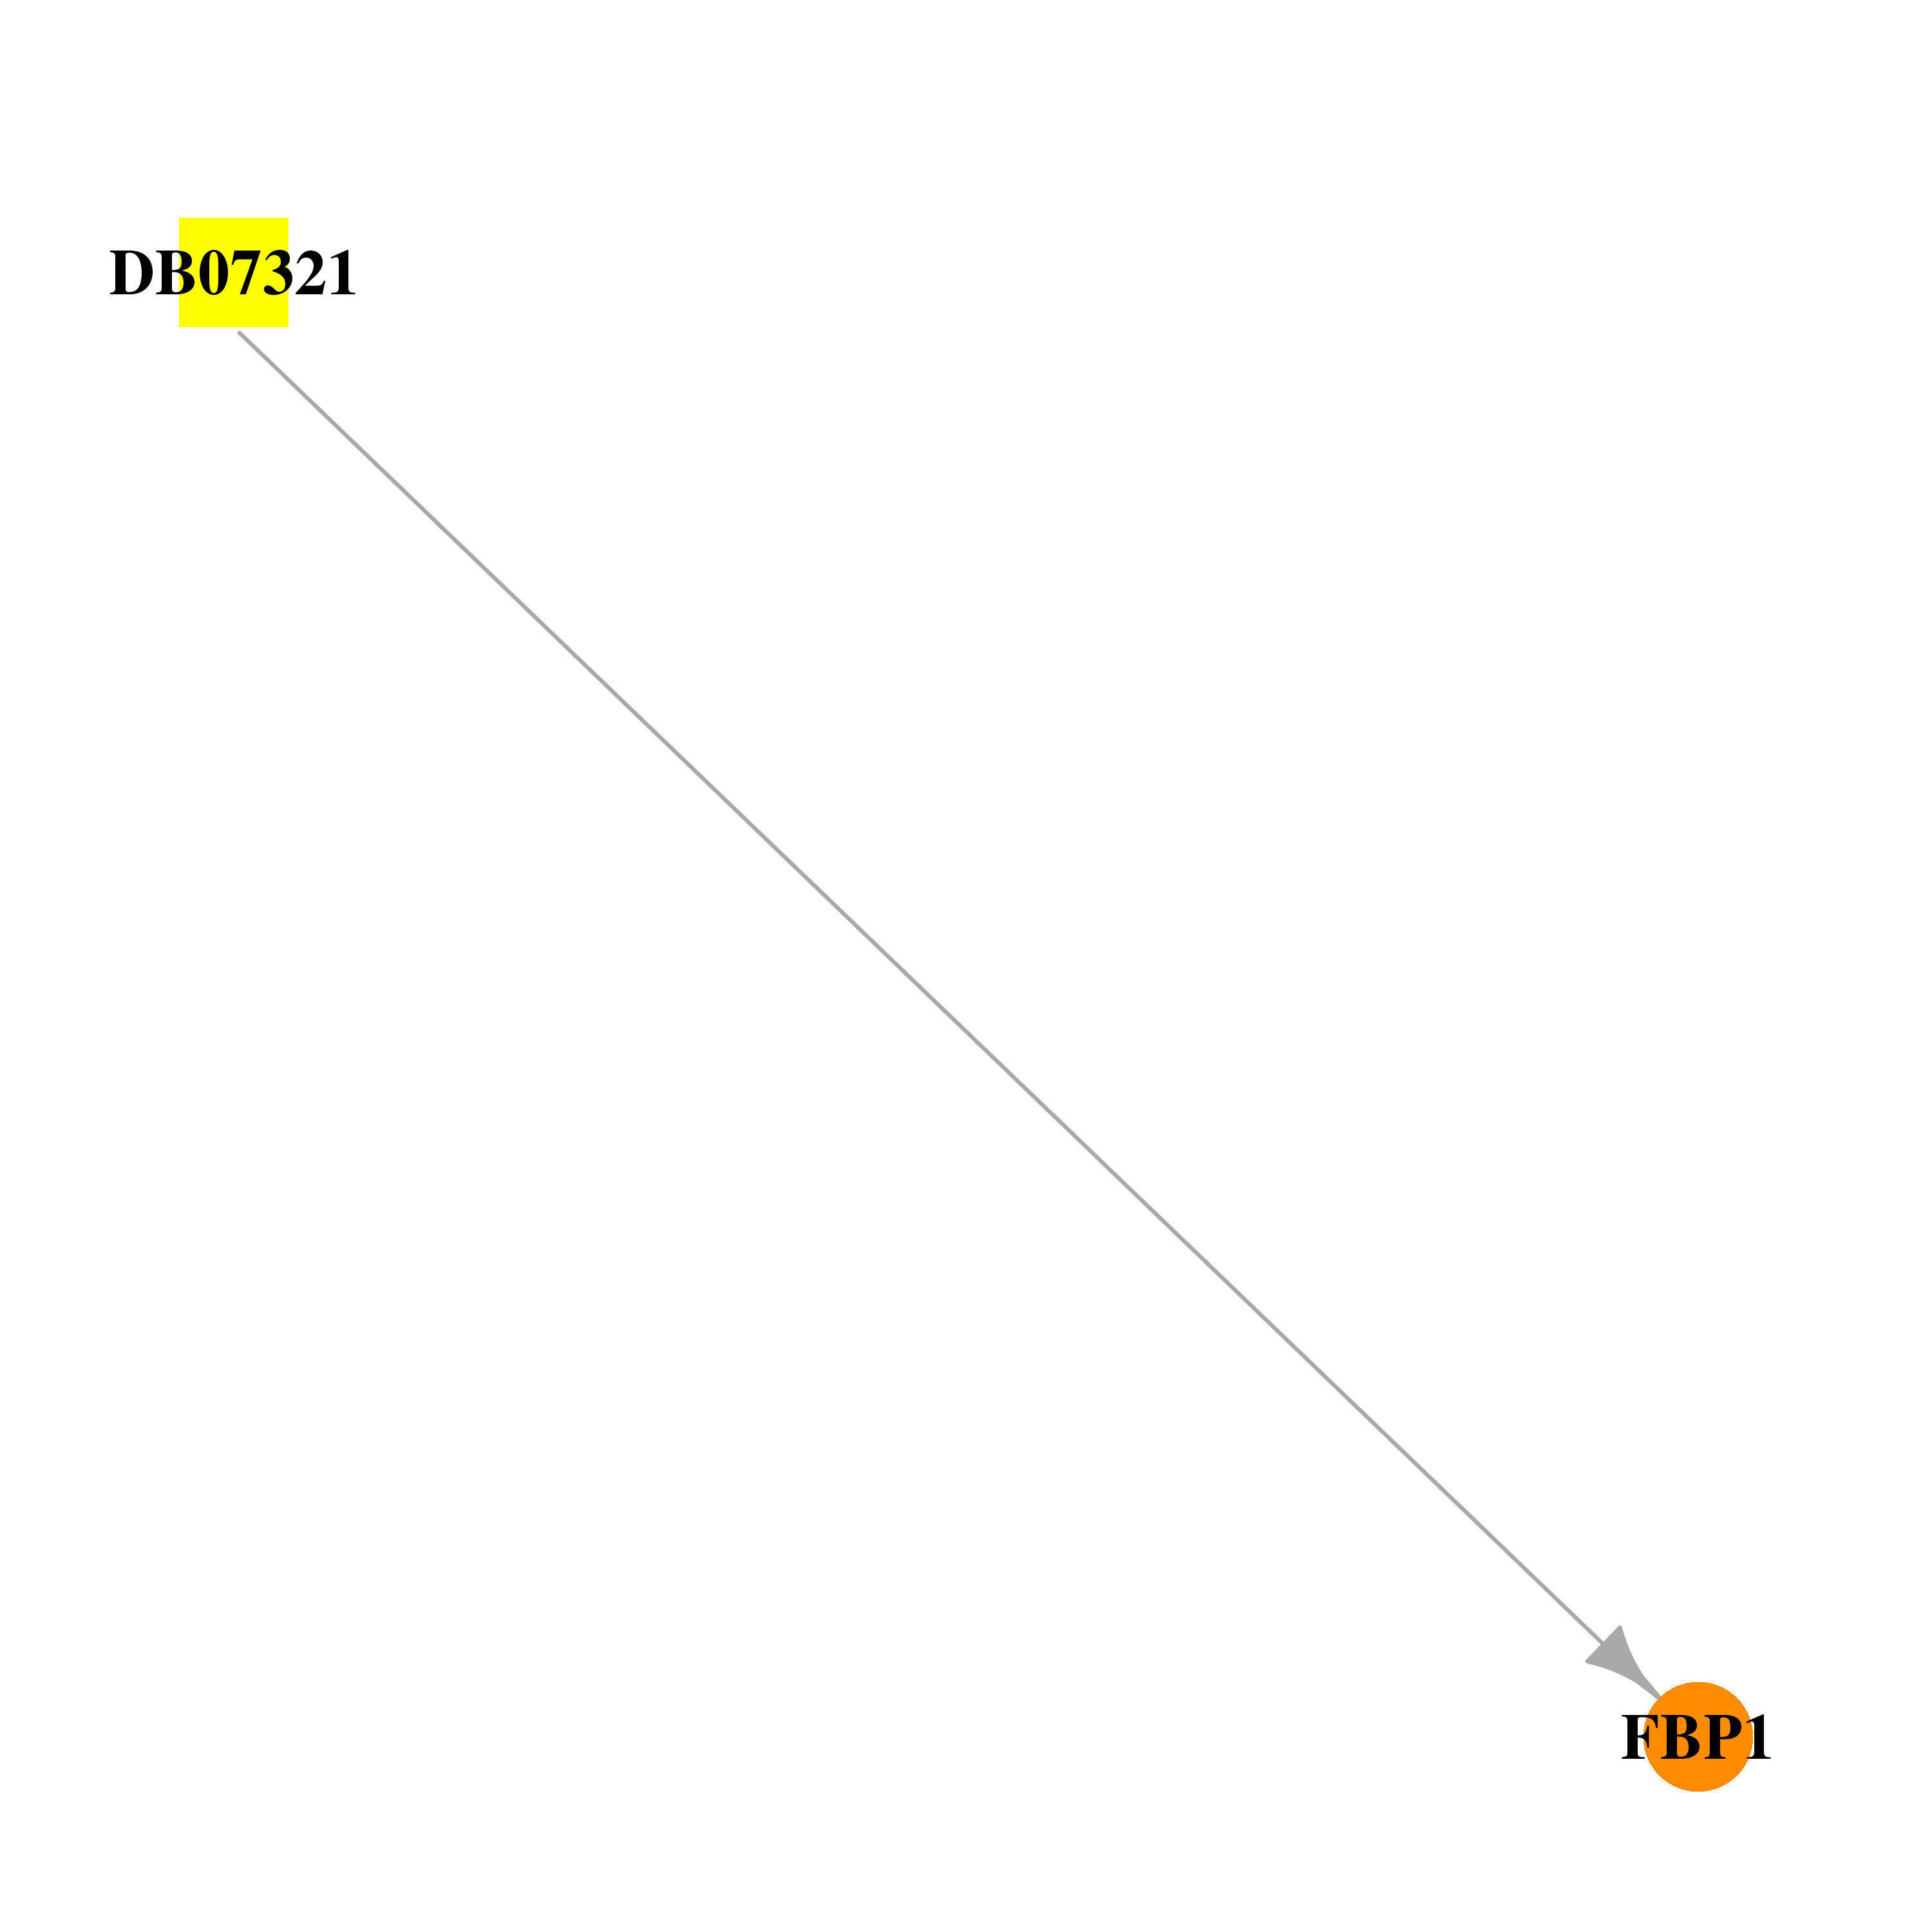 |  |
| DB08484 | fructose-1,6-bisphosphatase 1 | experimental | 4-AMINO-N-[(2-SULFANYLETHYL)CARBAMOYL]BENZENESULFONAMIDE | 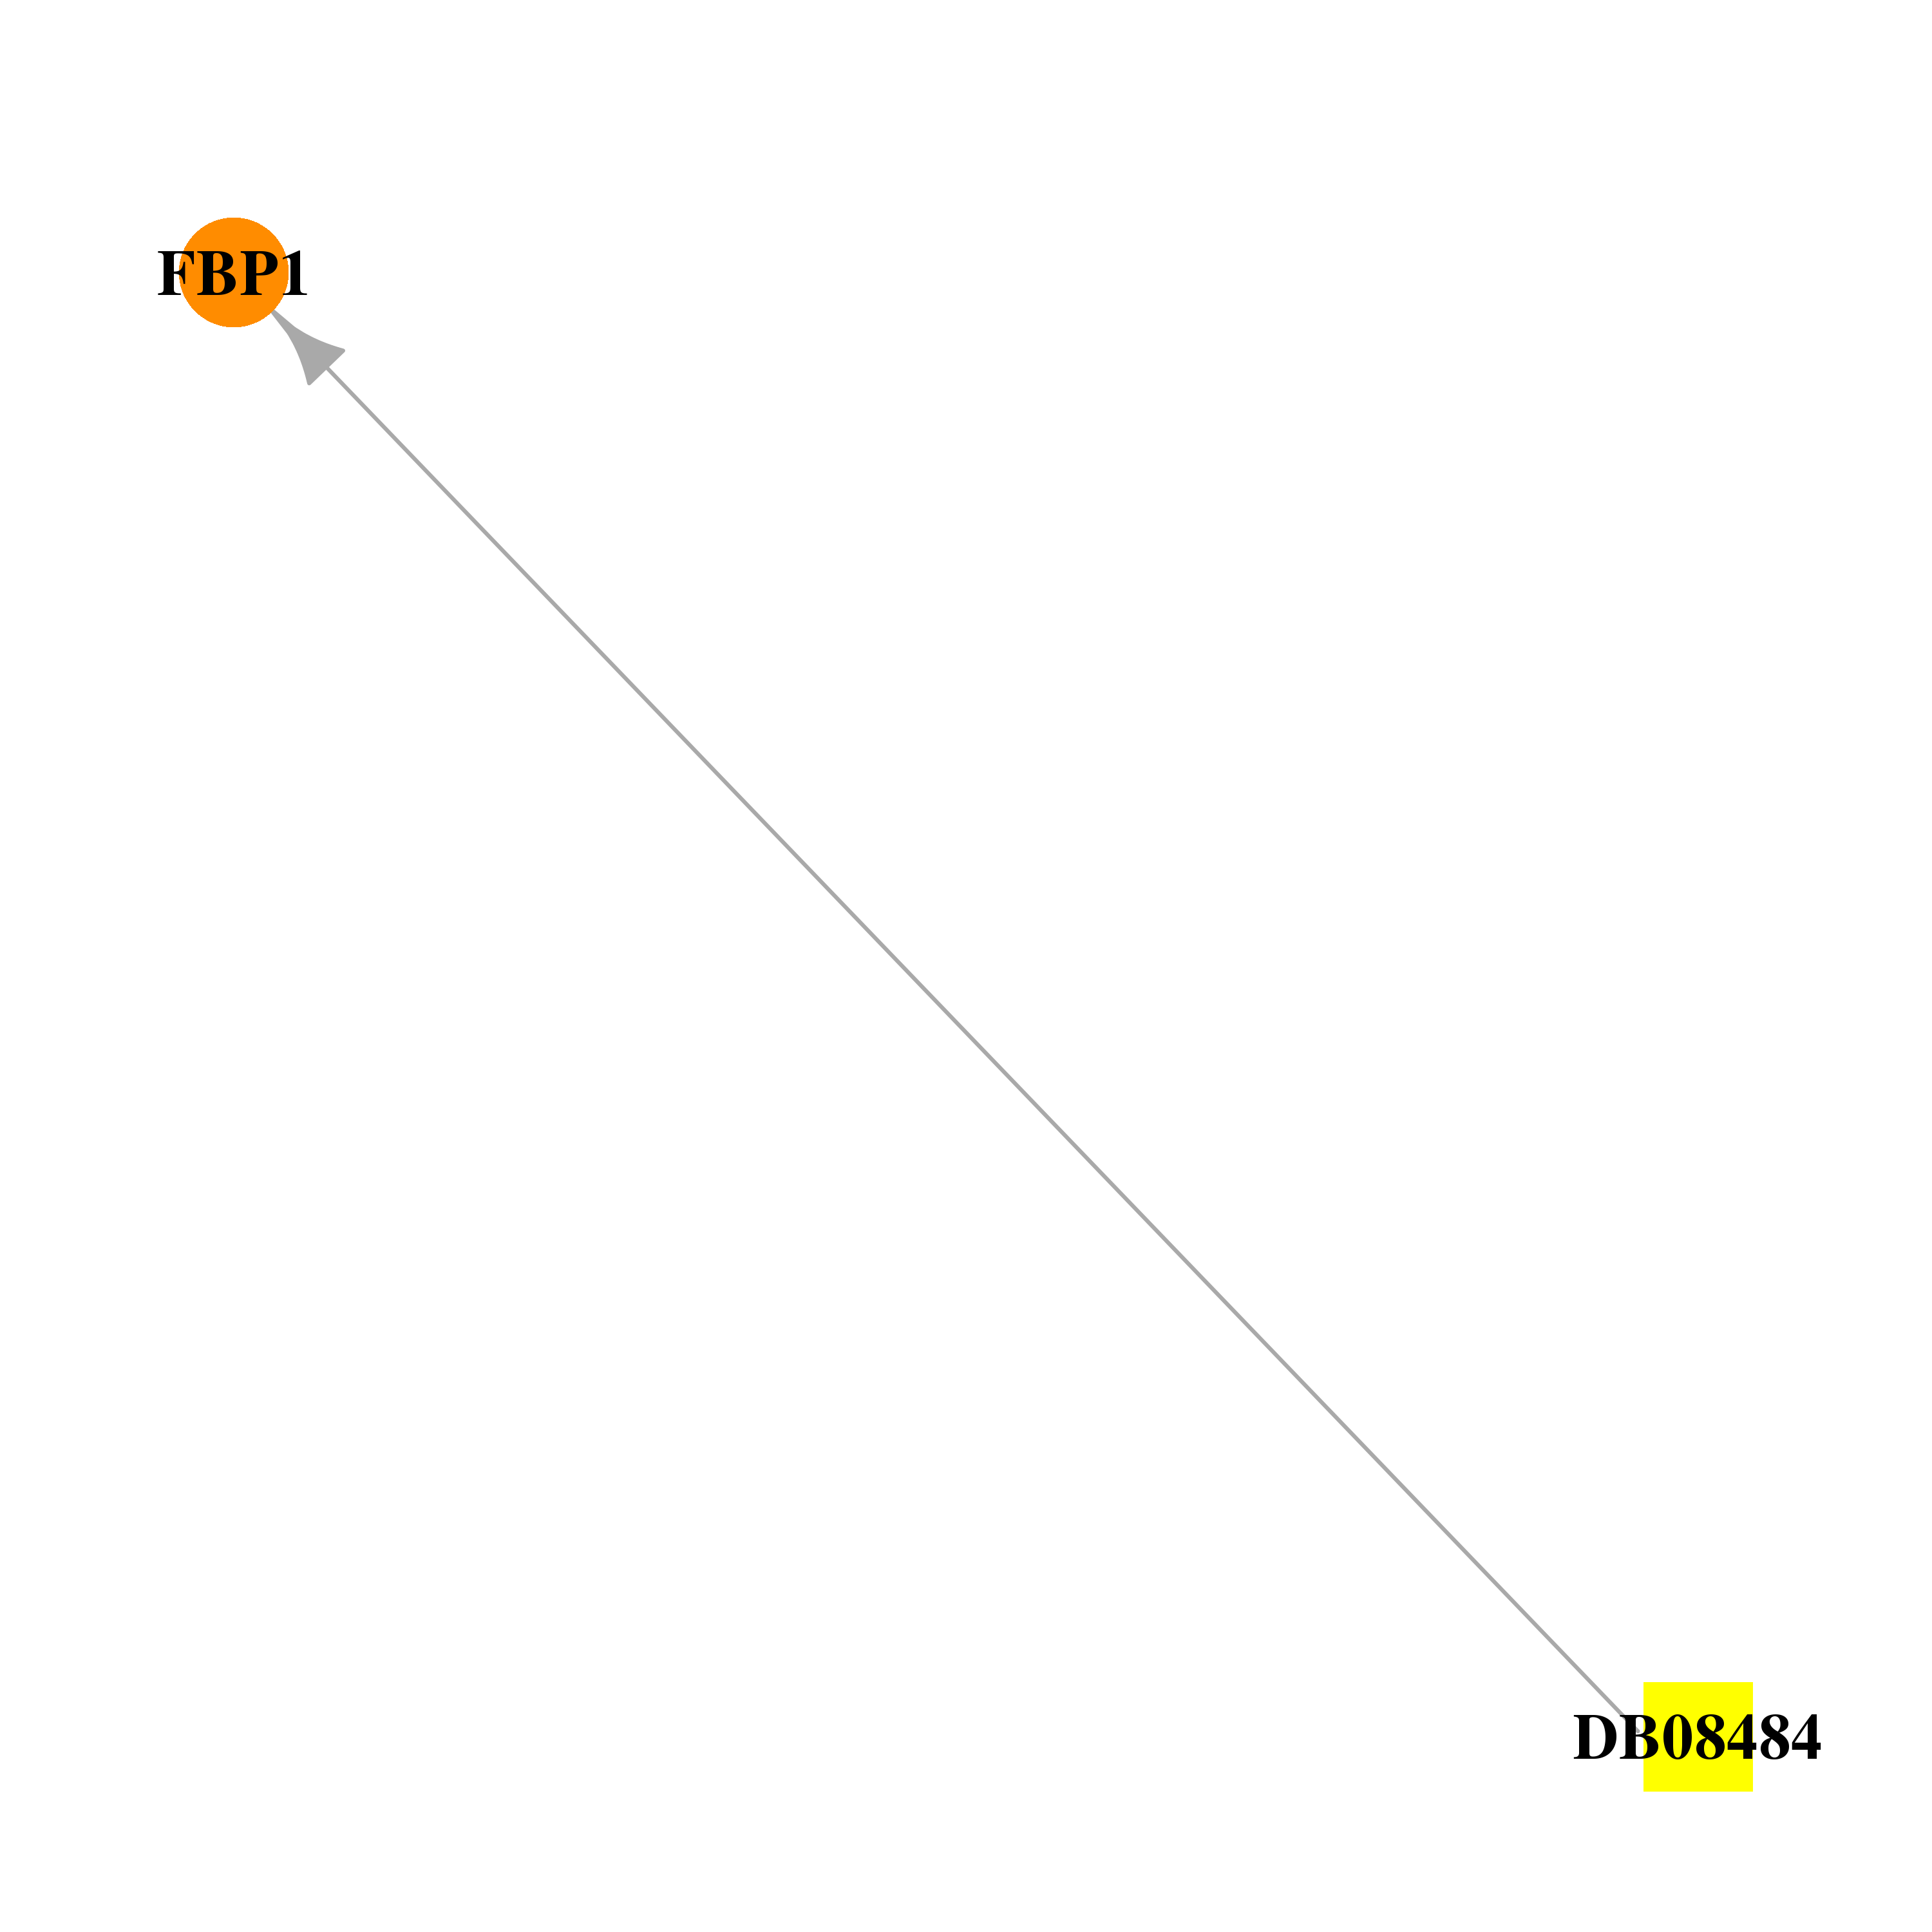 |  |
| Top |
| Cross referenced IDs for FBP1 |
| * We obtained these cross-references from Uniprot database. It covers 150 different DBs, 18 categories. http://www.uniprot.org/help/cross_references_section |
: Open all cross reference information
|
Copyright © 2016-Present - The Univsersity of Texas Health Science Center at Houston @ |