|
||||||||||||||||||||
| |
| Phenotypic Information (metabolism pathway, cancer, disease, phenome) |
| |
| |
| Gene-Gene Network Information: Co-Expression Network, Interacting Genes & KEGG |
| |
|


| Gene Summary for PRPS1L1 |
| Basic gene info. | Gene symbol | PRPS1L1 |
| Gene name | phosphoribosyl pyrophosphate synthetase 1-like 1 | |
| Synonyms | PRPS1|PRPS3|PRPSL|PRS-III | |
| Cytomap | UCSC genome browser: 7p21.1 | |
| Genomic location | chr7 :18066399-18067486 | |
| Type of gene | protein-coding | |
| RefGenes | NM_175886.2, | |
| Ensembl id | ENSG00000229937 | |
| Description | PRPS1-like 1phosphoribosyl pyrophosphate synthase 1-like 1phosphoribosyl pyrophosphate synthase IIIphosphoribosylpyrophosphate synthetase subunit IIIribose-phosphate diphosphokinase catalytic chain IIIribose-phosphate pyrophosphokinase 3ribose-phosp | |
| Modification date | 20141207 | |
| dbXrefs | MIM : 611566 | |
| HGNC : HGNC | ||
| Ensembl : ENSG00000229937 | ||
| HPRD : 17914 | ||
| Vega : OTTHUMG00000152742 | ||
| Protein | UniProt: go to UniProt's Cross Reference DB Table | |
| Expression | CleanEX: HS_PRPS1L1 | |
| BioGPS: 221823 | ||
| Gene Expression Atlas: ENSG00000229937 | ||
| The Human Protein Atlas: ENSG00000229937 | ||
| Pathway | NCI Pathway Interaction Database: PRPS1L1 | |
| KEGG: PRPS1L1 | ||
| REACTOME: PRPS1L1 | ||
| ConsensusPathDB | ||
| Pathway Commons: PRPS1L1 | ||
| Metabolism | MetaCyc: PRPS1L1 | |
| HUMANCyc: PRPS1L1 | ||
| Regulation | Ensembl's Regulation: ENSG00000229937 | |
| miRBase: chr7 :18,066,399-18,067,486 | ||
| TargetScan: NM_175886 | ||
| cisRED: ENSG00000229937 | ||
| Context | iHOP: PRPS1L1 | |
| cancer metabolism search in PubMed: PRPS1L1 | ||
| UCL Cancer Institute: PRPS1L1 | ||
| Assigned class in ccmGDB | C | |
| Top |
| Phenotypic Information for PRPS1L1(metabolism pathway, cancer, disease, phenome) |
| Cancer | CGAP: PRPS1L1 |
| Familial Cancer Database: PRPS1L1 | |
| * This gene is included in those cancer gene databases. |
|
|
|
|
|
|
| ||||||||||||||
Oncogene 1 | Significant driver gene in | |||||||||||||||||||
| cf) number; DB name 1 Oncogene; http://nar.oxfordjournals.org/content/35/suppl_1/D721.long, 2 Tumor Suppressor gene; https://bioinfo.uth.edu/TSGene/, 3 Cancer Gene Census; http://www.nature.com/nrc/journal/v4/n3/abs/nrc1299.html, 4 CancerGenes; http://nar.oxfordjournals.org/content/35/suppl_1/D721.long, 5 Network of Cancer Gene; http://ncg.kcl.ac.uk/index.php, 1Therapeutic Vulnerabilities in Cancer; http://cbio.mskcc.org/cancergenomics/statius/ |
| KEGG_PURINE_METABOLISM REACTOME_METABOLISM_OF_CARBOHYDRATES | |
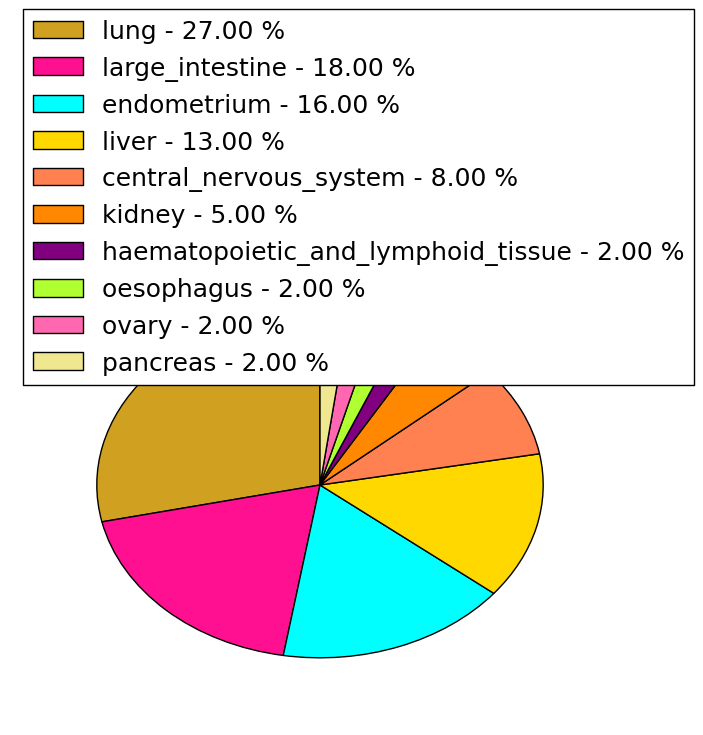
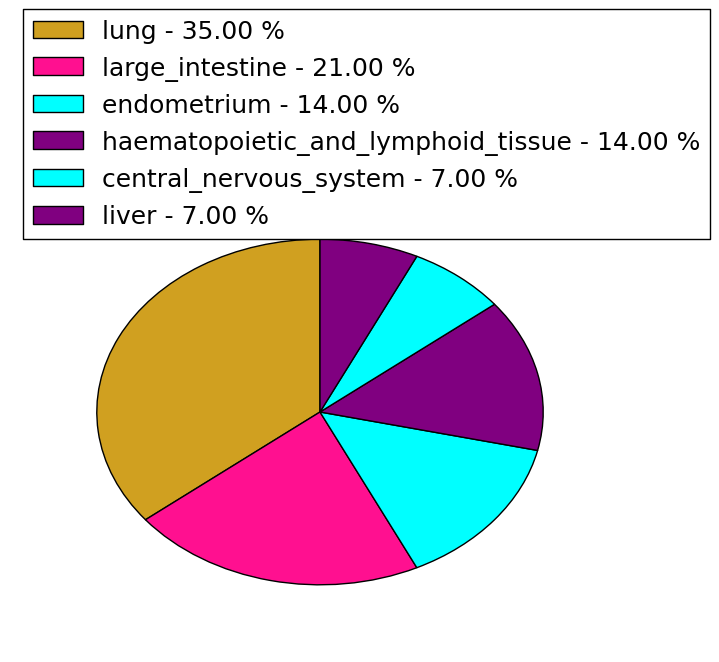
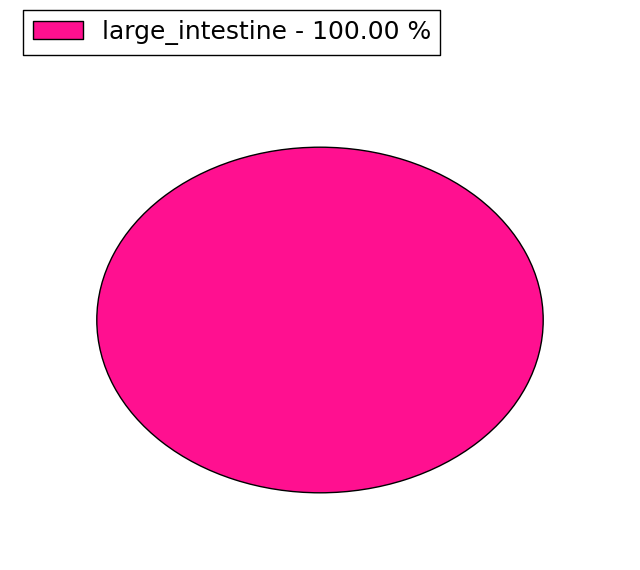
| Mutations for PRPS1L1 |
| * Under tables are showing count per each tissue to give us broad intuition about tissue specific mutation patterns.You can go to the detailed page for each mutation database's web site. |
| There's no structural variation information in COSMIC data for this gene. |
| * From mRNA Sanger sequences, Chitars2.0 arranged chimeric transcripts. This table shows PRPS1L1 related fusion information. |
| ID | Head Gene | Tail Gene | Accession | Gene_a | qStart_a | qEnd_a | Chromosome_a | tStart_a | tEnd_a | Gene_a | qStart_a | qEnd_a | Chromosome_a | tStart_a | tEnd_a |
| Top |
| There's no copy number variation information in COSMIC data for this gene. |
| Top |
|
 |
| Top |
| Stat. for Non-Synonymous SNVs (# total SNVs=37) | (# total SNVs=14) |
 |  |
(# total SNVs=1) | (# total SNVs=0) |
 |
| Top |
| * When you move the cursor on each content, you can see more deailed mutation information on the Tooltip. Those are primary_site,primary_histology,mutation(aa),pubmedID. |
| GRCh37 position | Mutation(aa) | Unique sampleID count |
| chr7:18067082-18067082 | p.S108S | 3 |
| chr7:18067214-18067214 | p.N64N | 3 |
| chr7:18066621-18066621 | p.N262T | 2 |
| chr7:18067044-18067044 | p.A121V | 2 |
| chr7:18066766-18066766 | p.R214C | 2 |
| chr7:18066528-18066528 | p.S293F | 2 |
| chr7:18067222-18067222 | p.E62K | 2 |
| chr7:18067383-18067383 | p.S8N | 2 |
| chr7:18067234-18067234 | p.S58G | 2 |
| chr7:18066519-18066519 | p.L296H | 2 |
| Top |
|
 |
| Point Mutation/ Tissue ID | 1 | 2 | 3 | 4 | 5 | 6 | 7 | 8 | 9 | 10 | 11 | 12 | 13 | 14 | 15 | 16 | 17 | 18 | 19 | 20 |
| # sample | 5 | 3 | 4 | 2 | 5 | 4 | 2 | 1 | 19 | 4 | 5 | |||||||||
| # mutation | 5 | 3 | 4 | 2 | 5 | 4 | 2 | 1 | 21 | 4 | 7 | |||||||||
| nonsynonymous SNV | 3 | 2 | 4 | 2 | 4 | 3 | 2 | 1 | 13 | 3 | 5 | |||||||||
| synonymous SNV | 2 | 1 | 1 | 1 | 8 | 1 | 2 |
| cf) Tissue ID; Tissue type (1; BLCA[Bladder Urothelial Carcinoma], 2; BRCA[Breast invasive carcinoma], 3; CESC[Cervical squamous cell carcinoma and endocervical adenocarcinoma], 4; COAD[Colon adenocarcinoma], 5; GBM[Glioblastoma multiforme], 6; Glioma Low Grade, 7; HNSC[Head and Neck squamous cell carcinoma], 8; KICH[Kidney Chromophobe], 9; KIRC[Kidney renal clear cell carcinoma], 10; KIRP[Kidney renal papillary cell carcinoma], 11; LAML[Acute Myeloid Leukemia], 12; LUAD[Lung adenocarcinoma], 13; LUSC[Lung squamous cell carcinoma], 14; OV[Ovarian serous cystadenocarcinoma ], 15; PAAD[Pancreatic adenocarcinoma], 16; PRAD[Prostate adenocarcinoma], 17; SKCM[Skin Cutaneous Melanoma], 18:STAD[Stomach adenocarcinoma], 19:THCA[Thyroid carcinoma], 20:UCEC[Uterine Corpus Endometrial Carcinoma]) |
| Top |
| * We represented just top 10 SNVs. When you move the cursor on each content, you can see more deailed mutation information on the Tooltip. Those are primary_site, primary_histology, mutation(aa), pubmedID. |
| Genomic Position | Mutation(aa) | Unique sampleID count |
| chr7:18066766 | p.N64N | 2 |
| chr7:18067261 | p.E62K | 2 |
| chr7:18067044 | p.A121V | 2 |
| chr7:18067214 | p.R214C | 2 |
| chr7:18067222 | p.R49S | 2 |
| chr7:18066759 | p.C265R | 1 |
| chr7:18067234 | p.I159I | 1 |
| chr7:18066979 | p.M73I | 1 |
| chr7:18066558 | p.R260S | 1 |
| chr7:18067130 | p.E157D | 1 |
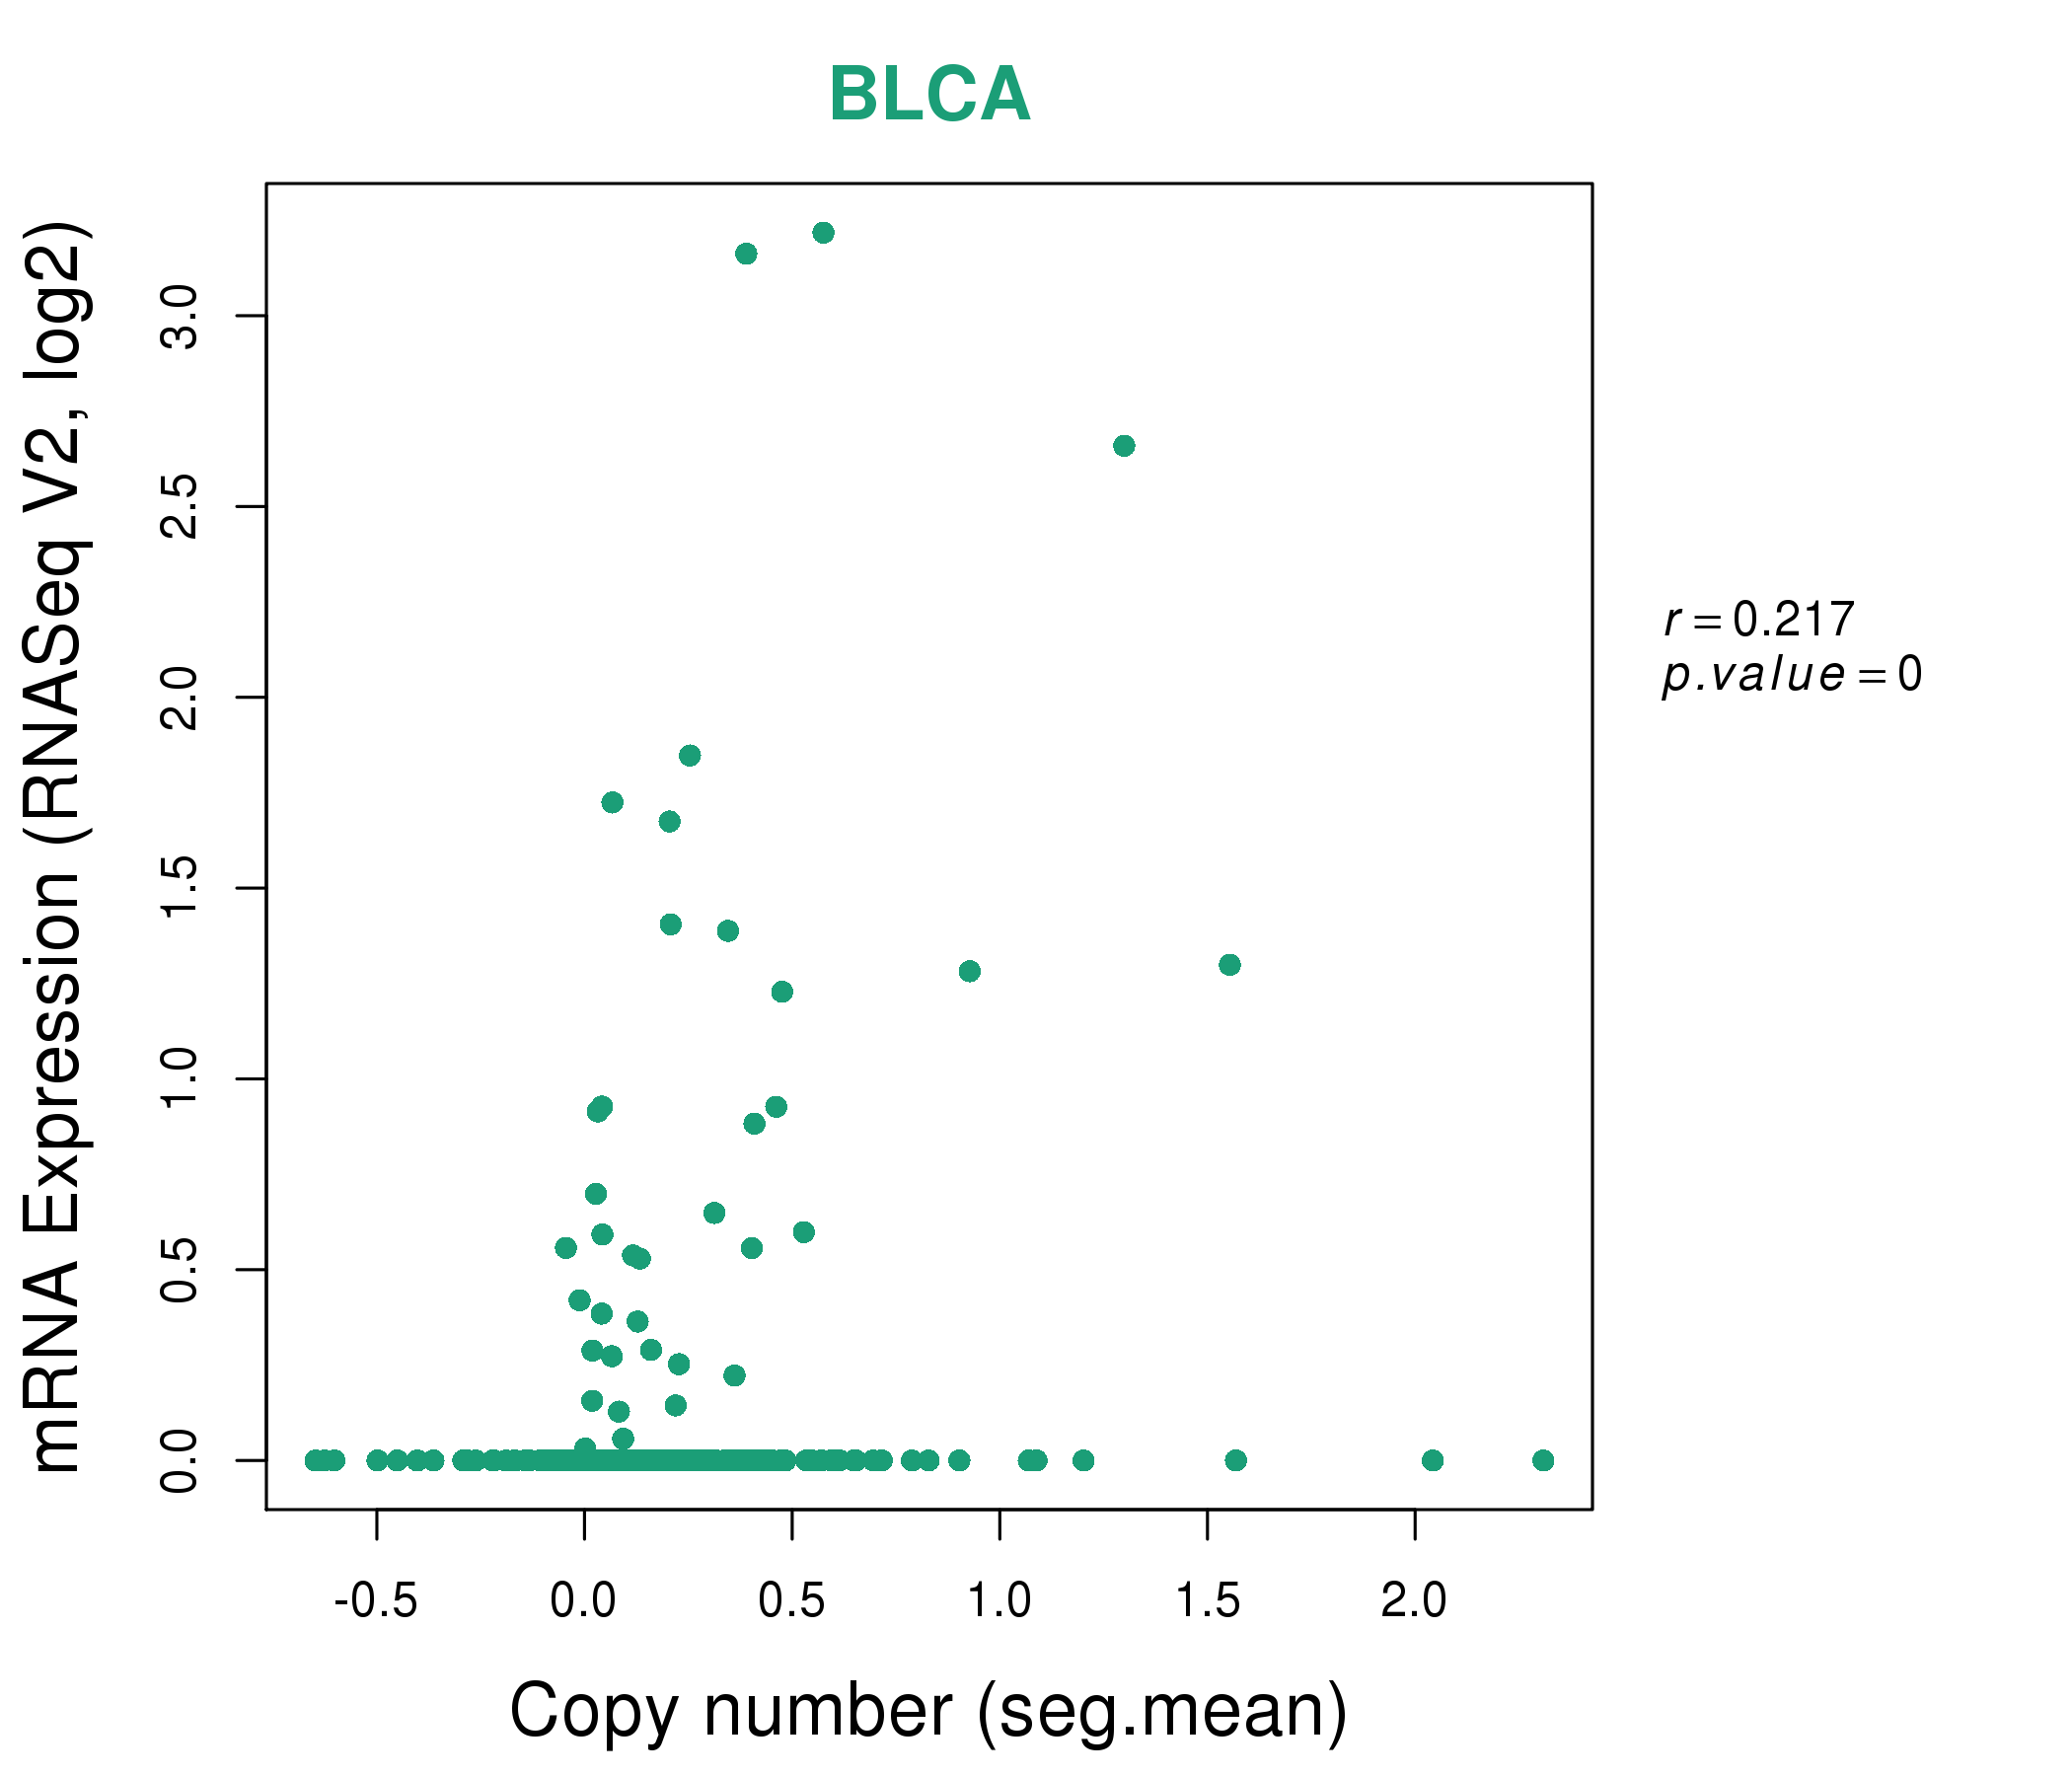
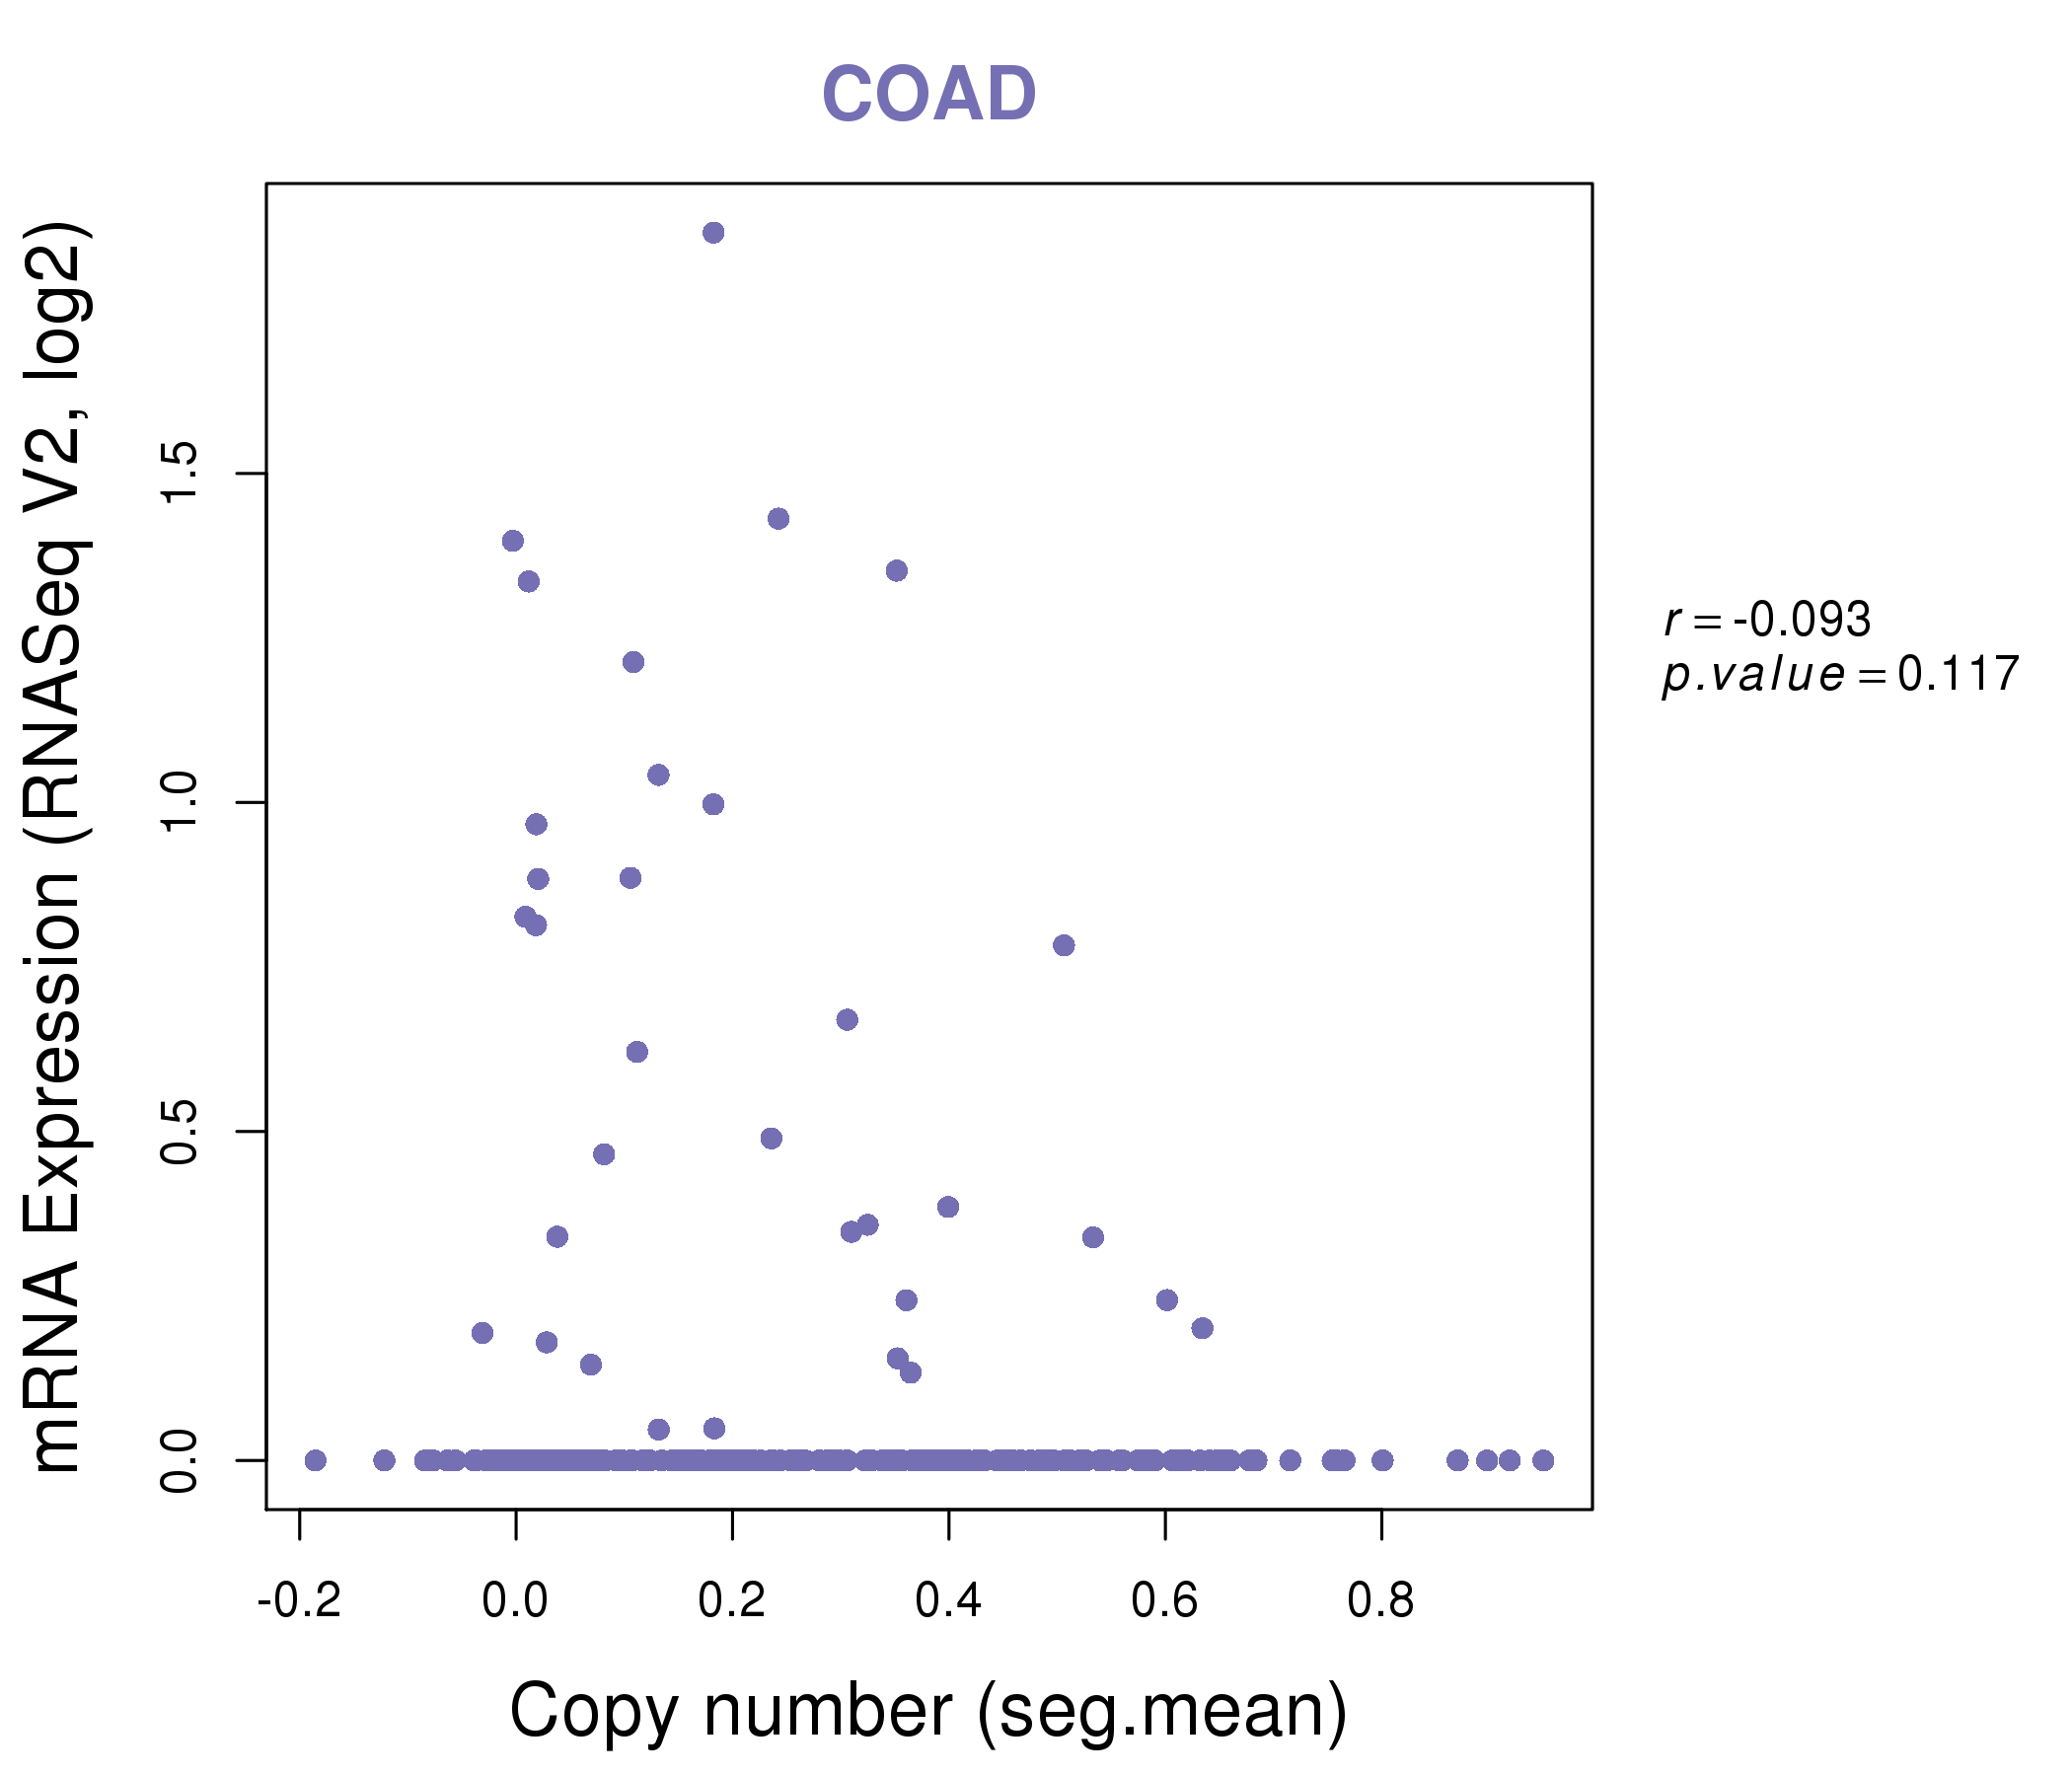
| * Copy number data were extracted from TCGA using R package TCGA-Assembler. The URLs of all public data files on TCGA DCC data server were gathered on Jan-05-2015. Function ProcessCNAData in TCGA-Assembler package was used to obtain gene-level copy number value which is calculated as the average copy number of the genomic region of a gene. |
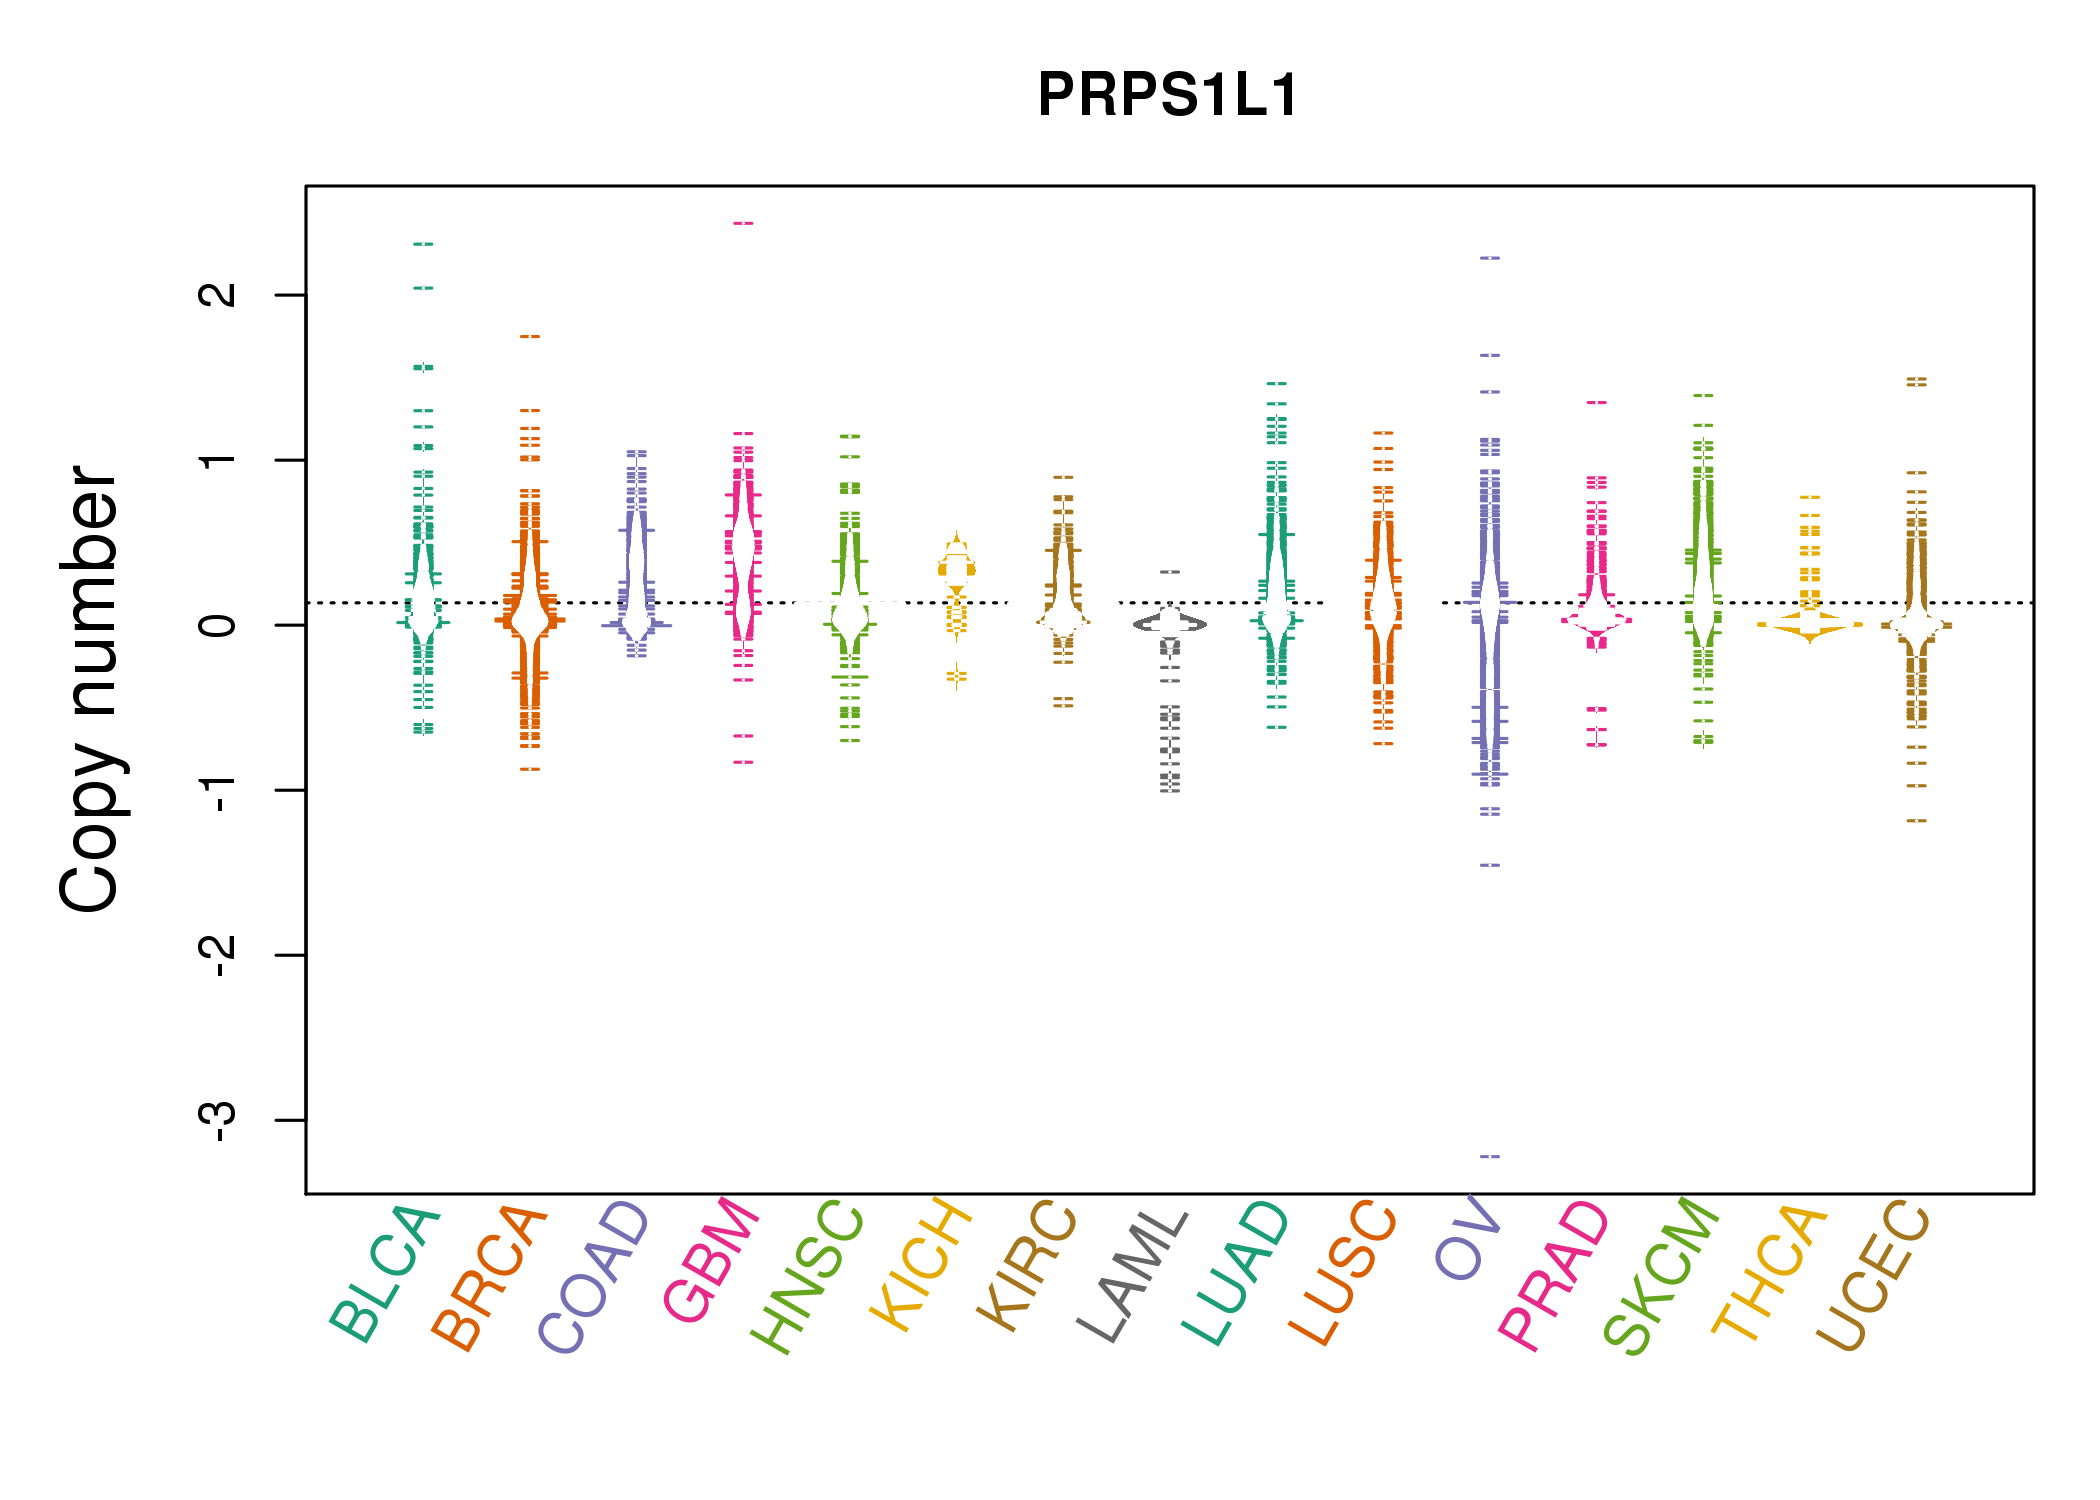 |
| cf) Tissue ID[Tissue type]: BLCA[Bladder Urothelial Carcinoma], BRCA[Breast invasive carcinoma], CESC[Cervical squamous cell carcinoma and endocervical adenocarcinoma], COAD[Colon adenocarcinoma], GBM[Glioblastoma multiforme], Glioma Low Grade, HNSC[Head and Neck squamous cell carcinoma], KICH[Kidney Chromophobe], KIRC[Kidney renal clear cell carcinoma], KIRP[Kidney renal papillary cell carcinoma], LAML[Acute Myeloid Leukemia], LUAD[Lung adenocarcinoma], LUSC[Lung squamous cell carcinoma], OV[Ovarian serous cystadenocarcinoma ], PAAD[Pancreatic adenocarcinoma], PRAD[Prostate adenocarcinoma], SKCM[Skin Cutaneous Melanoma], STAD[Stomach adenocarcinoma], THCA[Thyroid carcinoma], UCEC[Uterine Corpus Endometrial Carcinoma] |
| Top |
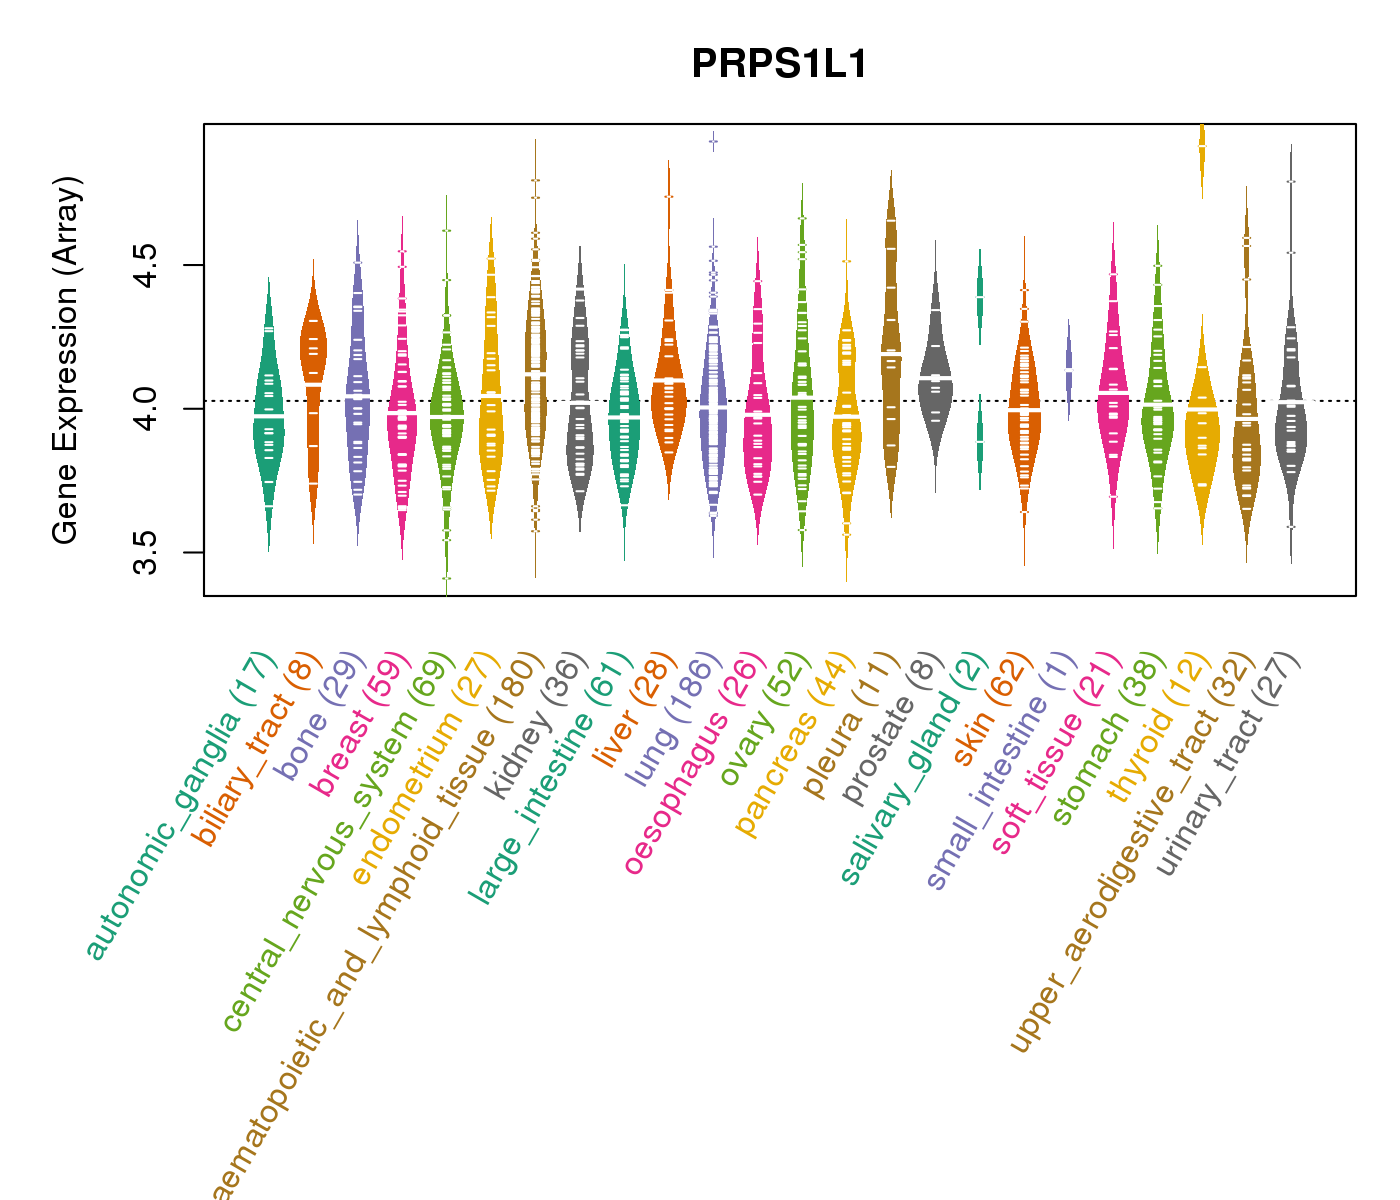
| Gene Expression for PRPS1L1 |
| * CCLE gene expression data were extracted from CCLE_Expression_Entrez_2012-10-18.res: Gene-centric RMA-normalized mRNA expression data. |
 |
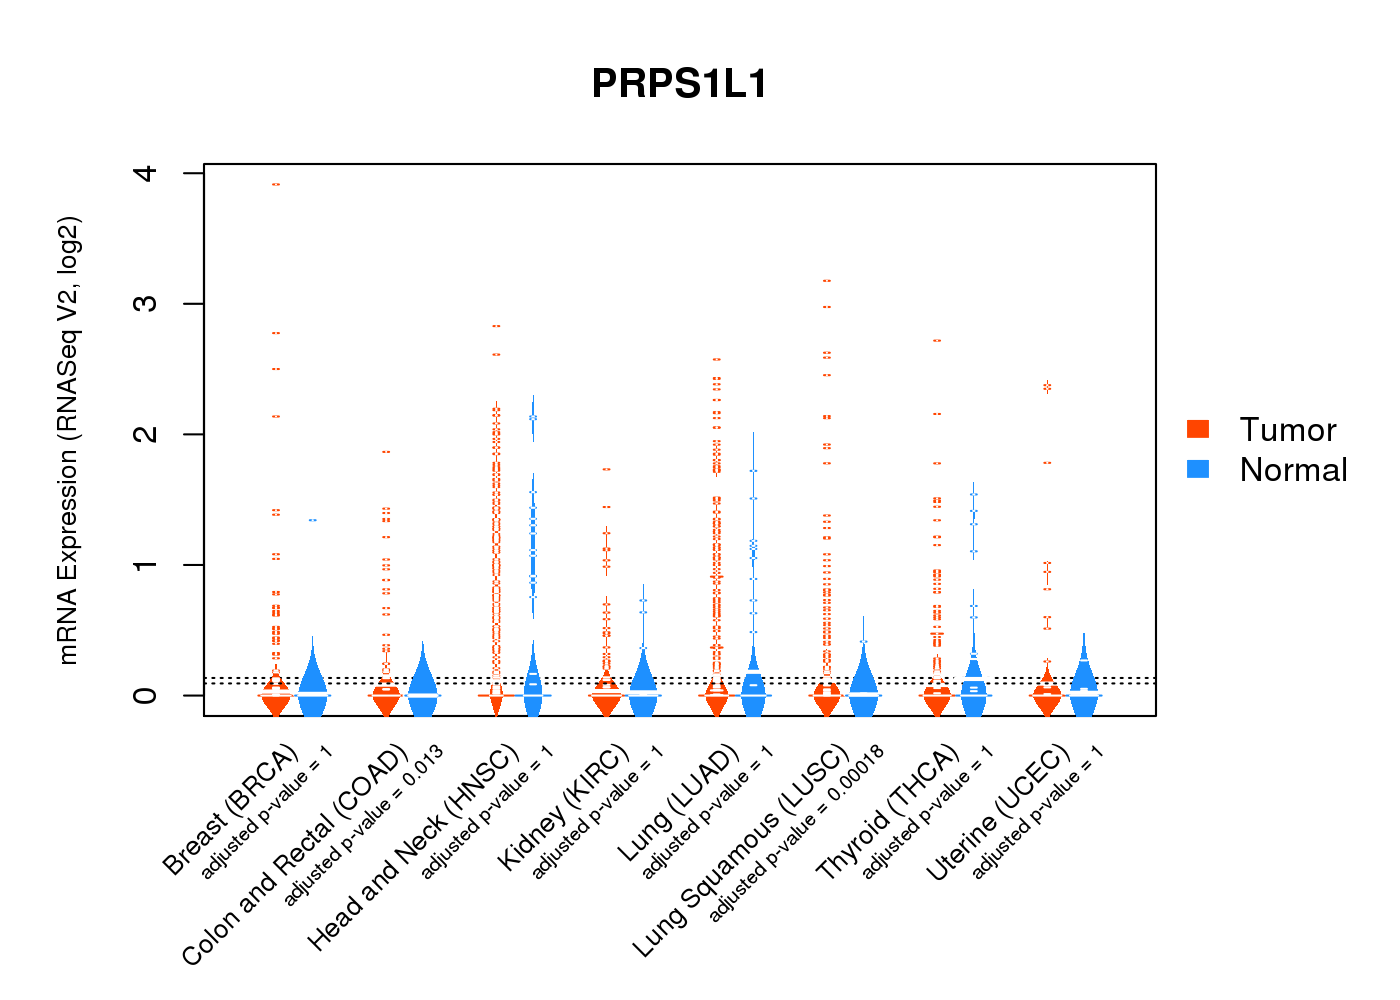
| * Normalized gene expression data of RNASeqV2 was extracted from TCGA using R package TCGA-Assembler. The URLs of all public data files on TCGA DCC data server were gathered at Jan-05-2015. Only eight cancer types have enough normal control samples for differential expression analysis. (t test, adjusted p<0.05 (using Benjamini-Hochberg FDR)) |
 |
| Top |
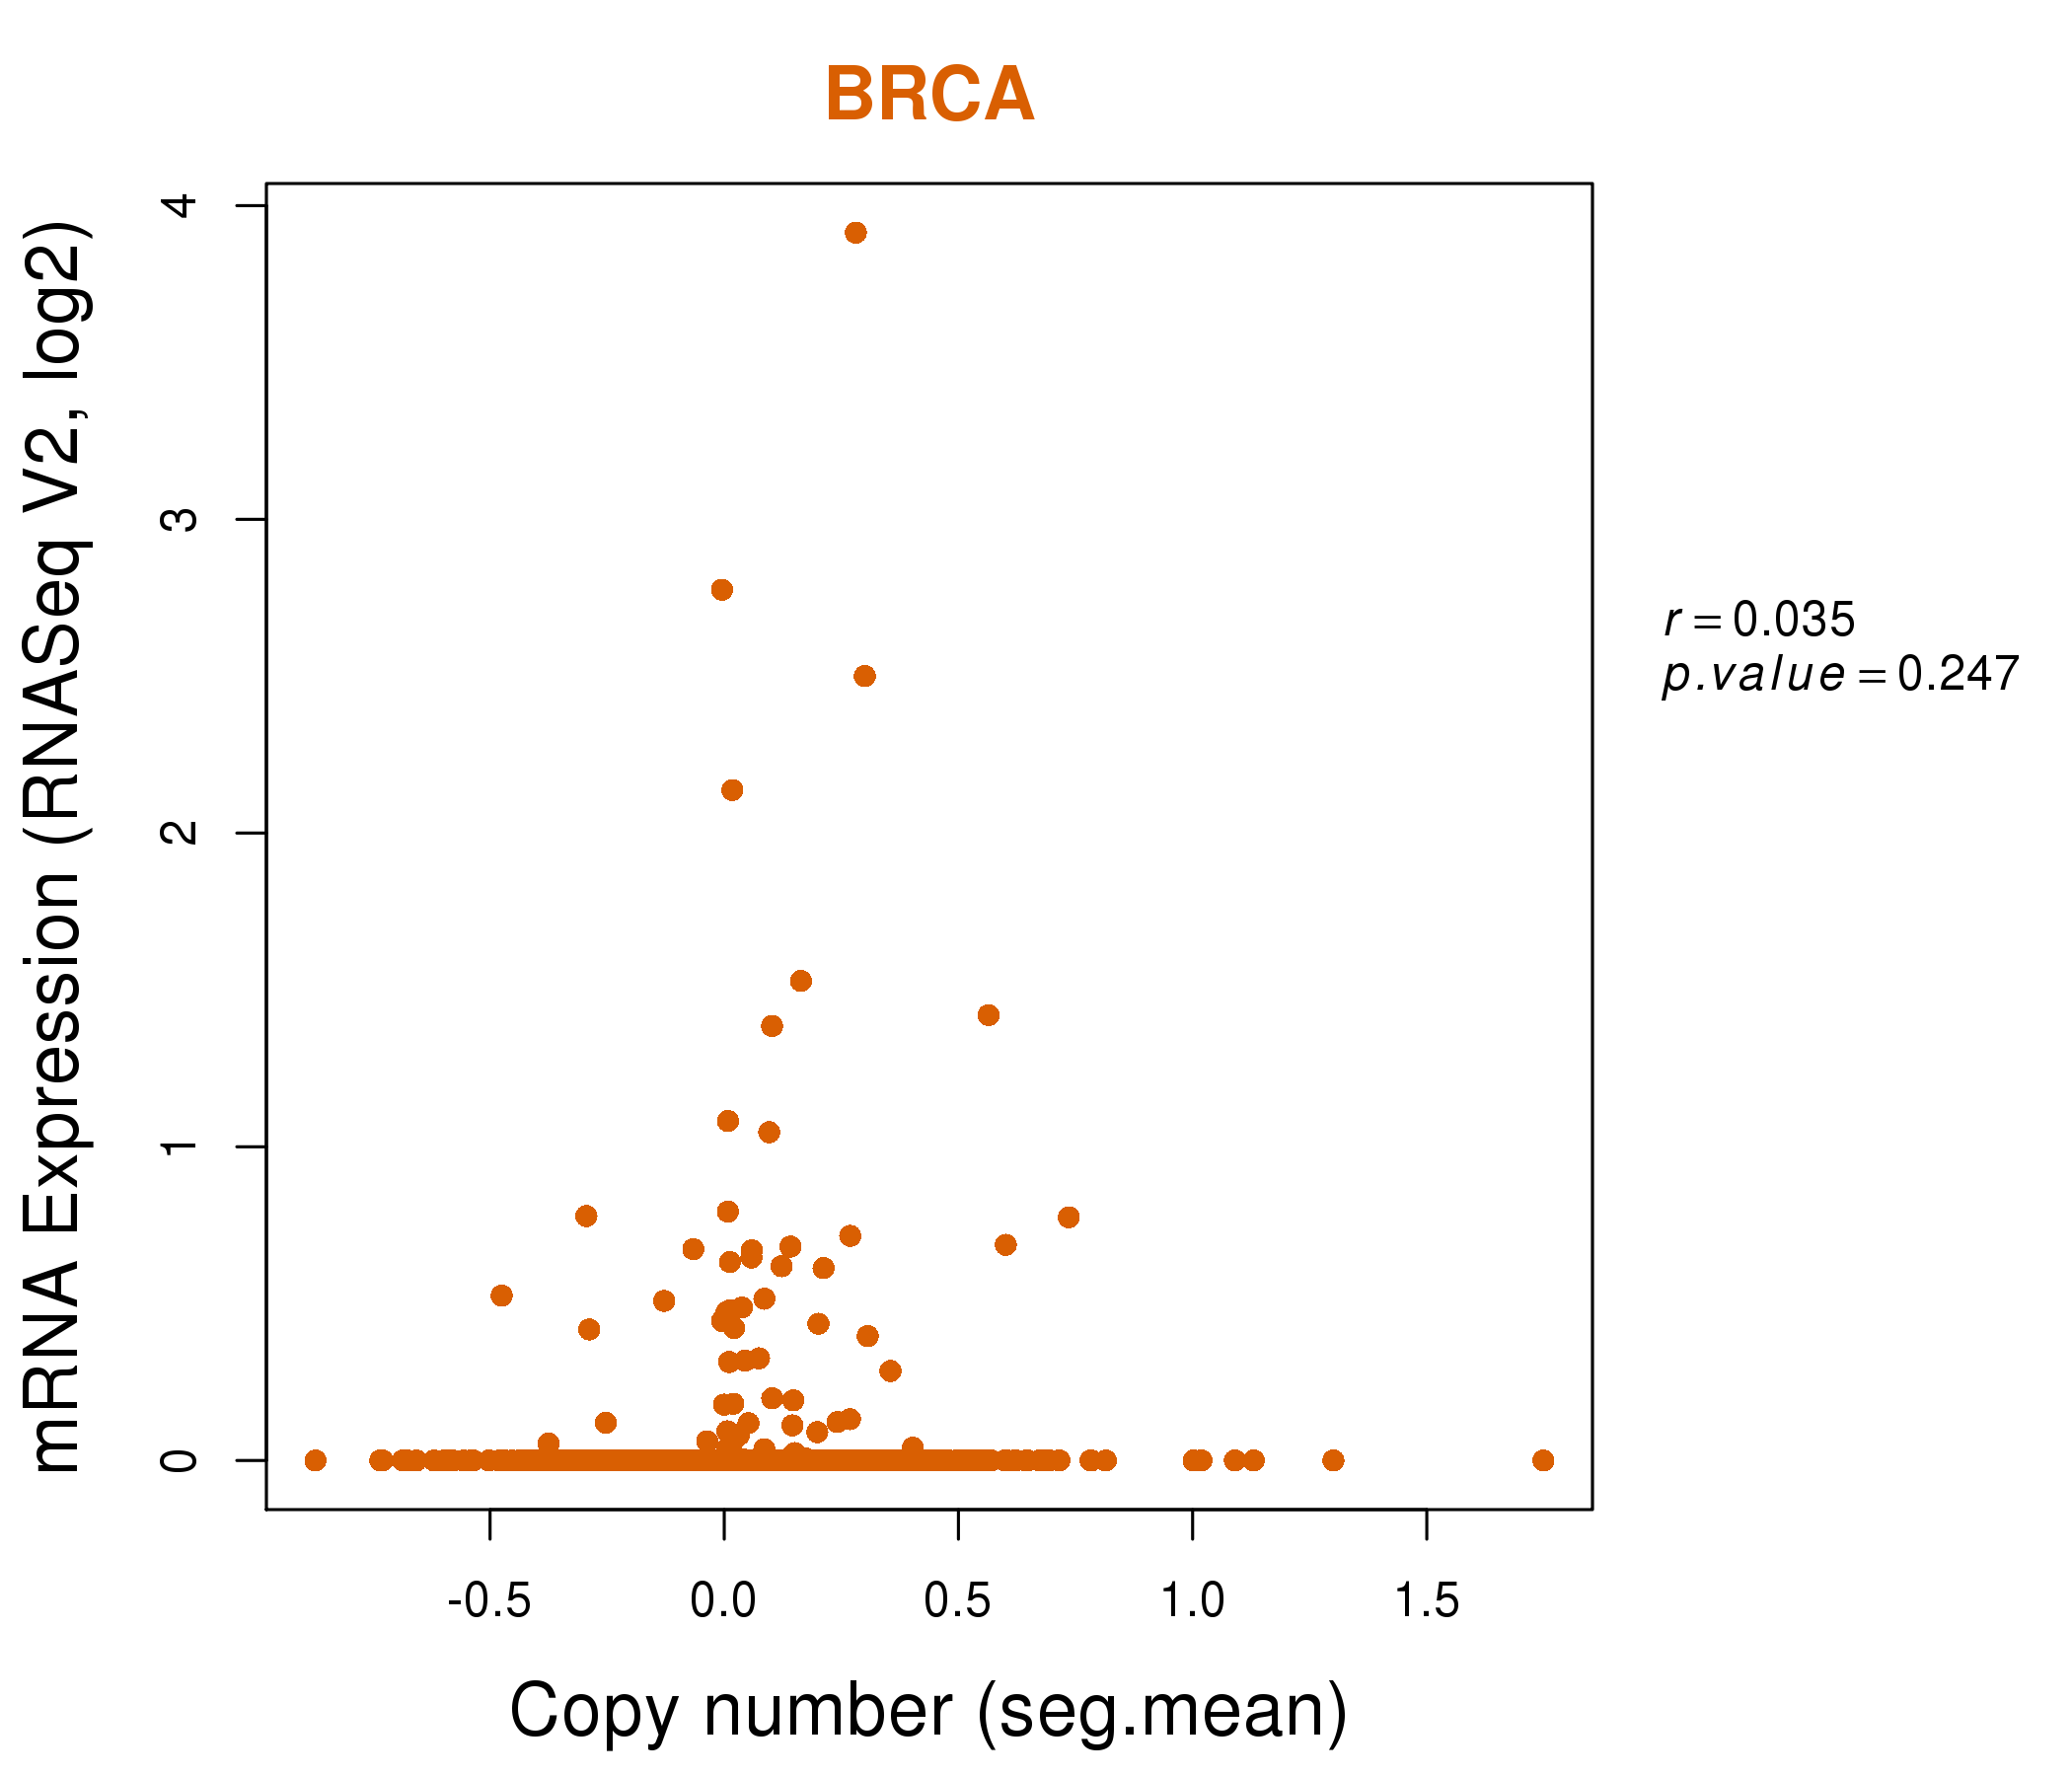
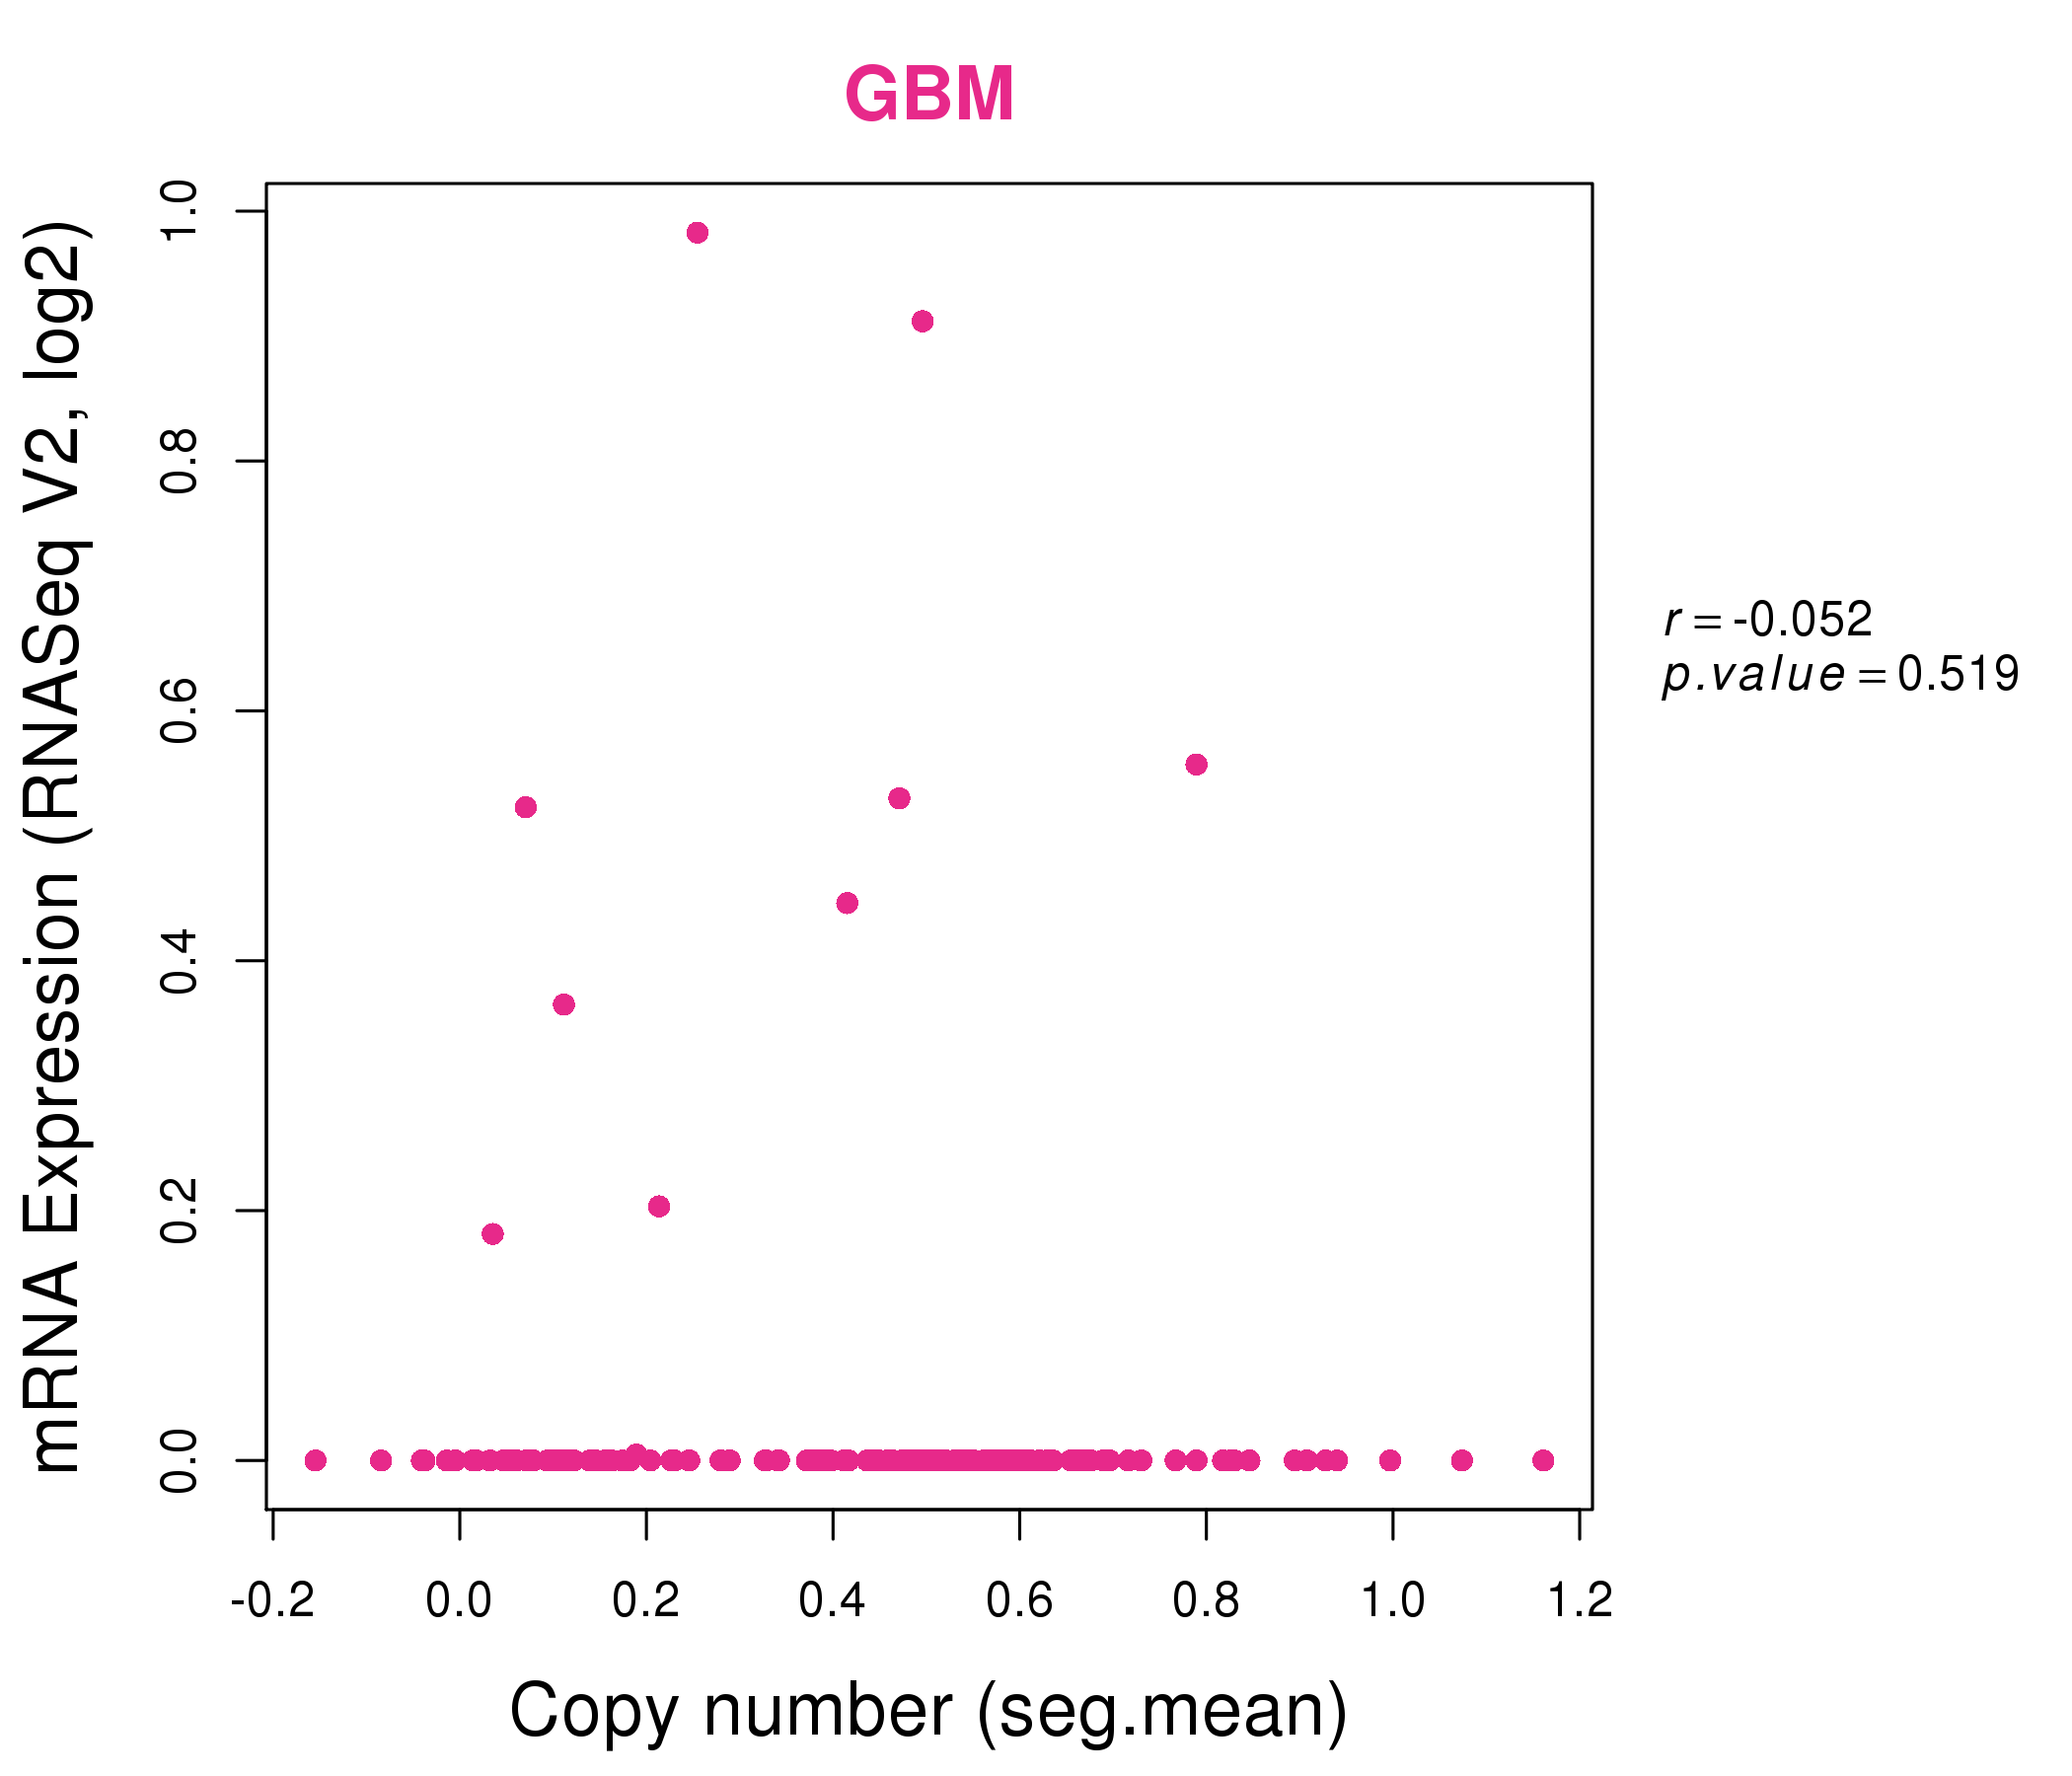
| * This plots show the correlation between CNV and gene expression. |
: Open all plots for all cancer types
 |
|
 |
|
| Top |
| Gene-Gene Network Information |
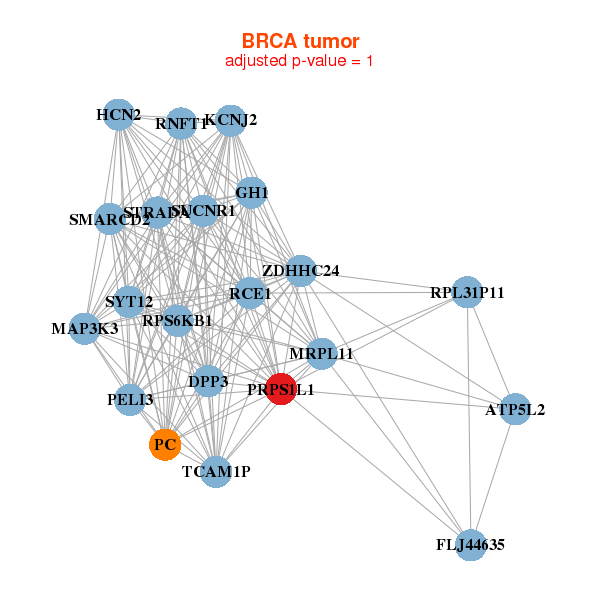
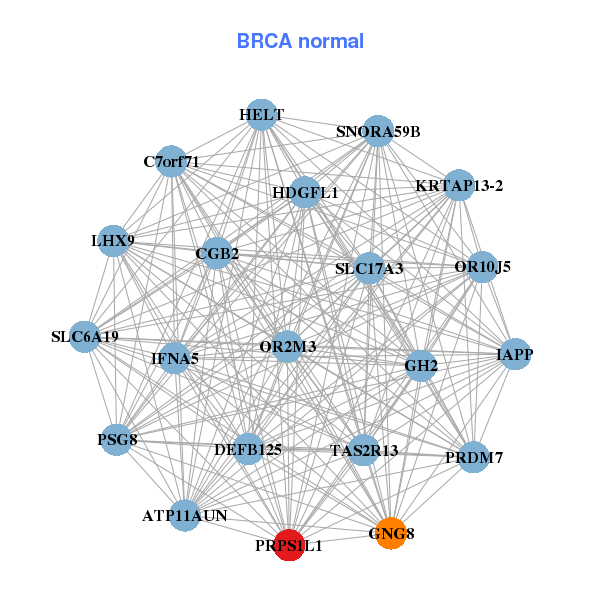
| * Co-Expression network figures were drawn using R package igraph. Only the top 20 genes with the highest correlations were shown. Red circle: input gene, orange circle: cell metabolism gene, sky circle: other gene |
: Open all plots for all cancer types
 |
|
| ATP5L2,DPP3,FLJ44635,GH1,HCN2,KCNJ2,MAP3K3, MRPL11,PC,PELI3,PRPS1L1,RCE1,RNFT1,RPL31P11, RPS6KB1,SMARCD2,STRADA,SUCNR1,SYT12,TCAM1P,ZDHHC24 | ATP11AUN,C7orf71,CGB2,DEFB125,GH2,GNG8,HDGFL1, HELT,IAPP,IFNA5,KRTAP13-2,LHX9,OR10J5,OR2M3, PRDM7,PRPS1L1,PSG8,SLC17A3,SLC6A19,SNORA59B,TAS2R13 |
 |
|
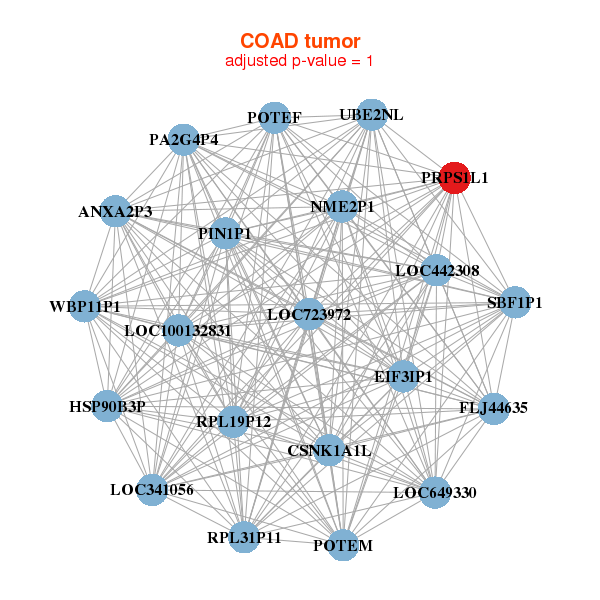
| ANXA2P3,CSNK1A1L,EIF3IP1,FLJ44635,HSP90B3P,LOC100132831,LOC341056, LOC442308,LOC649330,LOC723972,NME2P1,POTEM,PA2G4P4,PIN1P1, POTEF,PRPS1L1,RPL19P12,RPL31P11,SBF1P1,UBE2NL,WBP11P1 | ACSL3,ACTL8,ATP12A,BACE2,TDRP,CLINT1,GAPDHS, IL19,KIR2DL1,LPCAT2,NEK6,PLA2G2A,POTEC,PRPS1L1, PRSS22,RAB27B,SLC10A7,SLC16A14,SLC38A5,TMEM173,ZNF486 |
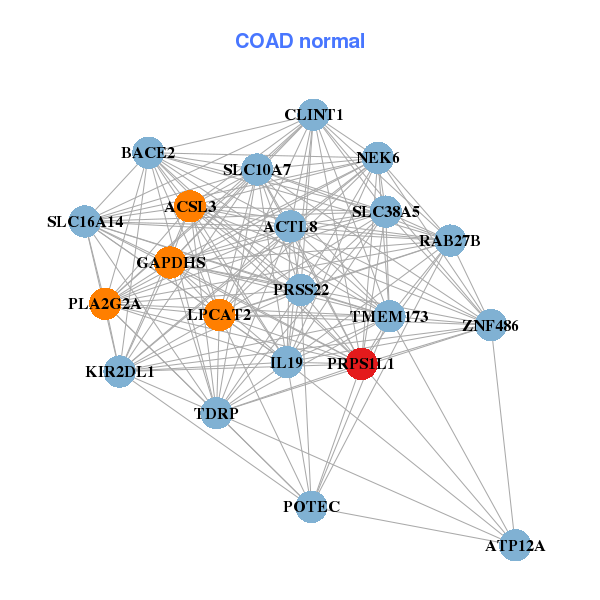
| * Co-Expression network figures were drawn using R package igraph. Only the top 20 genes with the highest correlations were shown. Red circle: input gene, orange circle: cell metabolism gene, sky circle: other gene |
: Open all plots for all cancer types
| Top |
: Open all interacting genes' information including KEGG pathway for all interacting genes from DAVID
| Top |
| Pharmacological Information for PRPS1L1 |
| There's no related Drug. |
| Top |
| Cross referenced IDs for PRPS1L1 |
| * We obtained these cross-references from Uniprot database. It covers 150 different DBs, 18 categories. http://www.uniprot.org/help/cross_references_section |
: Open all cross reference information
|
Copyright © 2016-Present - The Univsersity of Texas Health Science Center at Houston @ |