|
||||||||||||||||||||
| |
| Phenotypic Information (metabolism pathway, cancer, disease, phenome) |
| |
| |
| Gene-Gene Network Information: Co-Expression Network, Interacting Genes & KEGG |
| |
|


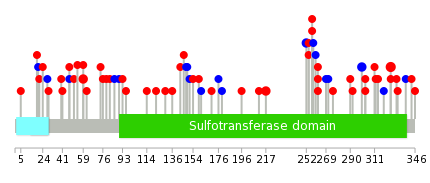
| Gene Summary for HS3ST5 |
| Basic gene info. | Gene symbol | HS3ST5 |
| Gene name | heparan sulfate (glucosamine) 3-O-sulfotransferase 5 | |
| Synonyms | 3-OST-5|3OST5|HS3OST5|NBLA04021 | |
| Cytomap | UCSC genome browser: 6q21 | |
| Genomic location | chr6 :114376749-114384041 | |
| Type of gene | protein-coding | |
| RefGenes | NM_153612.3, | |
| Ensembl id | ENSG00000249853 | |
| Description | h3-OST-5heparan sulfate 3-O-sulfotransferase 5heparan sulfate 3-OST-5heparan sulfate D-glucosaminyl 3-O-sulfotransferase 5heparan sulfate glucosamine 3-O-sulfotransferase 5 | |
| Modification date | 20141207 | |
| dbXrefs | MIM : 609407 | |
| HGNC : HGNC | ||
| Ensembl : ENSG00000249853 | ||
| HPRD : 13674 | ||
| Protein | UniProt: go to UniProt's Cross Reference DB Table | |
| Expression | CleanEX: HS_HS3ST5 | |
| BioGPS: 222537 | ||
| Gene Expression Atlas: ENSG00000249853 | ||
| The Human Protein Atlas: ENSG00000249853 | ||
| Pathway | NCI Pathway Interaction Database: HS3ST5 | |
| KEGG: HS3ST5 | ||
| REACTOME: HS3ST5 | ||
| ConsensusPathDB | ||
| Pathway Commons: HS3ST5 | ||
| Metabolism | MetaCyc: HS3ST5 | |
| HUMANCyc: HS3ST5 | ||
| Regulation | Ensembl's Regulation: ENSG00000249853 | |
| miRBase: chr6 :114,376,749-114,384,041 | ||
| TargetScan: NM_153612 | ||
| cisRED: ENSG00000249853 | ||
| Context | iHOP: HS3ST5 | |
| cancer metabolism search in PubMed: HS3ST5 | ||
| UCL Cancer Institute: HS3ST5 | ||
| Assigned class in ccmGDB | C | |
| Top |
| Phenotypic Information for HS3ST5(metabolism pathway, cancer, disease, phenome) |
| Cancer | CGAP: HS3ST5 |
| Familial Cancer Database: HS3ST5 | |
| * This gene is included in those cancer gene databases. |
|
|
|
|
|
|
| ||||||||||||||
Oncogene 1 | Significant driver gene in | |||||||||||||||||||
| cf) number; DB name 1 Oncogene; http://nar.oxfordjournals.org/content/35/suppl_1/D721.long, 2 Tumor Suppressor gene; https://bioinfo.uth.edu/TSGene/, 3 Cancer Gene Census; http://www.nature.com/nrc/journal/v4/n3/abs/nrc1299.html, 4 CancerGenes; http://nar.oxfordjournals.org/content/35/suppl_1/D721.long, 5 Network of Cancer Gene; http://ncg.kcl.ac.uk/index.php, 1Therapeutic Vulnerabilities in Cancer; http://cbio.mskcc.org/cancergenomics/statius/ |
| REACTOME_METABOLISM_OF_CARBOHYDRATES | |
| OMIM | |
| Orphanet | |
| Disease | KEGG Disease: HS3ST5 |
| MedGen: HS3ST5 (Human Medical Genetics with Condition) | |
| ClinVar: HS3ST5 | |
| Phenotype | MGI: HS3ST5 (International Mouse Phenotyping Consortium) |
| PhenomicDB: HS3ST5 | |
| Mutations for HS3ST5 |
| * Under tables are showing count per each tissue to give us broad intuition about tissue specific mutation patterns.You can go to the detailed page for each mutation database's web site. |
| There's no structural variation information in COSMIC data for this gene. |
| * From mRNA Sanger sequences, Chitars2.0 arranged chimeric transcripts. This table shows HS3ST5 related fusion information. |
| ID | Head Gene | Tail Gene | Accession | Gene_a | qStart_a | qEnd_a | Chromosome_a | tStart_a | tEnd_a | Gene_a | qStart_a | qEnd_a | Chromosome_a | tStart_a | tEnd_a |
| Top |
| There's no copy number variation information in COSMIC data for this gene. |
| Top |
|
 |
| Top |
| Stat. for Non-Synonymous SNVs (# total SNVs=59) | (# total SNVs=20) |
 |  |
(# total SNVs=1) | (# total SNVs=0) |
 |
| Top |
| * When you move the cursor on each content, you can see more deailed mutation information on the Tooltip. Those are primary_site,primary_histology,mutation(aa),pubmedID. |
| GRCh37 position | Mutation(aa) | Unique sampleID count |
| chr6:114378562-114378562 | p.I300I | 3 |
| chr6:114378489-114378489 | p.R325C | 3 |
| chr6:114379286-114379286 | p.R59H | 3 |
| chr6:114379287-114379287 | p.R59C | 2 |
| chr6:114378554-114378554 | p.K303R | 2 |
| chr6:114379290-114379290 | p.L58I | 2 |
| chr6:114379098-114379098 | p.E122K | 2 |
| chr6:114378693-114378693 | p.R257C | 2 |
| chr6:114378706-114378706 | p.V252V | 2 |
| chr6:114379025-114379025 | p.S146F | 2 |
| Top |
|
 |
| Point Mutation/ Tissue ID | 1 | 2 | 3 | 4 | 5 | 6 | 7 | 8 | 9 | 10 | 11 | 12 | 13 | 14 | 15 | 16 | 17 | 18 | 19 | 20 |
| # sample | 1 | 5 | 8 | 5 | 1 | 19 | 6 | 1 | 11 | 5 | 1 | 8 | ||||||||
| # mutation | 1 | 5 | 10 | 6 | 1 | 19 | 6 | 1 | 11 | 6 | 1 | 9 | ||||||||
| nonsynonymous SNV | 1 | 4 | 6 | 5 | 1 | 14 | 5 | 1 | 6 | 5 | 7 | |||||||||
| synonymous SNV | 1 | 4 | 1 | 5 | 1 | 5 | 1 | 1 | 2 |
| cf) Tissue ID; Tissue type (1; BLCA[Bladder Urothelial Carcinoma], 2; BRCA[Breast invasive carcinoma], 3; CESC[Cervical squamous cell carcinoma and endocervical adenocarcinoma], 4; COAD[Colon adenocarcinoma], 5; GBM[Glioblastoma multiforme], 6; Glioma Low Grade, 7; HNSC[Head and Neck squamous cell carcinoma], 8; KICH[Kidney Chromophobe], 9; KIRC[Kidney renal clear cell carcinoma], 10; KIRP[Kidney renal papillary cell carcinoma], 11; LAML[Acute Myeloid Leukemia], 12; LUAD[Lung adenocarcinoma], 13; LUSC[Lung squamous cell carcinoma], 14; OV[Ovarian serous cystadenocarcinoma ], 15; PAAD[Pancreatic adenocarcinoma], 16; PRAD[Prostate adenocarcinoma], 17; SKCM[Skin Cutaneous Melanoma], 18:STAD[Stomach adenocarcinoma], 19:THCA[Thyroid carcinoma], 20:UCEC[Uterine Corpus Endometrial Carcinoma]) |
| Top |
| * We represented just top 10 SNVs. When you move the cursor on each content, you can see more deailed mutation information on the Tooltip. Those are primary_site, primary_histology, mutation(aa), pubmedID. |
| Genomic Position | Mutation(aa) | Unique sampleID count |
| chr6:114378489 | p.R325C | 3 |
| chr6:114378562 | p.P262L | 2 |
| chr6:114378702 | p.R59C | 2 |
| chr6:114378706 | p.D254H | 2 |
| chr6:114378812 | p.V252V | 2 |
| chr6:114378677 | p.P217H | 2 |
| chr6:114378554 | p.K303T | 2 |
| chr6:114379287 | p.I300I | 2 |
| chr6:114379175 | p.E154Q | 1 |
| chr6:114378693 | p.A76T | 1 |
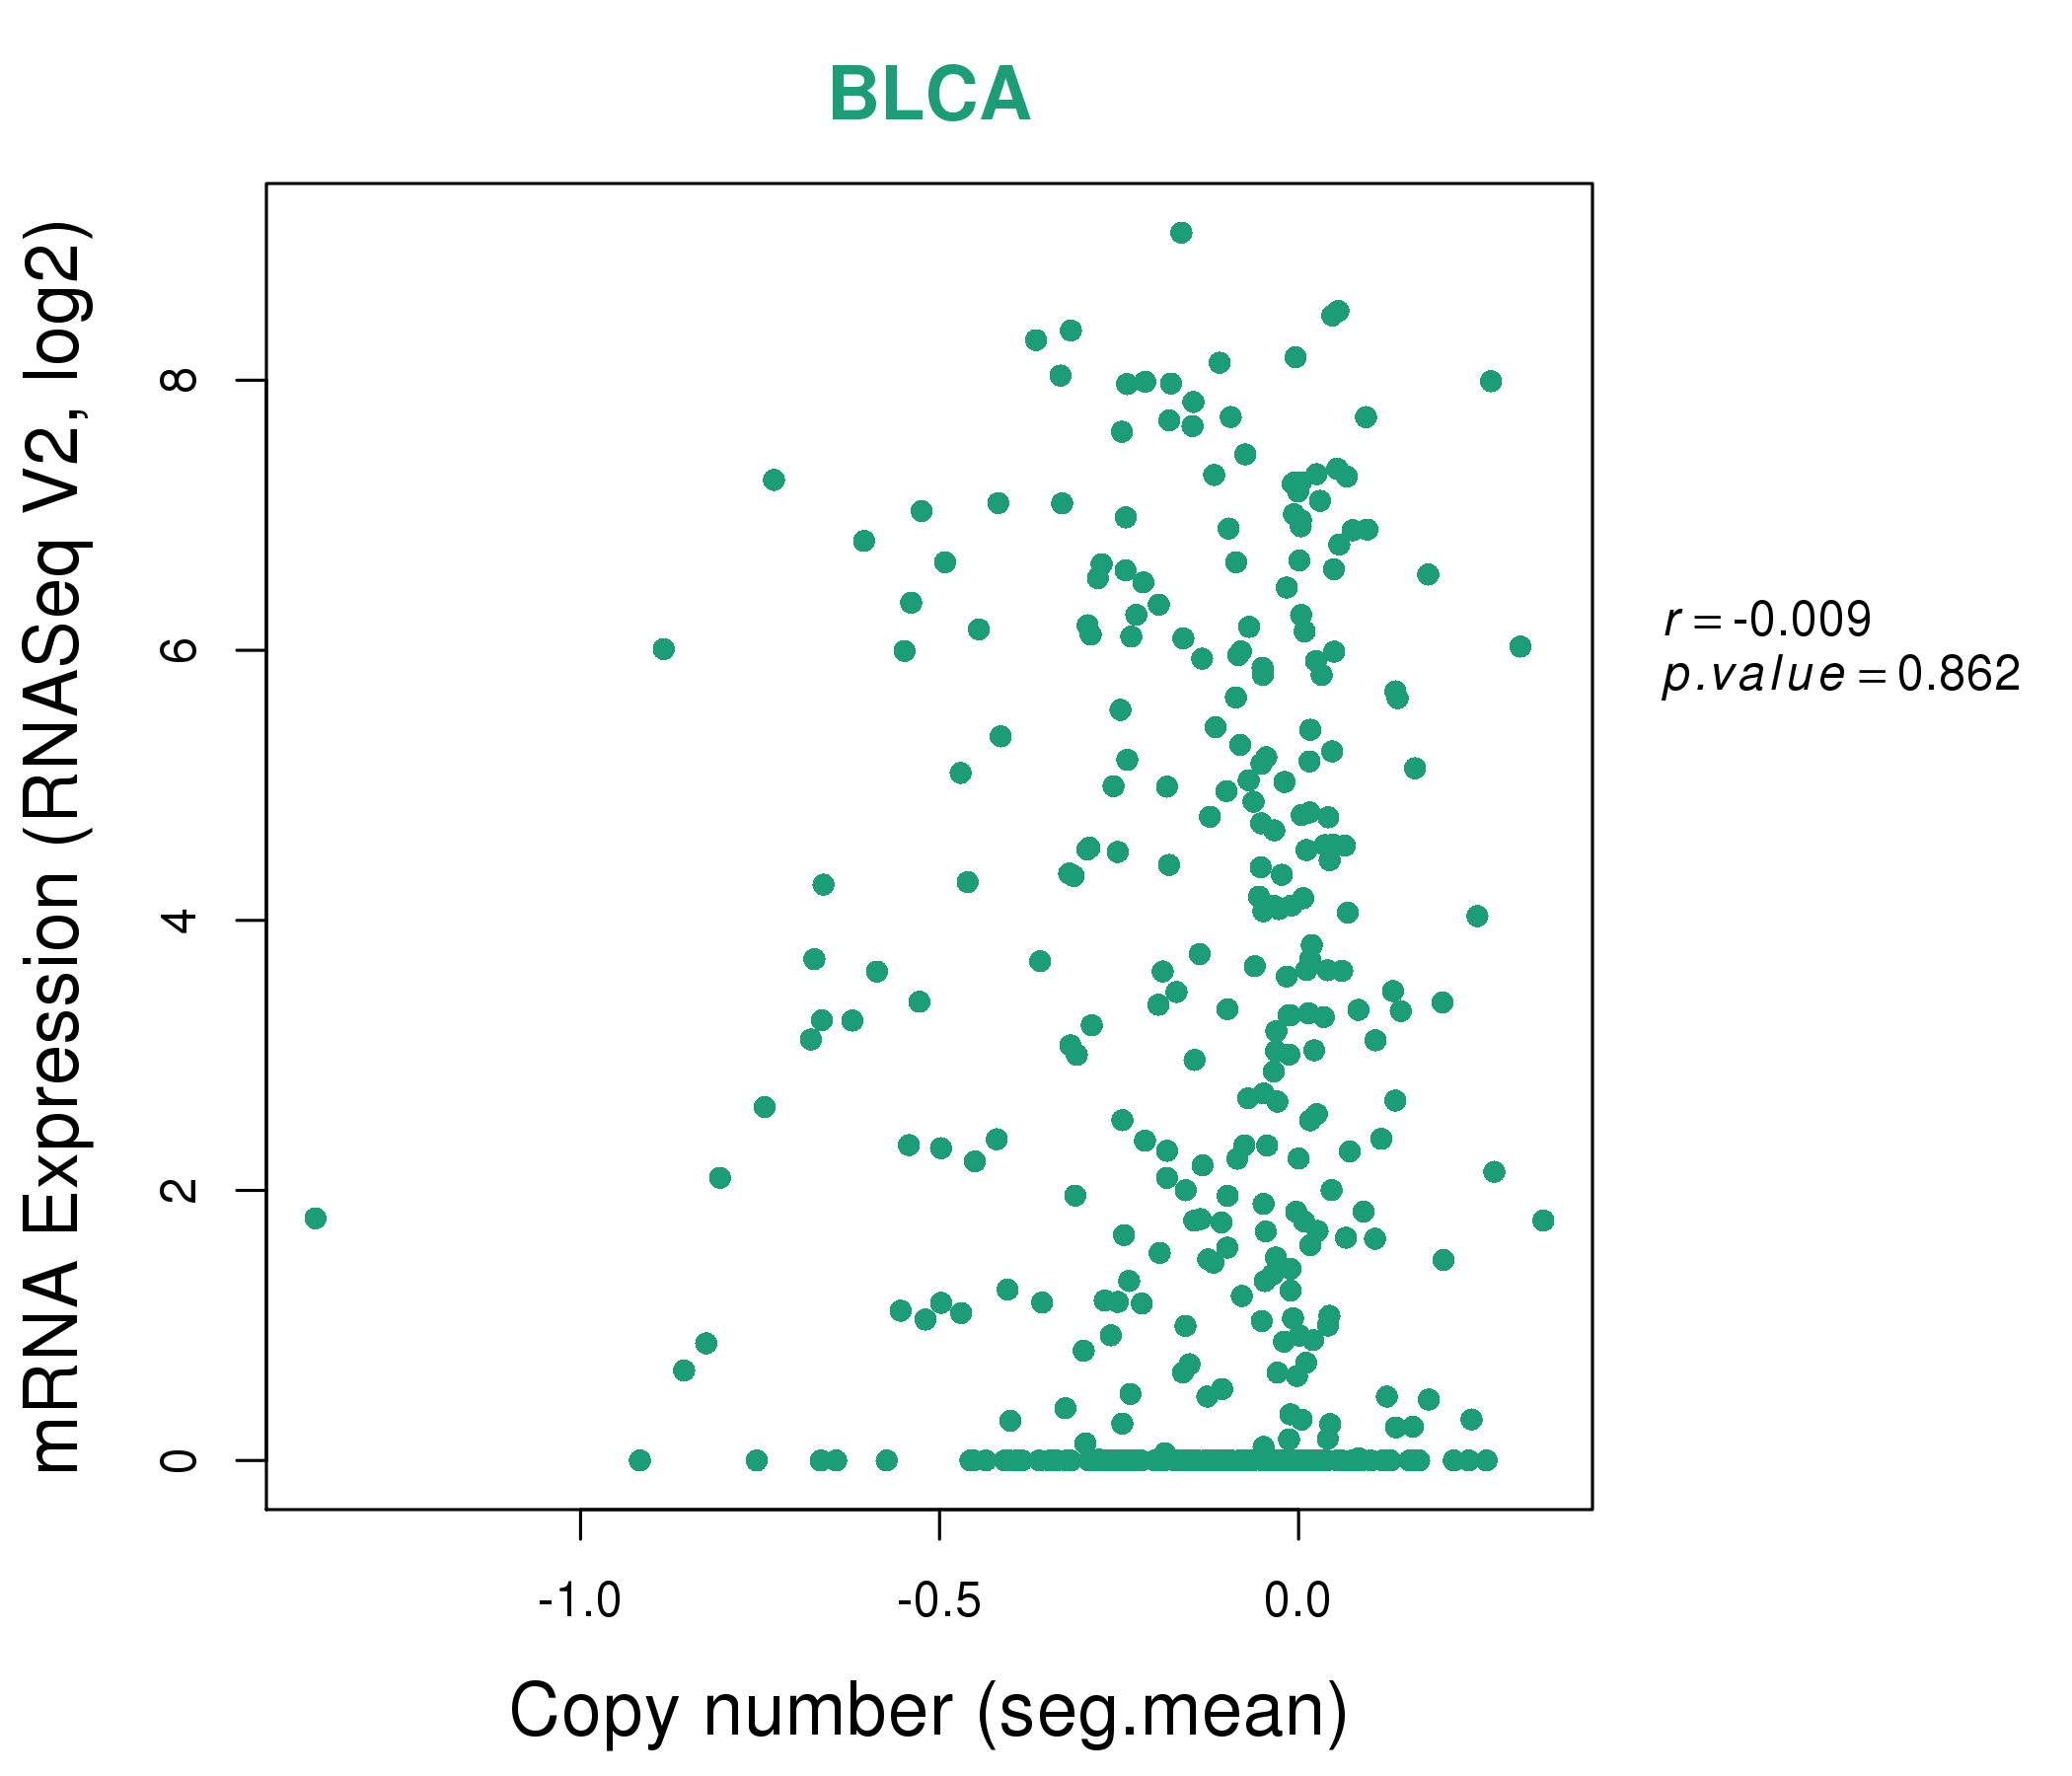
| * Copy number data were extracted from TCGA using R package TCGA-Assembler. The URLs of all public data files on TCGA DCC data server were gathered on Jan-05-2015. Function ProcessCNAData in TCGA-Assembler package was used to obtain gene-level copy number value which is calculated as the average copy number of the genomic region of a gene. |
 |
| cf) Tissue ID[Tissue type]: BLCA[Bladder Urothelial Carcinoma], BRCA[Breast invasive carcinoma], CESC[Cervical squamous cell carcinoma and endocervical adenocarcinoma], COAD[Colon adenocarcinoma], GBM[Glioblastoma multiforme], Glioma Low Grade, HNSC[Head and Neck squamous cell carcinoma], KICH[Kidney Chromophobe], KIRC[Kidney renal clear cell carcinoma], KIRP[Kidney renal papillary cell carcinoma], LAML[Acute Myeloid Leukemia], LUAD[Lung adenocarcinoma], LUSC[Lung squamous cell carcinoma], OV[Ovarian serous cystadenocarcinoma ], PAAD[Pancreatic adenocarcinoma], PRAD[Prostate adenocarcinoma], SKCM[Skin Cutaneous Melanoma], STAD[Stomach adenocarcinoma], THCA[Thyroid carcinoma], UCEC[Uterine Corpus Endometrial Carcinoma] |
| Top |
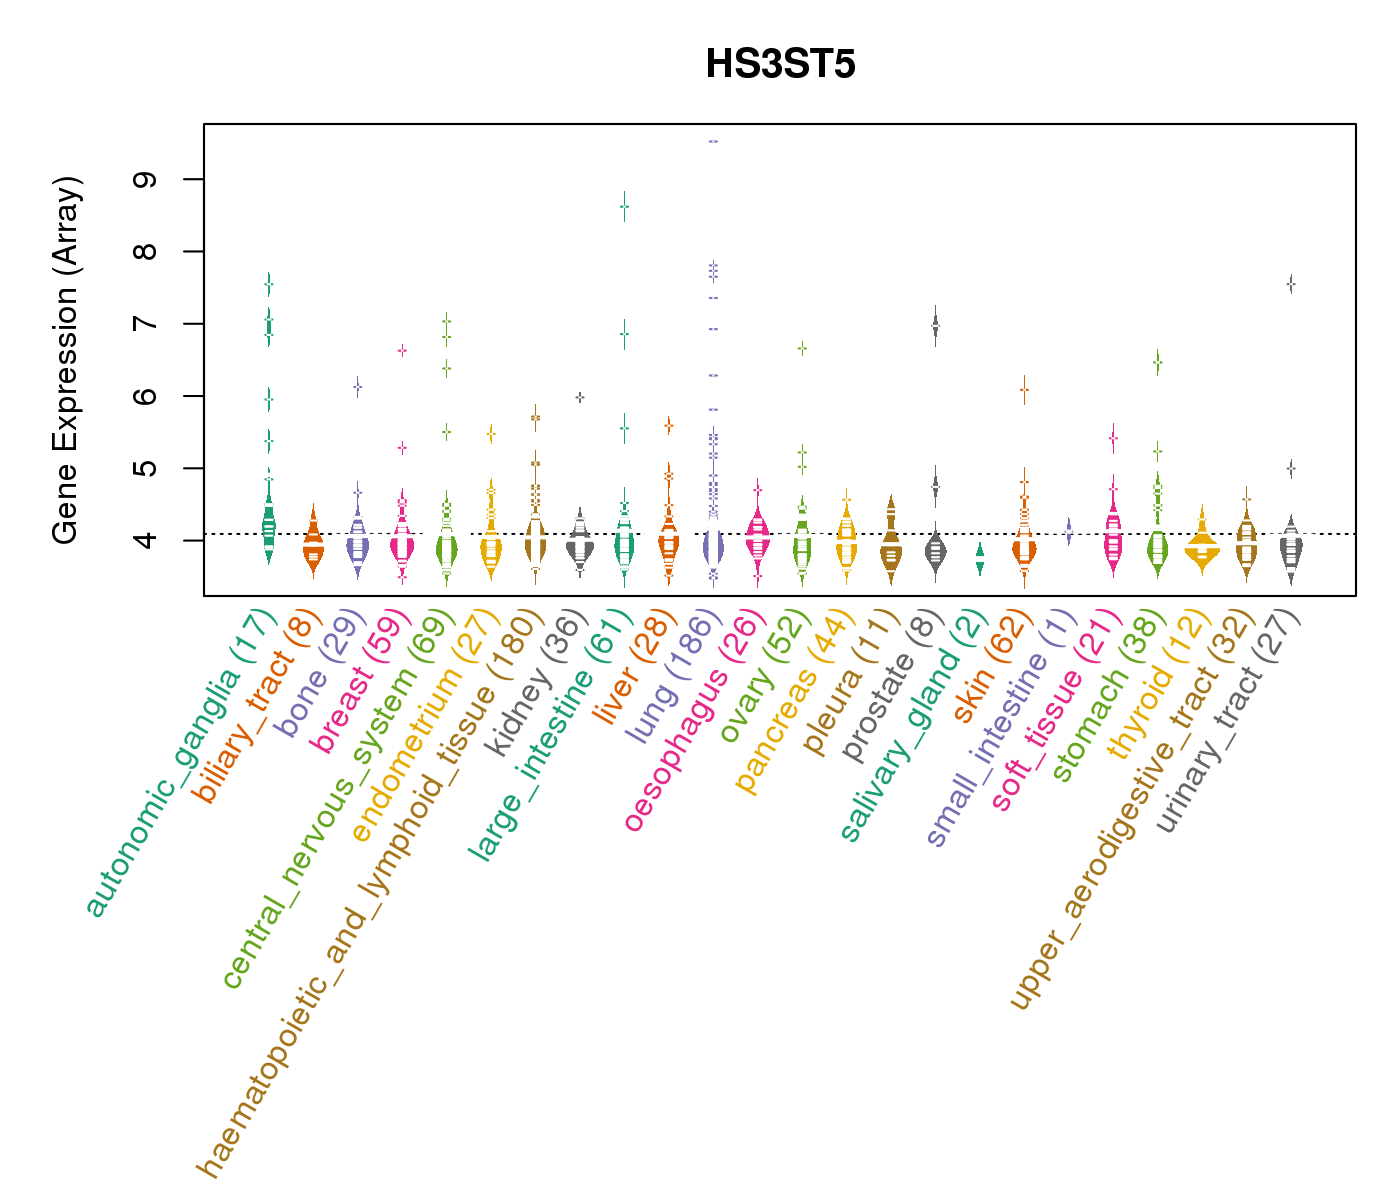
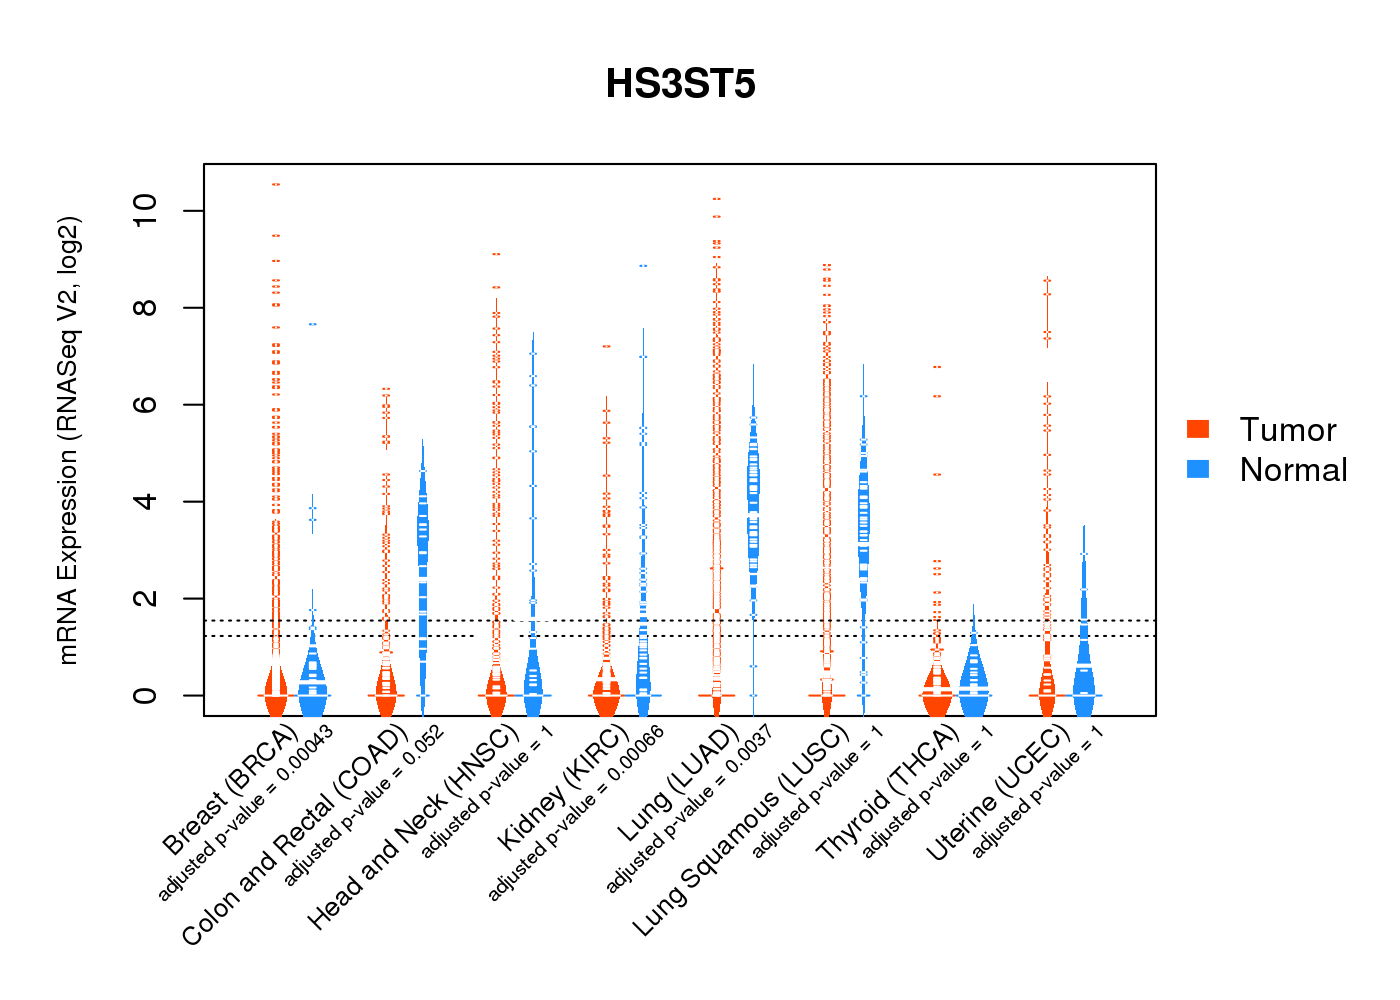
| Gene Expression for HS3ST5 |
| * CCLE gene expression data were extracted from CCLE_Expression_Entrez_2012-10-18.res: Gene-centric RMA-normalized mRNA expression data. |
 |
| * Normalized gene expression data of RNASeqV2 was extracted from TCGA using R package TCGA-Assembler. The URLs of all public data files on TCGA DCC data server were gathered at Jan-05-2015. Only eight cancer types have enough normal control samples for differential expression analysis. (t test, adjusted p<0.05 (using Benjamini-Hochberg FDR)) |
 |
| Top |
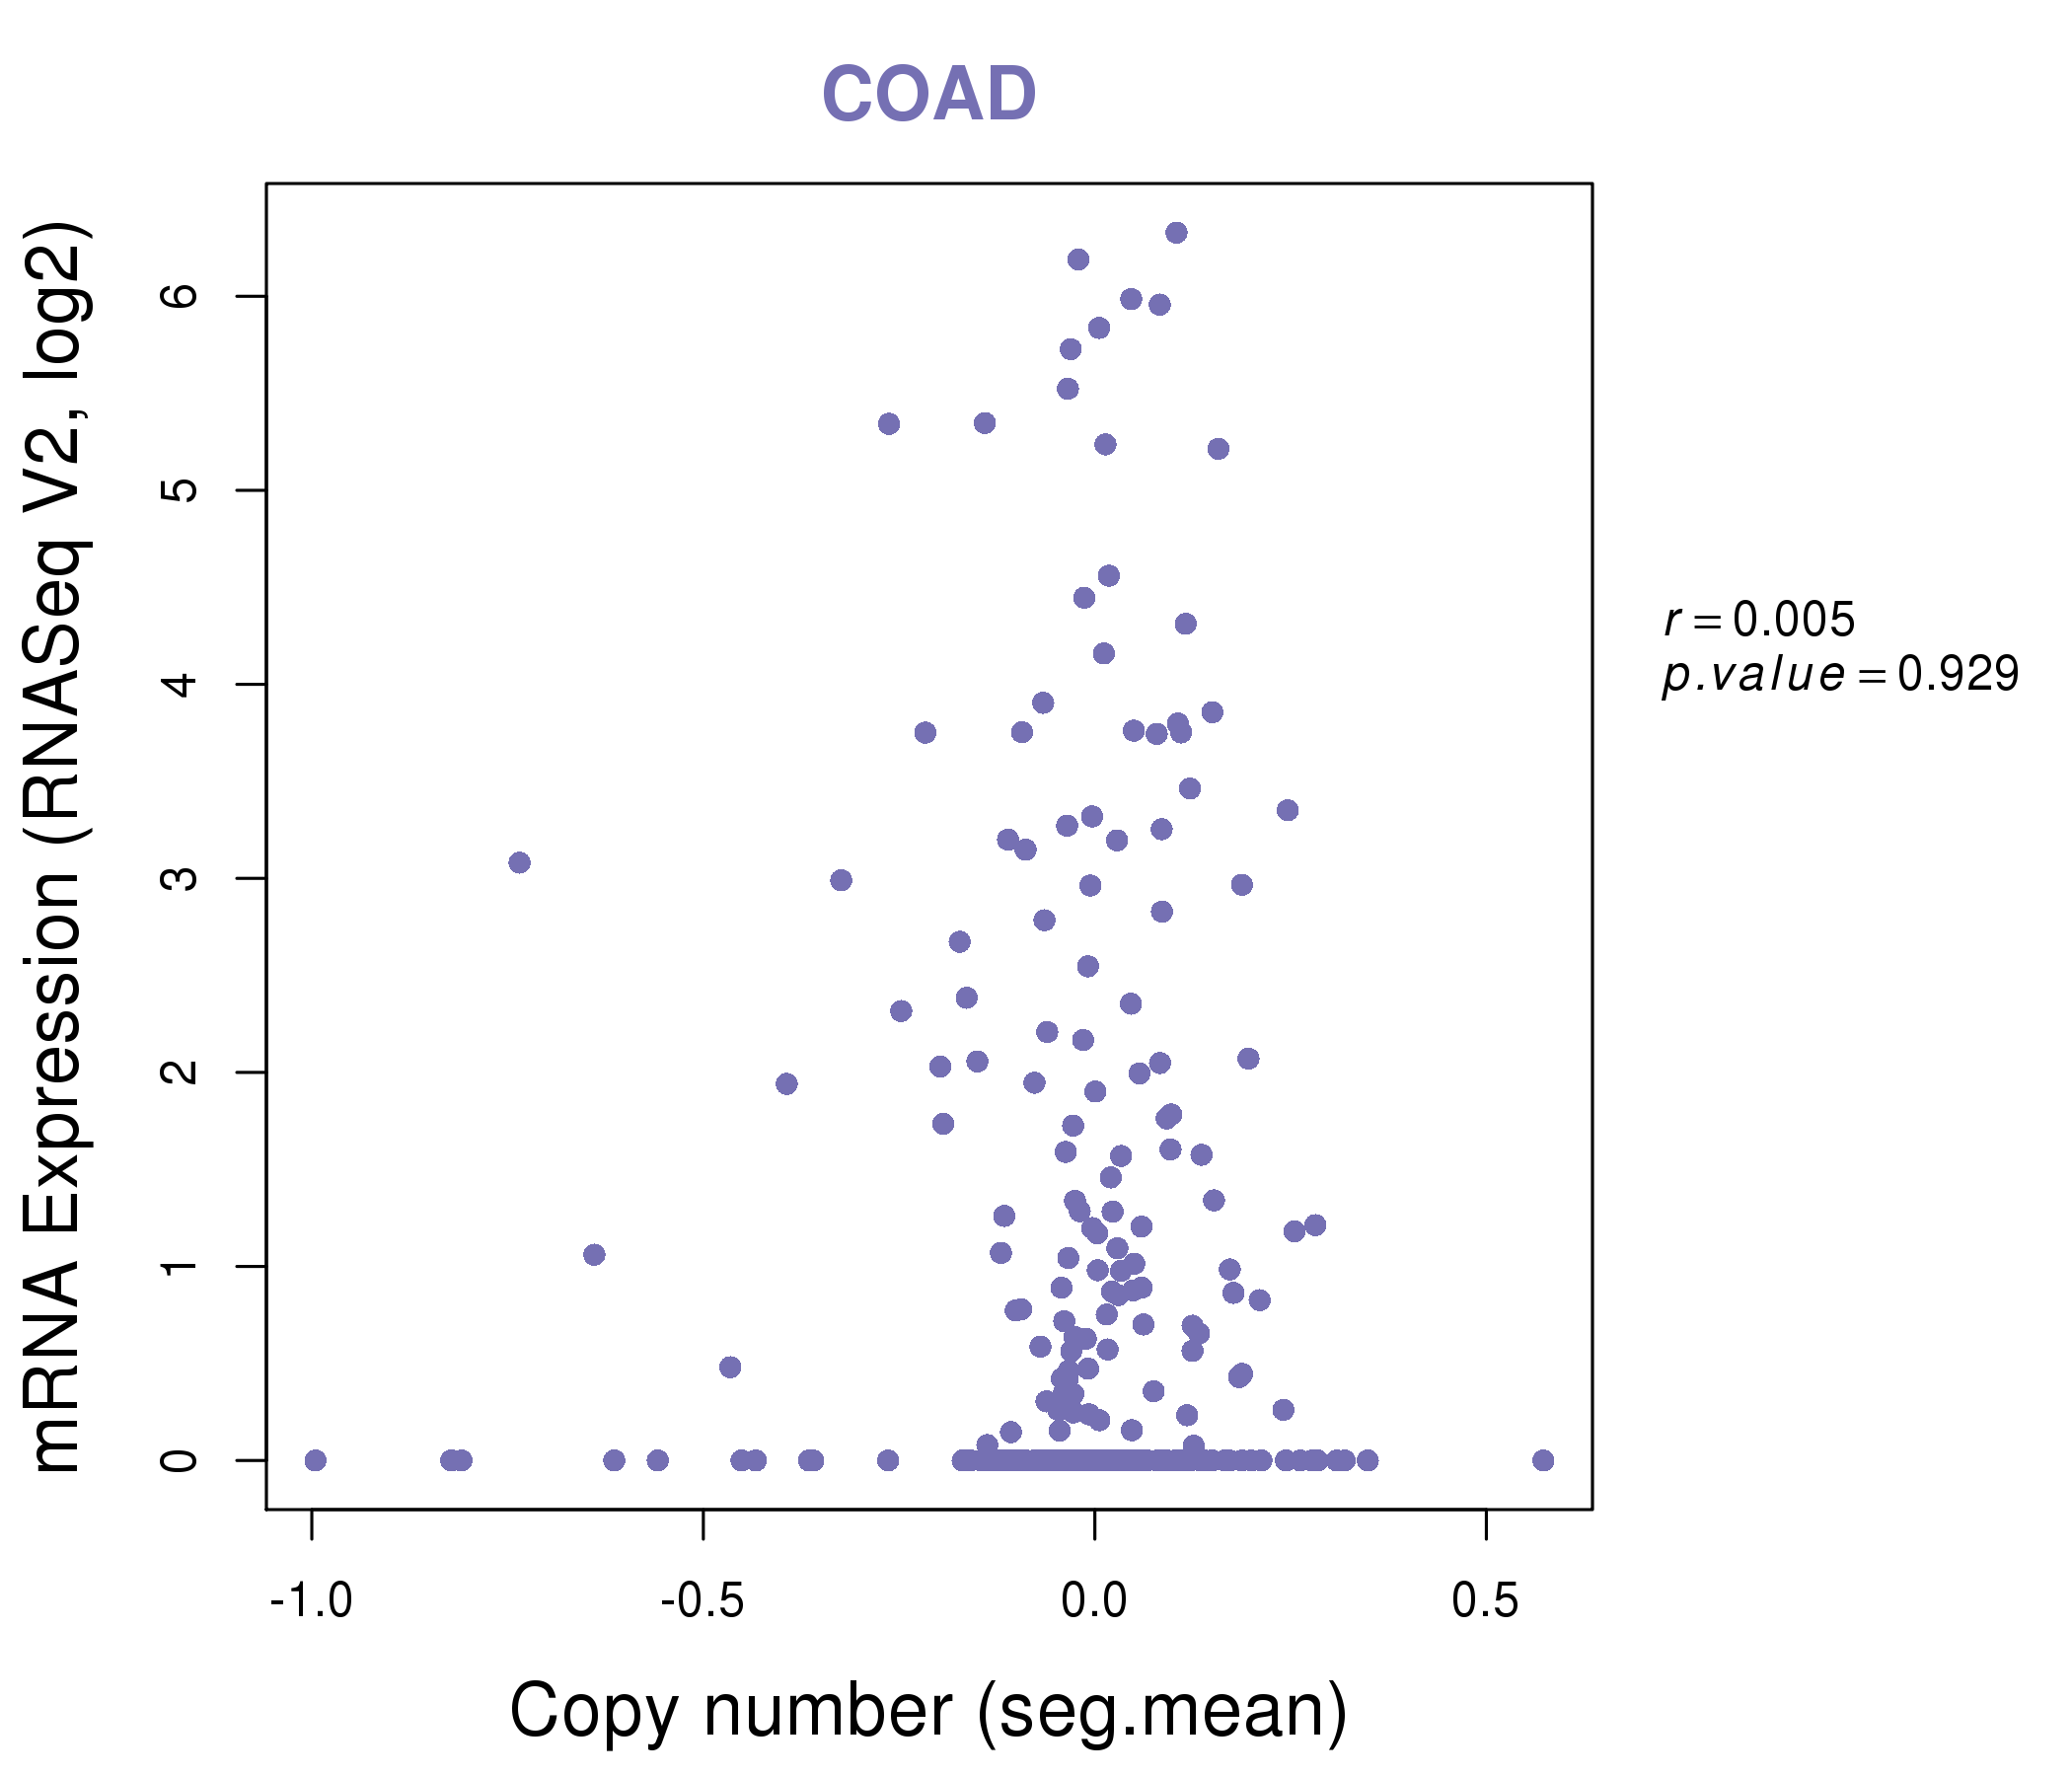
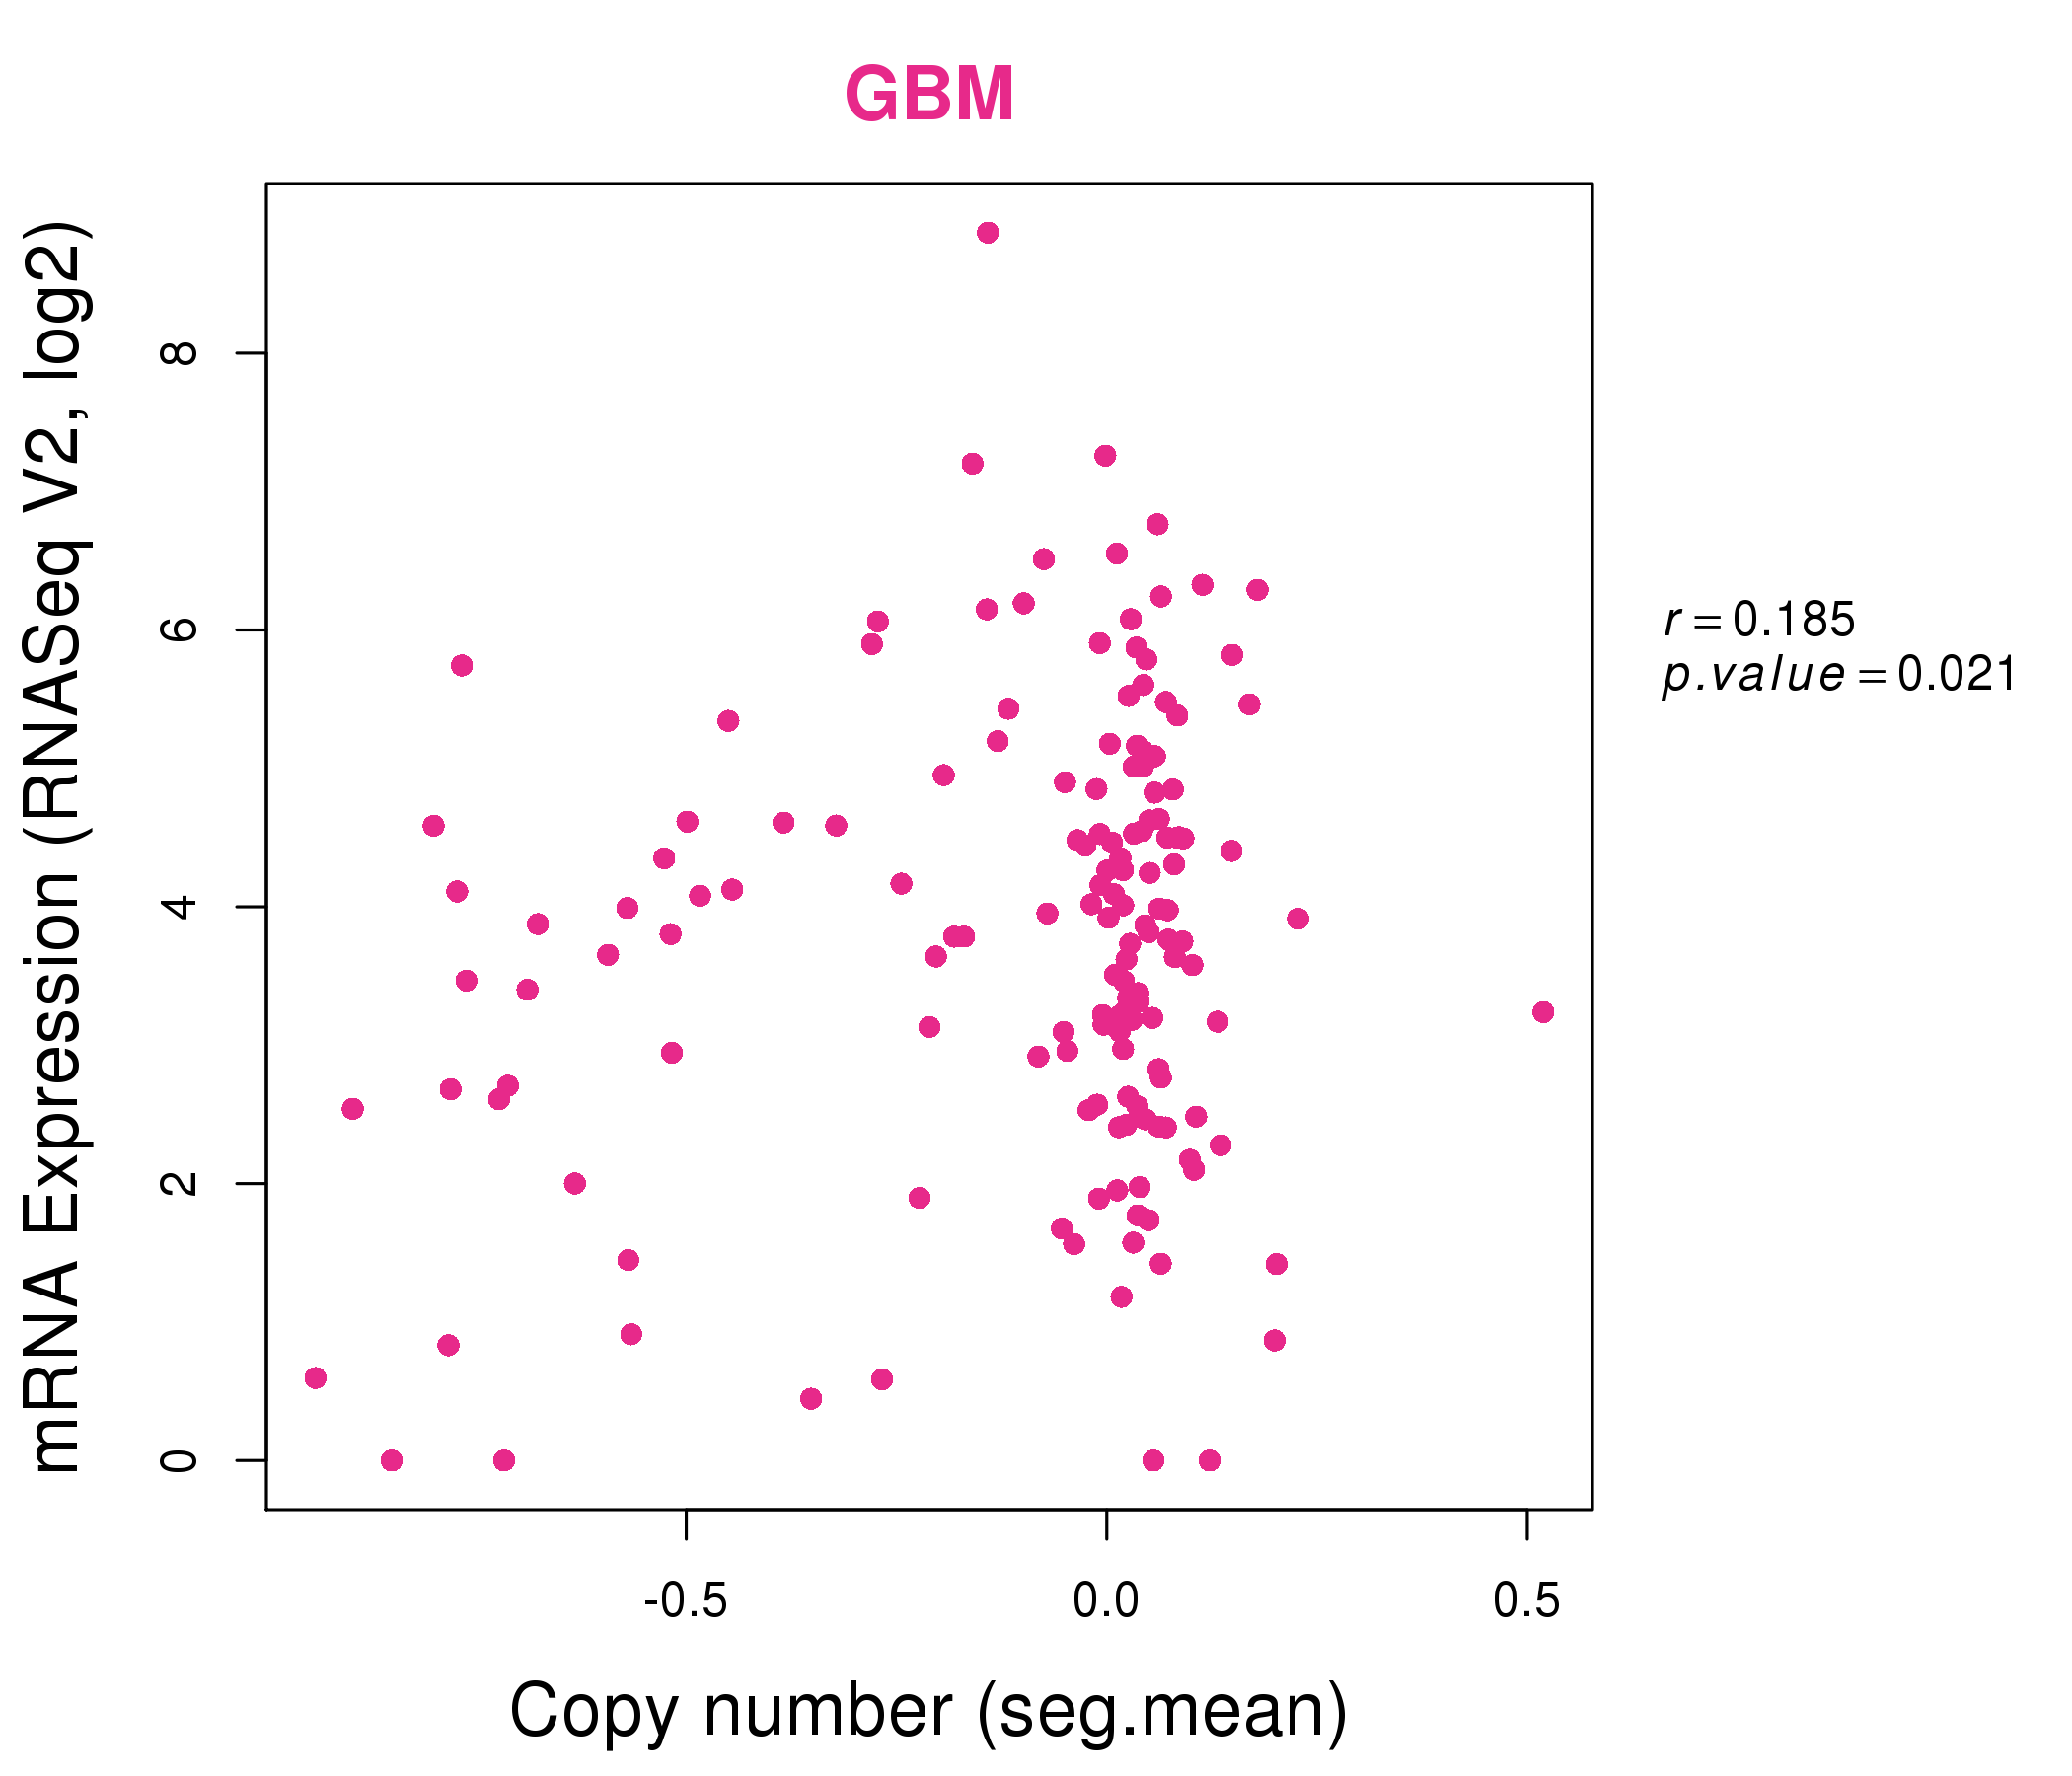
| * This plots show the correlation between CNV and gene expression. |
: Open all plots for all cancer types
 |
|
 |
|

| Top |
| Gene-Gene Network Information |
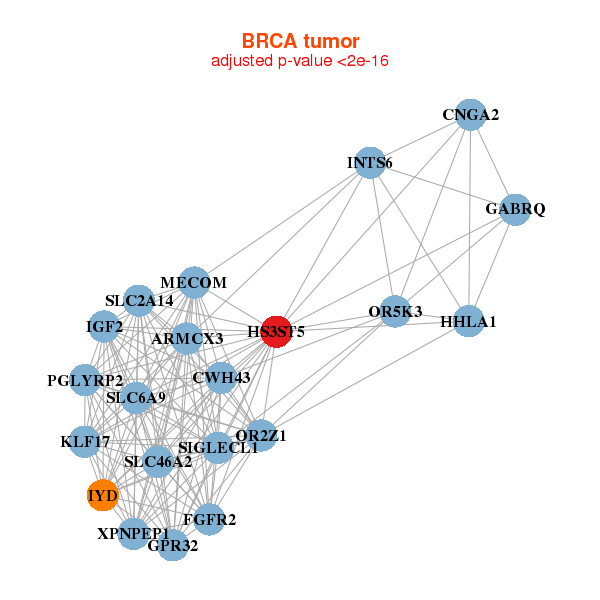
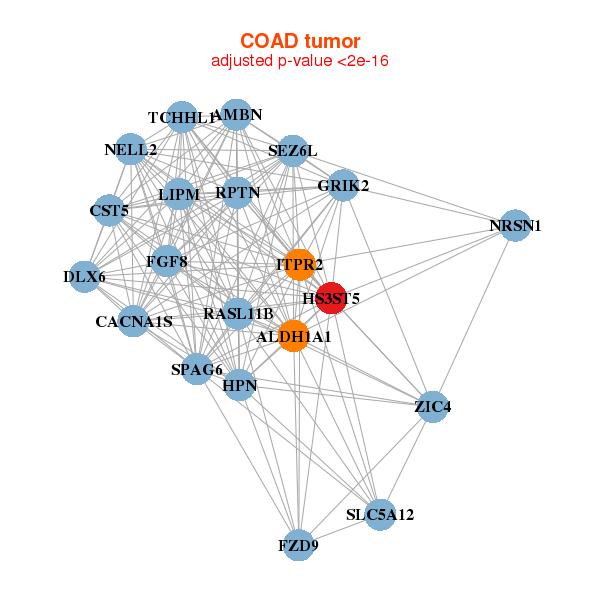
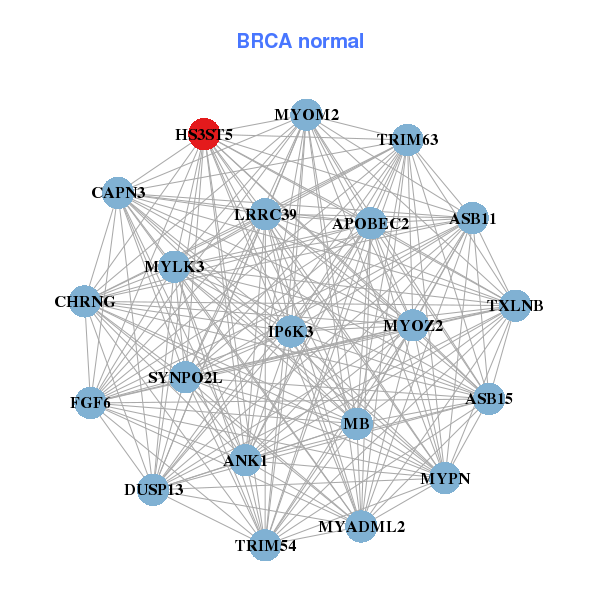
| * Co-Expression network figures were drawn using R package igraph. Only the top 20 genes with the highest correlations were shown. Red circle: input gene, orange circle: cell metabolism gene, sky circle: other gene |
: Open all plots for all cancer types
 |
|
| ARMCX3,SIGLECL1,CNGA2,CWH43,FGFR2,GABRQ,GPR32, HHLA1,HS3ST5,IGF2,INTS6,IYD,KLF17,MECOM, OR2Z1,OR5K3,PGLYRP2,SLC2A14,SLC46A2,SLC6A9,XPNPEP1 | ANK1,APOBEC2,ASB11,ASB15,CAPN3,CHRNG,DUSP13, FGF6,HS3ST5,IP6K3,LRRC39,MB,MYADML2,MYLK3, MYOM2,MYOZ2,MYPN,SYNPO2L,TRIM54,TRIM63,TXLNB |
 |
|
| ALDH1A1,AMBN,CACNA1S,CST5,DLX6,FGF8,FZD9, GRIK2,HPN,HS3ST5,ITPR2,LIPM,NELL2,NRSN1, RASL11B,RPTN,SEZ6L,SLC5A12,SPAG6,TCHHL1,ZIC4 | CDH2,DLG2,FAM184A,FBXL2,FZD7,GNAZ,HS3ST5, IPW,JAKMIP3,LOC100128239,LOC643763,LSAMP,MLLT11,PHOX2B, PPP2R2C,PTPRZ1,RIC3,SOX2,ST8SIA3,TMEM130,ZCCHC12 |

| * Co-Expression network figures were drawn using R package igraph. Only the top 20 genes with the highest correlations were shown. Red circle: input gene, orange circle: cell metabolism gene, sky circle: other gene |
: Open all plots for all cancer types
| Top |
: Open all interacting genes' information including KEGG pathway for all interacting genes from DAVID
| Top |
| Pharmacological Information for HS3ST5 |
| There's no related Drug. |
| Top |
| Cross referenced IDs for HS3ST5 |
| * We obtained these cross-references from Uniprot database. It covers 150 different DBs, 18 categories. http://www.uniprot.org/help/cross_references_section |
: Open all cross reference information
|
Copyright © 2016-Present - The Univsersity of Texas Health Science Center at Houston @ |