|
||||||||||||||||||||
| |
| Phenotypic Information (metabolism pathway, cancer, disease, phenome) |
| |
| |
| Gene-Gene Network Information: Co-Expression Network, Interacting Genes & KEGG |
| |
|


| Gene Summary for GPC4 |
| Basic gene info. | Gene symbol | GPC4 |
| Gene name | glypican 4 | |
| Synonyms | K-glypican | |
| Cytomap | UCSC genome browser: Xq26.1 | |
| Genomic location | chrX :132435063-132549205 | |
| Type of gene | protein-coding | |
| RefGenes | NM_001448.2, | |
| Ensembl id | ENSG00000076716 | |
| Description | dJ900E8.1 (glypican 4)glypican proteoglycan 4glypican-4 | |
| Modification date | 20141219 | |
| dbXrefs | MIM : 300168 | |
| HGNC : HGNC | ||
| HPRD : 02160 | ||
| Protein | UniProt: go to UniProt's Cross Reference DB Table | |
| Expression | CleanEX: HS_GPC4 | |
| BioGPS: 2239 | ||
| Gene Expression Atlas: ENSG00000076716 | ||
| The Human Protein Atlas: ENSG00000076716 | ||
| Pathway | NCI Pathway Interaction Database: GPC4 | |
| KEGG: GPC4 | ||
| REACTOME: GPC4 | ||
| ConsensusPathDB | ||
| Pathway Commons: GPC4 | ||
| Metabolism | MetaCyc: GPC4 | |
| HUMANCyc: GPC4 | ||
| Regulation | Ensembl's Regulation: ENSG00000076716 | |
| miRBase: chrX :132,435,063-132,549,205 | ||
| TargetScan: NM_001448 | ||
| cisRED: ENSG00000076716 | ||
| Context | iHOP: GPC4 | |
| cancer metabolism search in PubMed: GPC4 | ||
| UCL Cancer Institute: GPC4 | ||
| Assigned class in ccmGDB | C | |
| Top |
| Phenotypic Information for GPC4(metabolism pathway, cancer, disease, phenome) |
| Cancer | CGAP: GPC4 |
| Familial Cancer Database: GPC4 | |
| * This gene is included in those cancer gene databases. |
|
|
|
|
|
| . | ||||||||||||||
Oncogene 1 | Significant driver gene in | |||||||||||||||||||
| cf) number; DB name 1 Oncogene; http://nar.oxfordjournals.org/content/35/suppl_1/D721.long, 2 Tumor Suppressor gene; https://bioinfo.uth.edu/TSGene/, 3 Cancer Gene Census; http://www.nature.com/nrc/journal/v4/n3/abs/nrc1299.html, 4 CancerGenes; http://nar.oxfordjournals.org/content/35/suppl_1/D721.long, 5 Network of Cancer Gene; http://ncg.kcl.ac.uk/index.php, 1Therapeutic Vulnerabilities in Cancer; http://cbio.mskcc.org/cancergenomics/statius/ |
| REACTOME_METABOLISM_OF_CARBOHYDRATES | |
| OMIM | |
| Orphanet | |
| Disease | KEGG Disease: GPC4 |
| MedGen: GPC4 (Human Medical Genetics with Condition) | |
| ClinVar: GPC4 | |
| Phenotype | MGI: GPC4 (International Mouse Phenotyping Consortium) |
| PhenomicDB: GPC4 | |
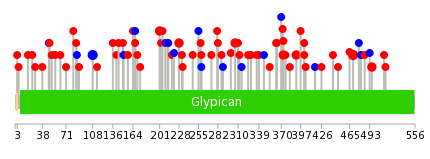
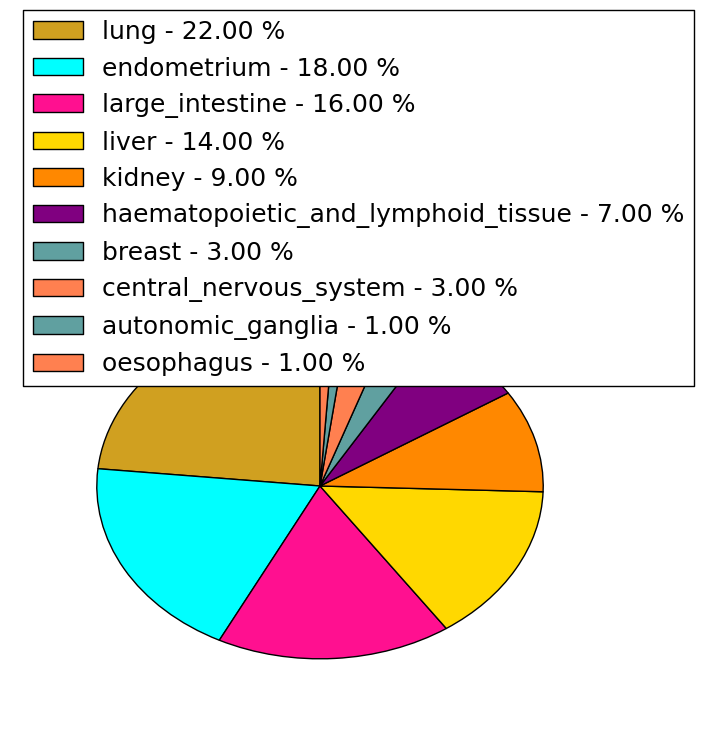
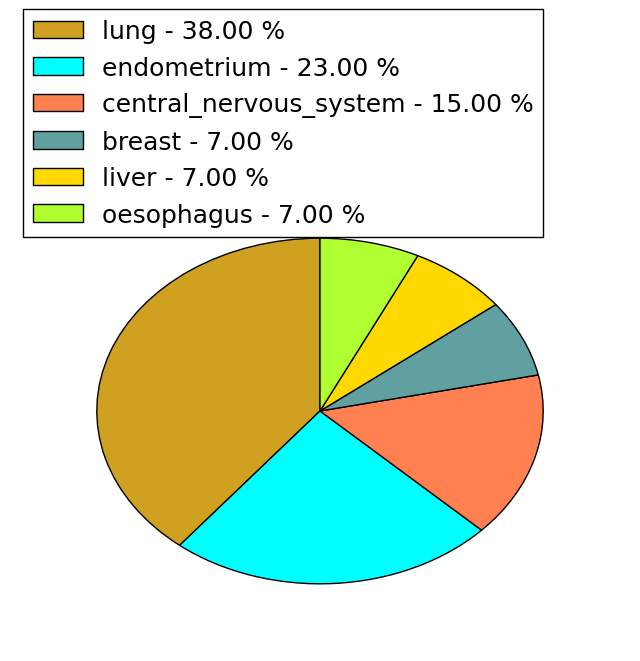
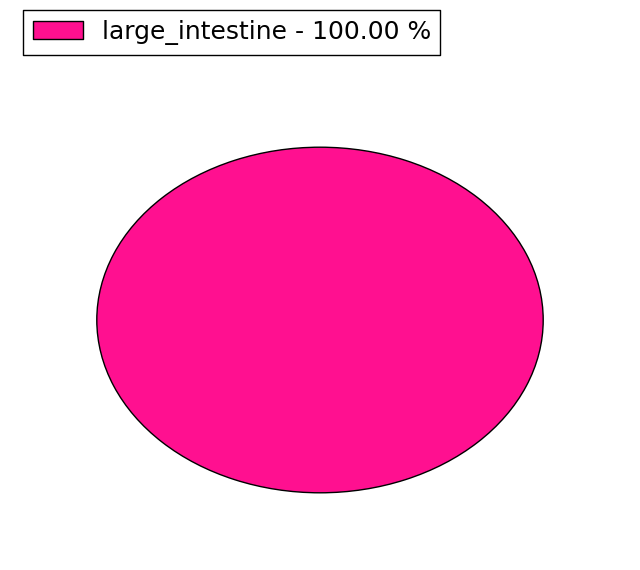
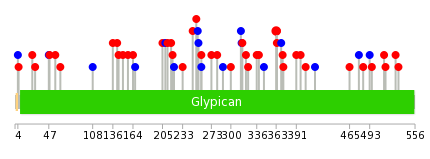
| Mutations for GPC4 |
| * Under tables are showing count per each tissue to give us broad intuition about tissue specific mutation patterns.You can go to the detailed page for each mutation database's web site. |
| There's no structural variation information in COSMIC data for this gene. |
| * From mRNA Sanger sequences, Chitars2.0 arranged chimeric transcripts. This table shows GPC4 related fusion information. |
| ID | Head Gene | Tail Gene | Accession | Gene_a | qStart_a | qEnd_a | Chromosome_a | tStart_a | tEnd_a | Gene_a | qStart_a | qEnd_a | Chromosome_a | tStart_a | tEnd_a |
| BP296794 | GPC4 | 1 | 357 | X | 132435219 | 132435576 | BCL2A1 | 357 | 422 | 15 | 80253234 | 80253299 | |
| AW195421 | ATXN1L | 4 | 239 | 16 | 71893588 | 71893823 | GPC4 | 233 | 584 | X | 132532910 | 132533261 | |
| Top |
| There's no copy number variation information in COSMIC data for this gene. |
| Top |
|
 |
| Top |
| Stat. for Non-Synonymous SNVs (# total SNVs=54) | (# total SNVs=13) |
 |  |
(# total SNVs=1) | (# total SNVs=0) |
 |
| Top |
| * When you move the cursor on each content, you can see more deailed mutation information on the Tooltip. Those are primary_site,primary_histology,mutation(aa),pubmedID. |
| GRCh37 position | Mutation(aa) | Unique sampleID count |
| chr23:132437253-132437253 | p.V470G | 3 |
| chr23:132458560-132458560 | p.F108F | 3 |
| chr23:132440142-132440142 | p.F306L | 2 |
| chr23:132458283-132458283 | p.G201R | 2 |
| chr23:132473370-132473370 | p.? | 2 |
| chr23:132438872-132438872 | p.E391D | 2 |
| chr23:132458201-132458201 | p.A228V | 2 |
| chr23:132439838-132439838 | p.R373C | 2 |
| chr23:132439841-132439841 | p.E372* | 2 |
| chr23:132437080-132437080 | p.E496K | 2 |
| Top |
|
 |
| Point Mutation/ Tissue ID | 1 | 2 | 3 | 4 | 5 | 6 | 7 | 8 | 9 | 10 | 11 | 12 | 13 | 14 | 15 | 16 | 17 | 18 | 19 | 20 |
| # sample | 1 | 1 | 6 | 1 | 5 | 2 | 15 | 3 | 1 | 9 | 3 | 10 | ||||||||
| # mutation | 1 | 1 | 7 | 1 | 5 | 2 | 16 | 3 | 1 | 9 | 3 | 11 | ||||||||
| nonsynonymous SNV | 1 | 7 | 3 | 2 | 13 | 1 | 1 | 5 | 3 | 8 | ||||||||||
| synonymous SNV | 1 | 1 | 2 | 3 | 2 | 4 | 3 |
| cf) Tissue ID; Tissue type (1; BLCA[Bladder Urothelial Carcinoma], 2; BRCA[Breast invasive carcinoma], 3; CESC[Cervical squamous cell carcinoma and endocervical adenocarcinoma], 4; COAD[Colon adenocarcinoma], 5; GBM[Glioblastoma multiforme], 6; Glioma Low Grade, 7; HNSC[Head and Neck squamous cell carcinoma], 8; KICH[Kidney Chromophobe], 9; KIRC[Kidney renal clear cell carcinoma], 10; KIRP[Kidney renal papillary cell carcinoma], 11; LAML[Acute Myeloid Leukemia], 12; LUAD[Lung adenocarcinoma], 13; LUSC[Lung squamous cell carcinoma], 14; OV[Ovarian serous cystadenocarcinoma ], 15; PAAD[Pancreatic adenocarcinoma], 16; PRAD[Prostate adenocarcinoma], 17; SKCM[Skin Cutaneous Melanoma], 18:STAD[Stomach adenocarcinoma], 19:THCA[Thyroid carcinoma], 20:UCEC[Uterine Corpus Endometrial Carcinoma]) |
| Top |
| * We represented just top 10 SNVs. When you move the cursor on each content, you can see more deailed mutation information on the Tooltip. Those are primary_site, primary_histology, mutation(aa), pubmedID. |
| Genomic Position | Mutation(aa) | Unique sampleID count |
| chrX:132439867 | p.A363V | 2 |
| chrX:132548911 | p.A247V | 1 |
| chrX:132440114 | p.G63C | 1 |
| chrX:132445407 | p.E496K | 1 |
| chrX:132437029 | p.Q339H | 1 |
| chrX:132458415 | p.S233R | 1 |
| chrX:132439841 | p.H56R | 1 |
| chrX:132548924 | p.S493S | 1 |
| chrX:132440115 | p.K336N | 1 |
| chrX:132445423 | p.F221F | 1 |
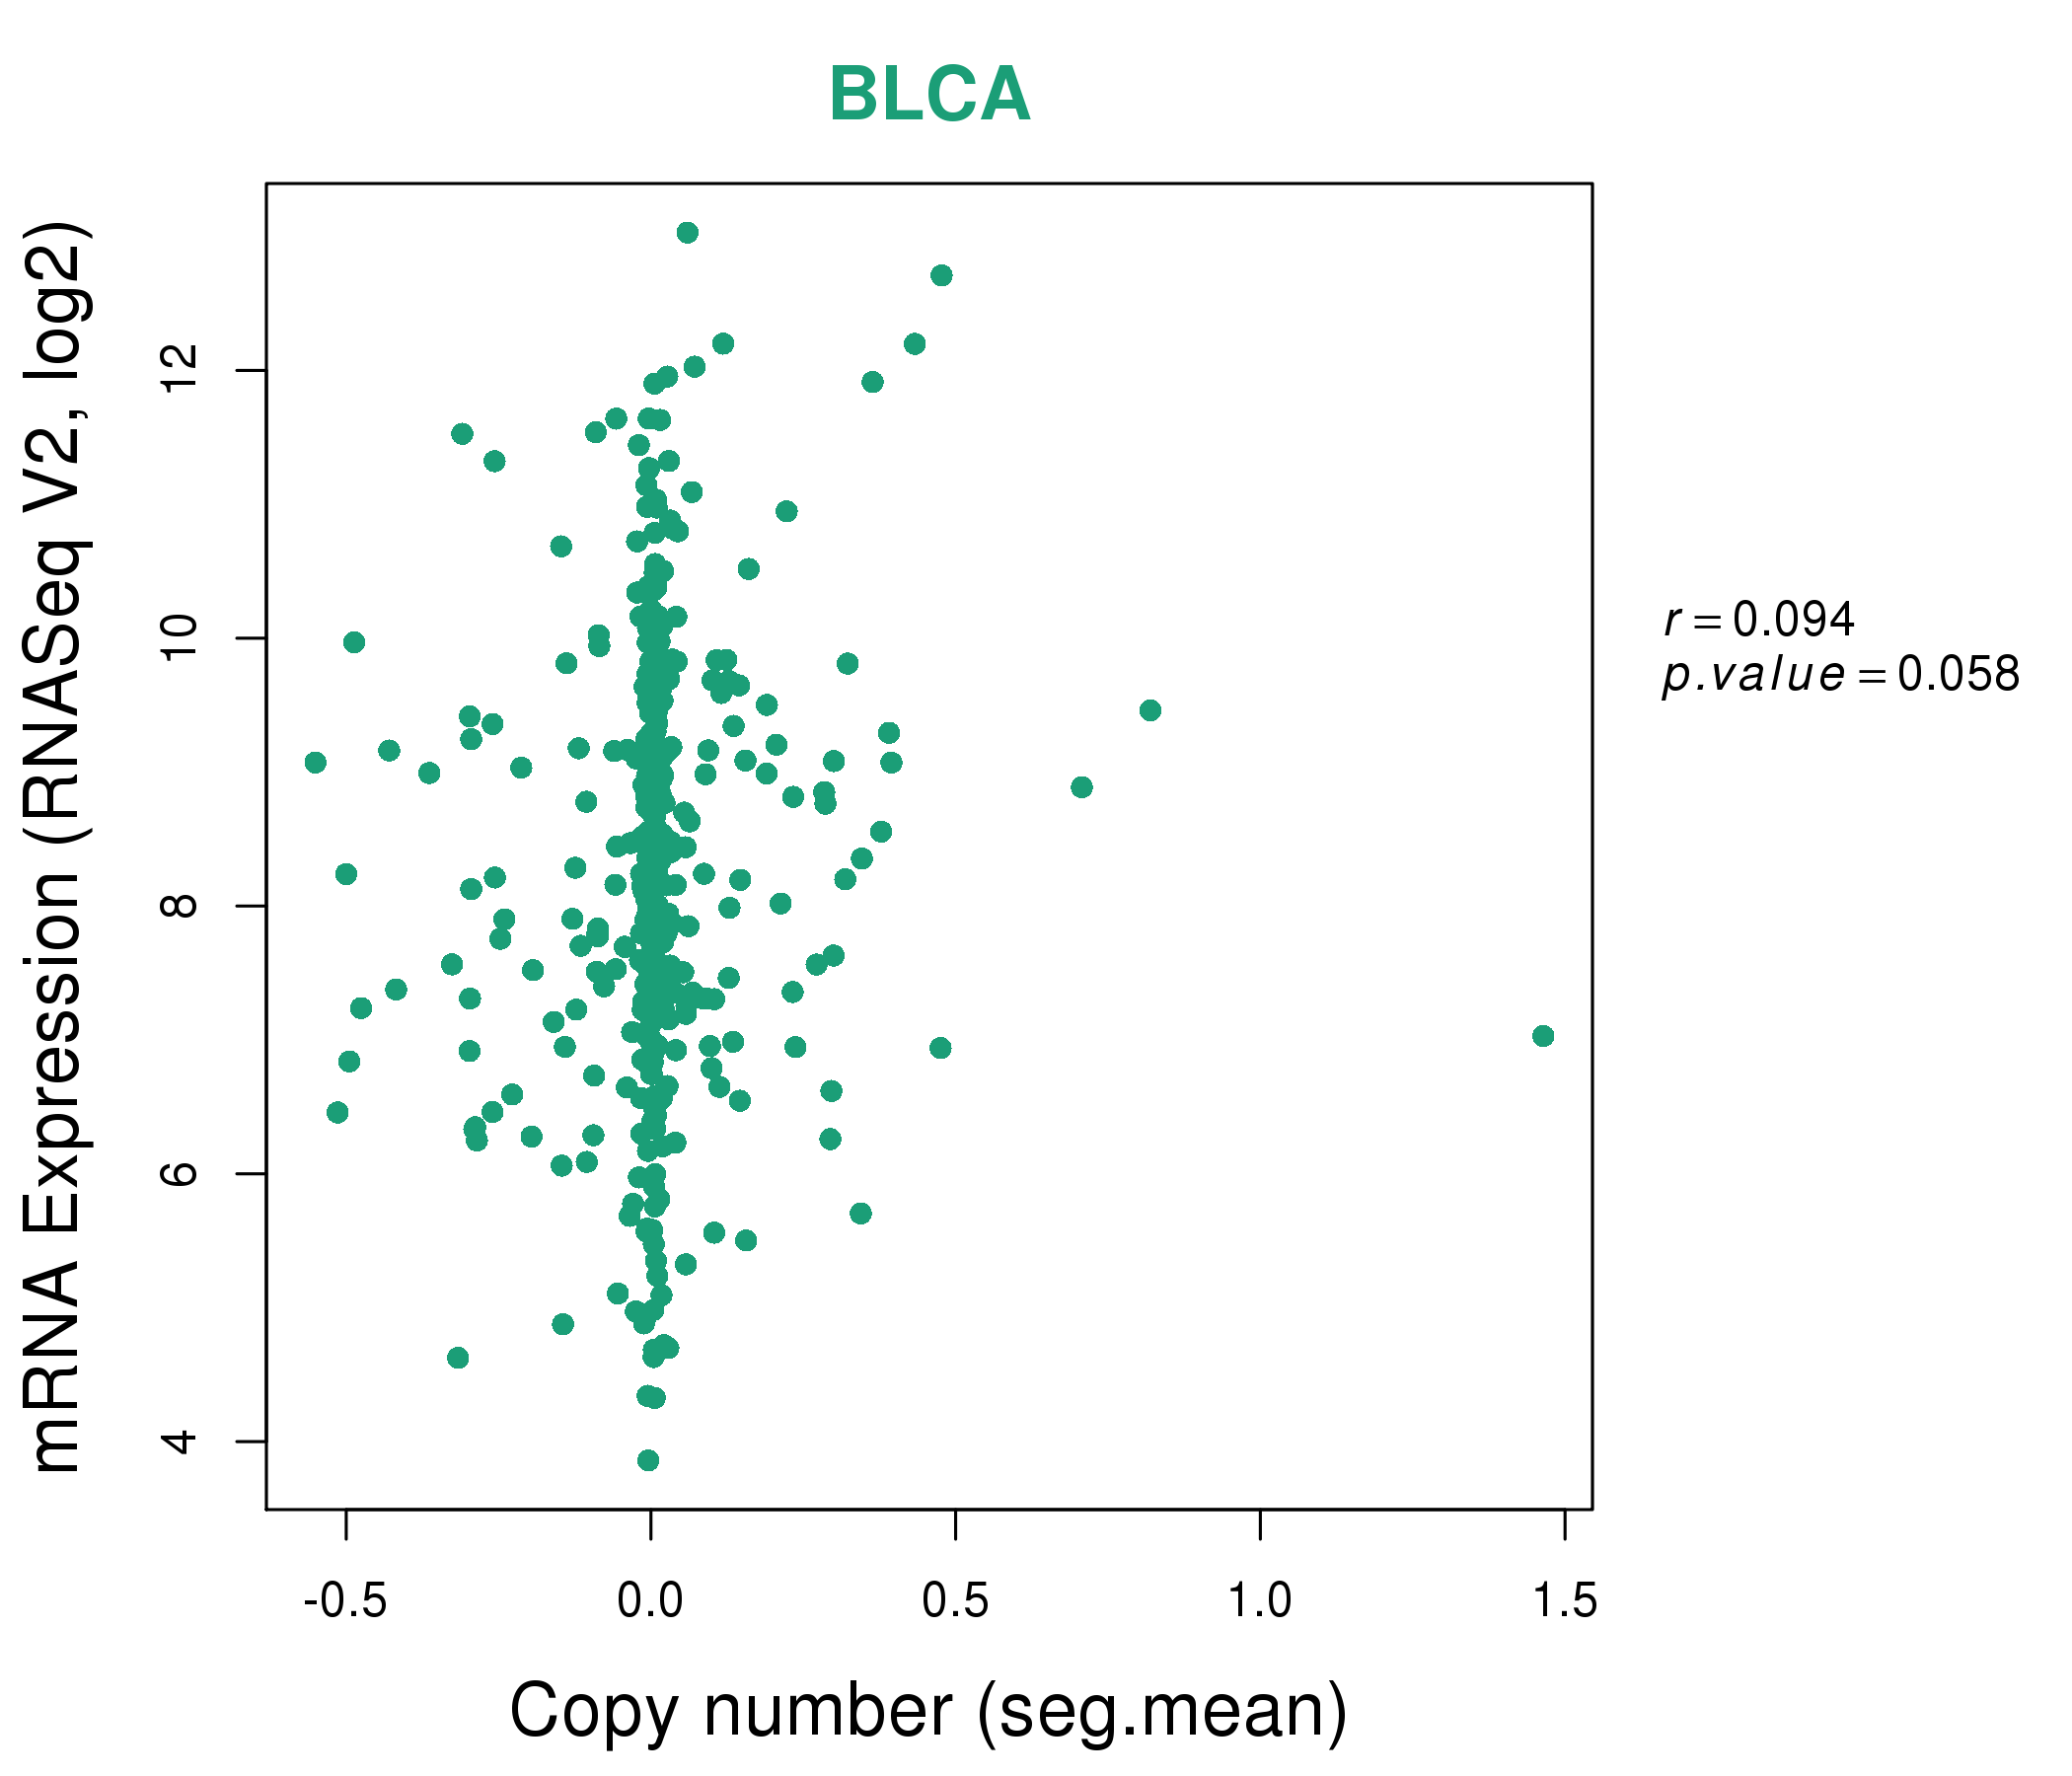
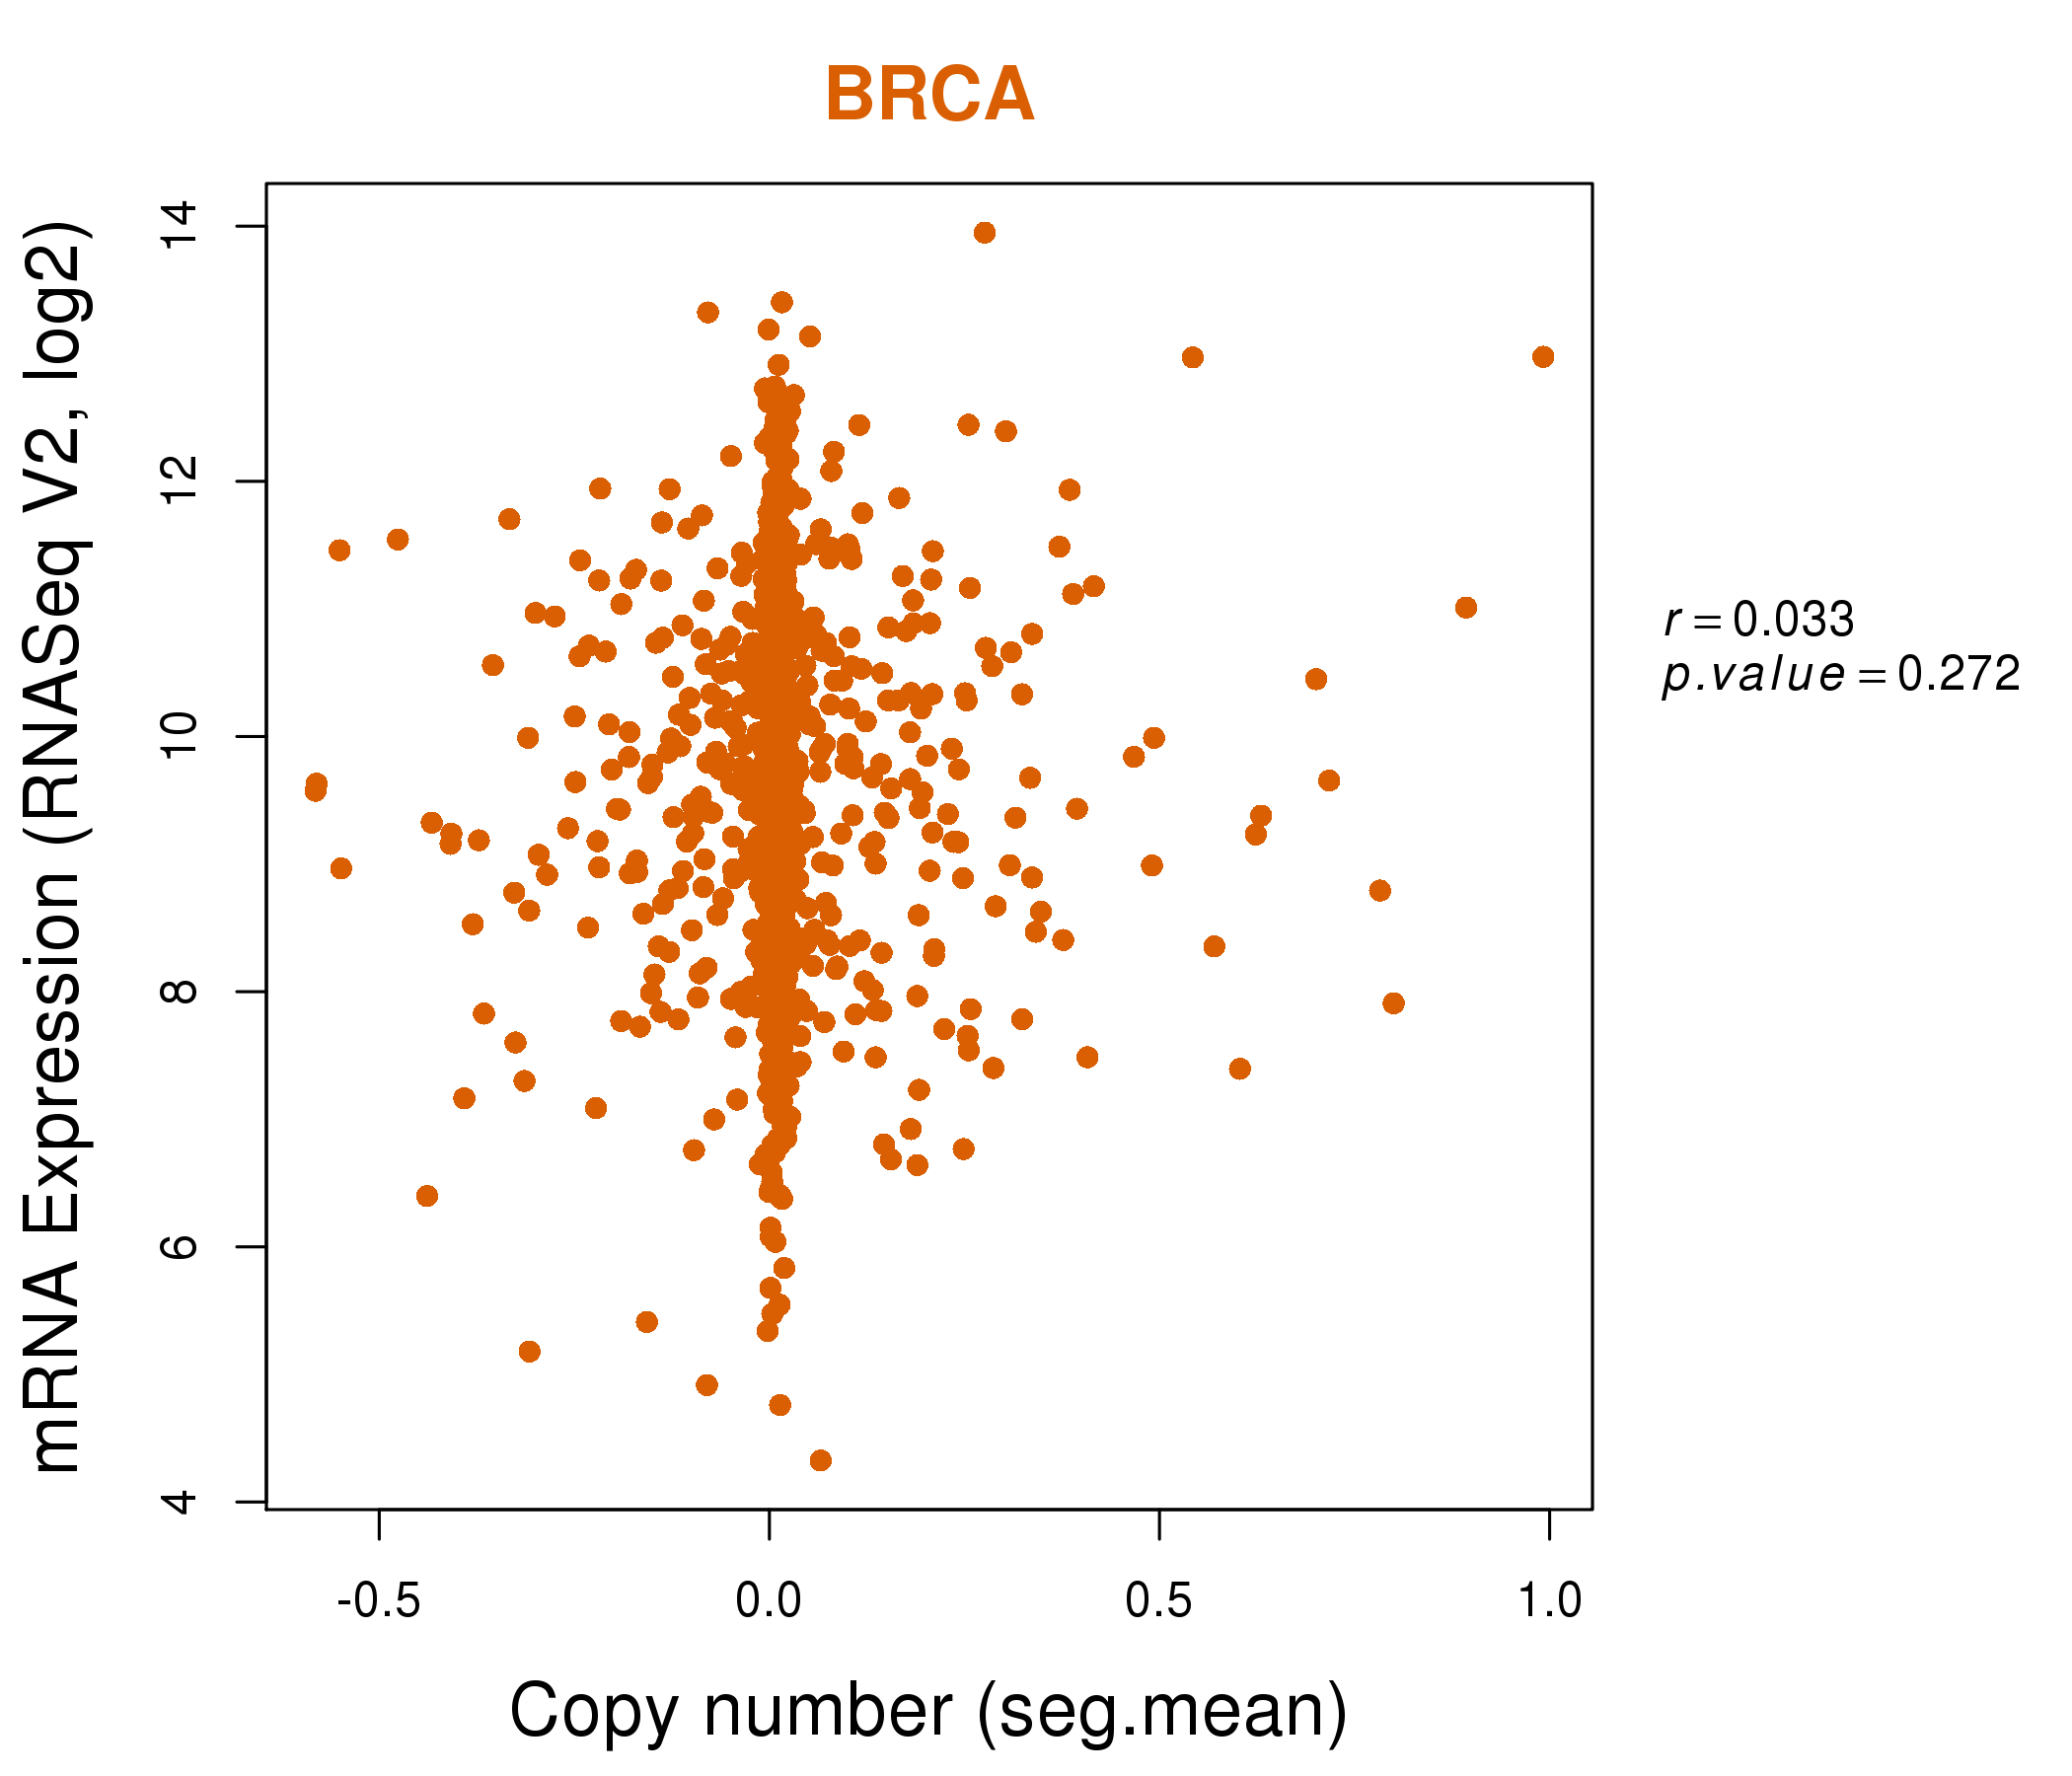
| * Copy number data were extracted from TCGA using R package TCGA-Assembler. The URLs of all public data files on TCGA DCC data server were gathered on Jan-05-2015. Function ProcessCNAData in TCGA-Assembler package was used to obtain gene-level copy number value which is calculated as the average copy number of the genomic region of a gene. |
 |
| cf) Tissue ID[Tissue type]: BLCA[Bladder Urothelial Carcinoma], BRCA[Breast invasive carcinoma], CESC[Cervical squamous cell carcinoma and endocervical adenocarcinoma], COAD[Colon adenocarcinoma], GBM[Glioblastoma multiforme], Glioma Low Grade, HNSC[Head and Neck squamous cell carcinoma], KICH[Kidney Chromophobe], KIRC[Kidney renal clear cell carcinoma], KIRP[Kidney renal papillary cell carcinoma], LAML[Acute Myeloid Leukemia], LUAD[Lung adenocarcinoma], LUSC[Lung squamous cell carcinoma], OV[Ovarian serous cystadenocarcinoma ], PAAD[Pancreatic adenocarcinoma], PRAD[Prostate adenocarcinoma], SKCM[Skin Cutaneous Melanoma], STAD[Stomach adenocarcinoma], THCA[Thyroid carcinoma], UCEC[Uterine Corpus Endometrial Carcinoma] |
| Top |
| Gene Expression for GPC4 |
| * CCLE gene expression data were extracted from CCLE_Expression_Entrez_2012-10-18.res: Gene-centric RMA-normalized mRNA expression data. |
 |
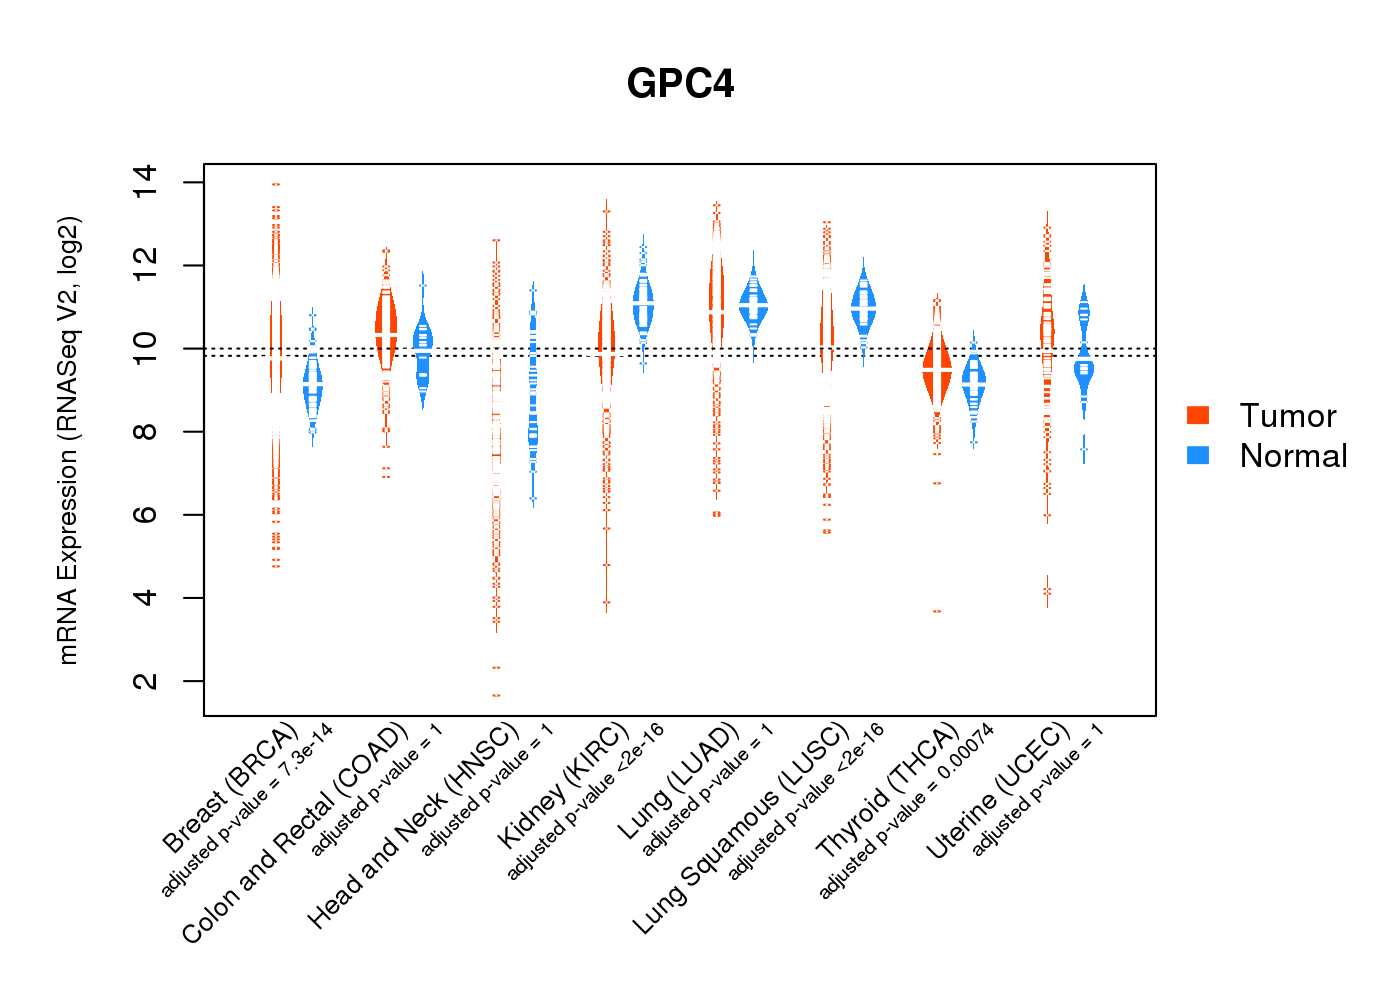
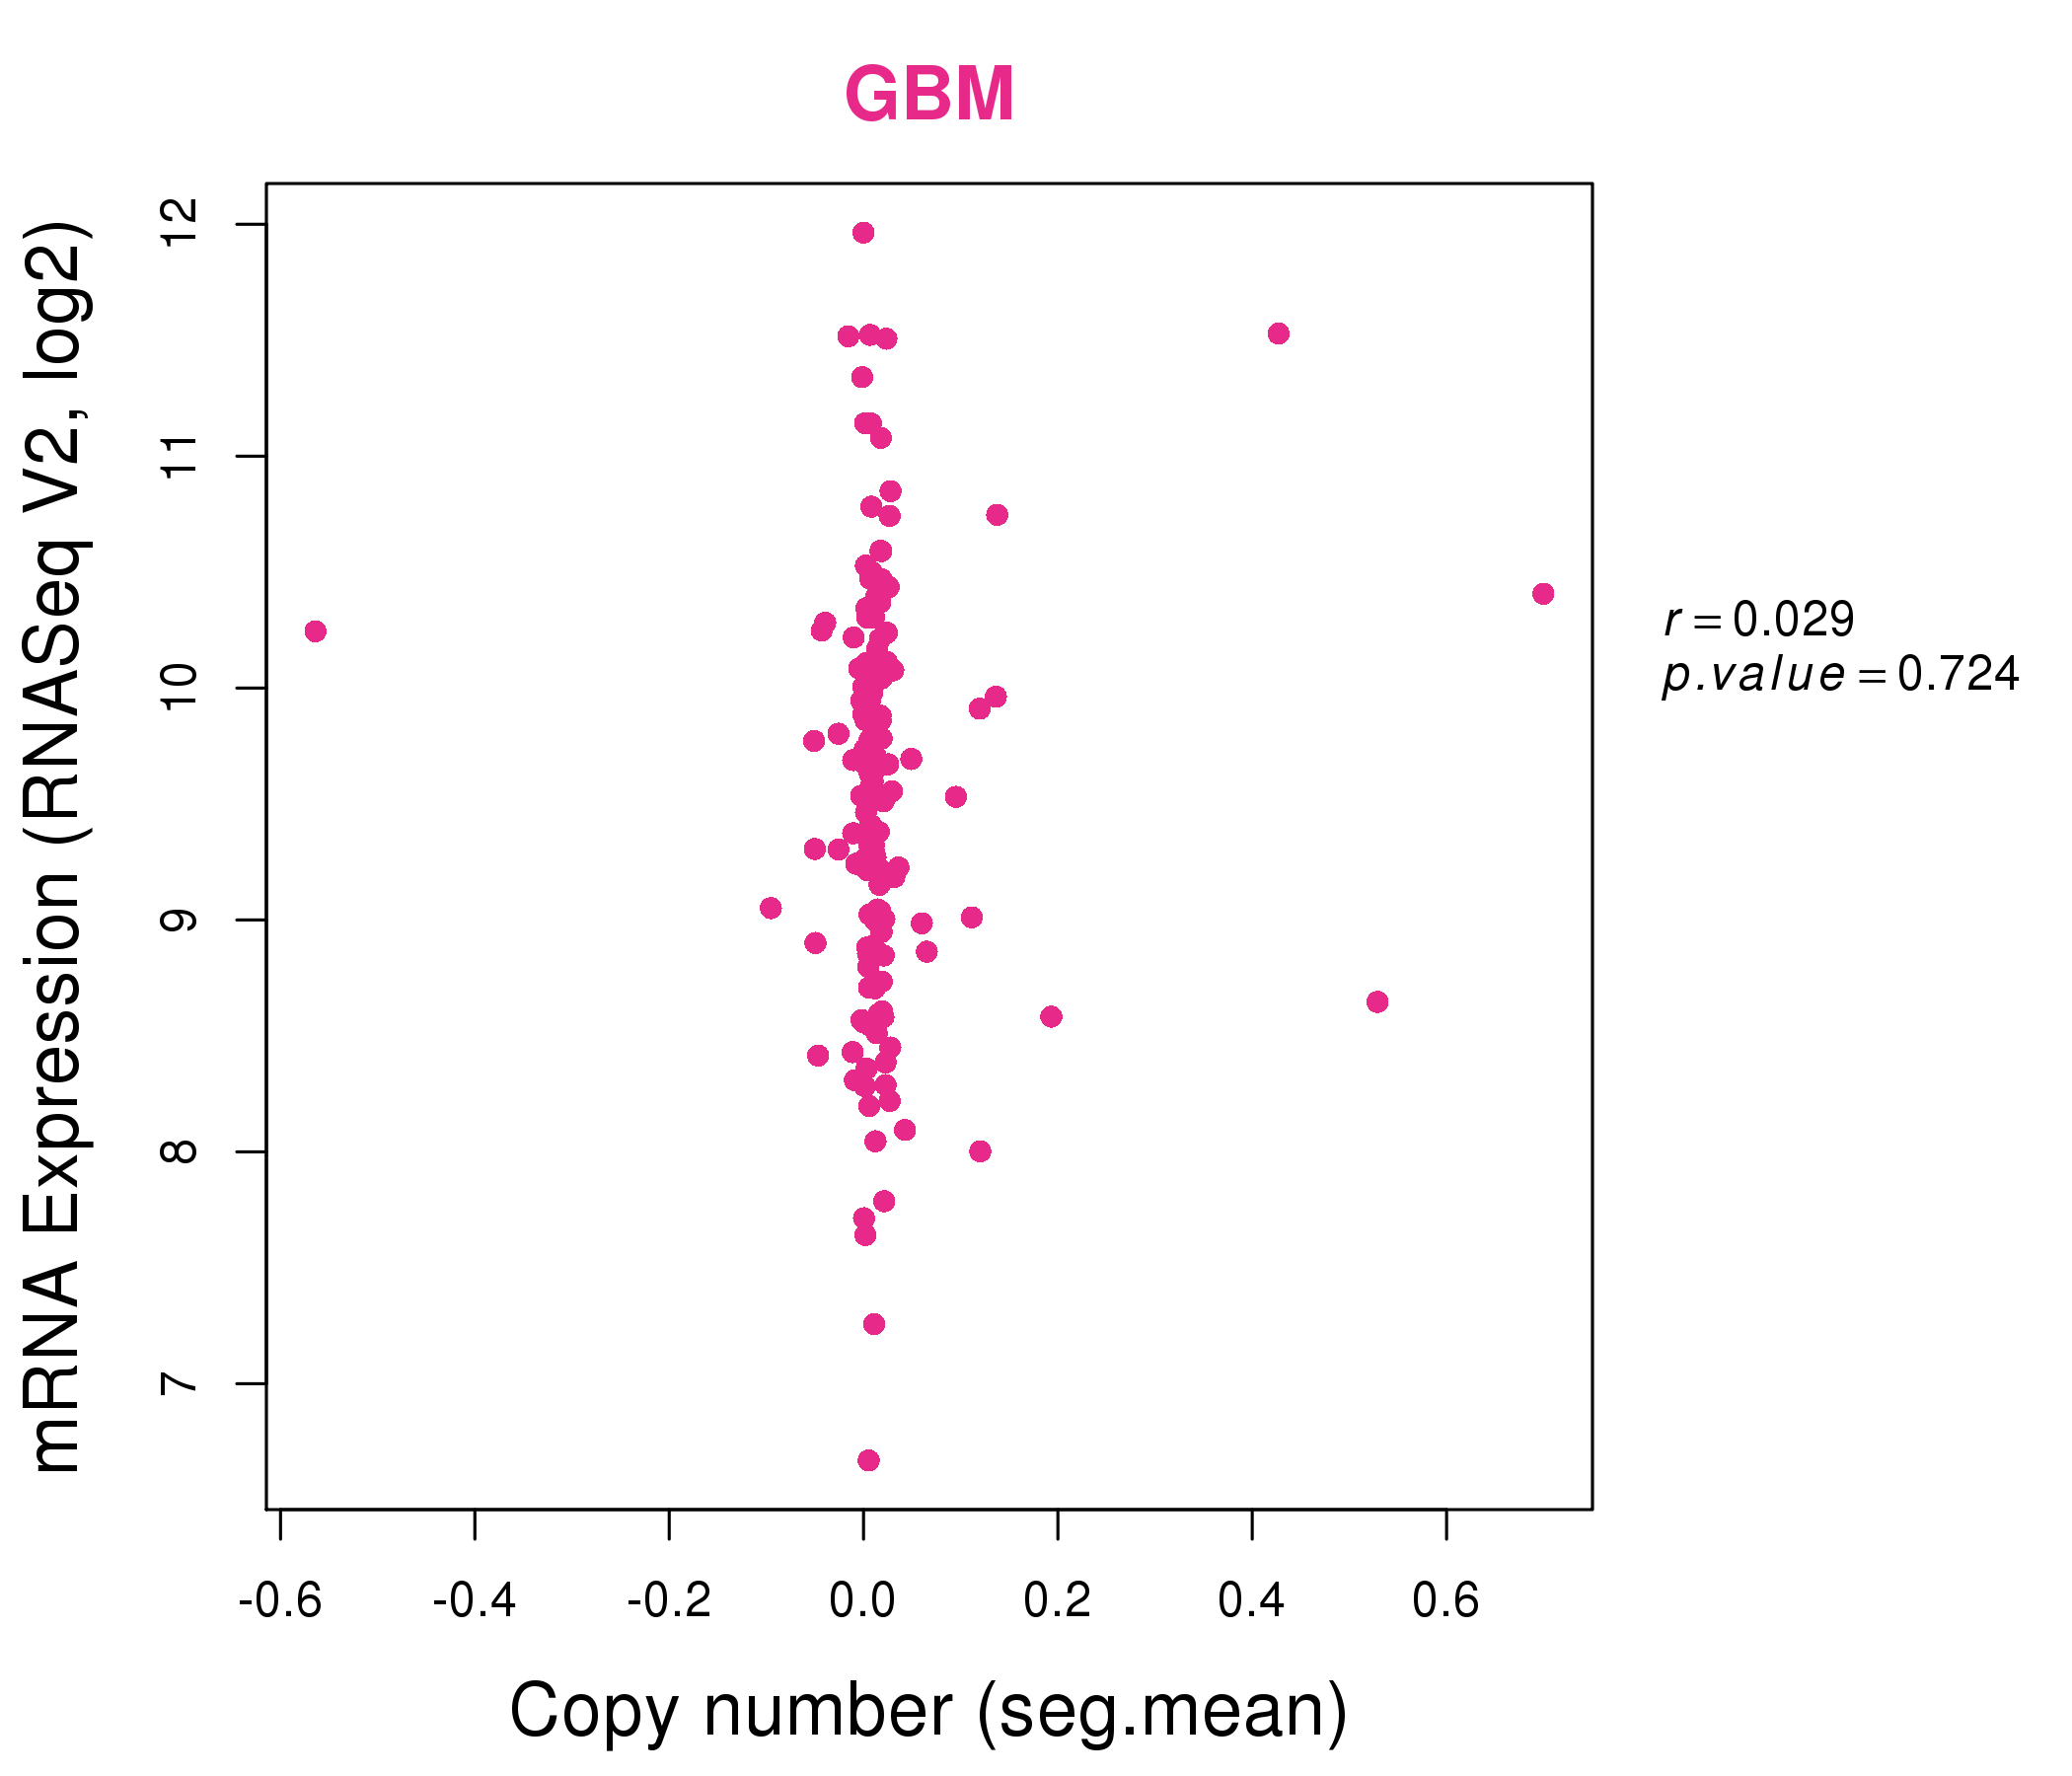
| * Normalized gene expression data of RNASeqV2 was extracted from TCGA using R package TCGA-Assembler. The URLs of all public data files on TCGA DCC data server were gathered at Jan-05-2015. Only eight cancer types have enough normal control samples for differential expression analysis. (t test, adjusted p<0.05 (using Benjamini-Hochberg FDR)) |
 |
| Top |
| * This plots show the correlation between CNV and gene expression. |
: Open all plots for all cancer types
 |
|
 |
|
| Top |
| Gene-Gene Network Information |
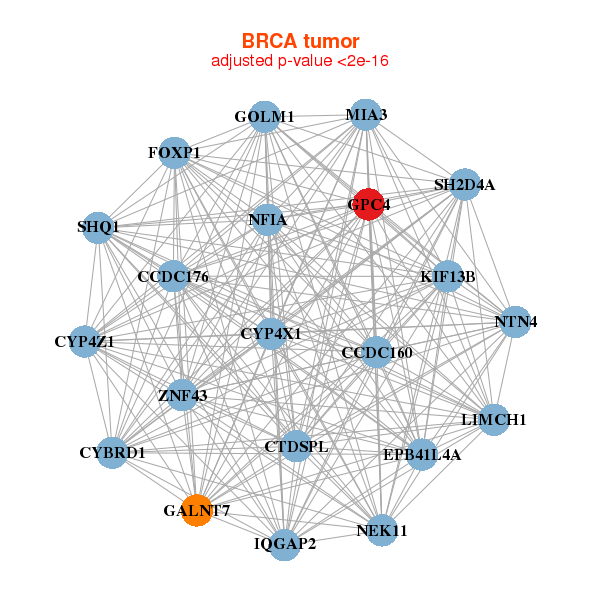
| * Co-Expression network figures were drawn using R package igraph. Only the top 20 genes with the highest correlations were shown. Red circle: input gene, orange circle: cell metabolism gene, sky circle: other gene |
: Open all plots for all cancer types
 |
|
| CCDC176,CCDC160,CTDSPL,CYBRD1,CYP4X1,CYP4Z1,EPB41L4A, FOXP1,GALNT7,GOLM1,GPC4,IQGAP2,KIF13B,LIMCH1, MIA3,NEK11,NFIA,NTN4,SH2D4A,SHQ1,ZNF43 | ACAT1,ADAMTSL4,PRADC1,EMX2,FXYD1,GPC4,HOXA10, HSPB2,LACTB,LOC653653,MN1,PARVB,PDE4A,PHYH, PLCL2,SDHC,SIX1,SIX2,SLC1A7,SNTA1,TTL |
 |
|
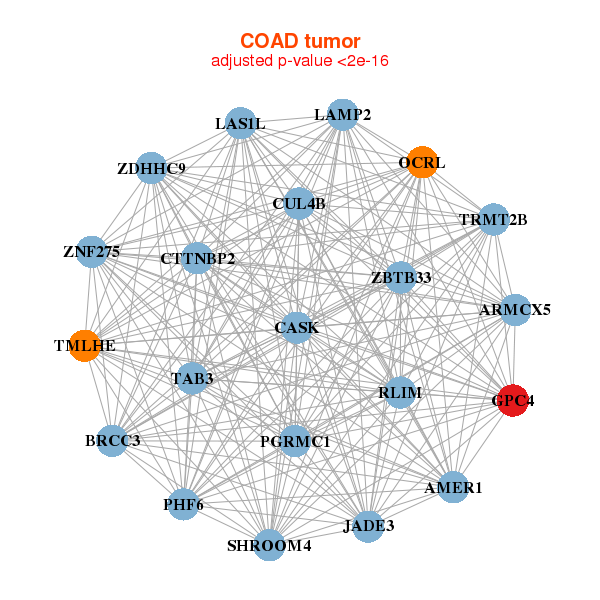
| ARMCX5,BRCC3,CASK,CTTNBP2,CUL4B,AMER1,GPC4, LAMP2,LAS1L,OCRL,PGRMC1,JADE3,PHF6,RLIM, SHROOM4,TAB3,TMLHE,TRMT2B,ZBTB33,ZDHHC9,ZNF275 | VSTM4,CLASP1,COL15A1,COL4A1,CRYBG3,DCHS1,DYSF, FBXL7,FRMD4A,GFRA1,GPC4,LAMA4,LAMC1,MAGEE1, NFIA,NID1,PCDHGB7,PTGFRN,RNF38,TAS1R1,UBQLN2 |


| * Co-Expression network figures were drawn using R package igraph. Only the top 20 genes with the highest correlations were shown. Red circle: input gene, orange circle: cell metabolism gene, sky circle: other gene |
: Open all plots for all cancer types
| Top |
: Open all interacting genes' information including KEGG pathway for all interacting genes from DAVID
| Top |
| Pharmacological Information for GPC4 |
| There's no related Drug. |
| Top |
| Cross referenced IDs for GPC4 |
| * We obtained these cross-references from Uniprot database. It covers 150 different DBs, 18 categories. http://www.uniprot.org/help/cross_references_section |
: Open all cross reference information
|
Copyright © 2016-Present - The Univsersity of Texas Health Science Center at Houston @ |