|
|||||||||||||||||||||||||||||||||||||||||||||||||||||||||||||||||||||||||||||||||||||||||||||||||||||||||||||||||||||||||||||||||||||||||||||||||||||||||||||||||||||||||||||||||||||||||||||||||||||||||||||||||||||||||||||||||||||||||||||||||||||||||||||||||||||||||||||||||||||||||||||||||||||||||||||||||||||||||||||||||||||||||||||
| |
| Phenotypic Information (metabolism pathway, cancer, disease, phenome) |
| |
| |
| Gene-Gene Network Information: Co-Expression Network, Interacting Genes & KEGG |
| |
|


| Gene Summary for ALDH3A2 |
| Top |
| Phenotypic Information for ALDH3A2(metabolism pathway, cancer, disease, phenome) |
| Cancer | CGAP: ALDH3A2 |
| Familial Cancer Database: ALDH3A2 | |
| * This gene is included in those cancer gene databases. |
|
|
|
|
|
|
| |||||||||||||||||||||||||||||||||||||||||||||||||||||||||||||||||||||||||||||||||||||||||||||||||||||||||||||||||||||||||||||||||||||||||||||||||||||||||||||||||||||||||||||||||||||||||||||||||||||||||||||||||||||||||||||||||||||||||||||||||||||||||||||||||||||||||||||||||||||||||||||||||||||||||||||||||||||||||||||||||||||||
Oncogene 1 | Significant driver gene in | ||||||||||||||||||||||||||||||||||||||||||||||||||||||||||||||||||||||||||||||||||||||||||||||||||||||||||||||||||||||||||||||||||||||||||||||||||||||||||||||||||||||||||||||||||||||||||||||||||||||||||||||||||||||||||||||||||||||||||||||||||||||||||||||||||||||||||||||||||||||||||||||||||||||||||||||||||||||||||||||||||||||||||||
| cf) number; DB name 1 Oncogene; http://nar.oxfordjournals.org/content/35/suppl_1/D721.long, 2 Tumor Suppressor gene; https://bioinfo.uth.edu/TSGene/, 3 Cancer Gene Census; http://www.nature.com/nrc/journal/v4/n3/abs/nrc1299.html, 4 CancerGenes; http://nar.oxfordjournals.org/content/35/suppl_1/D721.long, 5 Network of Cancer Gene; http://ncg.kcl.ac.uk/index.php, 1Therapeutic Vulnerabilities in Cancer; http://cbio.mskcc.org/cancergenomics/statius/ |
| KEGG_GLYCOLYSIS_GLUCONEOGENESIS KEGG_ASCORBATE_AND_ALDARATE_METABOLISM KEGG_FATTY_ACID_METABOLISM KEGG_ARGININE_AND_PROLINE_METABOLISM KEGG_HISTIDINE_METABOLISM KEGG_TRYPTOPHAN_METABOLISM KEGG_BETA_ALANINE_METABOLISM KEGG_GLYCEROLIPID_METABOLISM KEGG_PYRUVATE_METABOLISM KEGG_PROPANOATE_METABOLISM KEGG_BUTANOATE_METABOLISM | |
| Mutations for ALDH3A2 |
| * Under tables are showing count per each tissue to give us broad intuition about tissue specific mutation patterns.You can go to the detailed page for each mutation database's web site. |
| - Statistics for Tissue and Mutation type | Top |
 |
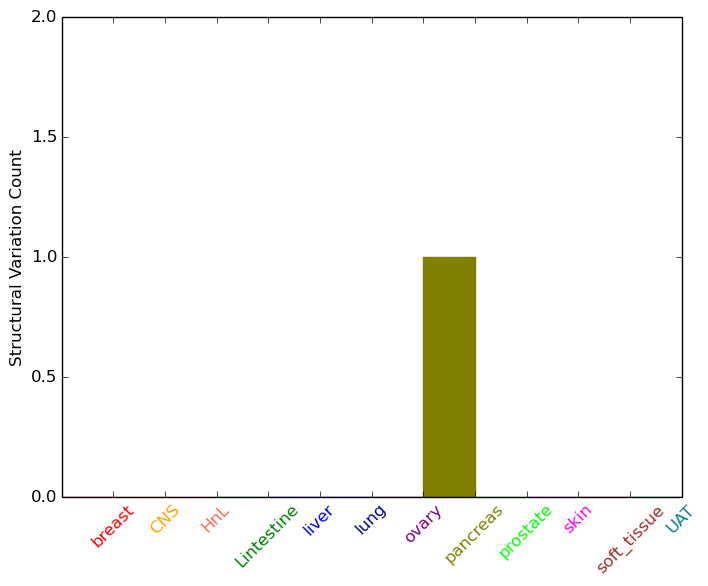
| - For Inter-chromosomal Variations |
| * Inter-chromosomal variantions includes 'interchromosomal amplicon to amplicon', 'interchromosomal amplicon to non-amplified dna', 'interchromosomal insertion', 'Interchromosomal unknown type'. |
 |
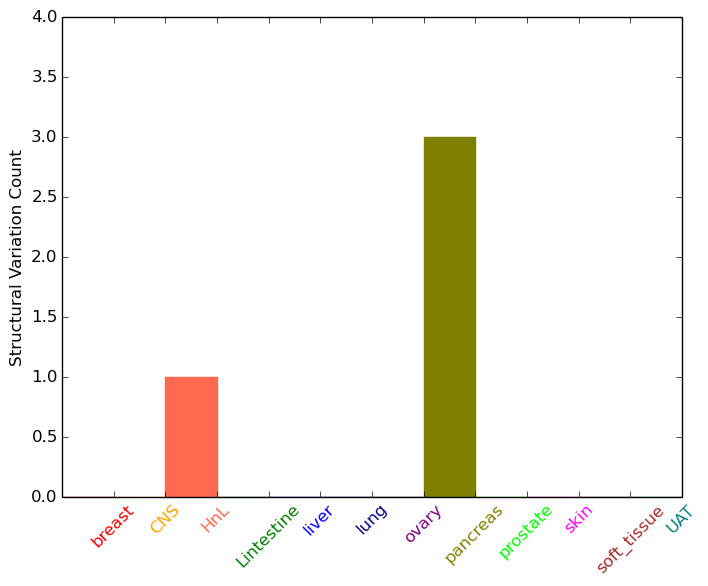
| - For Intra-chromosomal Variations |
| * Intra-chromosomal variantions includes 'intrachromosomal amplicon to amplicon', 'intrachromosomal amplicon to non-amplified dna', 'intrachromosomal deletion', 'intrachromosomal fold-back inversion', 'intrachromosomal inversion', 'intrachromosomal tandem duplication', 'Intrachromosomal unknown type', 'intrachromosomal with inverted orientation', 'intrachromosomal with non-inverted orientation'. |
 |
| Sample | Symbol_a | Chr_a | Start_a | End_a | Symbol_b | Chr_b | Start_b | End_b |
| haematopoietic_and_lymphoid_tissue | ALDH3A2 | chr17 | 19562503 | 19562503 | ALDH3A2 | chr17 | 19562503 | 19562503 |
| pancreas | ALDH3A2 | chr17 | 19574460 | 19574480 | MYO1D | chr17 | 30849010 | 30849030 |
| pancreas | ALDH3A2 | chr17 | 19577237 | 19577257 | B9D1 | chr17 | 19271497 | 19271517 |
| cf) Tissue number; Tissue name (1;Breast, 2;Central_nervous_system, 3;Haematopoietic_and_lymphoid_tissue, 4;Large_intestine, 5;Liver, 6;Lung, 7;Ovary, 8;Pancreas, 9;Prostate, 10;Skin, 11;Soft_tissue, 12;Upper_aerodigestive_tract) |
| * From mRNA Sanger sequences, Chitars2.0 arranged chimeric transcripts. This table shows ALDH3A2 related fusion information. |
| ID | Head Gene | Tail Gene | Accession | Gene_a | qStart_a | qEnd_a | Chromosome_a | tStart_a | tEnd_a | Gene_a | qStart_a | qEnd_a | Chromosome_a | tStart_a | tEnd_a |
| BF854270 | NEAT1 | 8 | 253 | 11 | 65194439 | 65194684 | ALDH3A2 | 245 | 444 | 17 | 19566989 | 19567188 | |
| BF845221 | ALDH3A2 | 14 | 299 | 17 | 19558741 | 19559029 | SMC1A | 296 | 578 | X | 53438739 | 53439114 | |
| AV652827 | ALDH3A2 | 1 | 534 | 17 | 19569307 | 19569840 | LOC646214 | 530 | 727 | 15 | 21933563 | 21933818 | |
| AI769187 | ATP1B2 | 1 | 112 | 17 | 7560293 | 7560404 | ALDH3A2 | 108 | 276 | 17 | 19552135 | 19552303 | |
| Top |
| Mutation type/ Tissue ID | brca | cns | cerv | endome | haematopo | kidn | Lintest | liver | lung | ns | ovary | pancre | prost | skin | stoma | thyro | urina | |||
| Total # sample | 1 | 1 | 1 | |||||||||||||||||
| GAIN (# sample) | 1 | 1 | 1 | |||||||||||||||||
| LOSS (# sample) |
| cf) Tissue ID; Tissue type (1; Breast, 2; Central_nervous_system, 3; Cervix, 4; Endometrium, 5; Haematopoietic_and_lymphoid_tissue, 6; Kidney, 7; Large_intestine, 8; Liver, 9; Lung, 10; NS, 11; Ovary, 12; Pancreas, 13; Prostate, 14; Skin, 15; Stomach, 16; Thyroid, 17; Urinary_tract) |
| Top |
|
 |
| Top |
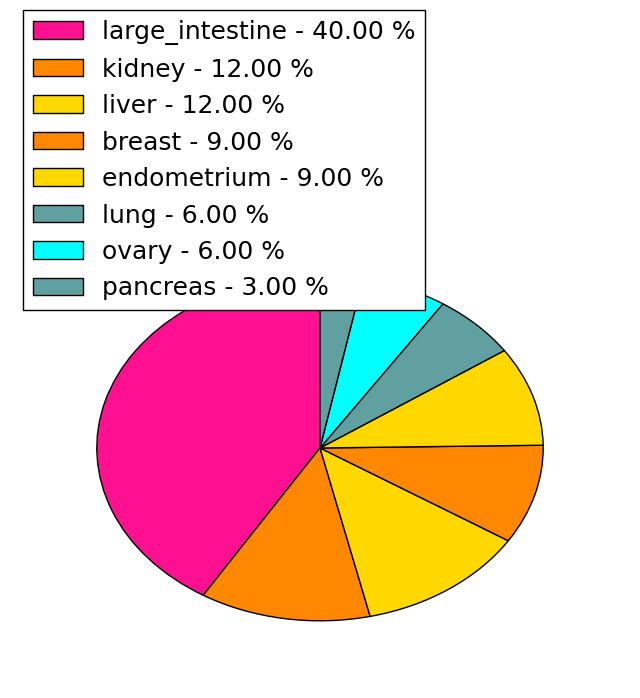
| Stat. for Non-Synonymous SNVs (# total SNVs=32) | (# total SNVs=12) |
 | 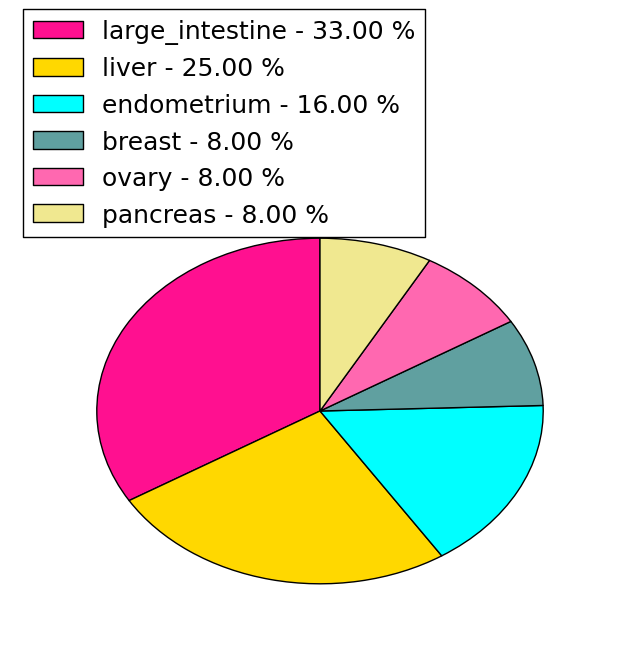 |
(# total SNVs=1) | (# total SNVs=1) |
 |  |
| Top |
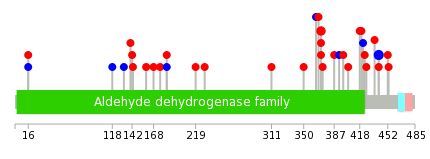
| * When you move the cursor on each content, you can see more deailed mutation information on the Tooltip. Those are primary_site,primary_histology,mutation(aa),pubmedID. |
| GRCh37 position | Mutation(aa) | Unique sampleID count |
| chr17:19568332-19568332 | p.T393T | 3 |
| chr17:19575149-19575149 | p.P441P | 3 |
| chr17:19568265-19568265 | p.I371T | 2 |
| chr17:19564539-19564539 | p.I300L | 2 |
| chr17:19564573-19564573 | p.R311H | 2 |
| chr17:19559759-19559759 | p.T184T | 2 |
| chr17:19559761-19559761 | p.G185V | 2 |
| chr17:19555901-19555901 | p.T143fs*13 | 2 |
| chr17:19568264-19568264 | p.I371V | 2 |
| chr17:19575075-19575075 | p.D417H | 2 |
| Top |
|
 |
| Point Mutation/ Tissue ID | 1 | 2 | 3 | 4 | 5 | 6 | 7 | 8 | 9 | 10 | 11 | 12 | 13 | 14 | 15 | 16 | 17 | 18 | 19 | 20 |
| # sample | 13 | 1 | 2 | 2 | 4 | 3 | 1 | 2 | 5 | 4 | ||||||||||
| # mutation | 11 | 1 | 2 | 2 | 4 | 3 | 1 | 2 | 5 | 5 | ||||||||||
| nonsynonymous SNV | 9 | 2 | 2 | 3 | 2 | 2 | 5 | 3 | ||||||||||||
| synonymous SNV | 2 | 1 | 1 | 1 | 1 | 2 |
| cf) Tissue ID; Tissue type (1; BLCA[Bladder Urothelial Carcinoma], 2; BRCA[Breast invasive carcinoma], 3; CESC[Cervical squamous cell carcinoma and endocervical adenocarcinoma], 4; COAD[Colon adenocarcinoma], 5; GBM[Glioblastoma multiforme], 6; Glioma Low Grade, 7; HNSC[Head and Neck squamous cell carcinoma], 8; KICH[Kidney Chromophobe], 9; KIRC[Kidney renal clear cell carcinoma], 10; KIRP[Kidney renal papillary cell carcinoma], 11; LAML[Acute Myeloid Leukemia], 12; LUAD[Lung adenocarcinoma], 13; LUSC[Lung squamous cell carcinoma], 14; OV[Ovarian serous cystadenocarcinoma ], 15; PAAD[Pancreatic adenocarcinoma], 16; PRAD[Prostate adenocarcinoma], 17; SKCM[Skin Cutaneous Melanoma], 18:STAD[Stomach adenocarcinoma], 19:THCA[Thyroid carcinoma], 20:UCEC[Uterine Corpus Endometrial Carcinoma]) |
| Top |
| * We represented just top 10 SNVs. When you move the cursor on each content, you can see more deailed mutation information on the Tooltip. Those are primary_site, primary_histology, mutation(aa), pubmedID. |
| Genomic Position | Mutation(aa) | Unique sampleID count |
| chr17:19575149 | p.P441P,ALDH3A2 | 3 |
| chr17:19568264 | p.I371V,ALDH3A2 | 2 |
| chr17:19568265 | p.I371T,ALDH3A2 | 2 |
| chr17:19555060 | p.R16R,ALDH3A2 | 1 |
| chr17:19575183 | p.H368R,ALDH3A2 | 1 |
| chr17:19561065 | p.K452N,ALDH3A2 | 1 |
| chr17:19575037 | p.T118T,ALDH3A2 | 1 |
| chr17:19555870 | p.F453I,ALDH3A2 | 1 |
| chr17:19564573 | p.V132V,ALDH3A2 | 1 |
| chr17:19575079 | p.S140C,ALDH3A2 | 1 |
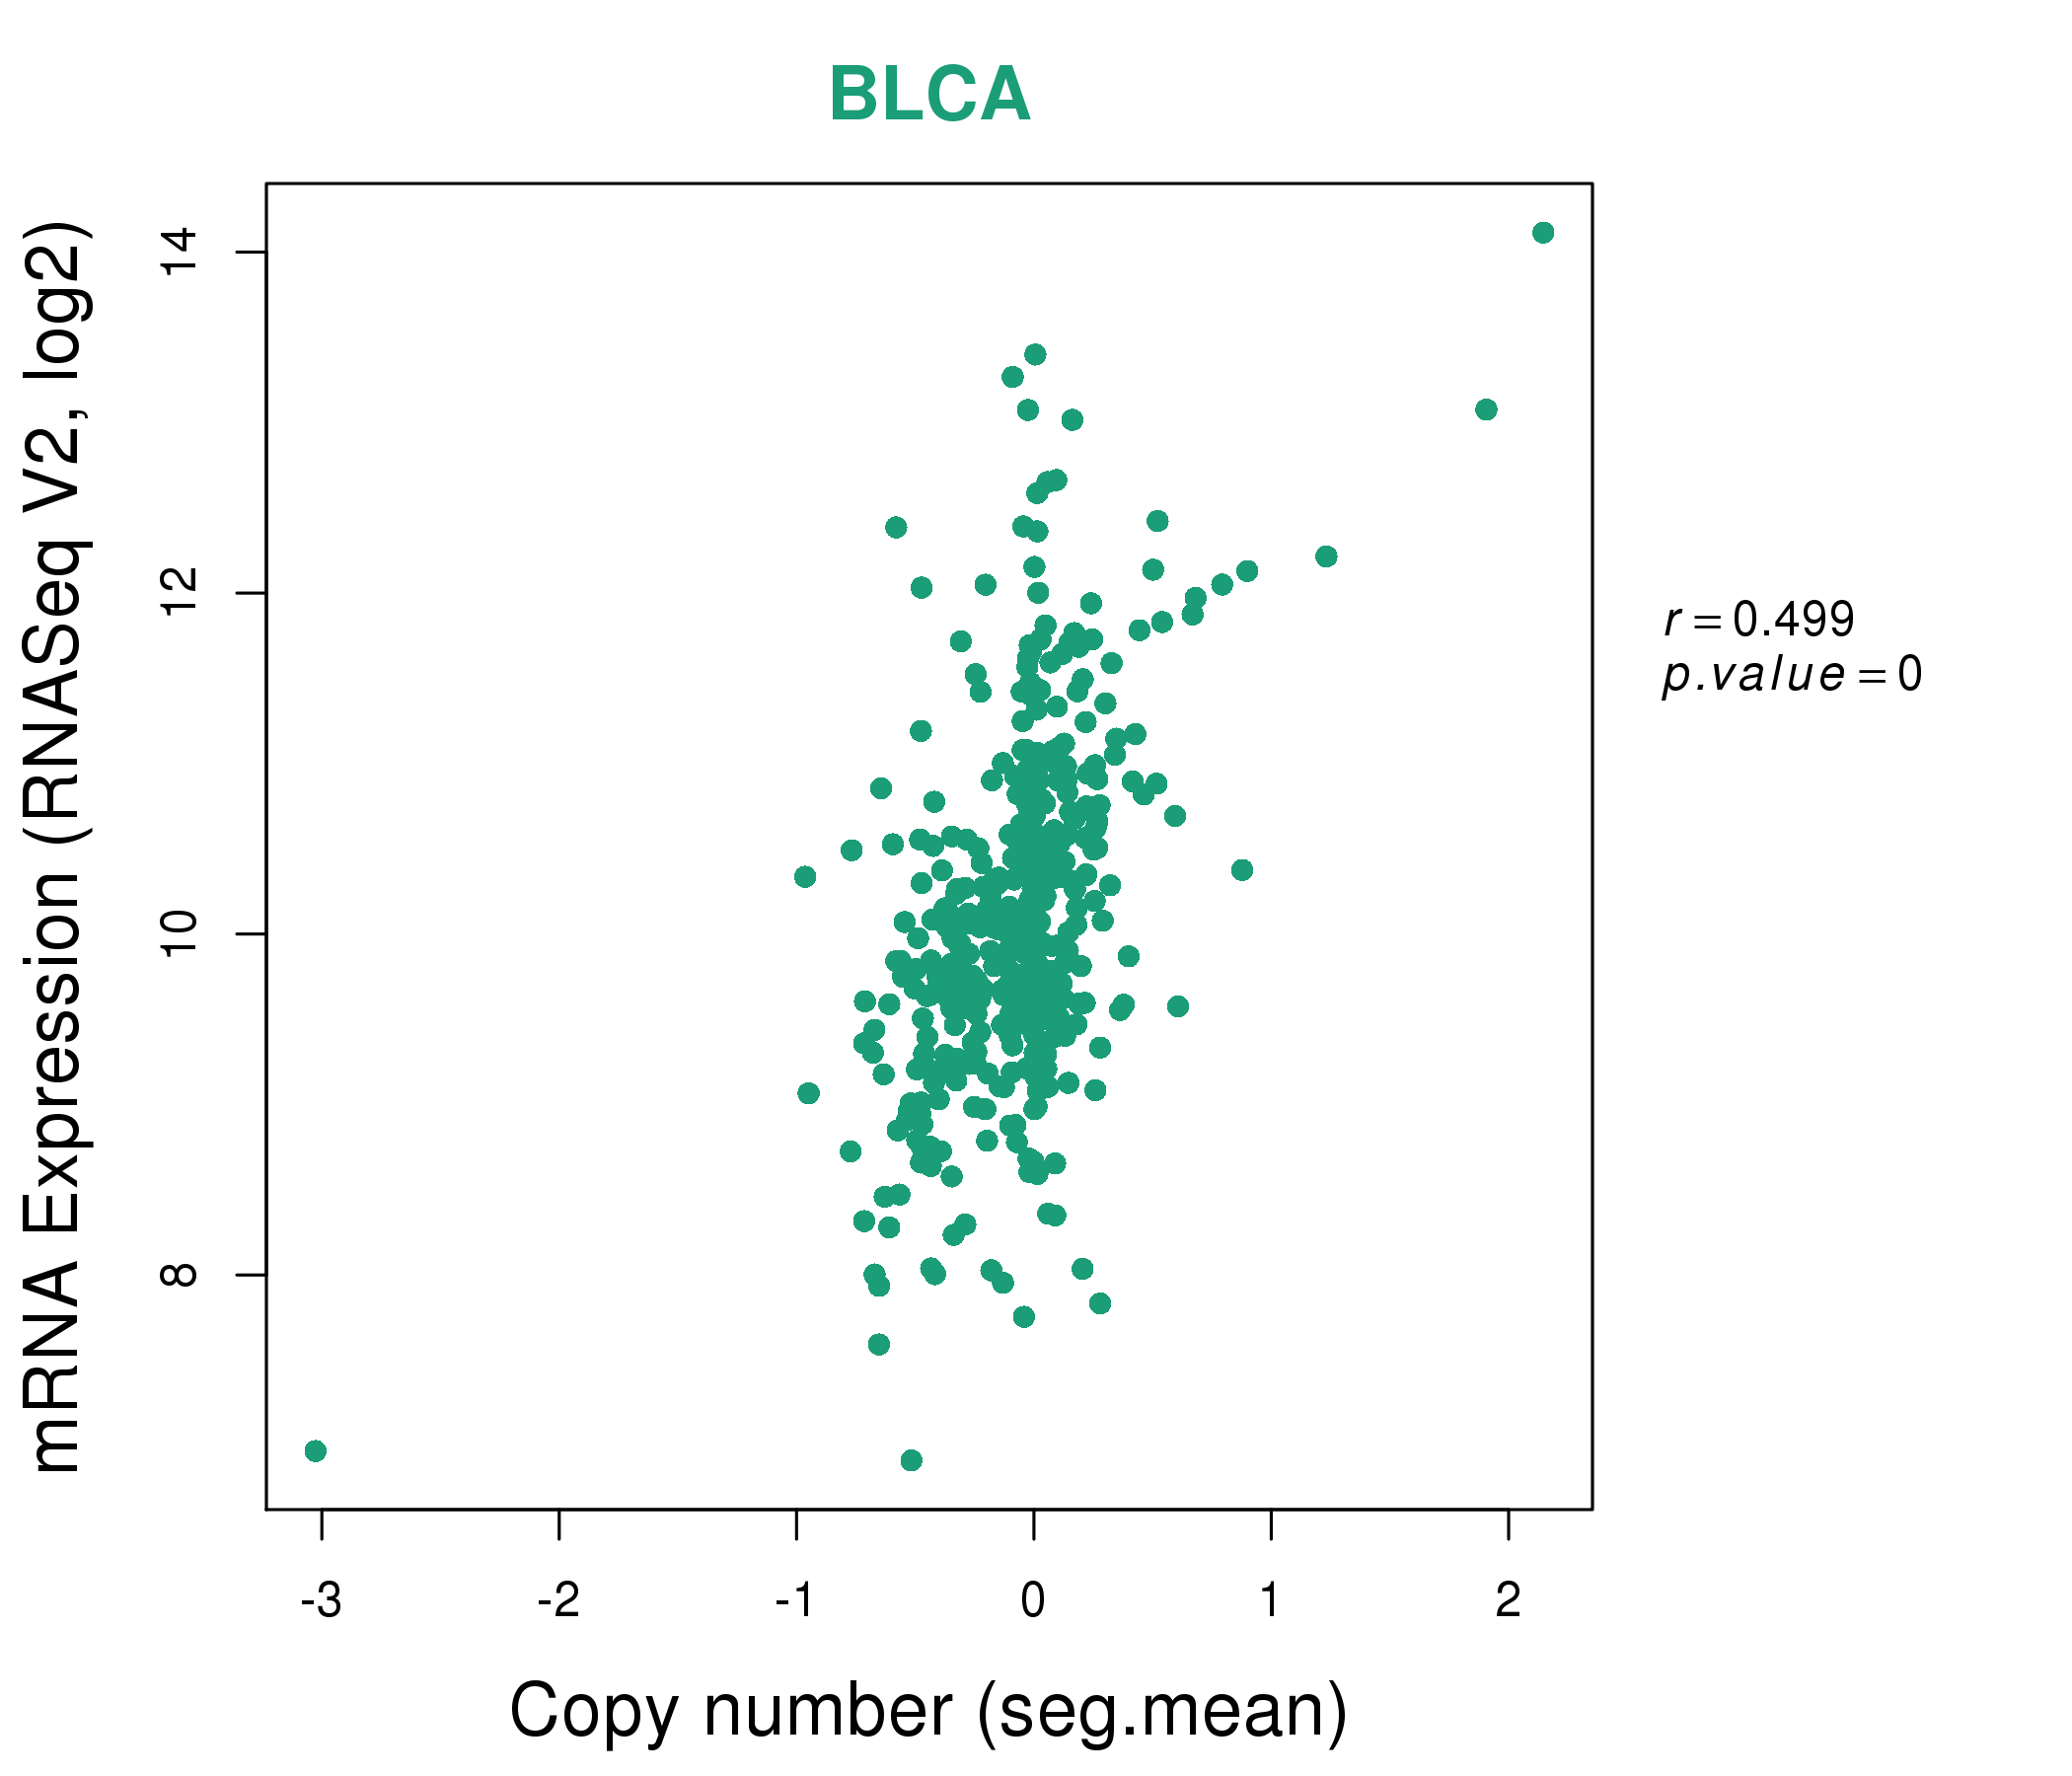
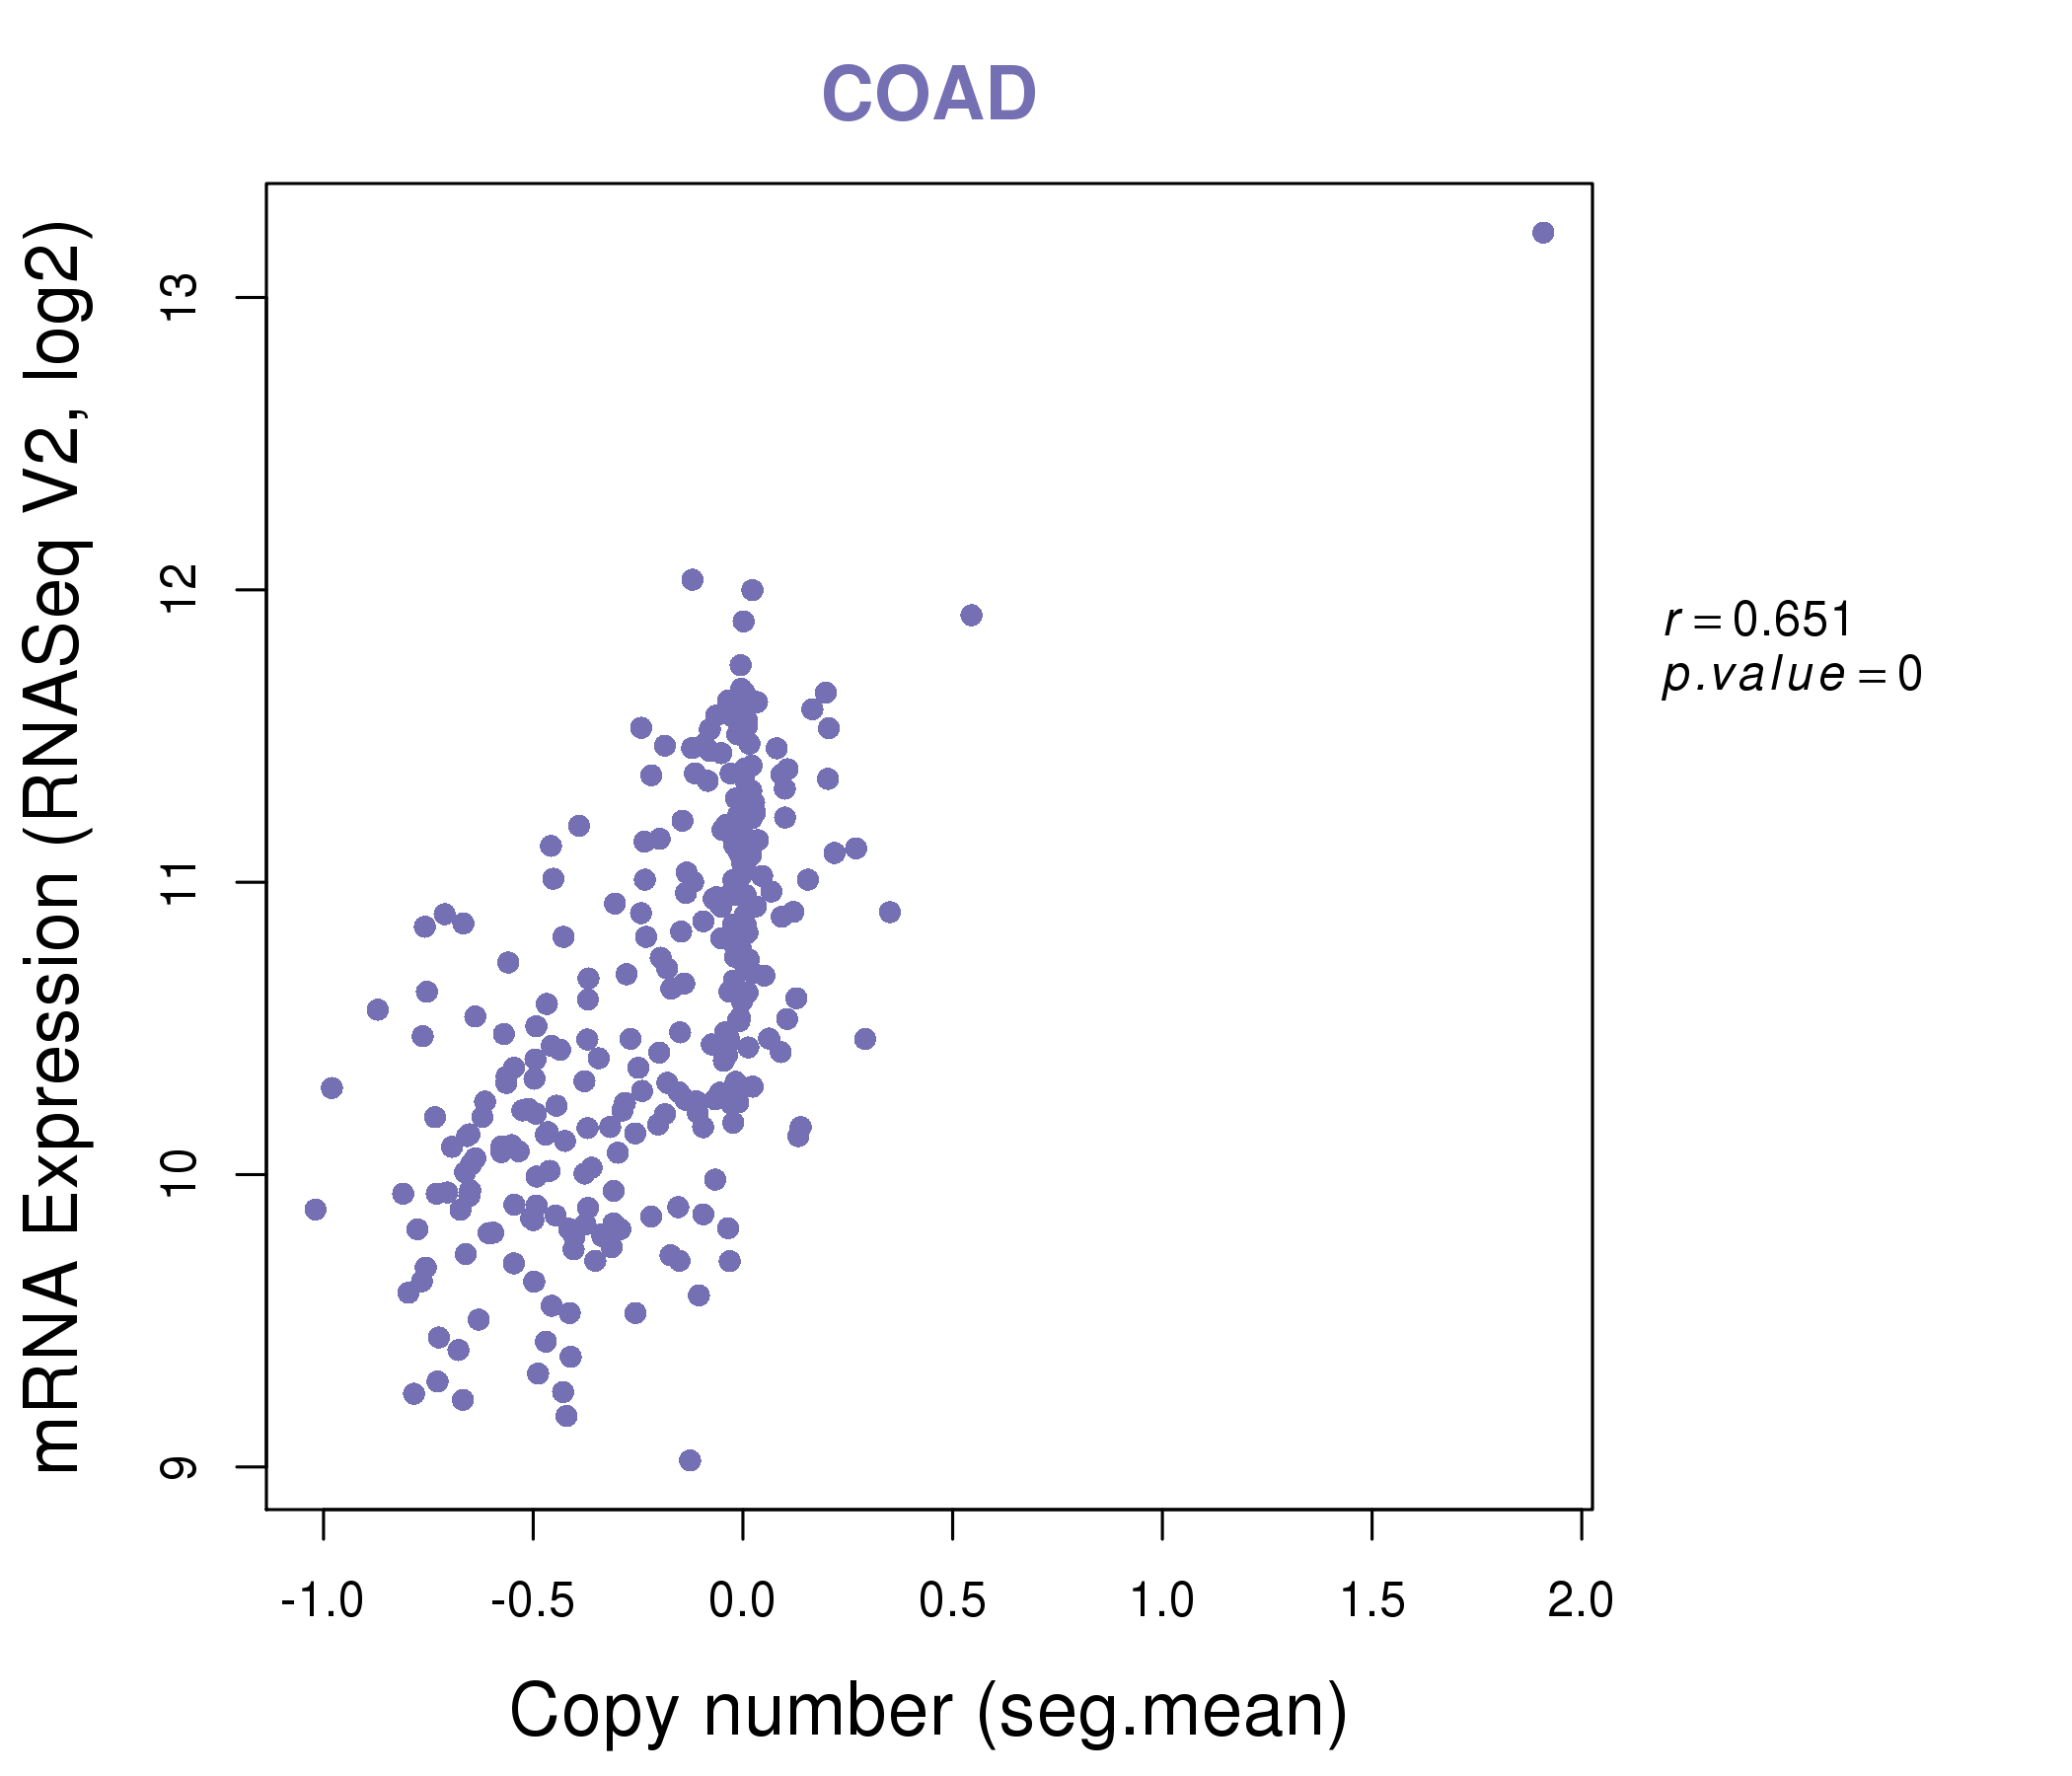
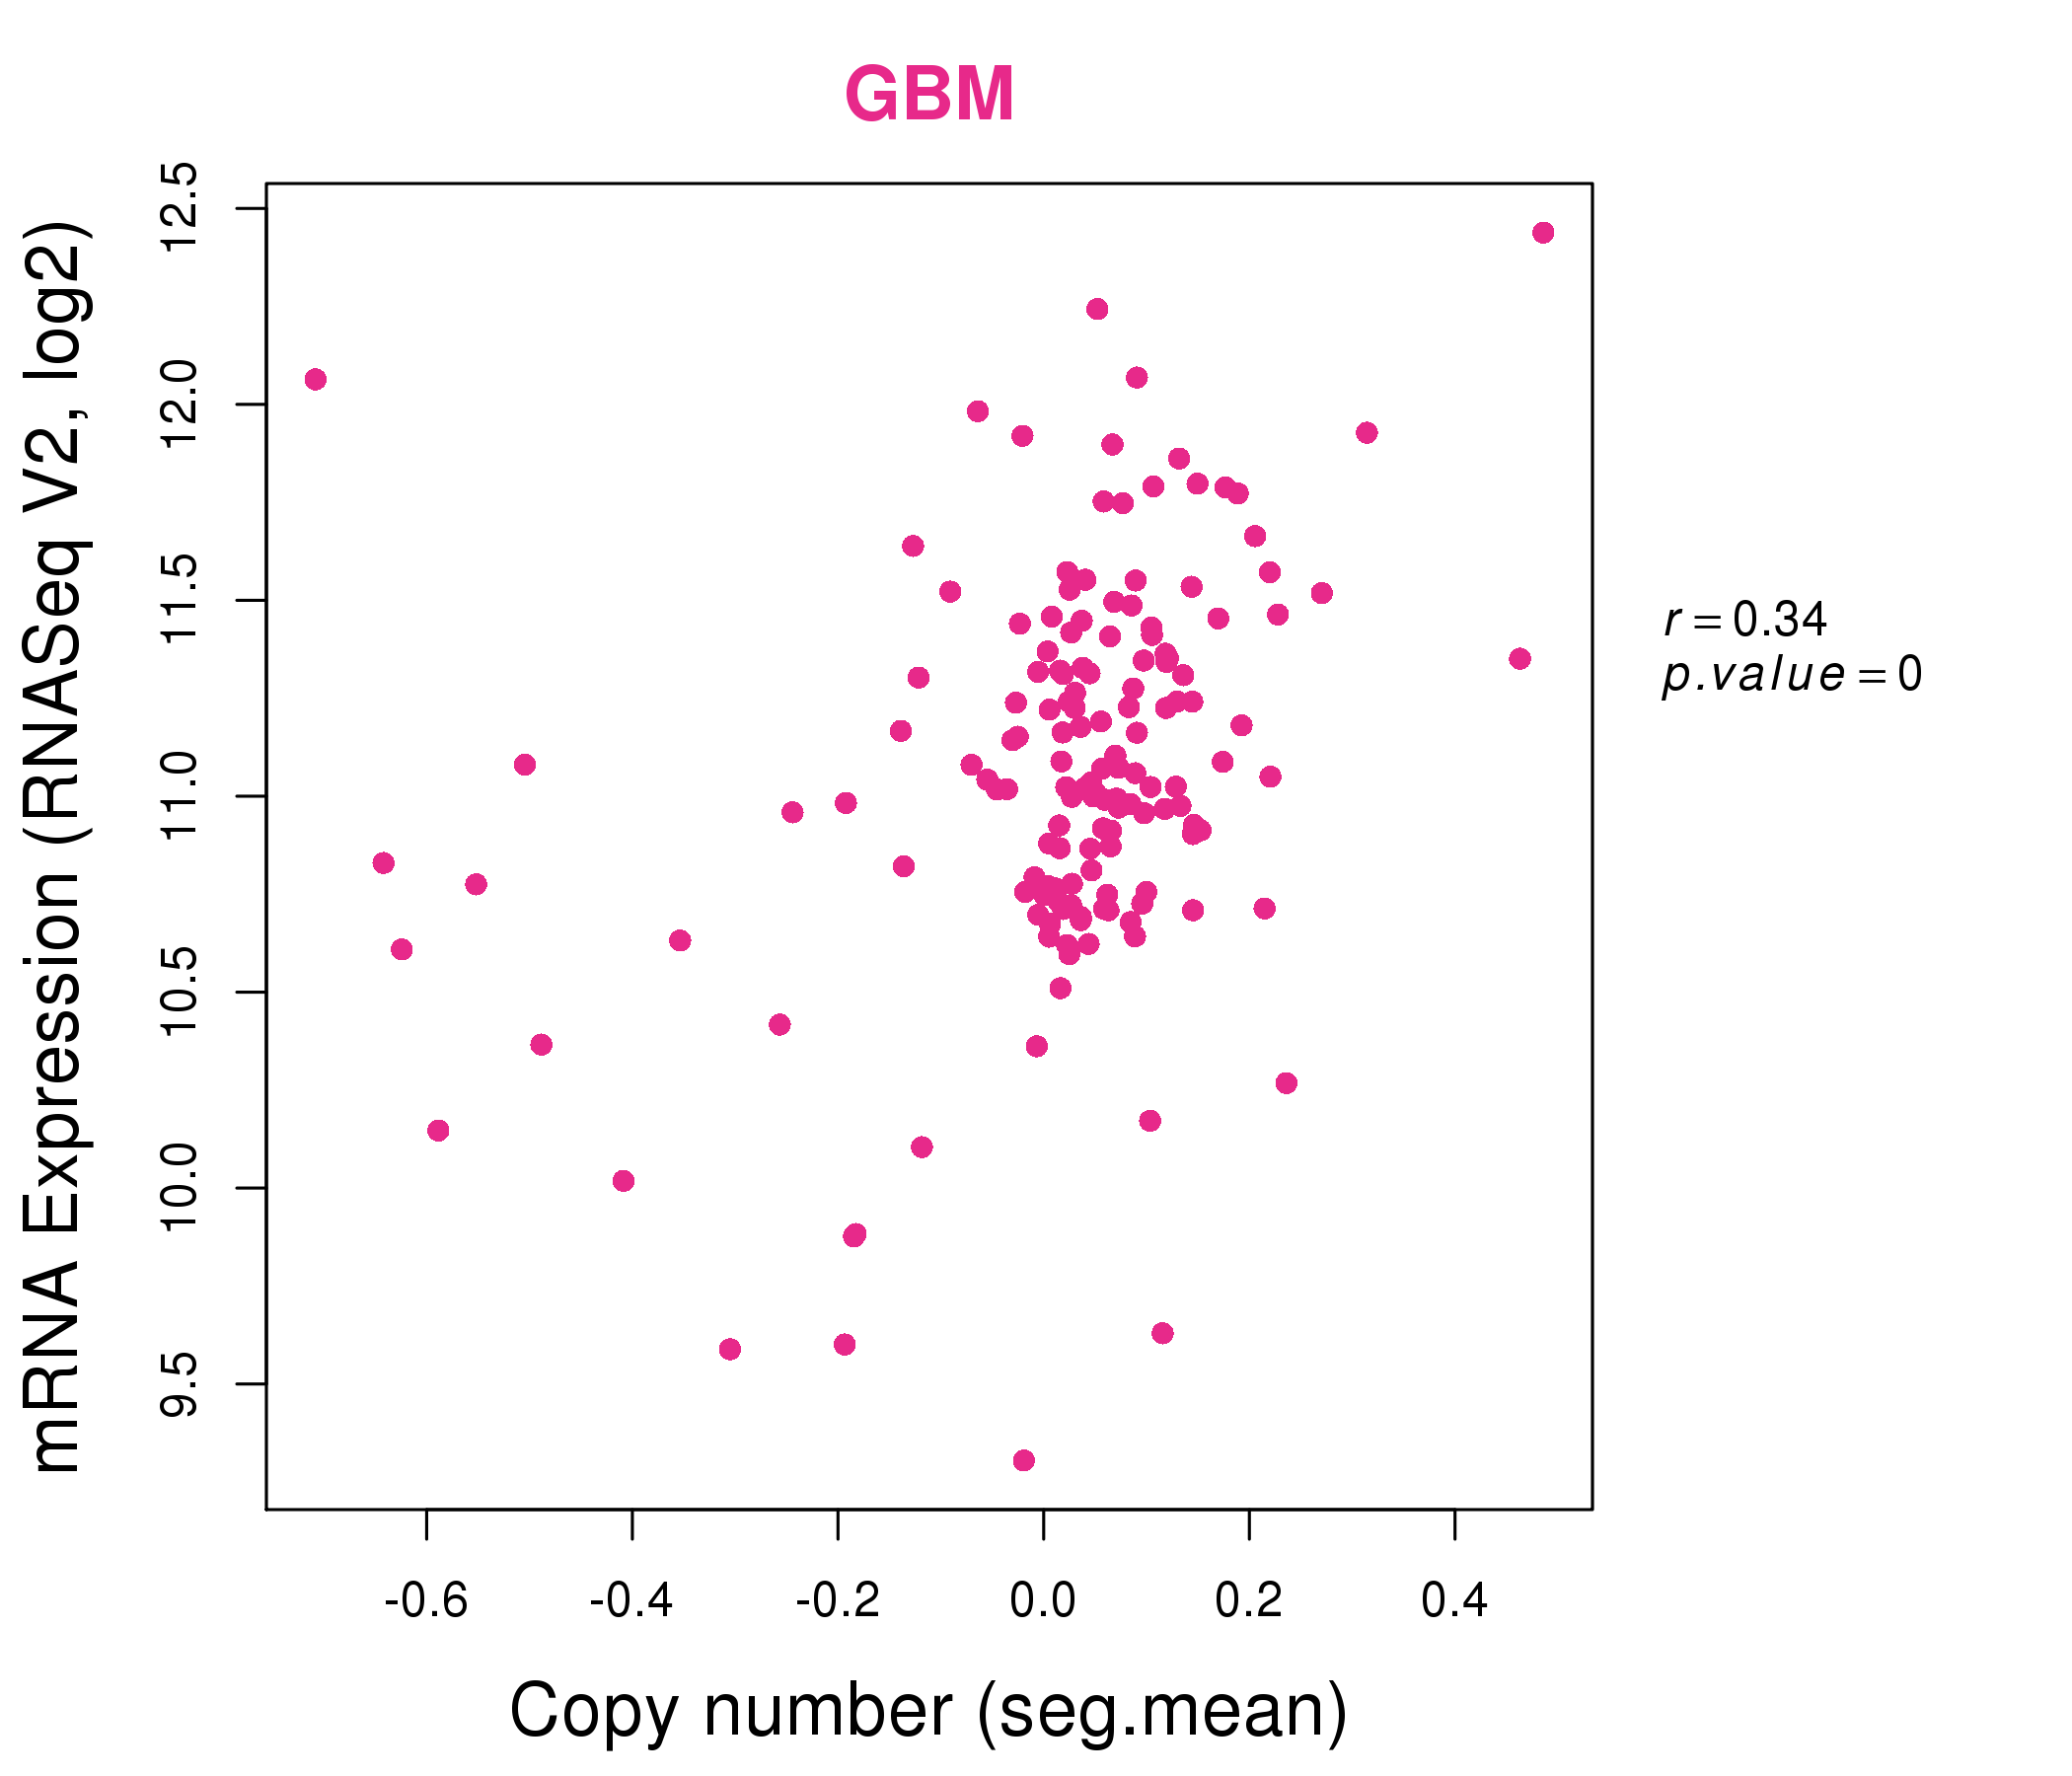
| * Copy number data were extracted from TCGA using R package TCGA-Assembler. The URLs of all public data files on TCGA DCC data server were gathered on Jan-05-2015. Function ProcessCNAData in TCGA-Assembler package was used to obtain gene-level copy number value which is calculated as the average copy number of the genomic region of a gene. |
 |
| cf) Tissue ID[Tissue type]: BLCA[Bladder Urothelial Carcinoma], BRCA[Breast invasive carcinoma], CESC[Cervical squamous cell carcinoma and endocervical adenocarcinoma], COAD[Colon adenocarcinoma], GBM[Glioblastoma multiforme], Glioma Low Grade, HNSC[Head and Neck squamous cell carcinoma], KICH[Kidney Chromophobe], KIRC[Kidney renal clear cell carcinoma], KIRP[Kidney renal papillary cell carcinoma], LAML[Acute Myeloid Leukemia], LUAD[Lung adenocarcinoma], LUSC[Lung squamous cell carcinoma], OV[Ovarian serous cystadenocarcinoma ], PAAD[Pancreatic adenocarcinoma], PRAD[Prostate adenocarcinoma], SKCM[Skin Cutaneous Melanoma], STAD[Stomach adenocarcinoma], THCA[Thyroid carcinoma], UCEC[Uterine Corpus Endometrial Carcinoma] |
| Top |
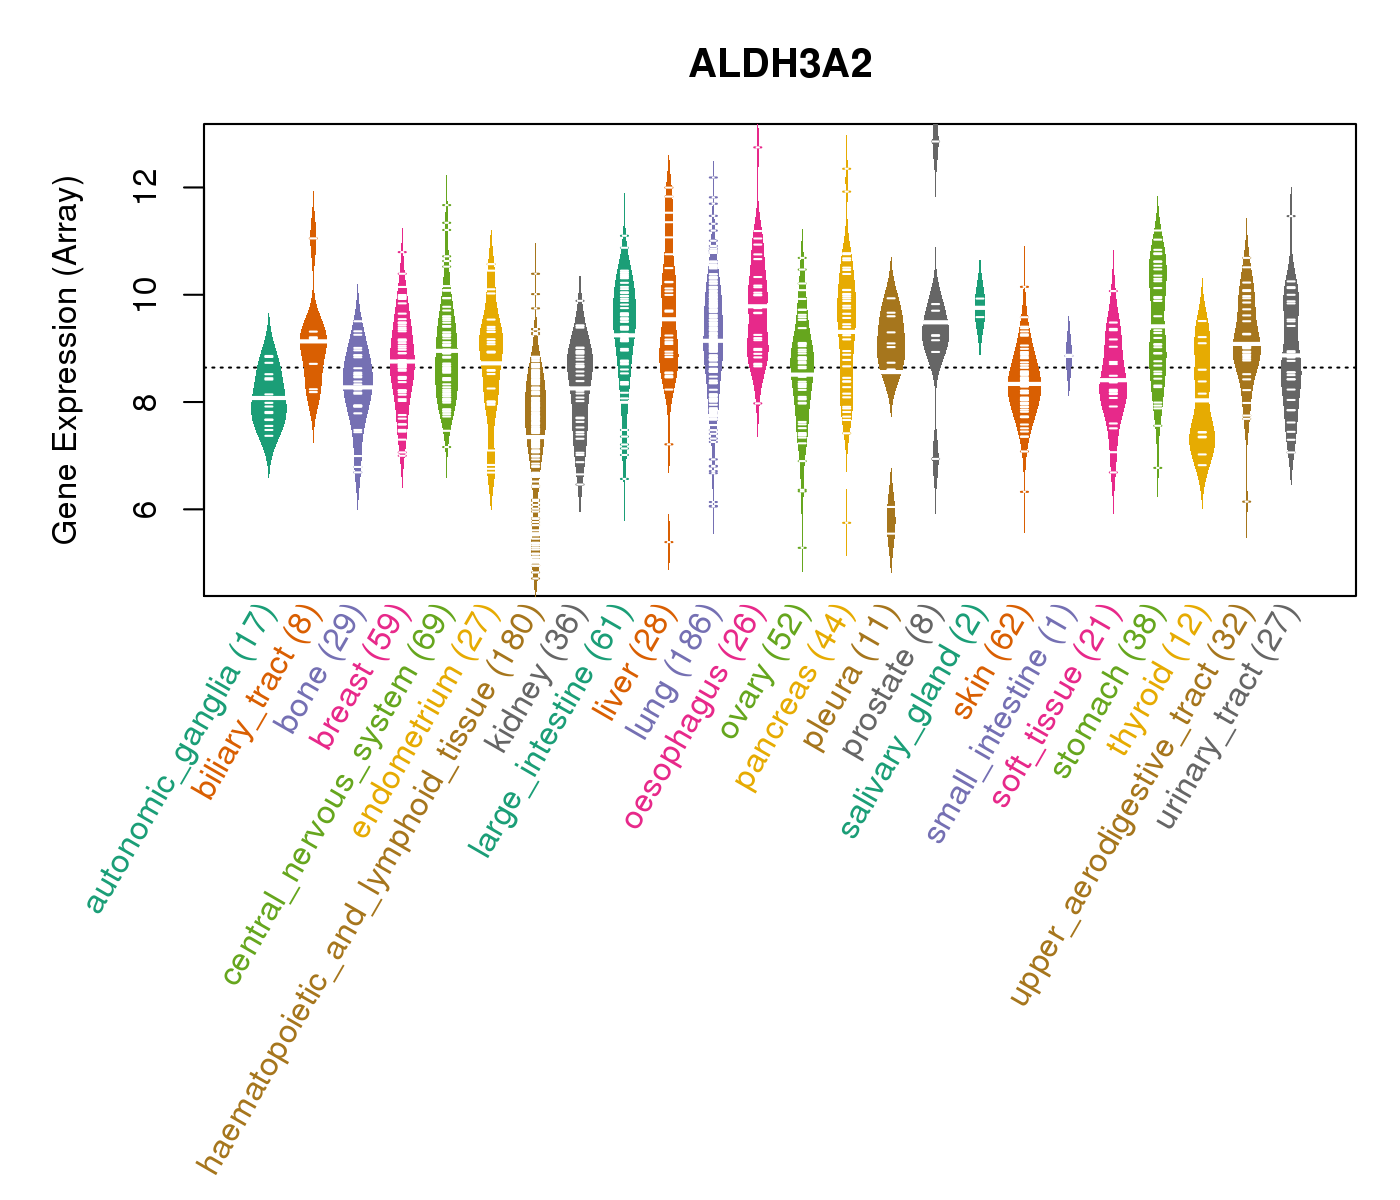
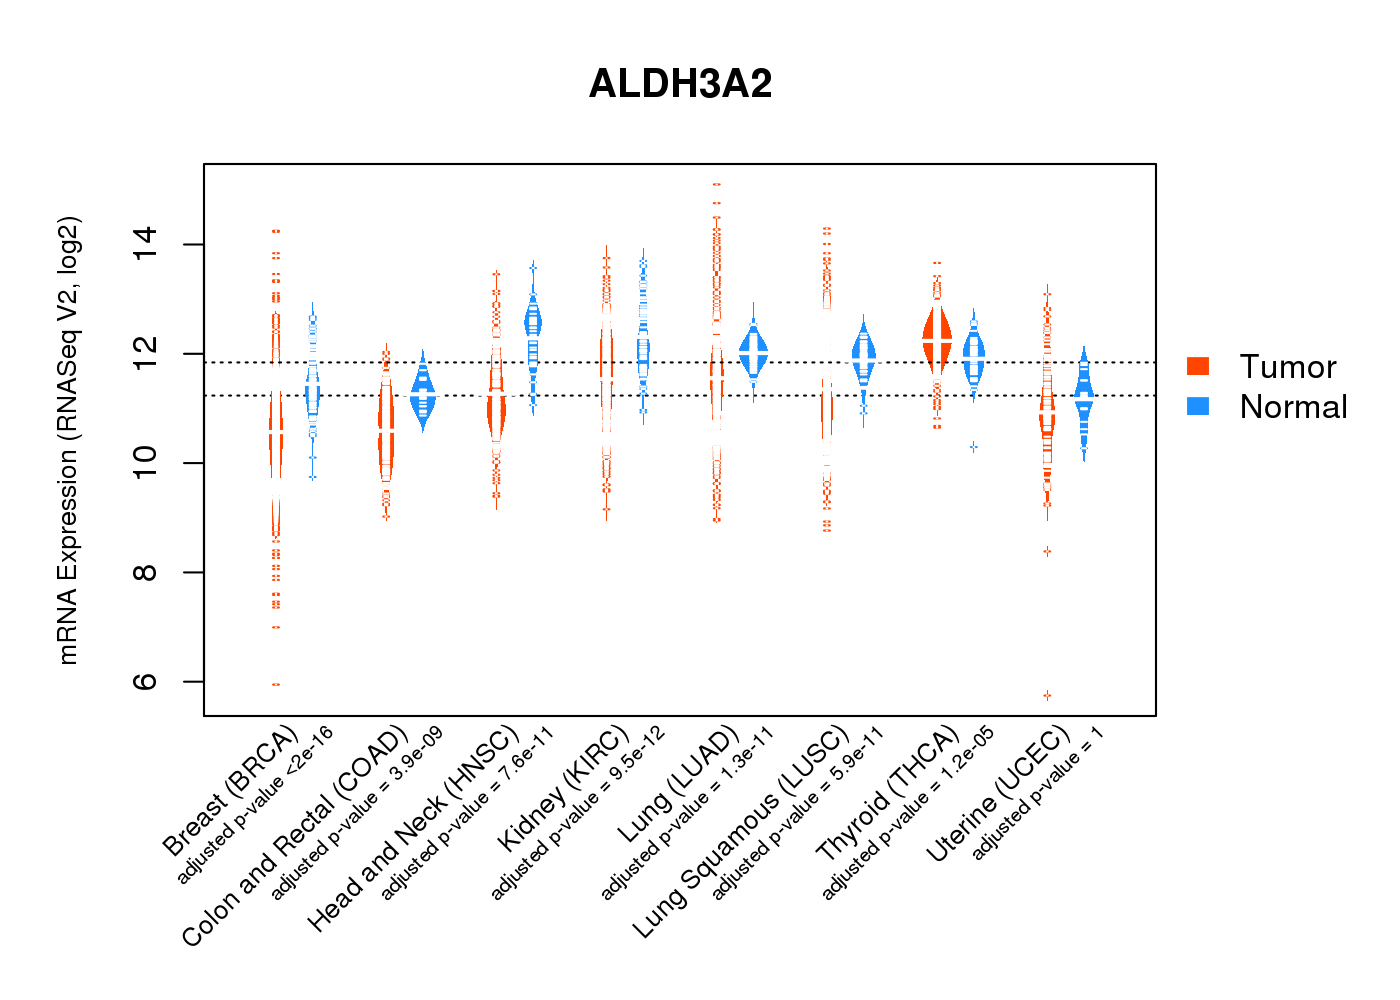
| Gene Expression for ALDH3A2 |
| * CCLE gene expression data were extracted from CCLE_Expression_Entrez_2012-10-18.res: Gene-centric RMA-normalized mRNA expression data. |
 |
| * Normalized gene expression data of RNASeqV2 was extracted from TCGA using R package TCGA-Assembler. The URLs of all public data files on TCGA DCC data server were gathered at Jan-05-2015. Only eight cancer types have enough normal control samples for differential expression analysis. (t test, adjusted p<0.05 (using Benjamini-Hochberg FDR)) |
 |
| Top |
| * This plots show the correlation between CNV and gene expression. |
: Open all plots for all cancer types
 |
|
 |
|

| Top |
| Gene-Gene Network Information |
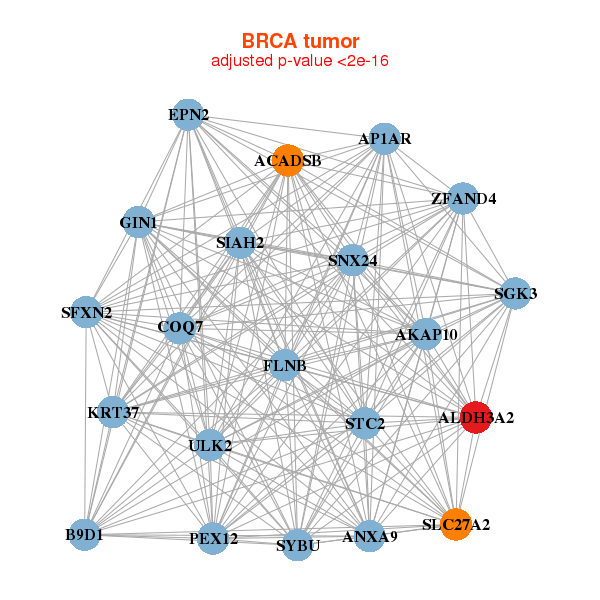
| * Co-Expression network figures were drawn using R package igraph. Only the top 20 genes with the highest correlations were shown. Red circle: input gene, orange circle: cell metabolism gene, sky circle: other gene |
: Open all plots for all cancer types
 |
| ||||
| ACADSB,AKAP10,ALDH3A2,ZFAND4,ANXA9,AP1AR,B9D1, COQ7,EPN2,FLNB,GIN1,KRT37,PEX12,SFXN2, SGK3,SIAH2,SLC27A2,SNX24,STC2,SYBU,ULK2 | ALDH3A2,CLMP,ASPH,ATP9A,BHMT2,BTD,MTURN, CCDC69,DHDDS,DMGDH,FOXN3,MRAS,PLXNA4,PYGL, SNN,SORBS1,TK2,TLN2,TNS1,TTC7B,VKORC1L1 | ||||
 |
| ||||
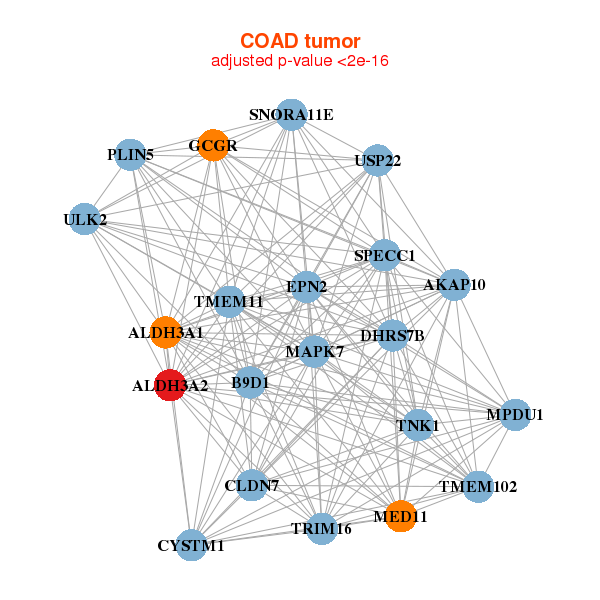
| AKAP10,ALDH3A1,ALDH3A2,B9D1,CYSTM1,CLDN7,SPECC1, DHRS7B,EPN2,GCGR,MAPK7,MED11,MPDU1,PLIN5, SNORA11E,TMEM102,TMEM11,TNK1,TRIM16,ULK2,USP22 | ABHD5,ACOT4,ADH1C,AGMAT,ALDH3A2,APMAP,C2orf47, DNAJC25,ETFA,FAM45A,FDX1,GCLM,KCNV1,ME2, MTCH2,PEX11A,PHYH,PITX2,RPP25,SLC27A2,TMEM139 |


| * Co-Expression network figures were drawn using R package igraph. Only the top 20 genes with the highest correlations were shown. Red circle: input gene, orange circle: cell metabolism gene, sky circle: other gene |
: Open all plots for all cancer types
| Top |
: Open all interacting genes' information including KEGG pathway for all interacting genes from DAVID
| Top |
| Pharmacological Information for ALDH3A2 |
| DB Category | DB Name | DB's ID and Url link |
| * Gene Centered Interaction Network. |
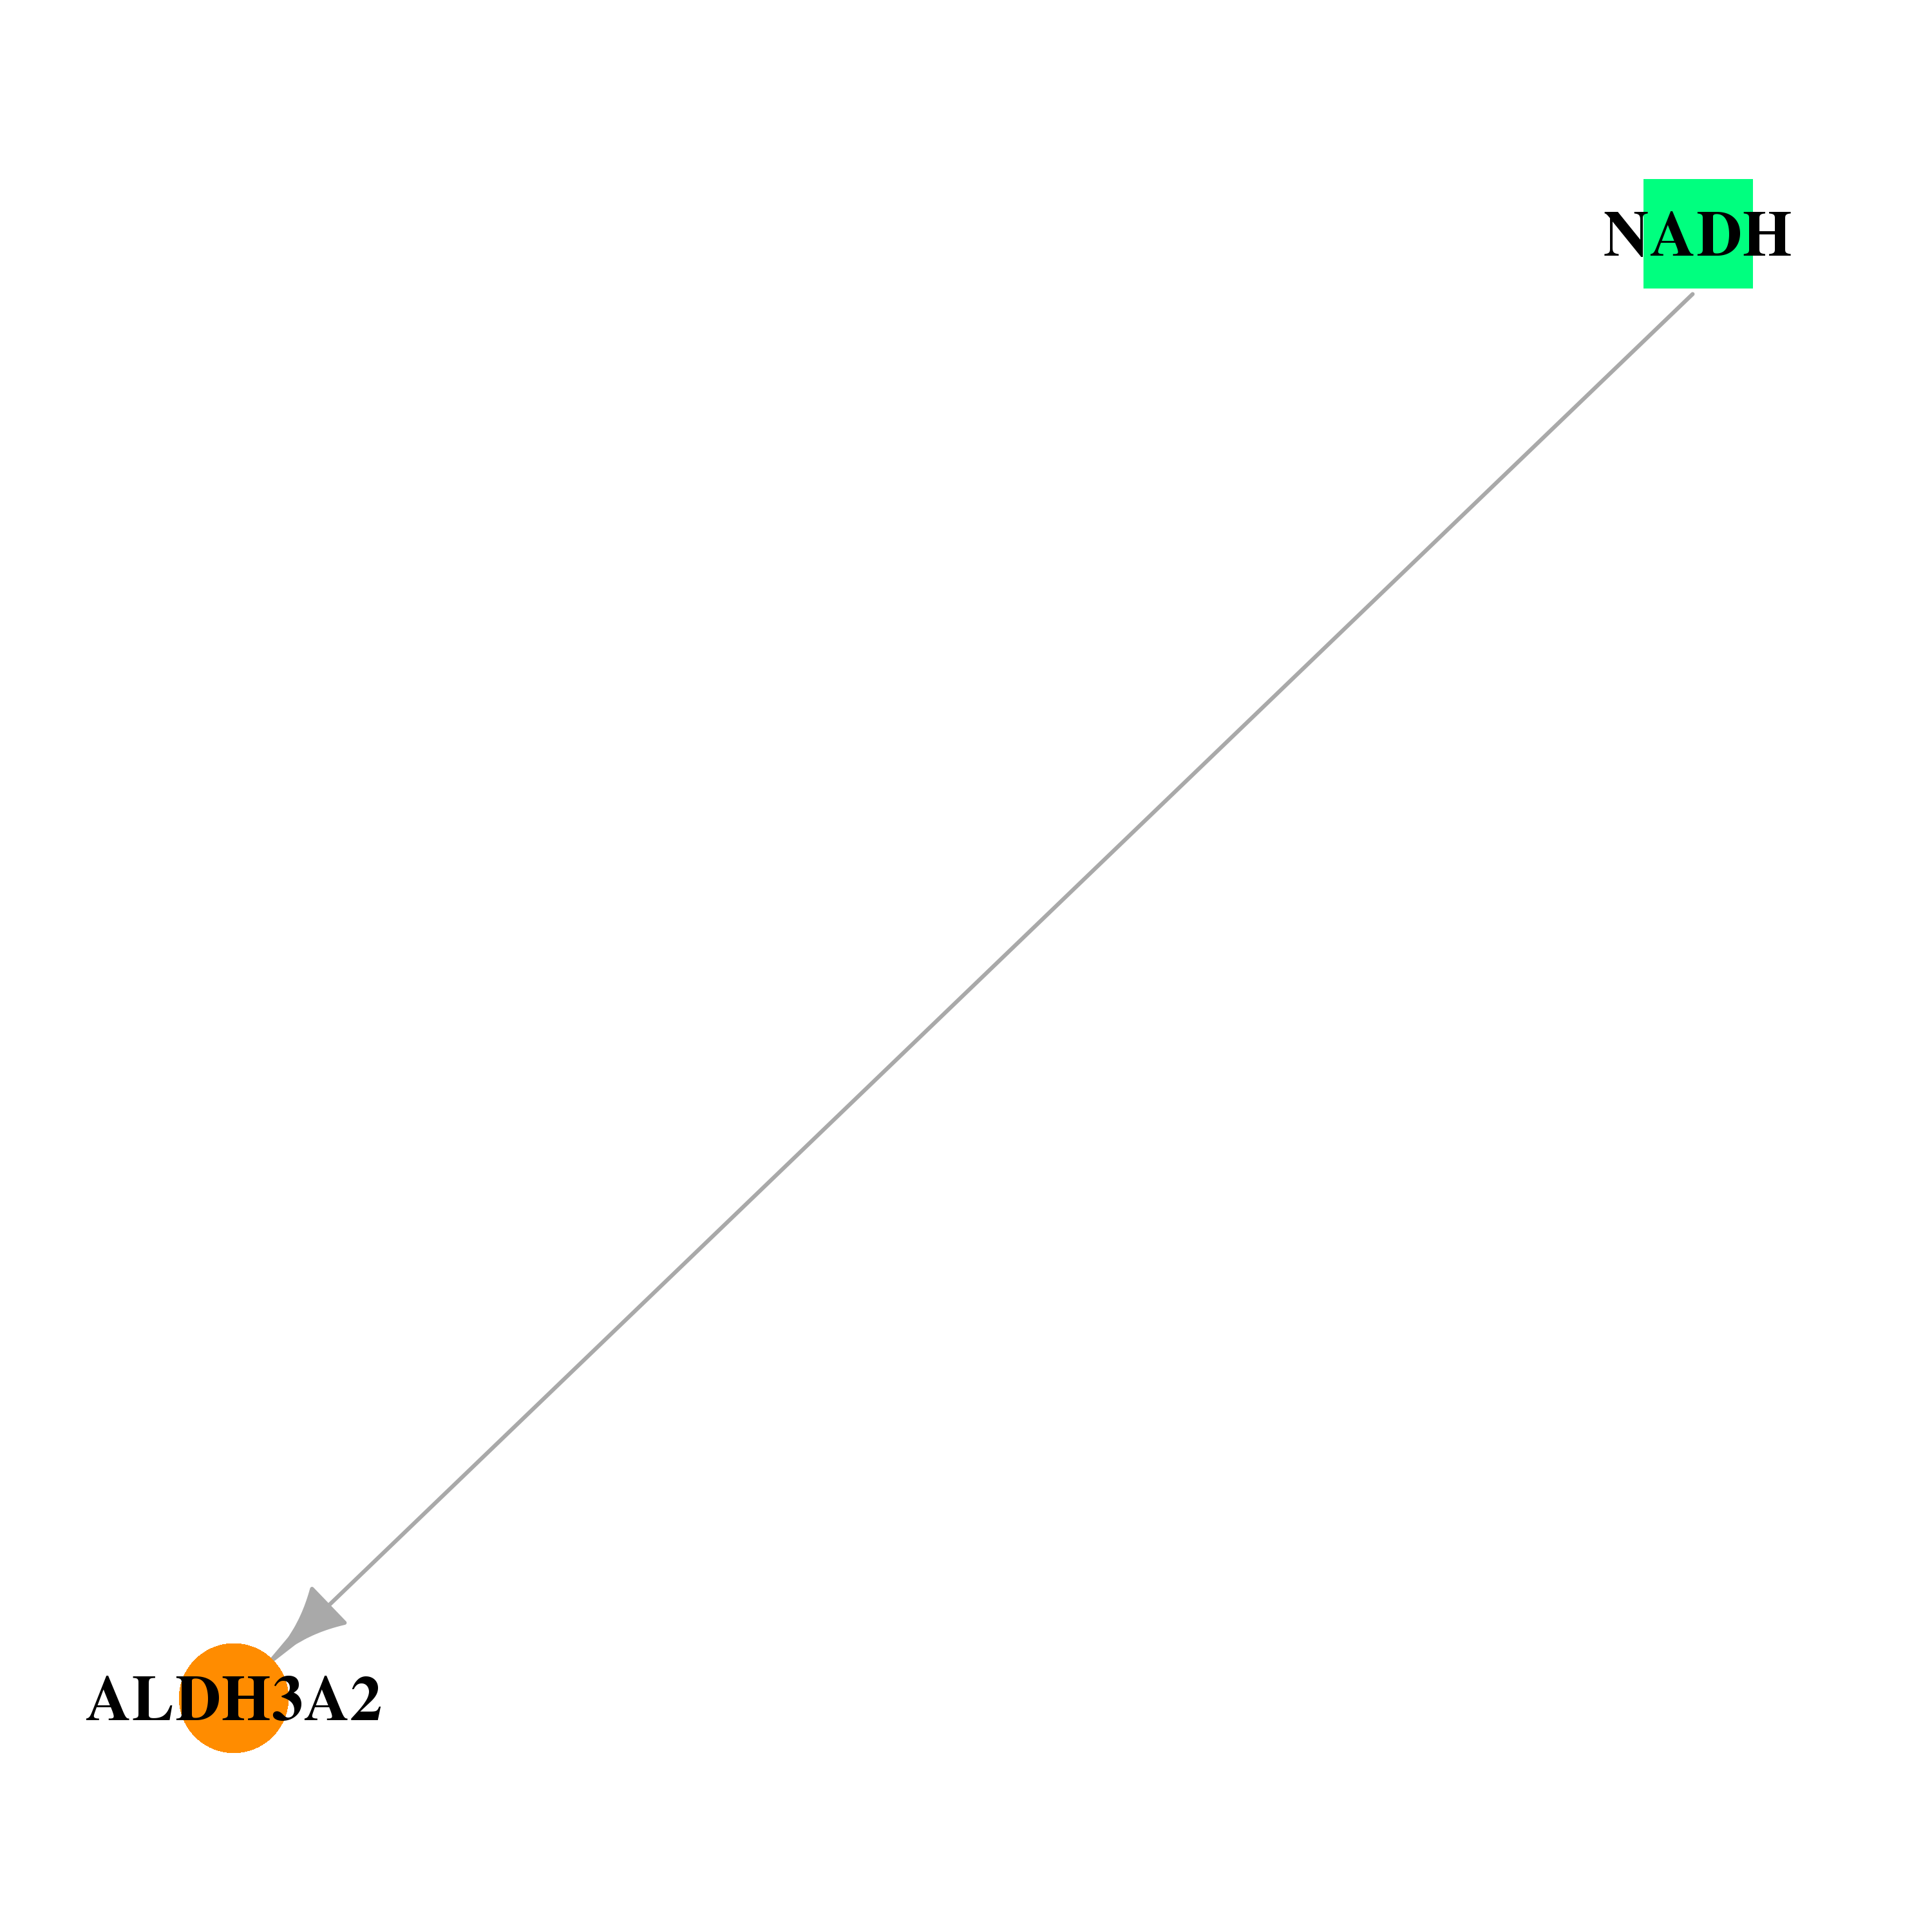 |
| * Drug Centered Interaction Network. |
| DrugBank ID | Target Name | Drug Groups | Generic Name | Drug Centered Network | Drug Structure |
| DB00157 | aldehyde dehydrogenase 3 family, member A2 | approved; nutraceutical | NADH |  |  |
| Top |
| Cross referenced IDs for ALDH3A2 |
| * We obtained these cross-references from Uniprot database. It covers 150 different DBs, 18 categories. http://www.uniprot.org/help/cross_references_section |
: Open all cross reference information
|
Copyright © 2016-Present - The Univsersity of Texas Health Science Center at Houston @ |