|
||||||||||||||||||||||||||||||||||||||||||||||||||||||||||||||||||||||||||||||||||||||||||||||||||||||||||||||||||||||||||||||||||||||||||||||||||||||||||||||||||||||||||||||||||||||||||||||||||||||||||||||||||||||||||||||||||||||||||||||||||||||||||||||||||||||||||||||||||||||||||||||||||||||||||||||||||||||||||
| |
| Phenotypic Information (metabolism pathway, cancer, disease, phenome) |
| |
| |
| Gene-Gene Network Information: Co-Expression Network, Interacting Genes & KEGG |
| |
|


| Gene Summary for FH |
| Basic gene info. | Gene symbol | FH |
| Gene name | fumarate hydratase | |
| Synonyms | HLRCC|LRCC|MCL|MCUL1 | |
| Cytomap | UCSC genome browser: 1q42.1 | |
| Genomic location | chr1 :241660856-241683085 | |
| Type of gene | protein-coding | |
| RefGenes | NM_000143.3, | |
| Ensembl id | ENSG00000091483 | |
| Description | fumarasefumarate hydratase, mitochondrial | |
| Modification date | 20141222 | |
| dbXrefs | MIM : 136850 | |
| HGNC : HGNC | ||
| Ensembl : ENSG00000091483 | ||
| HPRD : 00652 | ||
| Vega : OTTHUMG00000039597 | ||
| Protein | UniProt: P07954 go to UniProt's Cross Reference DB Table | |
| Expression | CleanEX: HS_FH | |
| BioGPS: 2271 | ||
| Gene Expression Atlas: ENSG00000091483 | ||
| The Human Protein Atlas: ENSG00000091483 | ||
| Pathway | NCI Pathway Interaction Database: FH | |
| KEGG: FH | ||
| REACTOME: FH | ||
| ConsensusPathDB | ||
| Pathway Commons: FH | ||
| Metabolism | MetaCyc: FH | |
| HUMANCyc: FH | ||
| Regulation | Ensembl's Regulation: ENSG00000091483 | |
| miRBase: chr1 :241,660,856-241,683,085 | ||
| TargetScan: NM_000143 | ||
| cisRED: ENSG00000091483 | ||
| Context | iHOP: FH | |
| cancer metabolism search in PubMed: FH | ||
| UCL Cancer Institute: FH | ||
| Assigned class in ccmGDB | A - This gene has a literature evidence and it belongs to cancer gene. | |
| References showing role of FH in cancer cell metabolism | 1. Zecchini V, Madhu B, Russell R, Pertega-Gomes N, Warren A, et al. (2014) Nuclear ARRB1 induces pseudohypoxia and cellular metabolism reprogramming in prostate cancer. EMBO J 33: 1365-1382. doi: 10.15252/embj.201386874. pmid: 4194125. go to article 2. Morin A, Letouze E, Gimenez-Roqueplo AP, Favier J (2014) Oncometabolites-driven tumorigenesis: From genetics to targeted therapy. Int J Cancer 135: 2237-2248. doi: 10.1002/ijc.29080. go to article 3. Nowicki S, Gottlieb E (2015) Oncometabolites: tailoring our genes. FEBS J. doi: 10.1111/febs.13295. go to article 4. Sourbier C, Ricketts CJ, Matsumoto S, Crooks DR, Liao PJ, et al. (2014) Targeting ABL1-mediated oxidative stress adaptation in fumarate hydratase-deficient cancer. Cancer Cell 26: 840-850. doi: 10.1016/j.ccell.2014.10.005. pmid: 4386283. go to article 5. Kaelin WG, Jr. (2014) DisABLing kidney cancers caused by fumarate hydratase mutations. Cancer Cell 26: 779-780. doi: 10.1016/j.ccell.2014.11.022. go to article | |
| Top |
| Phenotypic Information for FH(metabolism pathway, cancer, disease, phenome) |
| Cancer | CGAP: FH |
| Familial Cancer Database: FH | |
| * This gene is included in those cancer gene databases. |
|
|
|
|
|
| . | ||||||||||||||||||||||||||||||||||||||||||||||||||||||||||||||||||||||||||||||||||||||||||||||||||||||||||||||||||||||||||||||||||||||||||||||||||||||||||||||||||||||||||||||||||||||||||||||||||||||||||||||||||||||||||||||||||||||||||||||||||||||||||||||||||||||||||||||||||||||||||||||||||||||||||||||||||||
Oncogene 1 | Significant driver gene in | |||||||||||||||||||||||||||||||||||||||||||||||||||||||||||||||||||||||||||||||||||||||||||||||||||||||||||||||||||||||||||||||||||||||||||||||||||||||||||||||||||||||||||||||||||||||||||||||||||||||||||||||||||||||||||||||||||||||||||||||||||||||||||||||||||||||||||||||||||||||||||||||||||||||||||||||||||||||||
| cf) number; DB name 1 Oncogene; http://nar.oxfordjournals.org/content/35/suppl_1/D721.long, 2 Tumor Suppressor gene; https://bioinfo.uth.edu/TSGene/, 3 Cancer Gene Census; http://www.nature.com/nrc/journal/v4/n3/abs/nrc1299.html, 4 CancerGenes; http://nar.oxfordjournals.org/content/35/suppl_1/D721.long, 5 Network of Cancer Gene; http://ncg.kcl.ac.uk/index.php, 1Therapeutic Vulnerabilities in Cancer; http://cbio.mskcc.org/cancergenomics/statius/ |
| REACTOME_PYRUVATE_METABOLISM_AND_CITRIC_ACID_TCA_CYCLE | |
| OMIM | 136850; gene. 150800; phenotype. 606812; phenotype. |
| Orphanet | 24; Fumaric aciduria. 29072; Hereditary pheochromocytoma-paraganglioma. 523; Hereditary leiomyomatosis and renal cell cancer. |
| Disease | KEGG Disease: FH |
| MedGen: FH (Human Medical Genetics with Condition) | |
| ClinVar: FH | |
| Phenotype | MGI: FH (International Mouse Phenotyping Consortium) |
| PhenomicDB: FH | |
| Mutations for FH |
| * Under tables are showing count per each tissue to give us broad intuition about tissue specific mutation patterns.You can go to the detailed page for each mutation database's web site. |
| There's no structural variation information in COSMIC data for this gene. |
| * From mRNA Sanger sequences, Chitars2.0 arranged chimeric transcripts. This table shows FH related fusion information. |
| ID | Head Gene | Tail Gene | Accession | Gene_a | qStart_a | qEnd_a | Chromosome_a | tStart_a | tEnd_a | Gene_a | qStart_a | qEnd_a | Chromosome_a | tStart_a | tEnd_a |
| Top |
| Mutation type/ Tissue ID | brca | cns | cerv | endome | haematopo | kidn | Lintest | liver | lung | ns | ovary | pancre | prost | skin | stoma | thyro | urina | |||
| Total # sample | 1 | |||||||||||||||||||
| GAIN (# sample) | 1 | |||||||||||||||||||
| LOSS (# sample) |
| cf) Tissue ID; Tissue type (1; Breast, 2; Central_nervous_system, 3; Cervix, 4; Endometrium, 5; Haematopoietic_and_lymphoid_tissue, 6; Kidney, 7; Large_intestine, 8; Liver, 9; Lung, 10; NS, 11; Ovary, 12; Pancreas, 13; Prostate, 14; Skin, 15; Stomach, 16; Thyroid, 17; Urinary_tract) |
| Top |
|
 |
| Top |
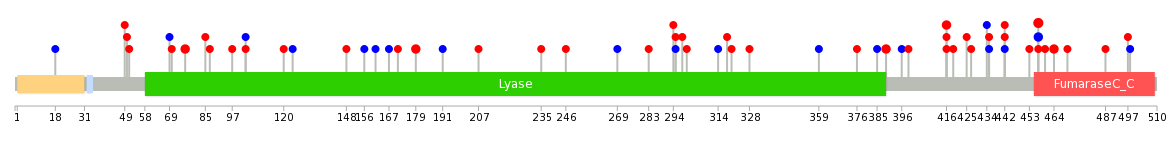
| Stat. for Non-Synonymous SNVs (# total SNVs=44) | (# total SNVs=18) |
 |  |
(# total SNVs=0) | (# total SNVs=0) |
| Top |
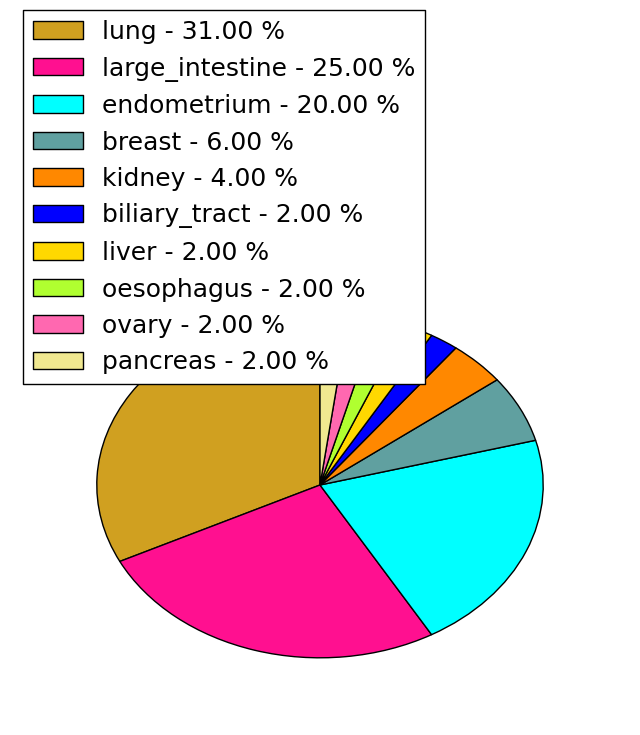
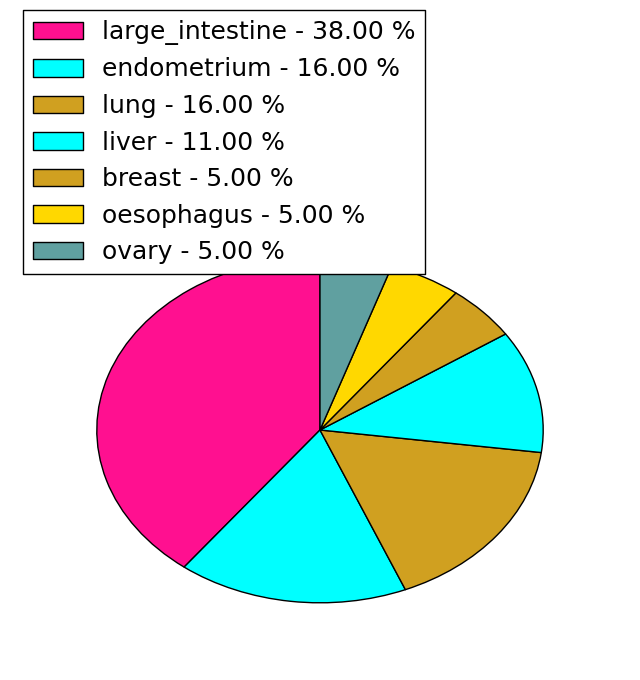
| * When you move the cursor on each content, you can see more deailed mutation information on the Tooltip. Those are primary_site,primary_histology,mutation(aa),pubmedID. |
| GRCh37 position | Mutation(aa) | Unique sampleID count |
| chr1:241663758-241663758 | p.T457A | 3 |
| chr1:241665814-241665814 | p.G389W | 2 |
| chr1:241661270-241661270 | p.G464V | 2 |
| chr1:241675287-241675287 | p.D179N | 2 |
| chr1:241663756-241663756 | p.T457T | 2 |
| chr1:241680472-241680472 | p.? | 2 |
| chr1:241663880-241663880 | p.V416A | 2 |
| chr1:241680522-241680522 | p.T76M | 2 |
| chr1:241663881-241663881 | p.V416L | 2 |
| chr1:241667497-241667497 | p.H318R | 1 |
| Top |
|
 |
| Point Mutation/ Tissue ID | 1 | 2 | 3 | 4 | 5 | 6 | 7 | 8 | 9 | 10 | 11 | 12 | 13 | 14 | 15 | 16 | 17 | 18 | 19 | 20 |
| # sample | 4 | 17 | 2 | 1 | 8 | 3 | 1 | 2 | 3 | 1 | 9 | |||||||||
| # mutation | 4 | 15 | 2 | 1 | 9 | 3 | 1 | 2 | 3 | 1 | 11 | |||||||||
| nonsynonymous SNV | 3 | 8 | 2 | 1 | 7 | 1 | 1 | 2 | 3 | 1 | 8 | |||||||||
| synonymous SNV | 1 | 7 | 2 | 2 | 3 |
| cf) Tissue ID; Tissue type (1; BLCA[Bladder Urothelial Carcinoma], 2; BRCA[Breast invasive carcinoma], 3; CESC[Cervical squamous cell carcinoma and endocervical adenocarcinoma], 4; COAD[Colon adenocarcinoma], 5; GBM[Glioblastoma multiforme], 6; Glioma Low Grade, 7; HNSC[Head and Neck squamous cell carcinoma], 8; KICH[Kidney Chromophobe], 9; KIRC[Kidney renal clear cell carcinoma], 10; KIRP[Kidney renal papillary cell carcinoma], 11; LAML[Acute Myeloid Leukemia], 12; LUAD[Lung adenocarcinoma], 13; LUSC[Lung squamous cell carcinoma], 14; OV[Ovarian serous cystadenocarcinoma ], 15; PAAD[Pancreatic adenocarcinoma], 16; PRAD[Prostate adenocarcinoma], 17; SKCM[Skin Cutaneous Melanoma], 18:STAD[Stomach adenocarcinoma], 19:THCA[Thyroid carcinoma], 20:UCEC[Uterine Corpus Endometrial Carcinoma]) |
| Top |
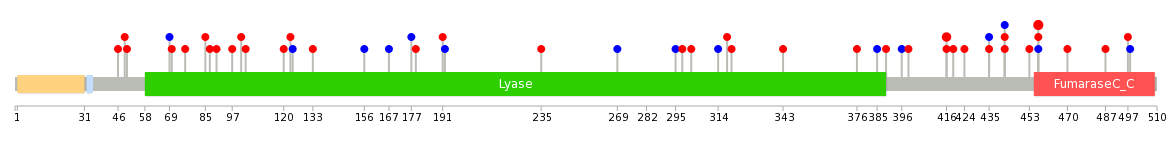
| * We represented just top 10 SNVs. When you move the cursor on each content, you can see more deailed mutation information on the Tooltip. Those are primary_site, primary_histology, mutation(aa), pubmedID. |
| Genomic Position | Mutation(aa) | Unique sampleID count |
| chr1:241663758 | p.T457A | 3 |
| chr1:241663880 | p.V416A | 2 |
| chr1:241675291 | p.S399I | 1 |
| chr1:241661202 | p.D179N | 1 |
| chr1:241680489 | p.G69G | 1 |
| chr1:241663856 | p.F497L | 1 |
| chr1:241667497 | p.V396V | 1 |
| chr1:241675321 | p.P177P | 1 |
| chr1:241661252 | p.F50I | 1 |
| chr1:241680496 | p.I487V | 1 |
| * Copy number data were extracted from TCGA using R package TCGA-Assembler. The URLs of all public data files on TCGA DCC data server were gathered on Jan-05-2015. Function ProcessCNAData in TCGA-Assembler package was used to obtain gene-level copy number value which is calculated as the average copy number of the genomic region of a gene. |
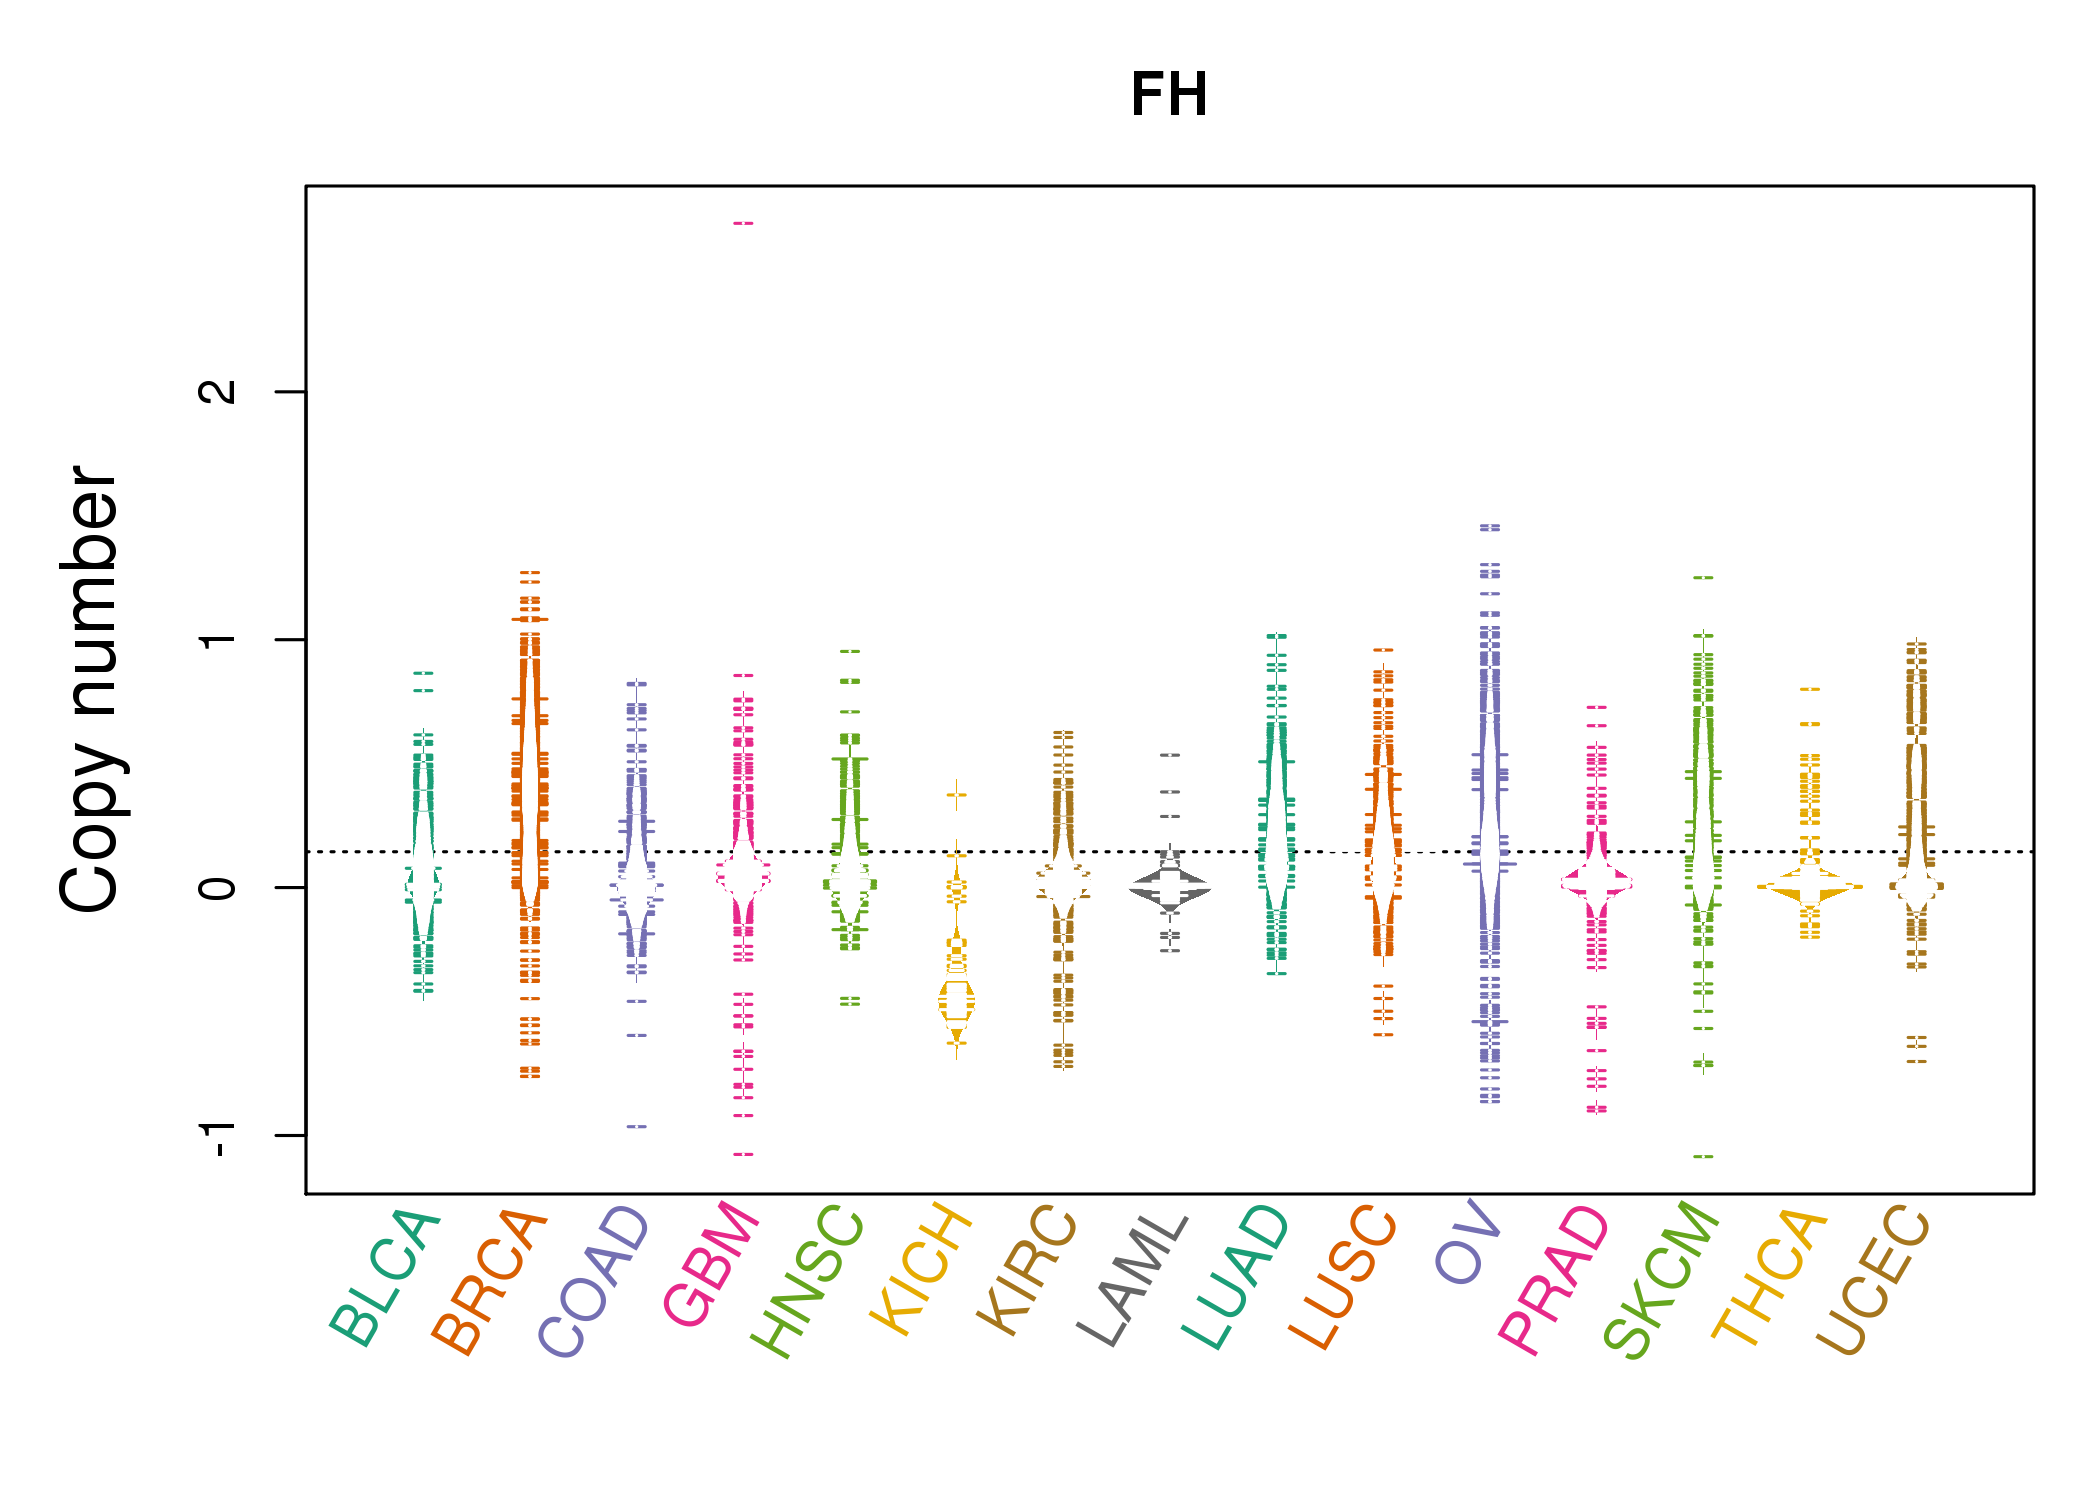 |
| cf) Tissue ID[Tissue type]: BLCA[Bladder Urothelial Carcinoma], BRCA[Breast invasive carcinoma], CESC[Cervical squamous cell carcinoma and endocervical adenocarcinoma], COAD[Colon adenocarcinoma], GBM[Glioblastoma multiforme], Glioma Low Grade, HNSC[Head and Neck squamous cell carcinoma], KICH[Kidney Chromophobe], KIRC[Kidney renal clear cell carcinoma], KIRP[Kidney renal papillary cell carcinoma], LAML[Acute Myeloid Leukemia], LUAD[Lung adenocarcinoma], LUSC[Lung squamous cell carcinoma], OV[Ovarian serous cystadenocarcinoma ], PAAD[Pancreatic adenocarcinoma], PRAD[Prostate adenocarcinoma], SKCM[Skin Cutaneous Melanoma], STAD[Stomach adenocarcinoma], THCA[Thyroid carcinoma], UCEC[Uterine Corpus Endometrial Carcinoma] |
| Top |
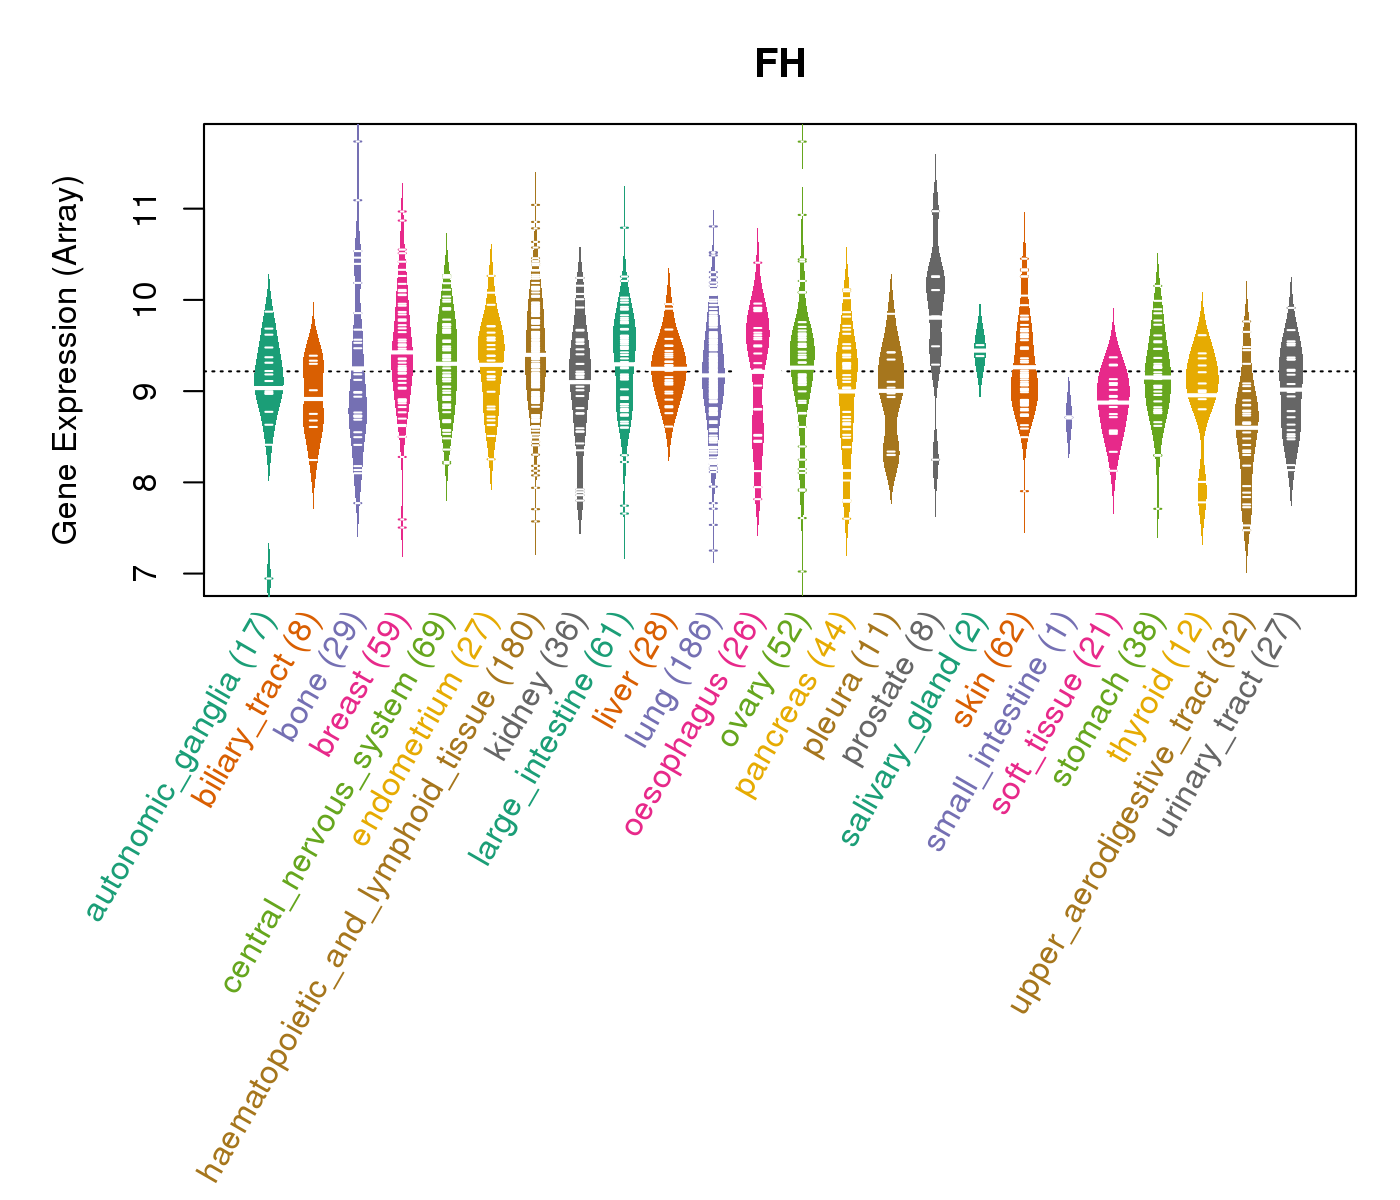
| Gene Expression for FH |
| * CCLE gene expression data were extracted from CCLE_Expression_Entrez_2012-10-18.res: Gene-centric RMA-normalized mRNA expression data. |
 |
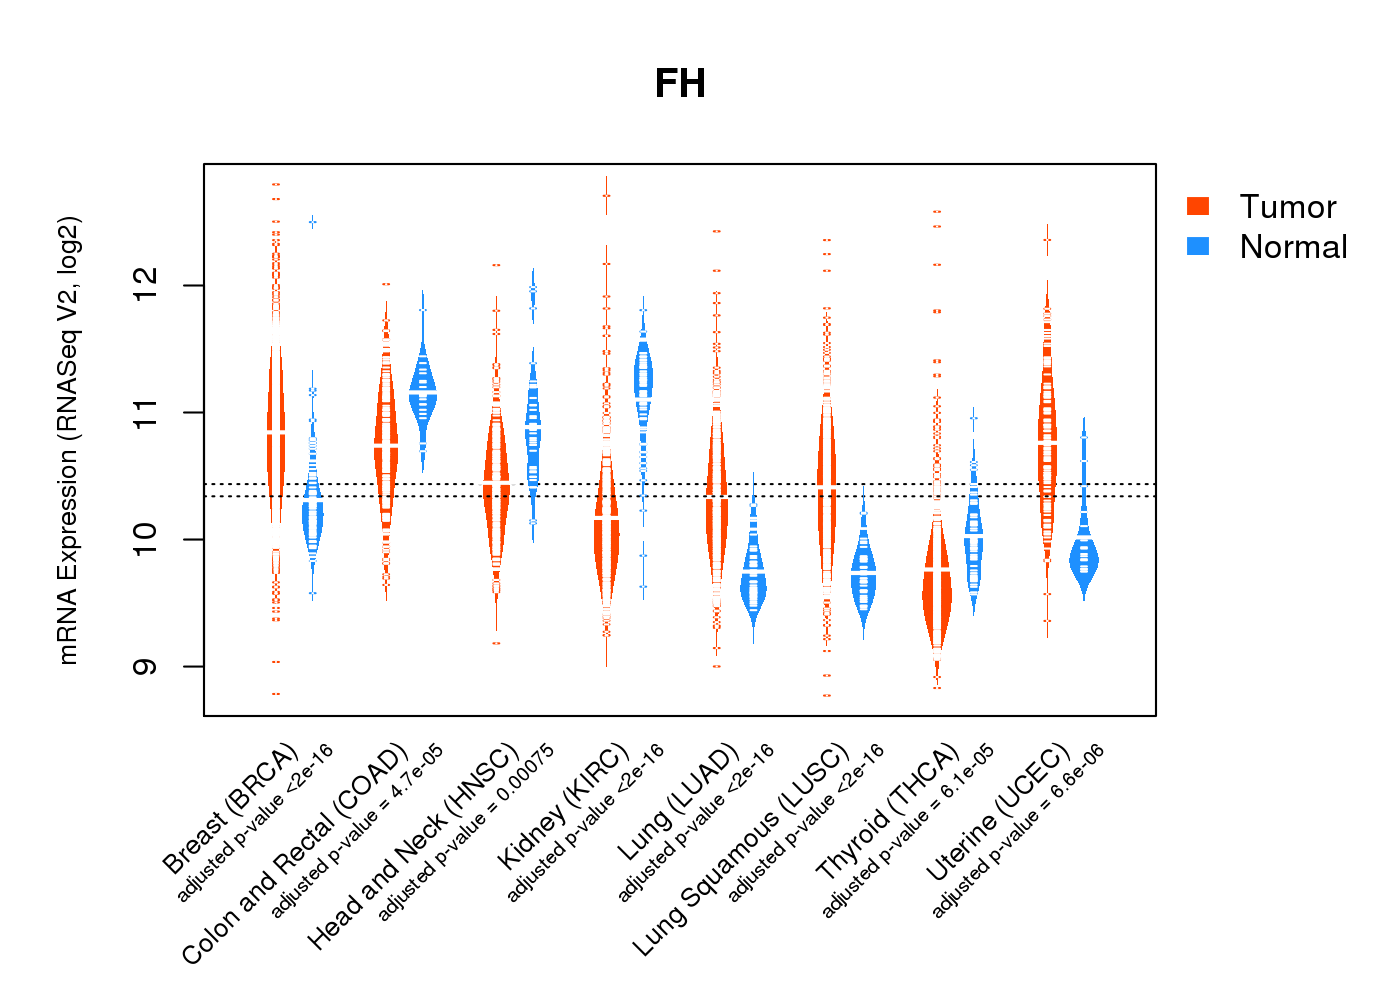
| * Normalized gene expression data of RNASeqV2 was extracted from TCGA using R package TCGA-Assembler. The URLs of all public data files on TCGA DCC data server were gathered at Jan-05-2015. Only eight cancer types have enough normal control samples for differential expression analysis. (t test, adjusted p<0.05 (using Benjamini-Hochberg FDR)) |
 |
| Top |
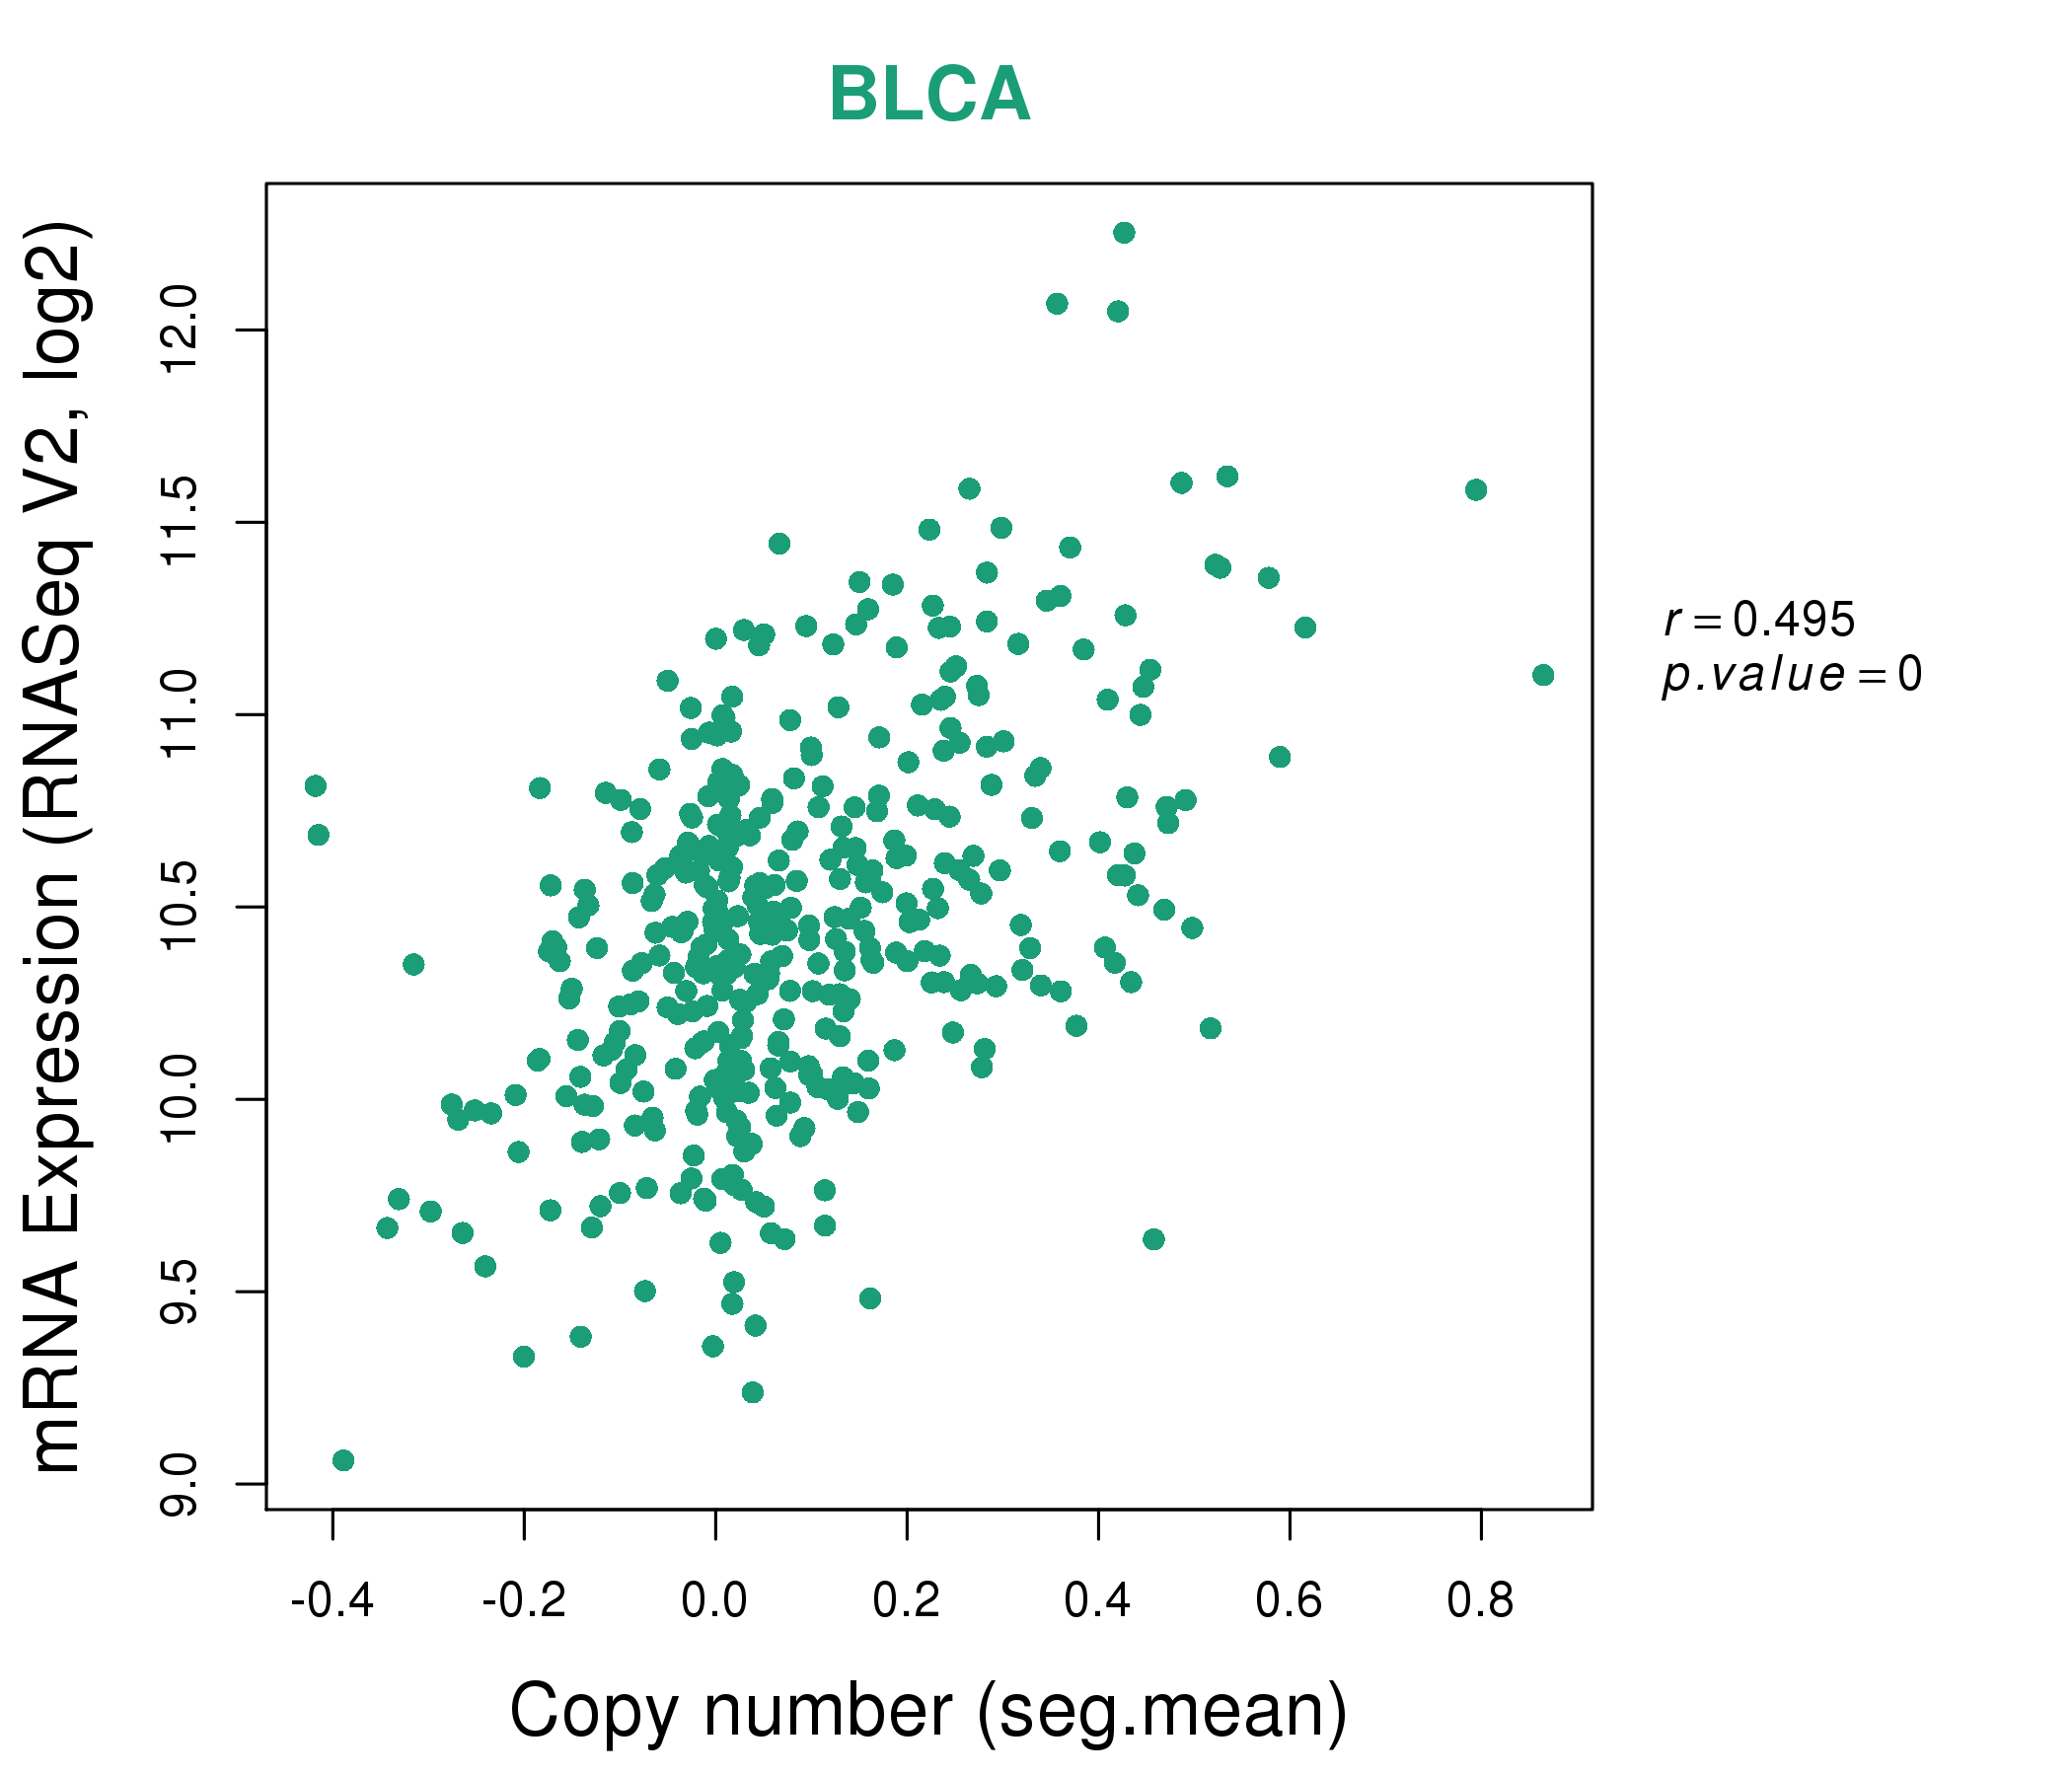
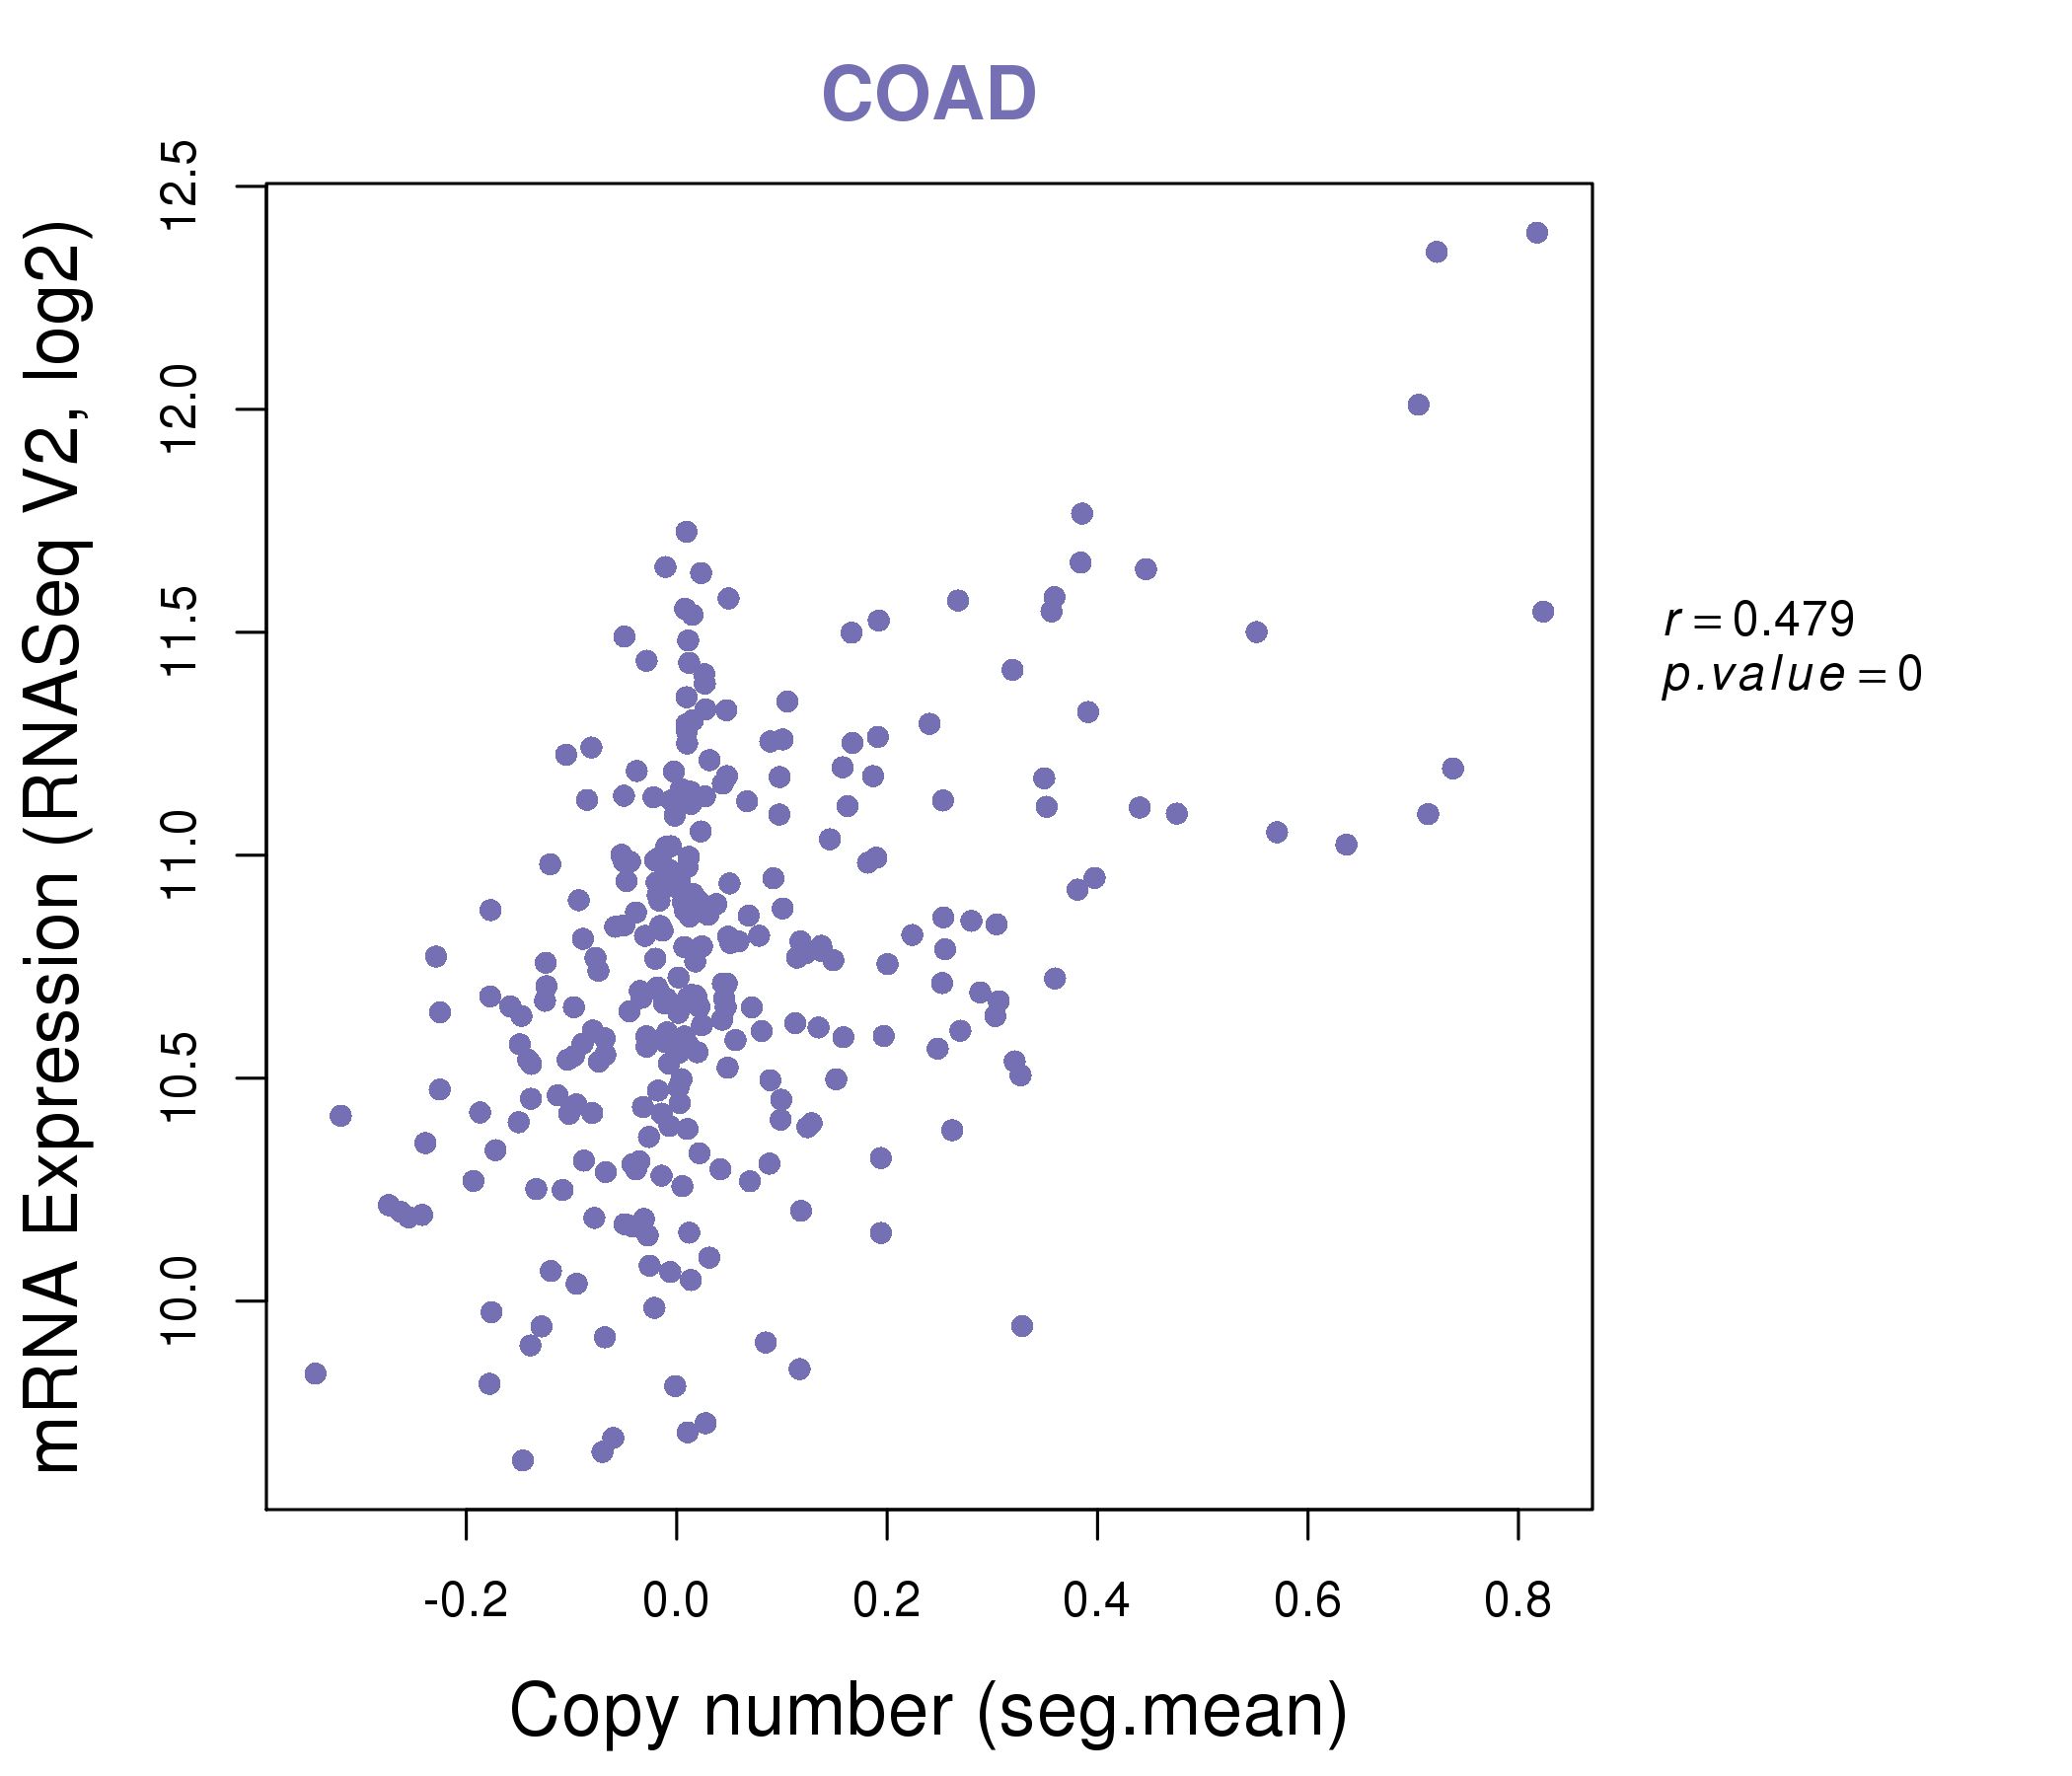
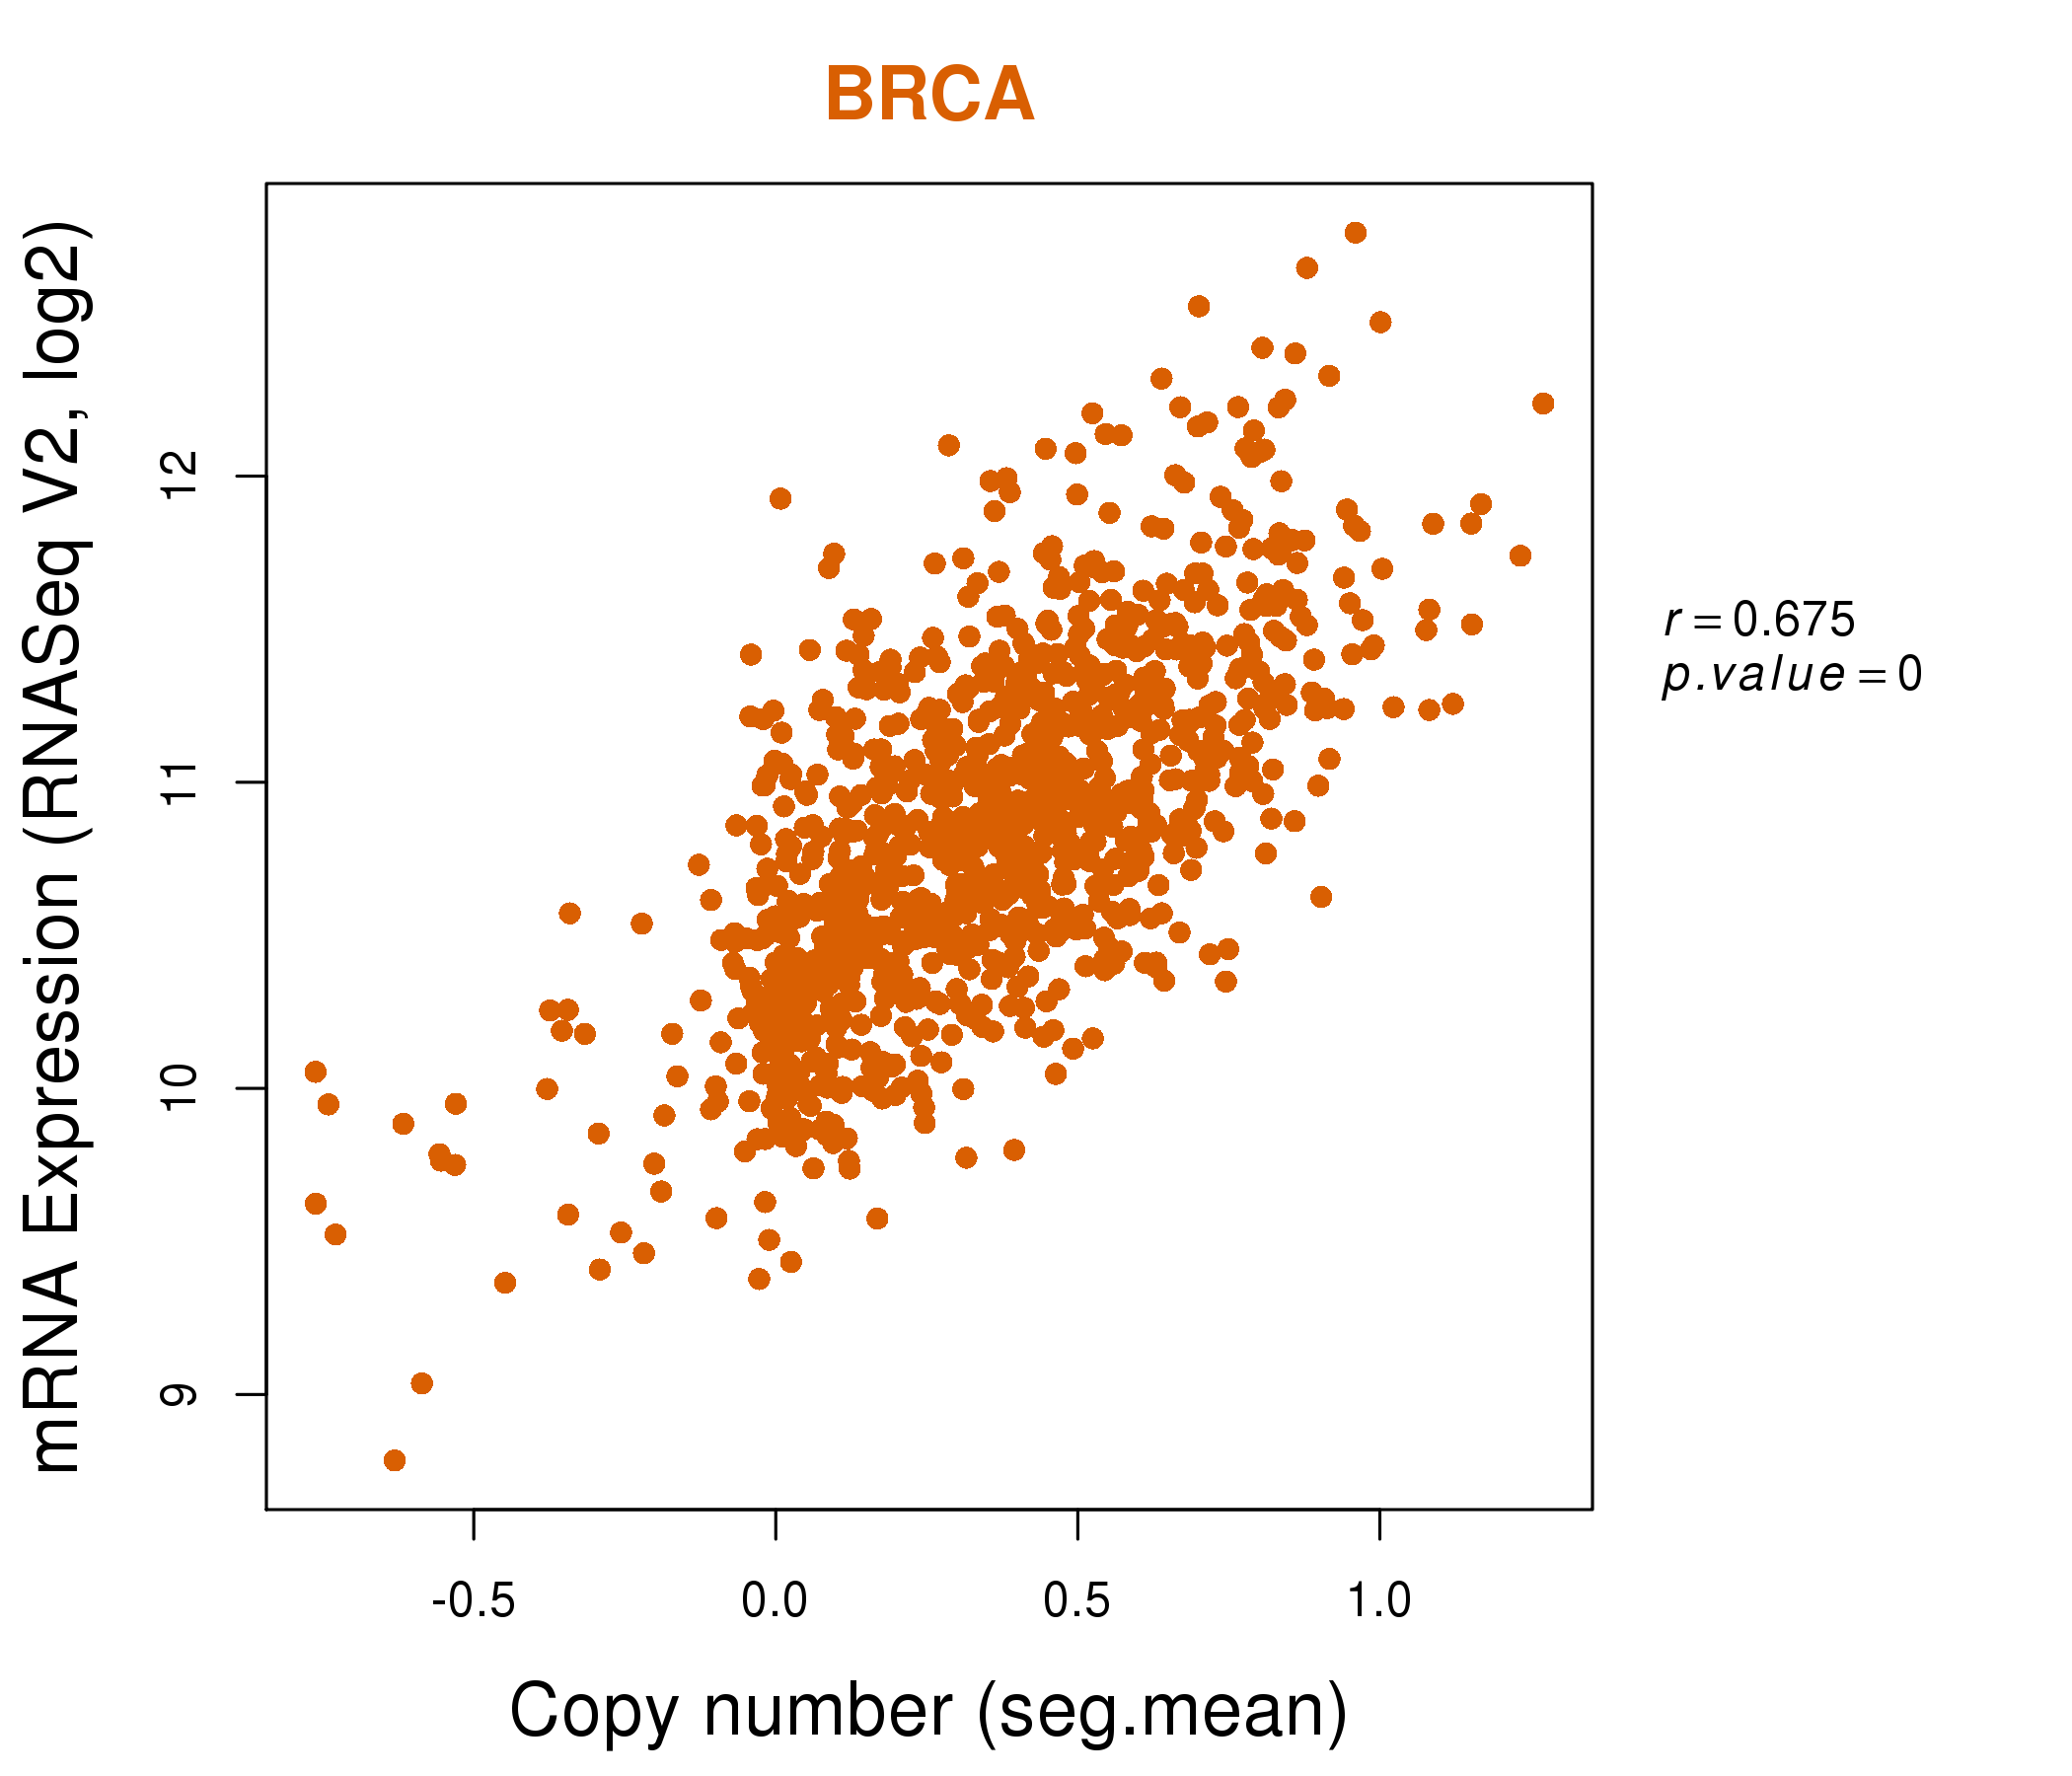
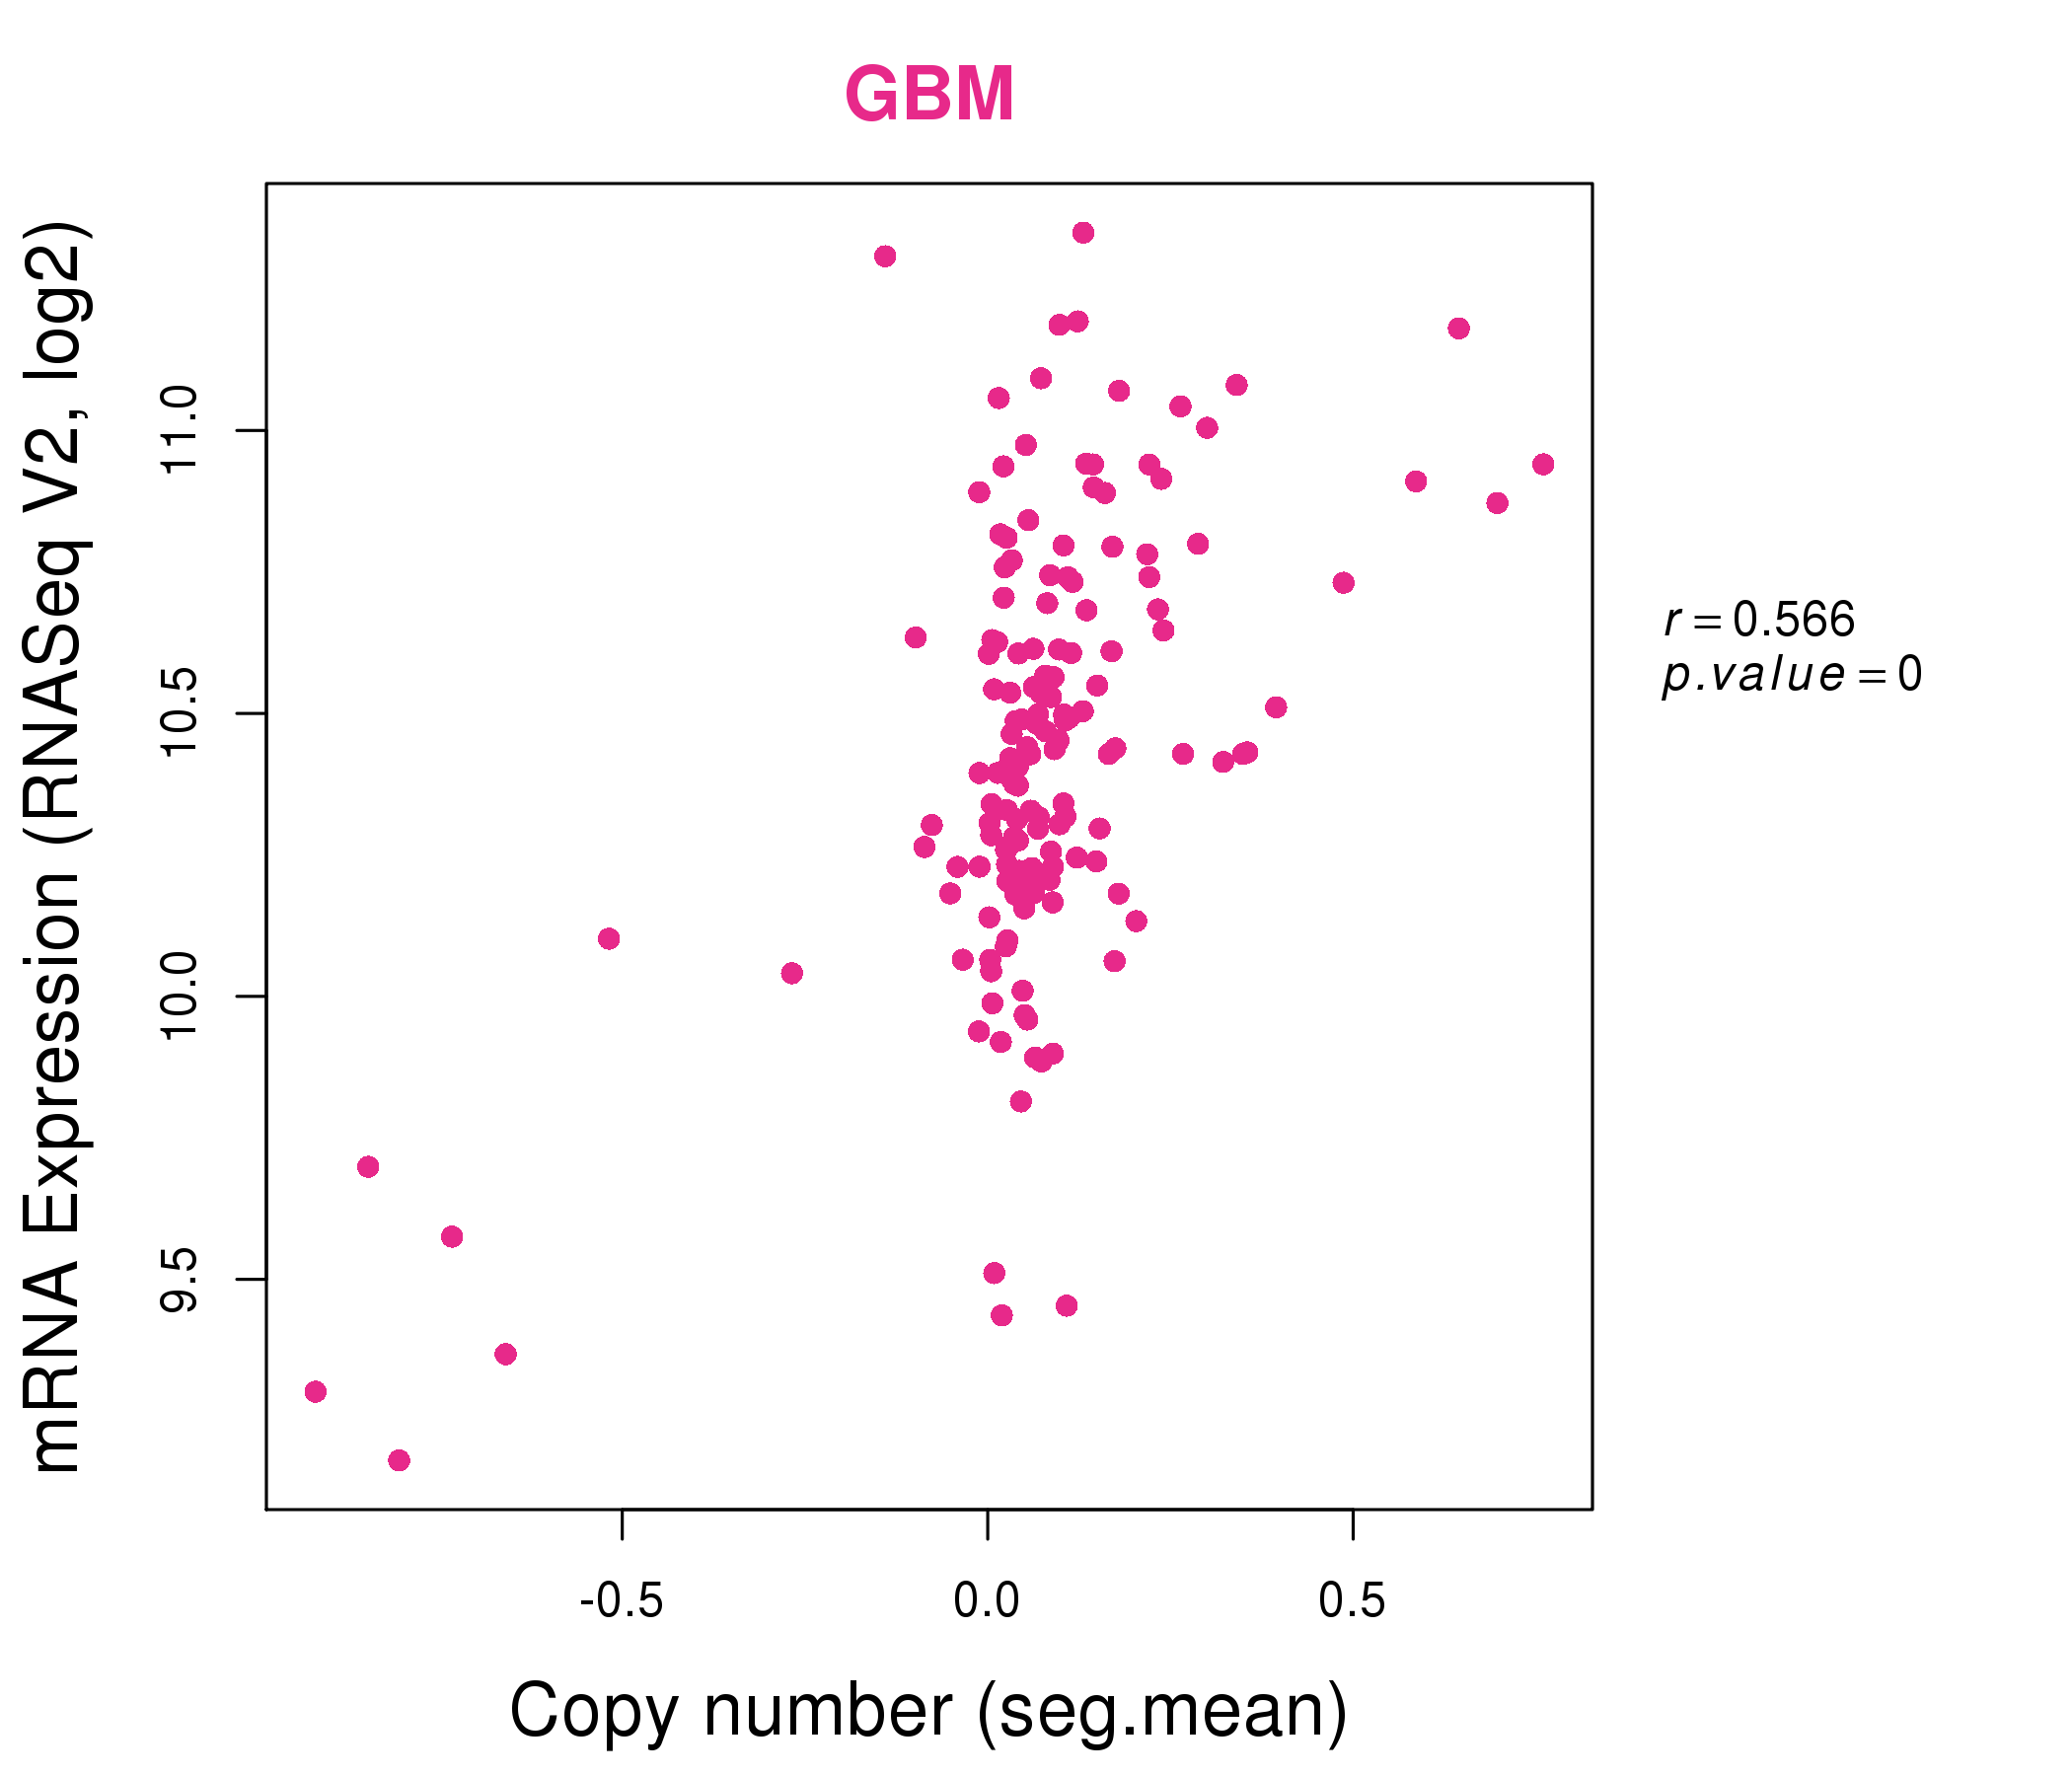
| * This plots show the correlation between CNV and gene expression. |
: Open all plots for all cancer types
 |
|
 |
|
| Top |
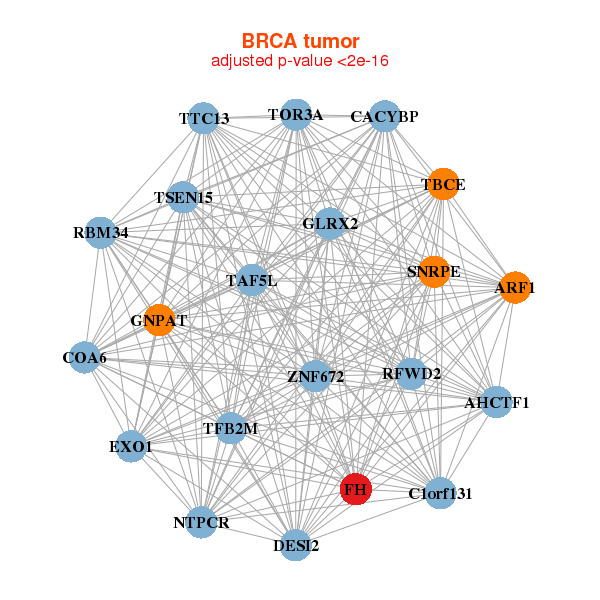
| Gene-Gene Network Information |
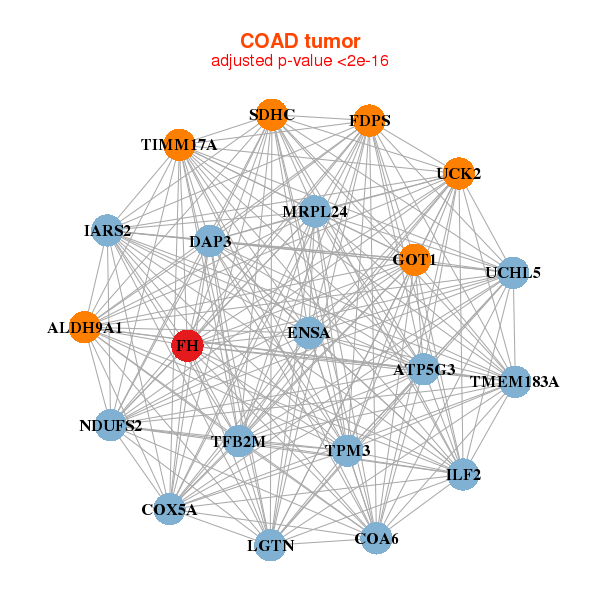
| * Co-Expression network figures were drawn using R package igraph. Only the top 20 genes with the highest correlations were shown. Red circle: input gene, orange circle: cell metabolism gene, sky circle: other gene |
: Open all plots for all cancer types
 |
|
| ATP10A,CLIC5,CLIC6,DOK7,EIF4E1B,FHL2,GADD45A, GPR26,ITPRIPL2,AJUBA,KCNS3,PGR,PLCD3,RAB31, RBBP8,SEMA3B,SUSD3,TMEM26,TUBA3D,UGDH,WT1 | PIFO,FHL2,GPR87,KIF9,KLK5,KLK7,KRT14, KRT17,KRT5,KRT9,MGP,NXT1,PDLIM1,PDLIM4, SF3B4,SFN,TACSTD2,TES,TMEM51,ZNF165,ZYX |
 |
|
| AGR2,ANG,B3GNT5,SMCO4,GSKIP,CYSTM1,MCU, DDB2,EGLN3,FHL2,FOXA3,FUT8,GMDS,FFAR4, LIMA1,MLPH,MRAP2,SEMA4B,TC2N,TRIM16,TSPAN15 | ADRM1,AKIRIN2,BCL10,LURAP1L,CASP5,CD55,DGCR11, FHL2,PLAUR,PSMC4,PSMD12,RAB35,RND1,RNF19B, SEMA4B,SERPINB8,SERTAD1,TNFRSF1A,TRIM15,TRIM40,TTC39B |
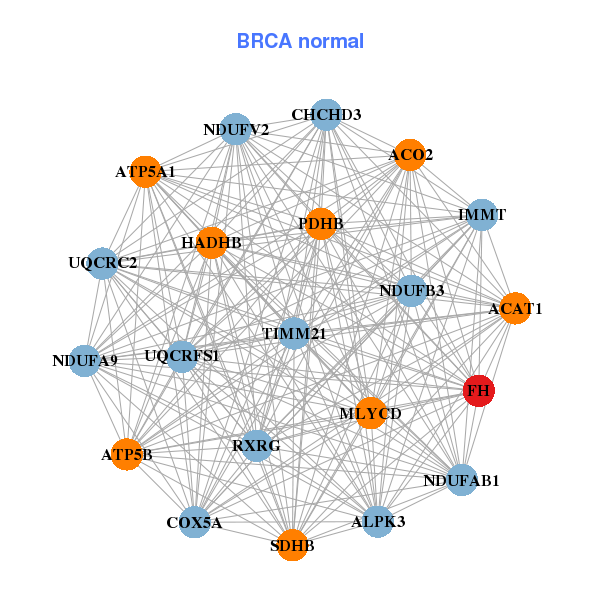
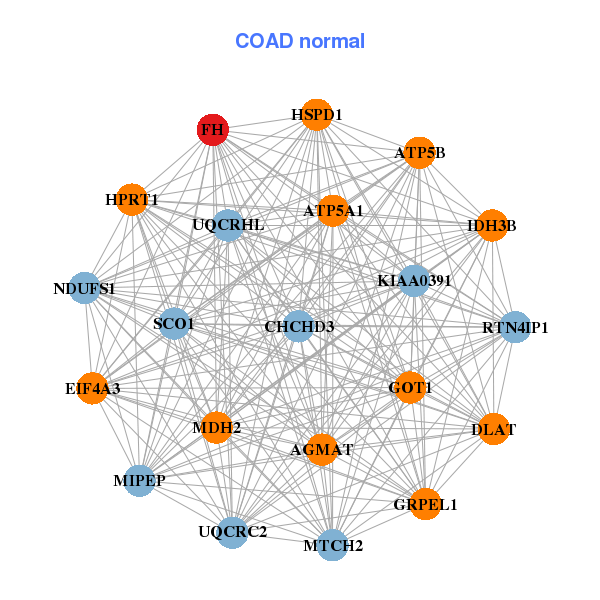
| * Co-Expression network figures were drawn using R package igraph. Only the top 20 genes with the highest correlations were shown. Red circle: input gene, orange circle: cell metabolism gene, sky circle: other gene |
: Open all plots for all cancer types
| Top |
: Open all interacting genes' information including KEGG pathway for all interacting genes from DAVID
| Top |
| Pharmacological Information for FH |
| There's no related Drug. |
| Top |
| Cross referenced IDs for FH |
| * We obtained these cross-references from Uniprot database. It covers 150 different DBs, 18 categories. http://www.uniprot.org/help/cross_references_section |
: Open all cross reference information
|
Copyright © 2016-Present - The Univsersity of Texas Health Science Center at Houston @ |