|
||||||||||||||||||||||||||||||||||||||||||||||||||||||||||||||||||||||||||||||||||||||||||||||||||||||||||||||||||||||||||||||||||||||||||||||||||||||||||||||||||||||||||||||||||||||||||||||||||||||||||||||||||||||||||||||||||||||||||||||||||||||||||||||||||||||||||||||||||||||||||||||||||||||||||||||||||||||||||
| |
| Phenotypic Information (metabolism pathway, cancer, disease, phenome) |
| |
| |
| Gene-Gene Network Information: Co-Expression Network, Interacting Genes & KEGG |
| |
|


| Gene Summary for CASC3 |
| Basic gene info. | Gene symbol | CASC3 |
| Gene name | cancer susceptibility candidate 3 | |
| Synonyms | BTZ|MLN51 | |
| Cytomap | UCSC genome browser: 17q21.1 | |
| Genomic location | chr17 :38296506-38328431 | |
| Type of gene | protein-coding | |
| RefGenes | NM_007359.4, | |
| Ensembl id | ENSG00000108349 | |
| Description | MLN 51barentszcancer susceptibility candidate gene 3 proteinmetastatic lymph node 51metastatic lymph node gene 51 proteinprotein CASC3protein barentsz | |
| Modification date | 20141207 | |
| dbXrefs | MIM : 606504 | |
| HGNC : HGNC | ||
| Ensembl : ENSG00000108349 | ||
| HPRD : 16225 | ||
| Vega : OTTHUMG00000133323 | ||
| Protein | UniProt: go to UniProt's Cross Reference DB Table | |
| Expression | CleanEX: HS_CASC3 | |
| BioGPS: 22794 | ||
| Gene Expression Atlas: ENSG00000108349 | ||
| The Human Protein Atlas: ENSG00000108349 | ||
| Pathway | NCI Pathway Interaction Database: CASC3 | |
| KEGG: CASC3 | ||
| REACTOME: CASC3 | ||
| ConsensusPathDB | ||
| Pathway Commons: CASC3 | ||
| Metabolism | MetaCyc: CASC3 | |
| HUMANCyc: CASC3 | ||
| Regulation | Ensembl's Regulation: ENSG00000108349 | |
| miRBase: chr17 :38,296,506-38,328,431 | ||
| TargetScan: NM_007359 | ||
| cisRED: ENSG00000108349 | ||
| Context | iHOP: CASC3 | |
| cancer metabolism search in PubMed: CASC3 | ||
| UCL Cancer Institute: CASC3 | ||
| Assigned class in ccmGDB | C | |
| Top |
| Phenotypic Information for CASC3(metabolism pathway, cancer, disease, phenome) |
| Cancer | CGAP: CASC3 |
| Familial Cancer Database: CASC3 | |
| * This gene is included in those cancer gene databases. |
|
|
|
|
|
| . | ||||||||||||||||||||||||||||||||||||||||||||||||||||||||||||||||||||||||||||||||||||||||||||||||||||||||||||||||||||||||||||||||||||||||||||||||||||||||||||||||||||||||||||||||||||||||||||||||||||||||||||||||||||||||||||||||||||||||||||||||||||||||||||||||||||||||||||||||||||||||||||||||||||||||||||||||||||
Oncogene 1 | Significant driver gene in | |||||||||||||||||||||||||||||||||||||||||||||||||||||||||||||||||||||||||||||||||||||||||||||||||||||||||||||||||||||||||||||||||||||||||||||||||||||||||||||||||||||||||||||||||||||||||||||||||||||||||||||||||||||||||||||||||||||||||||||||||||||||||||||||||||||||||||||||||||||||||||||||||||||||||||||||||||||||||
| cf) number; DB name 1 Oncogene; http://nar.oxfordjournals.org/content/35/suppl_1/D721.long, 2 Tumor Suppressor gene; https://bioinfo.uth.edu/TSGene/, 3 Cancer Gene Census; http://www.nature.com/nrc/journal/v4/n3/abs/nrc1299.html, 4 CancerGenes; http://nar.oxfordjournals.org/content/35/suppl_1/D721.long, 5 Network of Cancer Gene; http://ncg.kcl.ac.uk/index.php, 1Therapeutic Vulnerabilities in Cancer; http://cbio.mskcc.org/cancergenomics/statius/ |
| REACTOME_METABOLISM_OF_MRNA REACTOME_METABOLISM_OF_RNA | |
| OMIM | |
| Orphanet | |
| Disease | KEGG Disease: CASC3 |
| MedGen: CASC3 (Human Medical Genetics with Condition) | |
| ClinVar: CASC3 | |
| Phenotype | MGI: CASC3 (International Mouse Phenotyping Consortium) |
| PhenomicDB: CASC3 | |
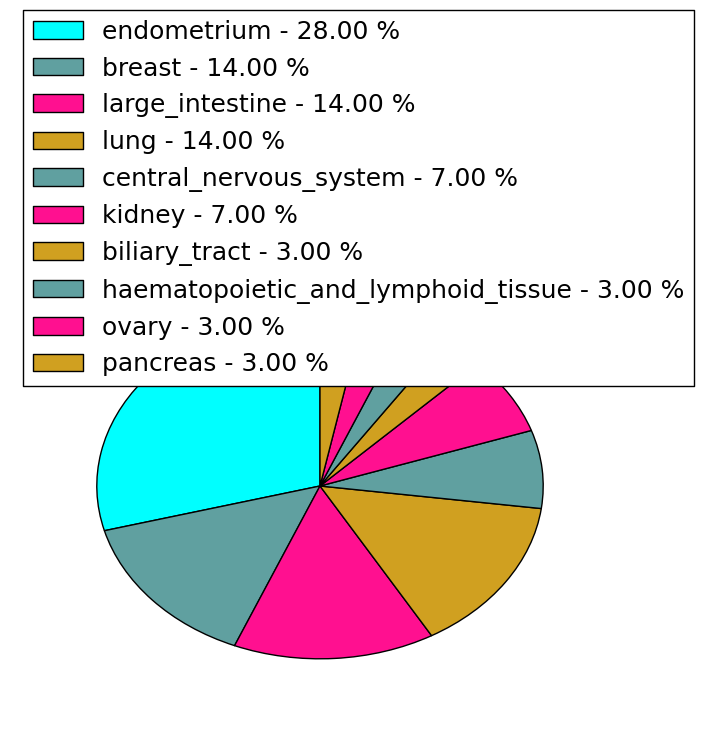
| Mutations for CASC3 |
| * Under tables are showing count per each tissue to give us broad intuition about tissue specific mutation patterns.You can go to the detailed page for each mutation database's web site. |
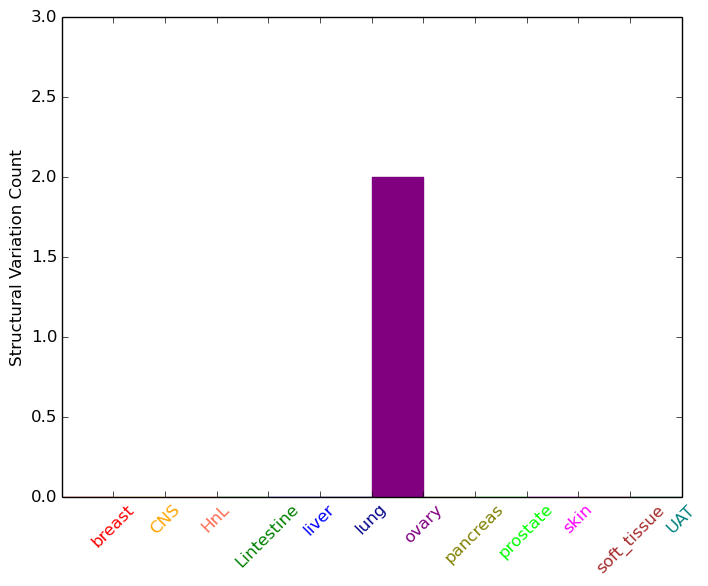
| - Statistics for Tissue and Mutation type | Top |
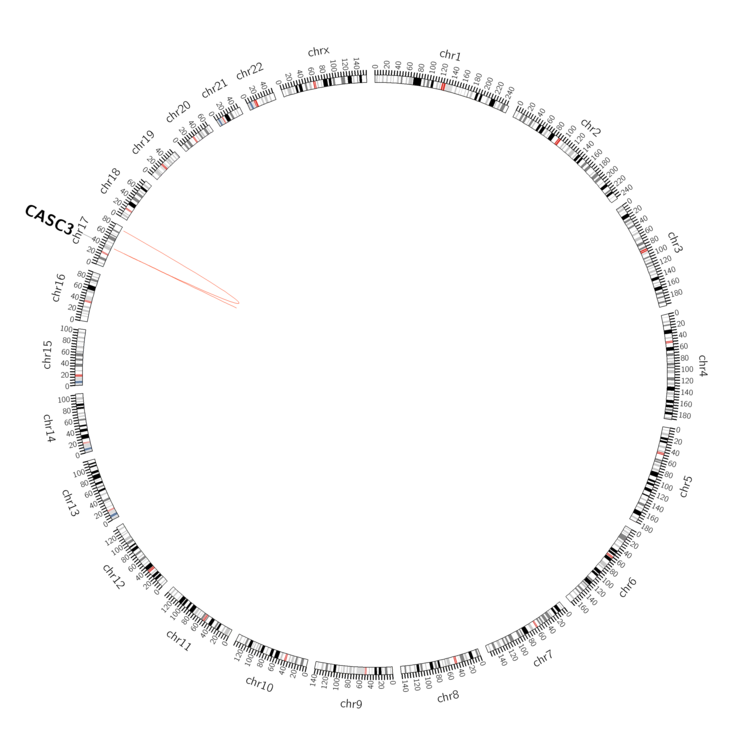 |
| - For Inter-chromosomal Variations |
| There's no inter-chromosomal structural variation. |
| - For Intra-chromosomal Variations |
| * Intra-chromosomal variantions includes 'intrachromosomal amplicon to amplicon', 'intrachromosomal amplicon to non-amplified dna', 'intrachromosomal deletion', 'intrachromosomal fold-back inversion', 'intrachromosomal inversion', 'intrachromosomal tandem duplication', 'Intrachromosomal unknown type', 'intrachromosomal with inverted orientation', 'intrachromosomal with non-inverted orientation'. |
 |
| Sample | Symbol_a | Chr_a | Start_a | End_a | Symbol_b | Chr_b | Start_b | End_b |
| ovary | CASC3 | chr17 | 38302338 | 38302358 | chr17 | 76252053 | 76252073 | |
| ovary | CASC3 | chr17 | 38309671 | 38309691 | CASC3 | chr17 | 38314443 | 38314463 |
| cf) Tissue number; Tissue name (1;Breast, 2;Central_nervous_system, 3;Haematopoietic_and_lymphoid_tissue, 4;Large_intestine, 5;Liver, 6;Lung, 7;Ovary, 8;Pancreas, 9;Prostate, 10;Skin, 11;Soft_tissue, 12;Upper_aerodigestive_tract) |
| * From mRNA Sanger sequences, Chitars2.0 arranged chimeric transcripts. This table shows CASC3 related fusion information. |
| ID | Head Gene | Tail Gene | Accession | Gene_a | qStart_a | qEnd_a | Chromosome_a | tStart_a | tEnd_a | Gene_a | qStart_a | qEnd_a | Chromosome_a | tStart_a | tEnd_a |
| AI206204 | IQCD | 5 | 174 | 12 | 113633251 | 113633420 | CASC3 | 167 | 460 | 17 | 38327416 | 38327709 | |
| BF750860 | CASC3 | 10 | 67 | 17 | 38328074 | 38328133 | CTDSP1 | 62 | 431 | 2 | 219270222 | 219270592 | |
| AW377350 | CASC3 | 8 | 145 | 17 | 38323498 | 38323637 | EXOSC10 | 145 | 643 | 1 | 11140178 | 11140691 | |
| AW377331 | CASC3 | 11 | 148 | 17 | 38323498 | 38323637 | EXOSC10 | 146 | 611 | 1 | 11140175 | 11140646 | |
| AA190703 | CASC3 | 1 | 106 | 17 | 38327833 | 38327938 | CASC3 | 105 | 389 | 17 | 38327907 | 38328188 | |
| AW377333 | CASC3 | 10 | 148 | 17 | 38323497 | 38323637 | EXOSC10 | 145 | 645 | 1 | 11140175 | 11140691 | |
| Top |
| Mutation type/ Tissue ID | brca | cns | cerv | endome | haematopo | kidn | Lintest | liver | lung | ns | ovary | pancre | prost | skin | stoma | thyro | urina | |||
| Total # sample | 2 | 1 | ||||||||||||||||||
| GAIN (# sample) | 2 | |||||||||||||||||||
| LOSS (# sample) | 1 |
| cf) Tissue ID; Tissue type (1; Breast, 2; Central_nervous_system, 3; Cervix, 4; Endometrium, 5; Haematopoietic_and_lymphoid_tissue, 6; Kidney, 7; Large_intestine, 8; Liver, 9; Lung, 10; NS, 11; Ovary, 12; Pancreas, 13; Prostate, 14; Skin, 15; Stomach, 16; Thyroid, 17; Urinary_tract) |
| Top |
|
 |
| Top |
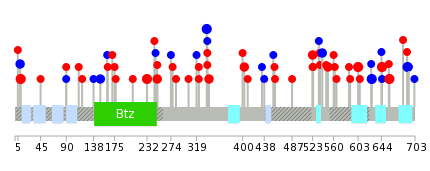
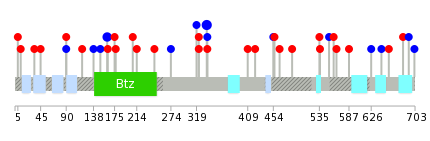
| Stat. for Non-Synonymous SNVs (# total SNVs=28) | (# total SNVs=17) |
 |  |
(# total SNVs=0) | (# total SNVs=0) |
| Top |
| * When you move the cursor on each content, you can see more deailed mutation information on the Tooltip. Those are primary_site,primary_histology,mutation(aa),pubmedID. |
| GRCh37 position | Mutation(aa) | Unique sampleID count |
| chr17:38324639-38324639 | p.P645L | 3 |
| chr17:38325584-38325584 | p.S658L | 3 |
| chr17:38319064-38319064 | p.S232F | 3 |
| chr17:38324513-38324513 | p.P603L | 3 |
| chr17:38296830-38296830 | p.S10L | 3 |
| chr17:38325681-38325681 | p.I690I | 3 |
| chr17:38319959-38319959 | p.G337G | 3 |
| chr17:38324586-38324586 | p.V627V | 3 |
| chr17:38323862-38323862 | p.P550S | 2 |
| chr17:38319969-38319969 | p.E341K | 2 |
| Top |
|
 |
| Point Mutation/ Tissue ID | 1 | 2 | 3 | 4 | 5 | 6 | 7 | 8 | 9 | 10 | 11 | 12 | 13 | 14 | 15 | 16 | 17 | 18 | 19 | 20 |
| # sample | 3 | 1 | 1 | 4 | 1 | 2 | 1 | 6 | 1 | 1 | 7 | 4 | 1 | 9 | ||||||
| # mutation | 3 | 1 | 1 | 4 | 1 | 2 | 1 | 6 | 1 | 1 | 8 | 4 | 1 | 9 | ||||||
| nonsynonymous SNV | 2 | 1 | 1 | 1 | 1 | 3 | 1 | 6 | 3 | 7 | ||||||||||
| synonymous SNV | 1 | 3 | 2 | 1 | 3 | 1 | 2 | 1 | 1 | 2 |
| cf) Tissue ID; Tissue type (1; BLCA[Bladder Urothelial Carcinoma], 2; BRCA[Breast invasive carcinoma], 3; CESC[Cervical squamous cell carcinoma and endocervical adenocarcinoma], 4; COAD[Colon adenocarcinoma], 5; GBM[Glioblastoma multiforme], 6; Glioma Low Grade, 7; HNSC[Head and Neck squamous cell carcinoma], 8; KICH[Kidney Chromophobe], 9; KIRC[Kidney renal clear cell carcinoma], 10; KIRP[Kidney renal papillary cell carcinoma], 11; LAML[Acute Myeloid Leukemia], 12; LUAD[Lung adenocarcinoma], 13; LUSC[Lung squamous cell carcinoma], 14; OV[Ovarian serous cystadenocarcinoma ], 15; PAAD[Pancreatic adenocarcinoma], 16; PRAD[Prostate adenocarcinoma], 17; SKCM[Skin Cutaneous Melanoma], 18:STAD[Stomach adenocarcinoma], 19:THCA[Thyroid carcinoma], 20:UCEC[Uterine Corpus Endometrial Carcinoma]) |
| Top |
| * We represented just top 10 SNVs. When you move the cursor on each content, you can see more deailed mutation information on the Tooltip. Those are primary_site, primary_histology, mutation(aa), pubmedID. |
| Genomic Position | Mutation(aa) | Unique sampleID count |
| chr17:38319959 | p.G337G | 3 |
| chr17:38318284 | p.V162V | 2 |
| chr17:38320408 | p.P454P | 1 |
| chr17:38325687 | p.G163D | 1 |
| chr17:38318122 | p.D456Y | 1 |
| chr17:38319915 | p.D465N | 1 |
| chr17:38323817 | p.D175N | 1 |
| chr17:38325868 | p.R487L | 1 |
| chr17:38318158 | p.K177N | 1 |
| chr17:38319916 | p.A535T | 1 |
| * Copy number data were extracted from TCGA using R package TCGA-Assembler. The URLs of all public data files on TCGA DCC data server were gathered on Jan-05-2015. Function ProcessCNAData in TCGA-Assembler package was used to obtain gene-level copy number value which is calculated as the average copy number of the genomic region of a gene. |
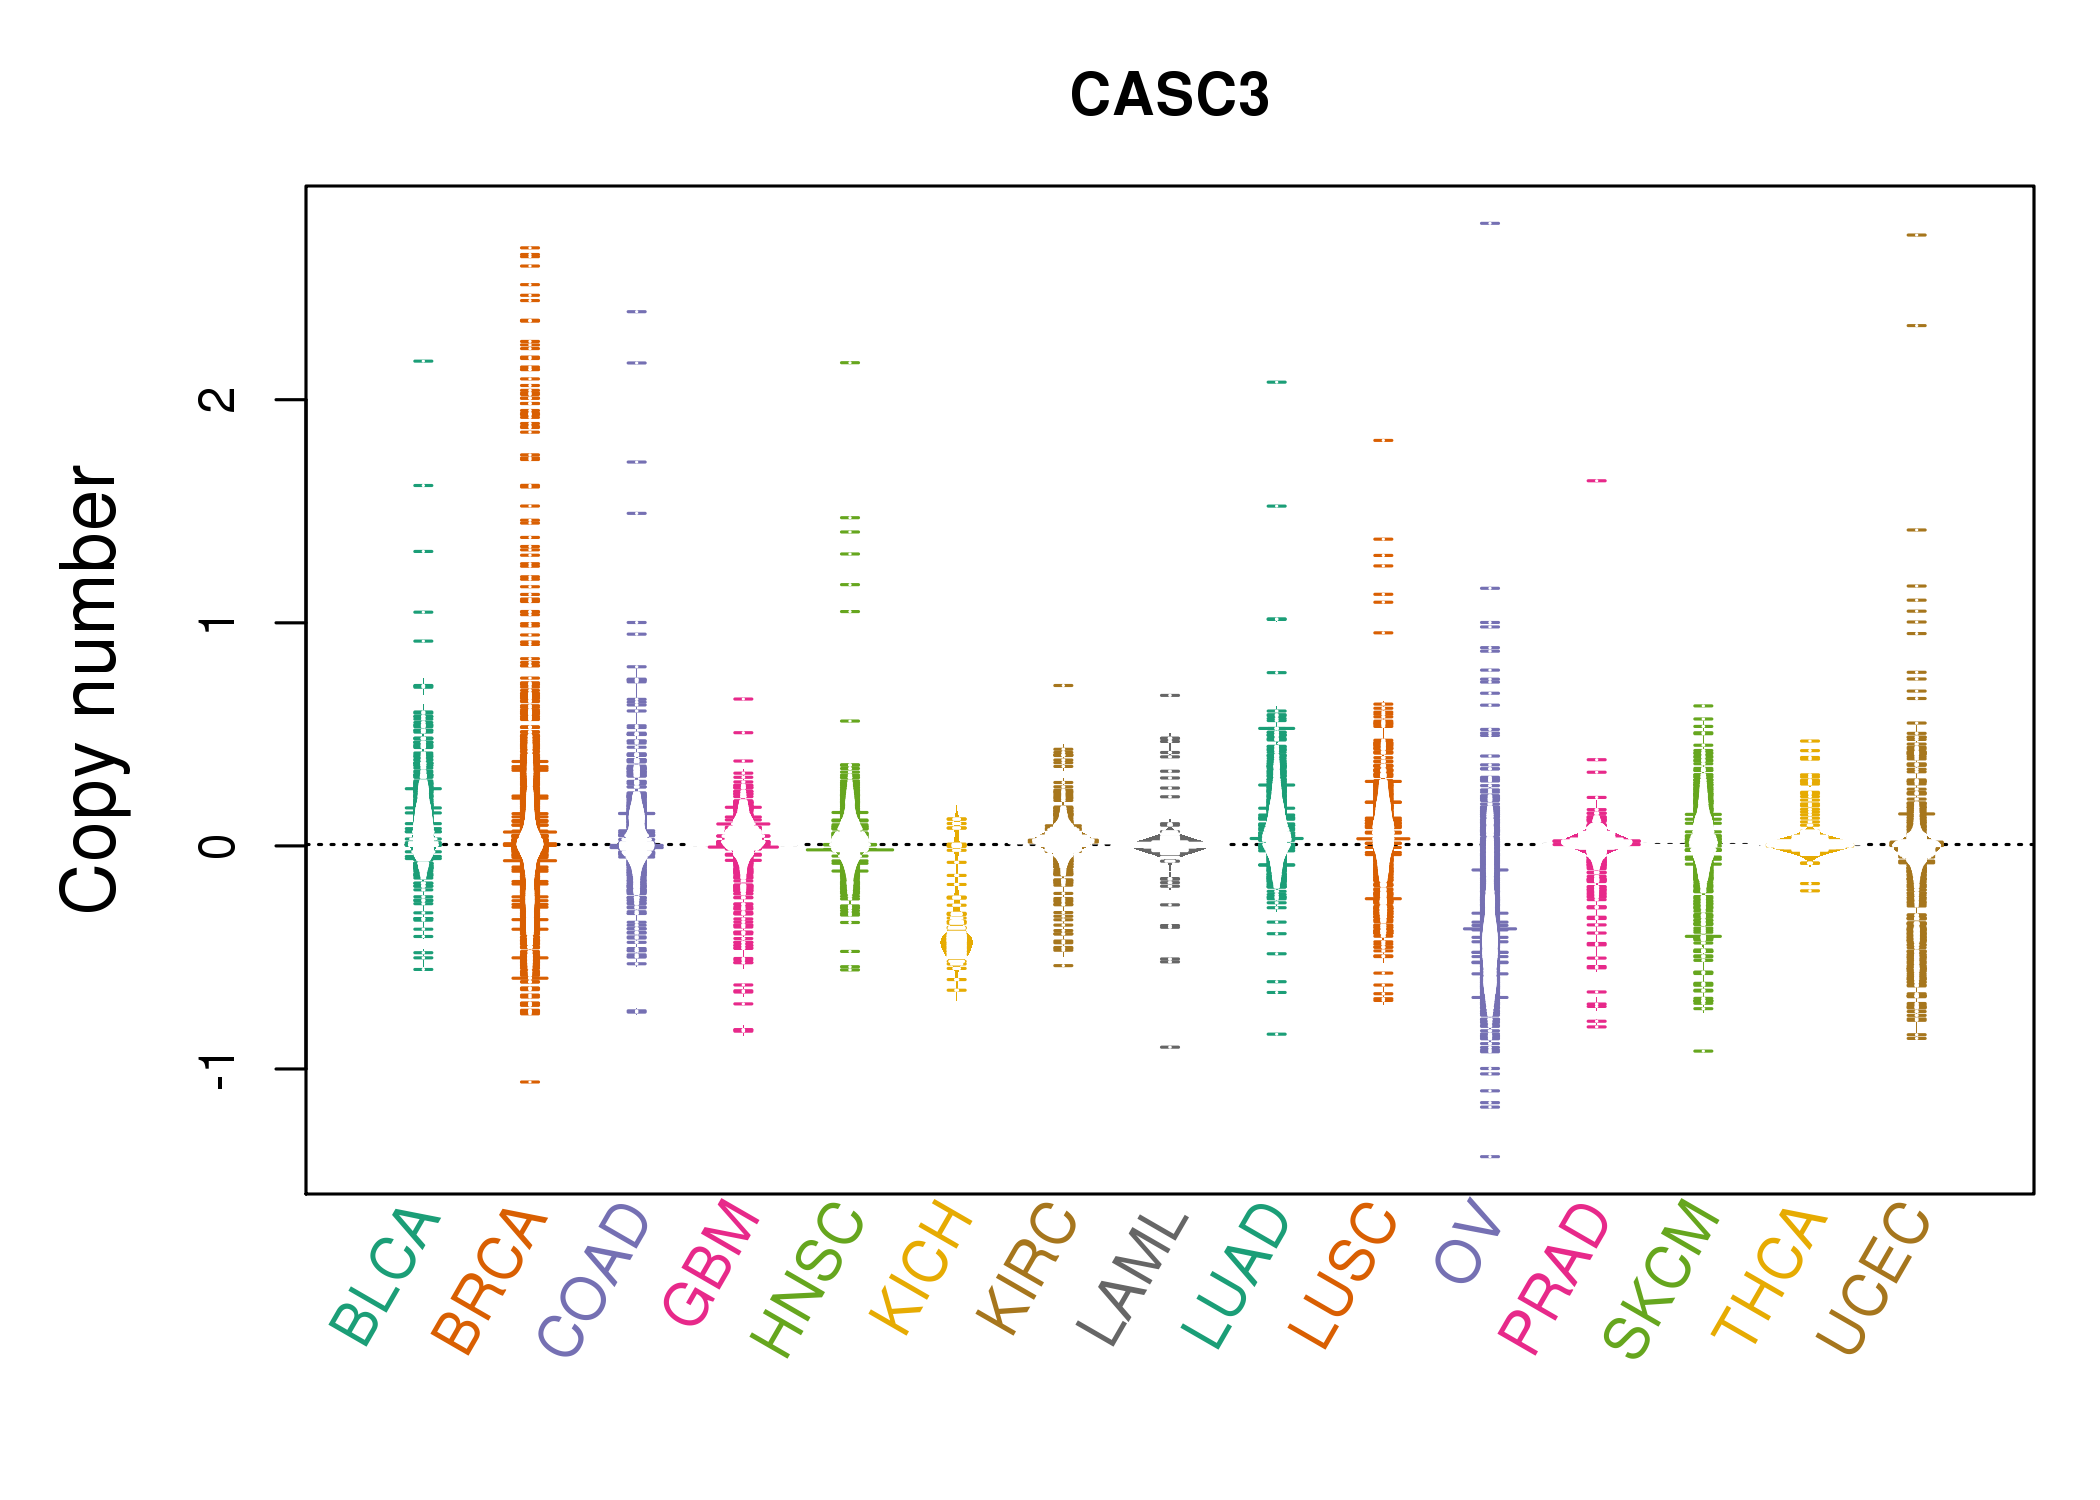 |
| cf) Tissue ID[Tissue type]: BLCA[Bladder Urothelial Carcinoma], BRCA[Breast invasive carcinoma], CESC[Cervical squamous cell carcinoma and endocervical adenocarcinoma], COAD[Colon adenocarcinoma], GBM[Glioblastoma multiforme], Glioma Low Grade, HNSC[Head and Neck squamous cell carcinoma], KICH[Kidney Chromophobe], KIRC[Kidney renal clear cell carcinoma], KIRP[Kidney renal papillary cell carcinoma], LAML[Acute Myeloid Leukemia], LUAD[Lung adenocarcinoma], LUSC[Lung squamous cell carcinoma], OV[Ovarian serous cystadenocarcinoma ], PAAD[Pancreatic adenocarcinoma], PRAD[Prostate adenocarcinoma], SKCM[Skin Cutaneous Melanoma], STAD[Stomach adenocarcinoma], THCA[Thyroid carcinoma], UCEC[Uterine Corpus Endometrial Carcinoma] |
| Top |
| Gene Expression for CASC3 |
| * CCLE gene expression data were extracted from CCLE_Expression_Entrez_2012-10-18.res: Gene-centric RMA-normalized mRNA expression data. |
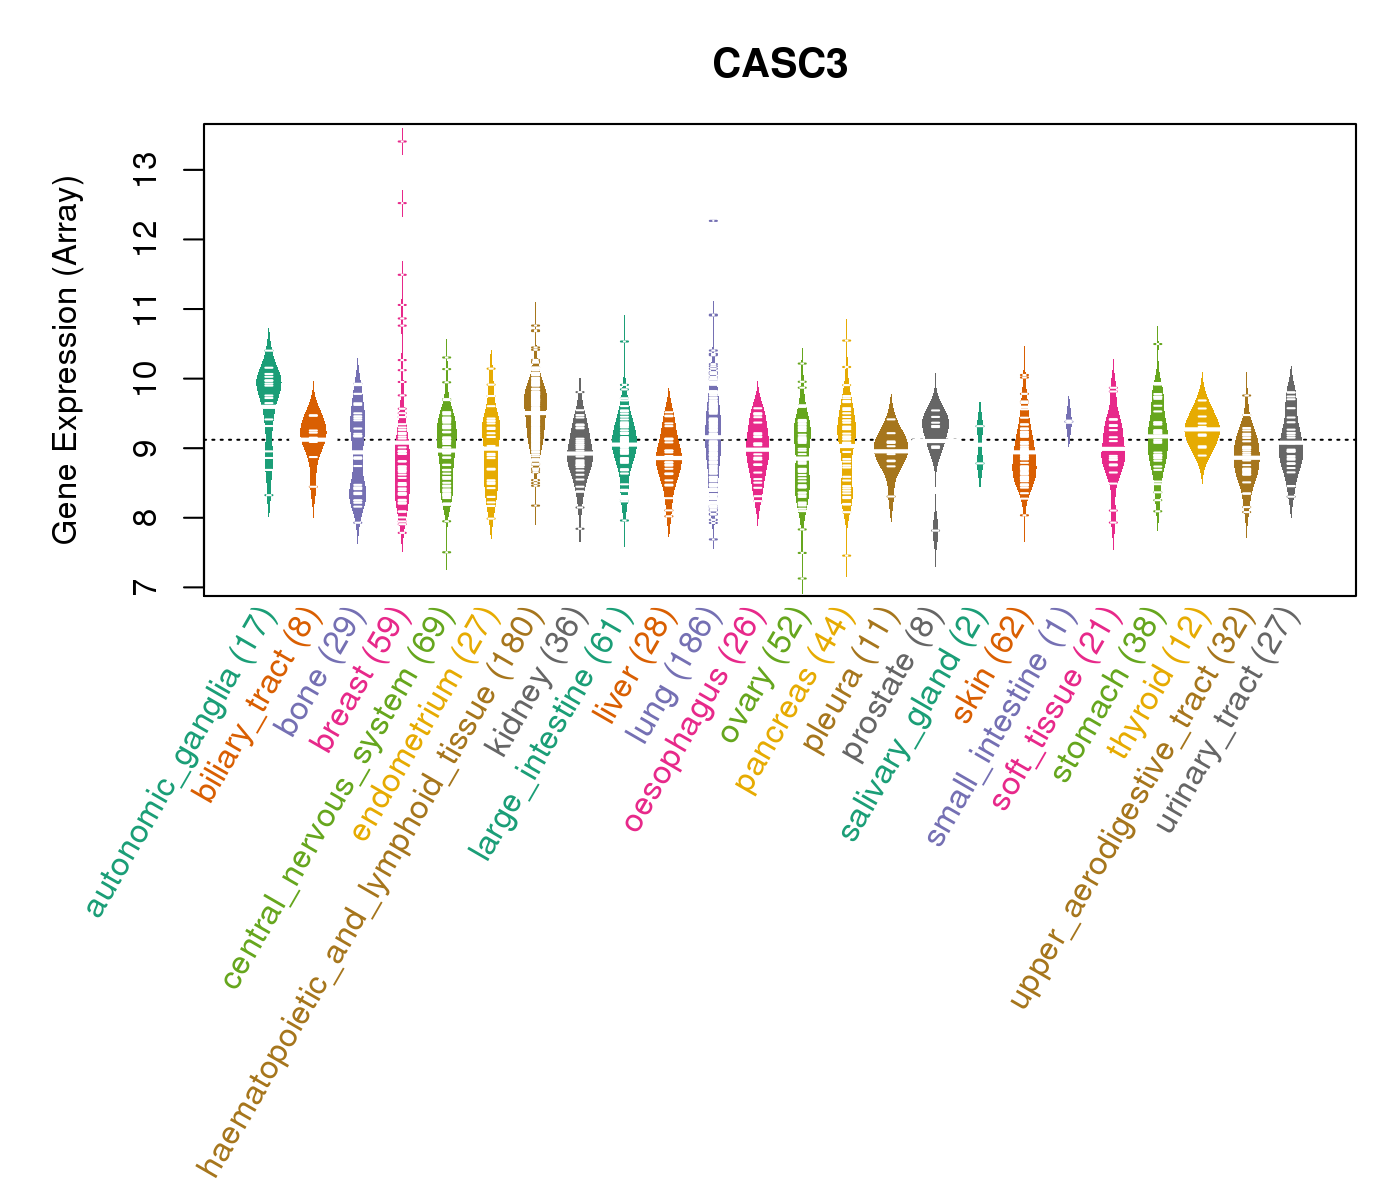 |
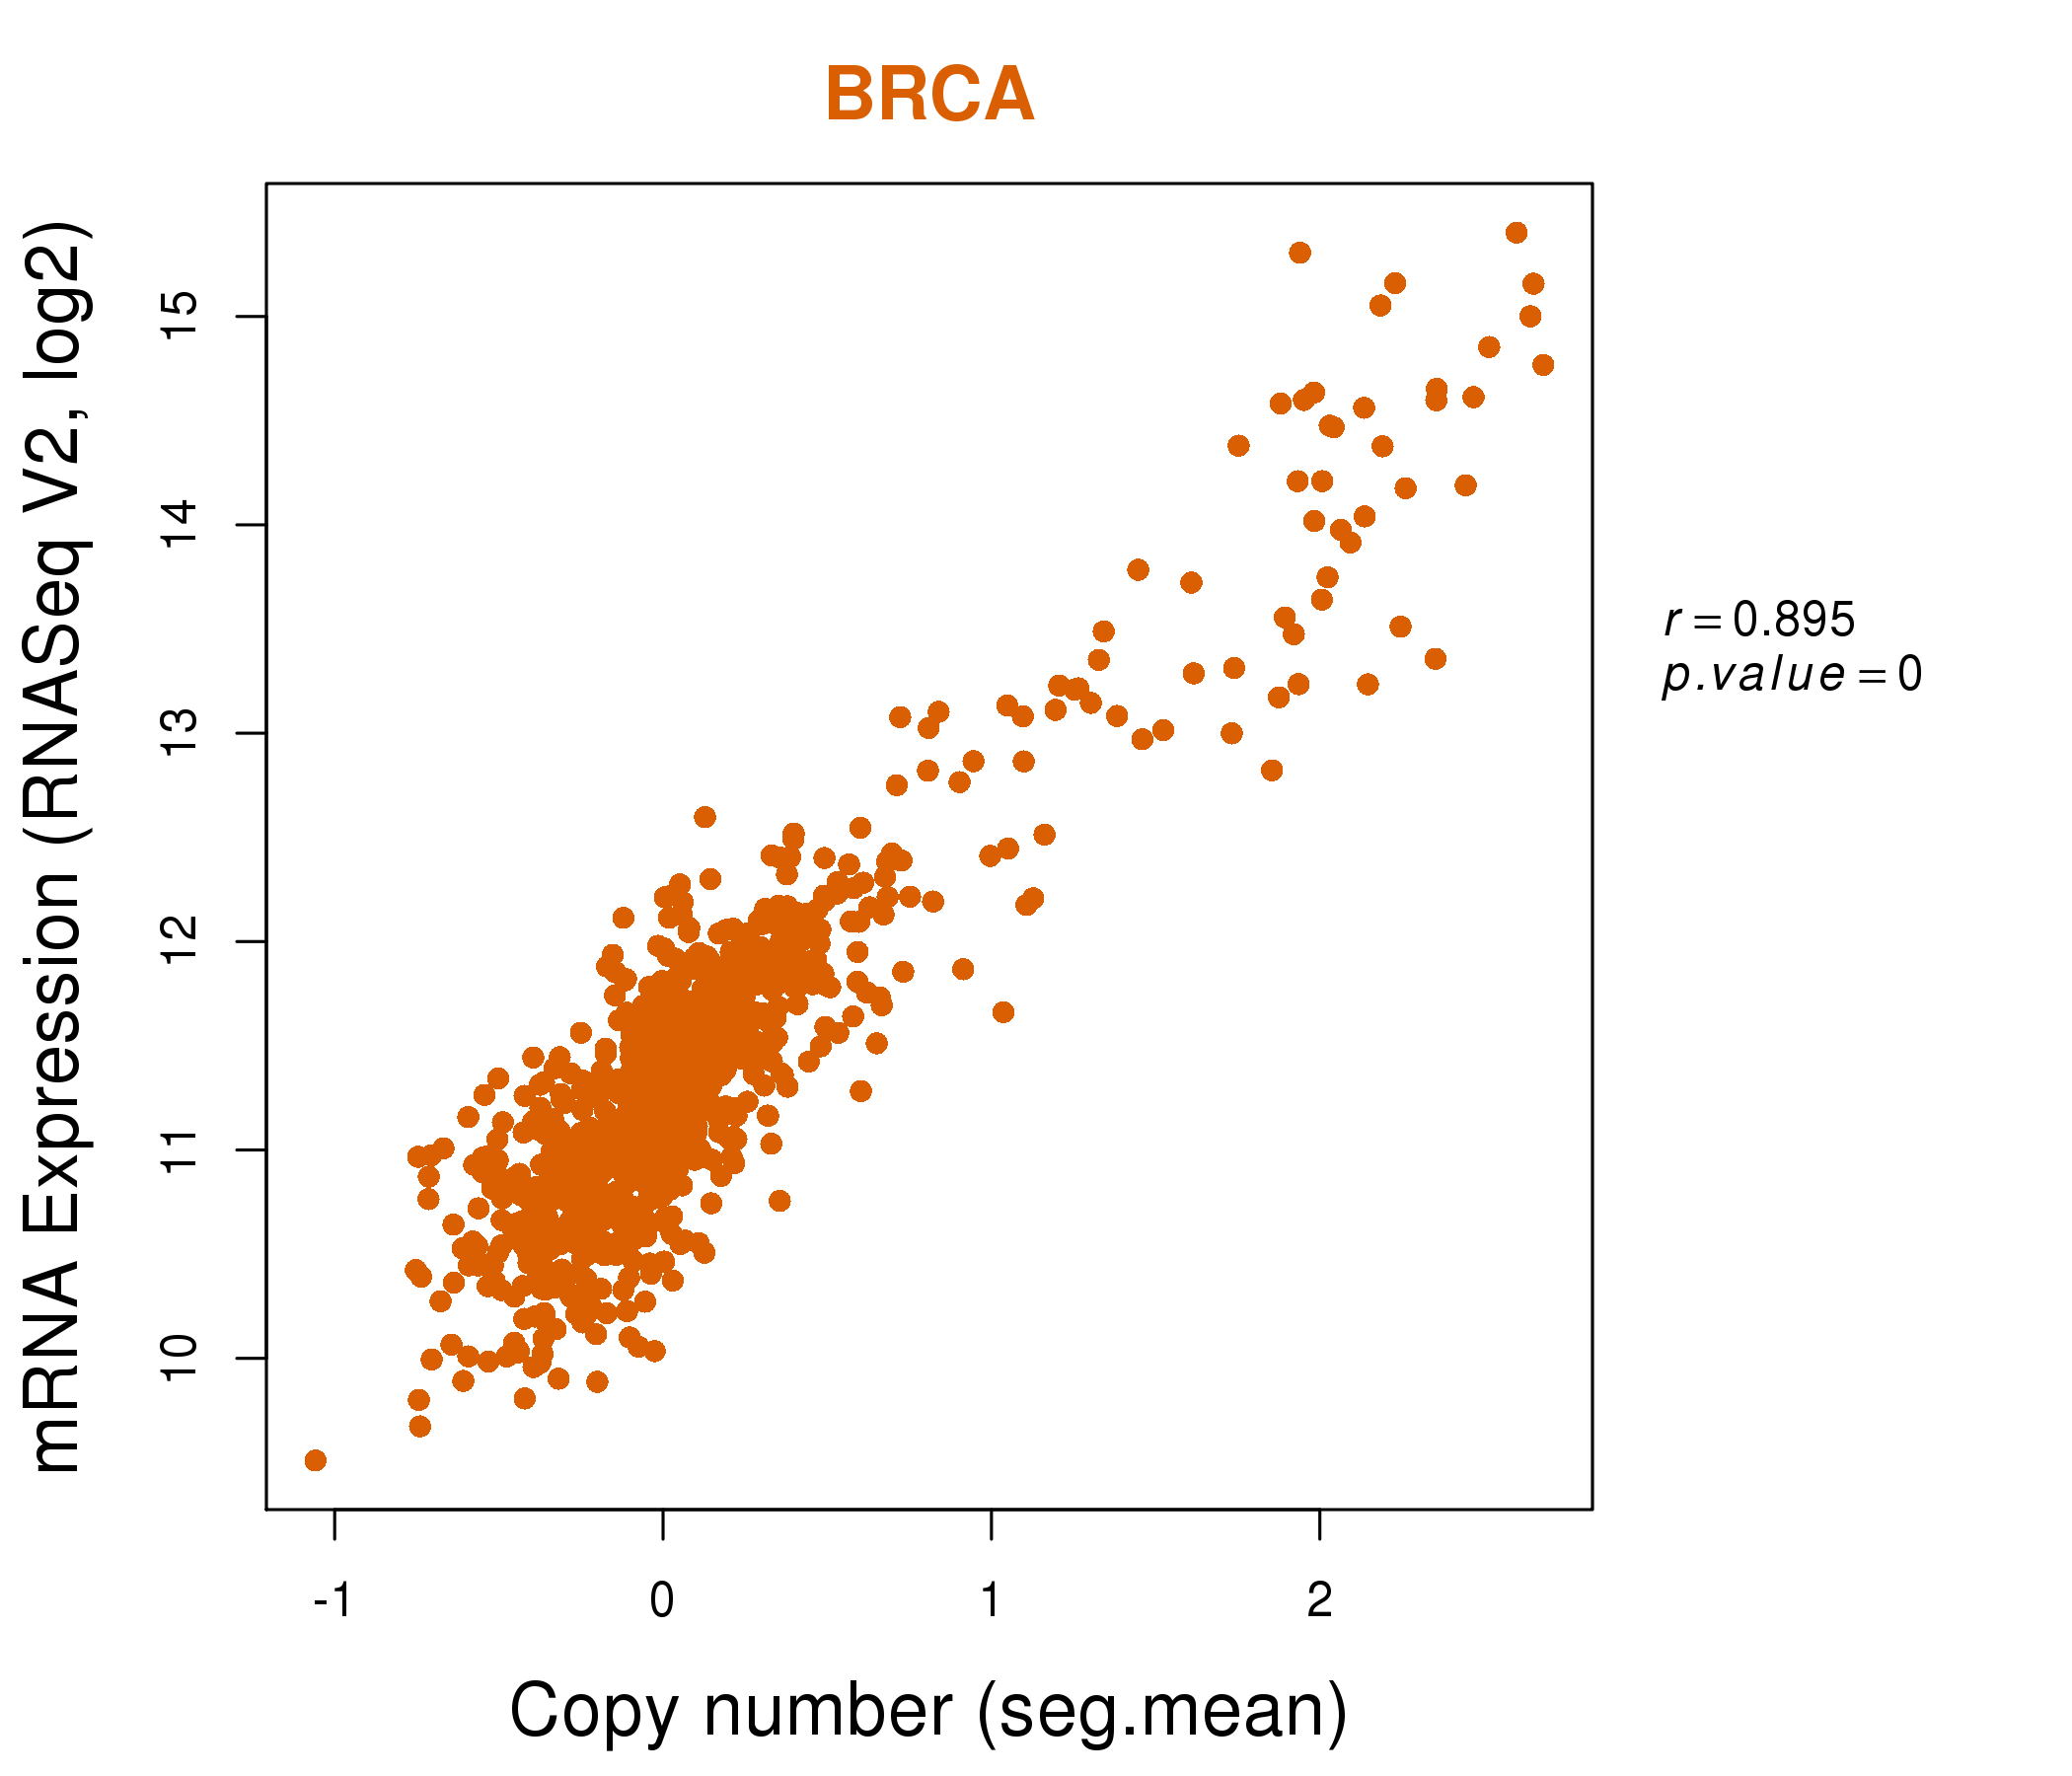
| * Normalized gene expression data of RNASeqV2 was extracted from TCGA using R package TCGA-Assembler. The URLs of all public data files on TCGA DCC data server were gathered at Jan-05-2015. Only eight cancer types have enough normal control samples for differential expression analysis. (t test, adjusted p<0.05 (using Benjamini-Hochberg FDR)) |
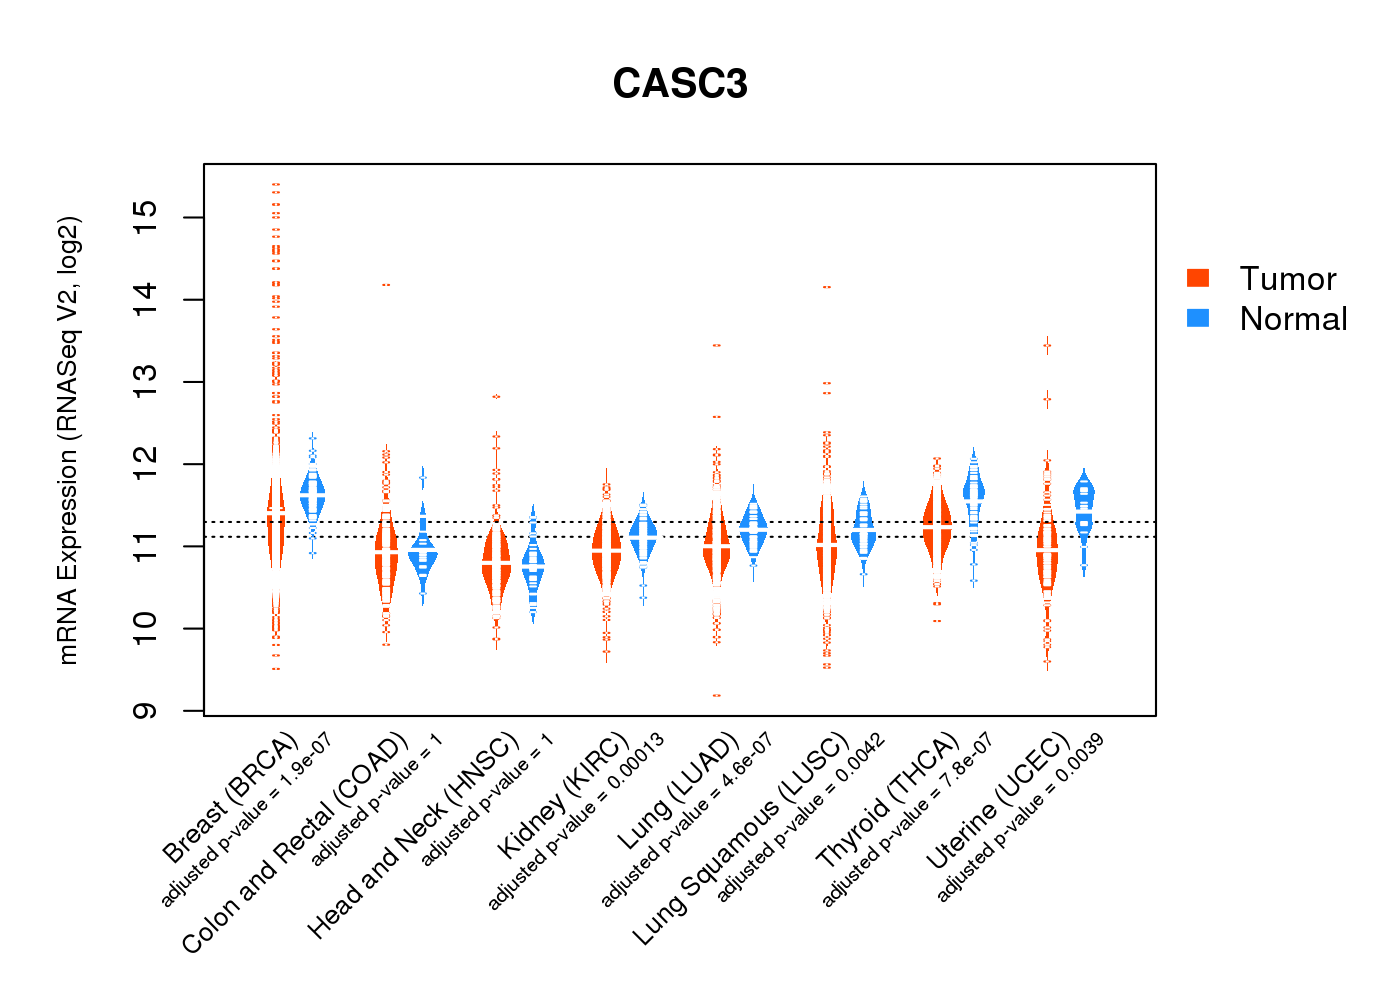 |
| Top |
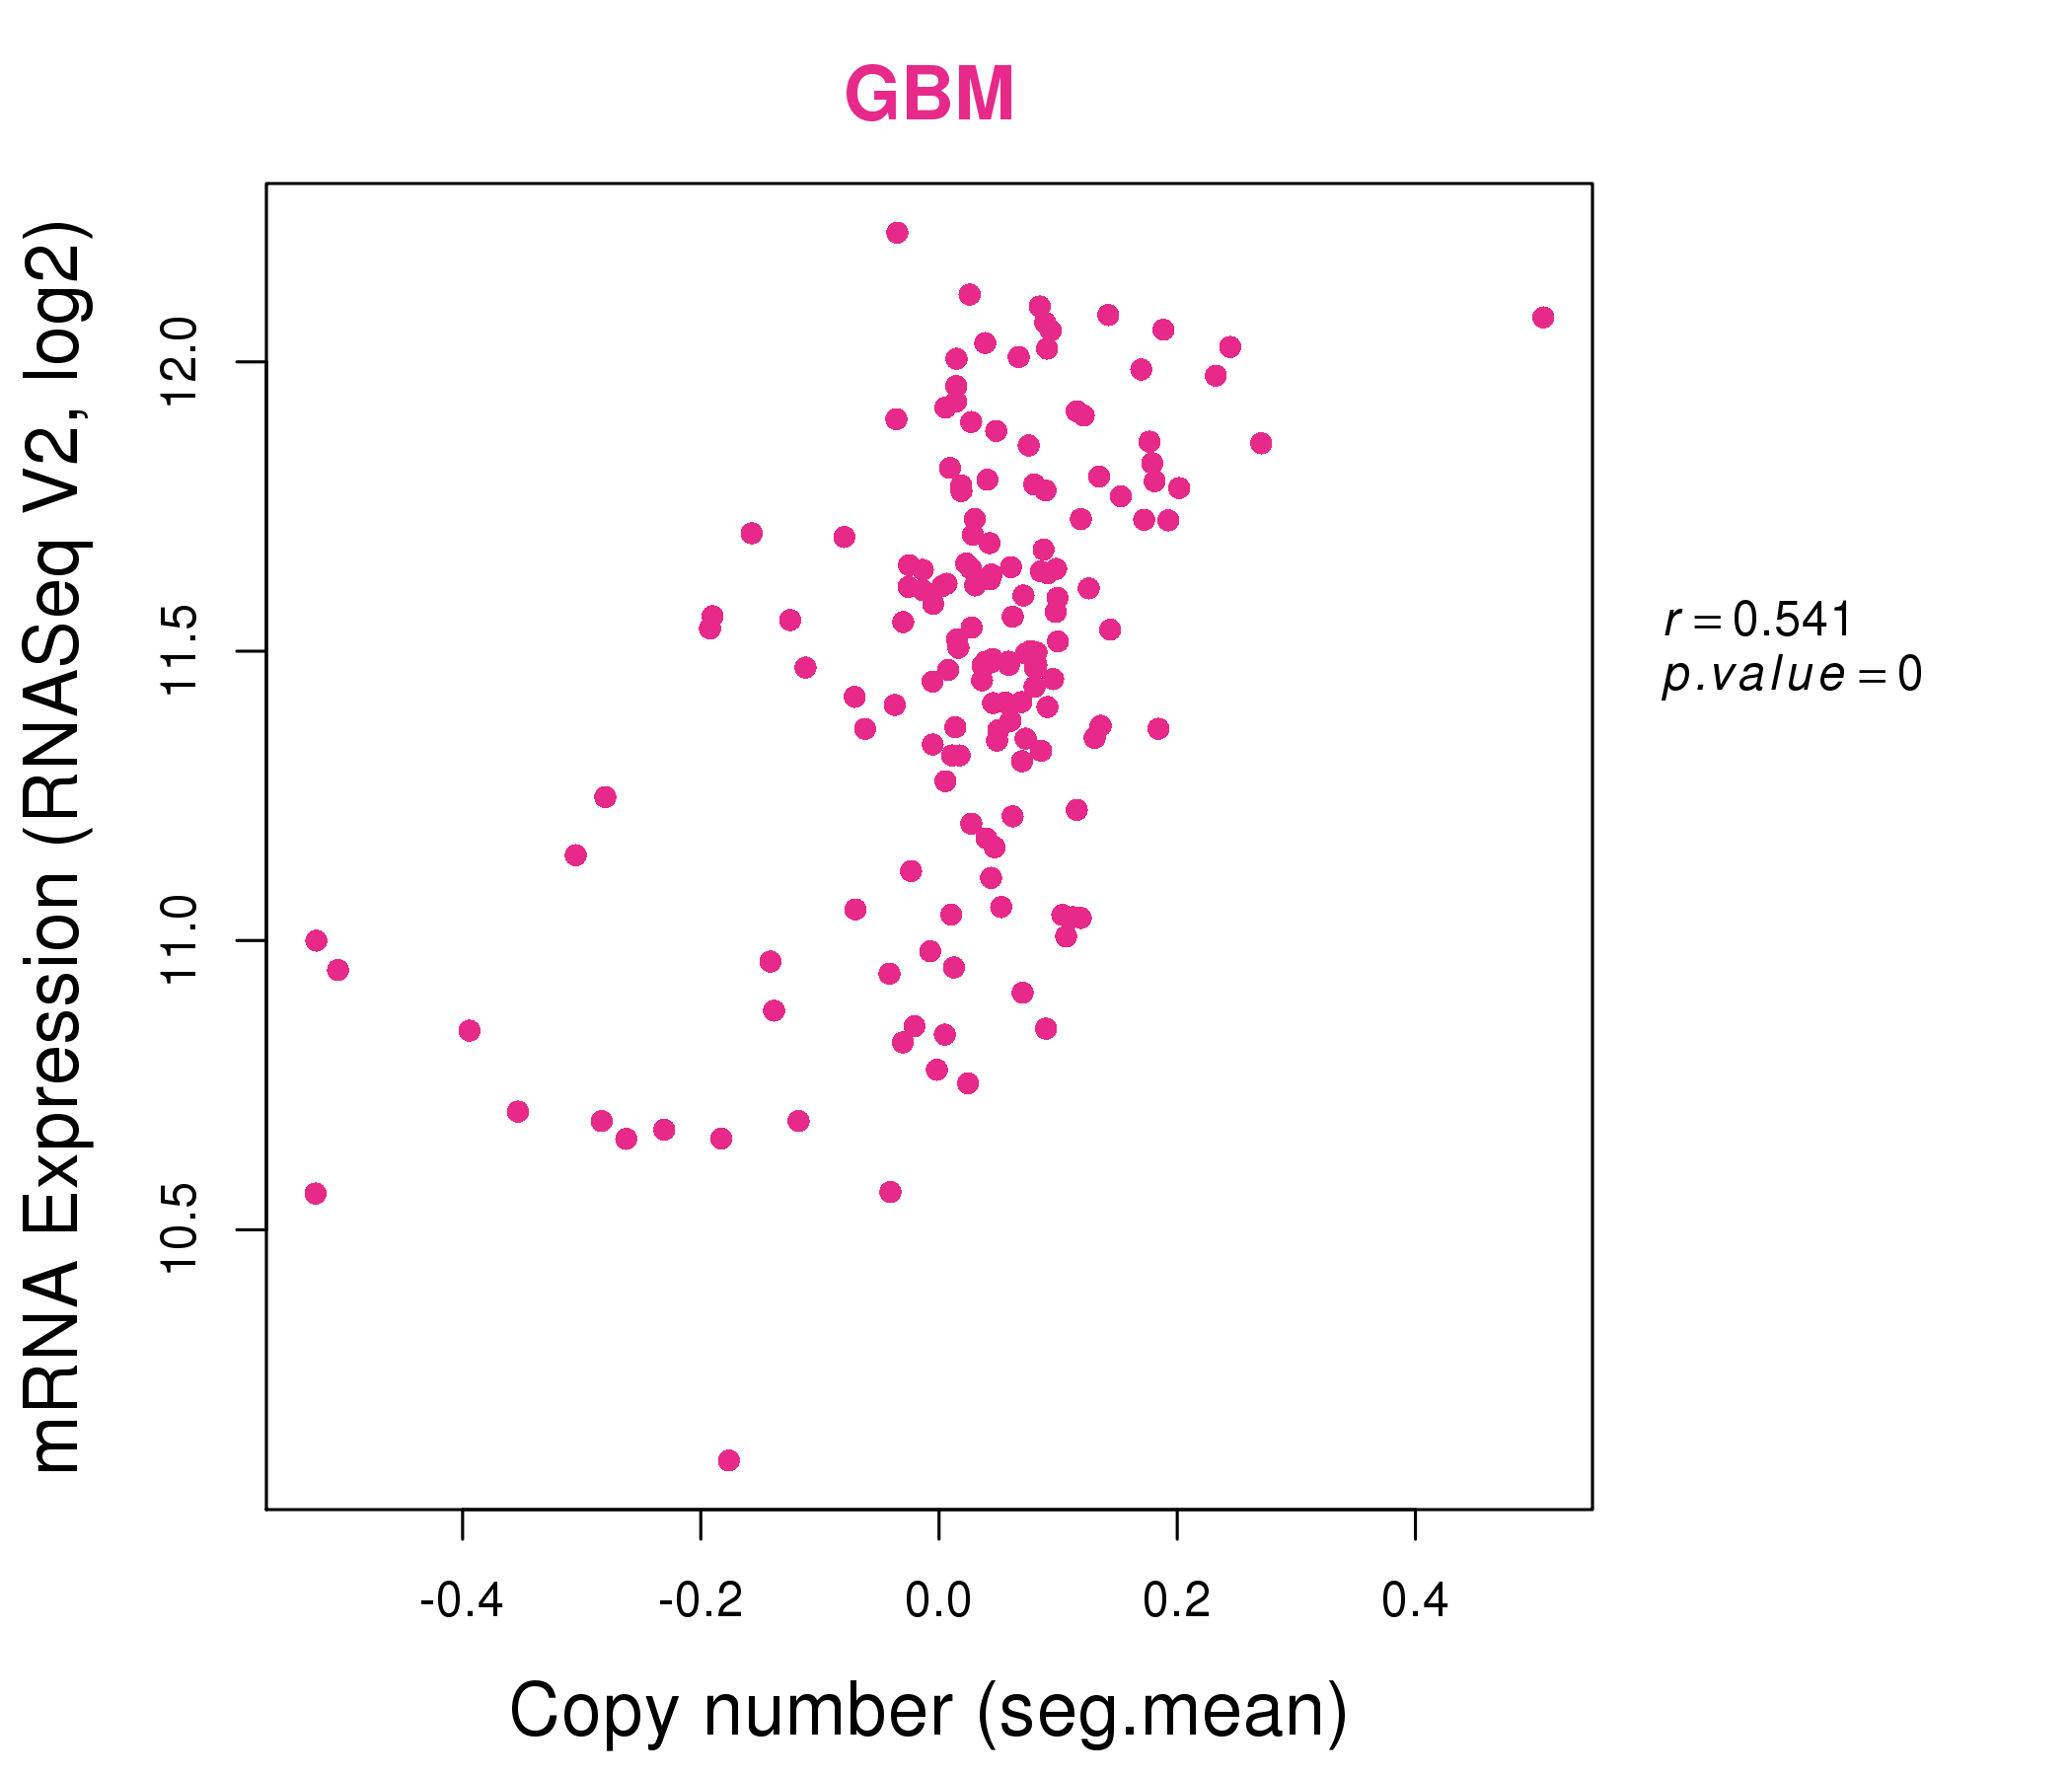
| * This plots show the correlation between CNV and gene expression. |
: Open all plots for all cancer types
 |
|
 |
|
| Top |
| Gene-Gene Network Information |
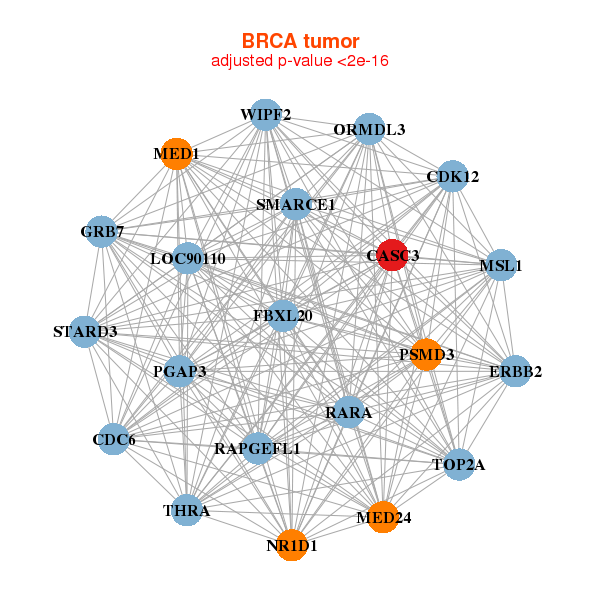
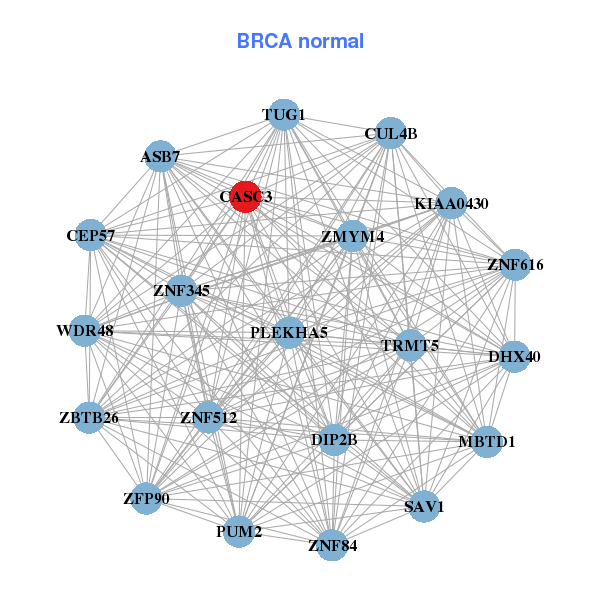
| * Co-Expression network figures were drawn using R package igraph. Only the top 20 genes with the highest correlations were shown. Red circle: input gene, orange circle: cell metabolism gene, sky circle: other gene |
: Open all plots for all cancer types
 |
|
| CASC3,CDC6,CDK12,ERBB2,FBXL20,GRB7,LOC90110, MED1,MED24,MSL1,NR1D1,ORMDL3,PGAP3,PSMD3, RAPGEFL1,RARA,SMARCE1,STARD3,THRA,TOP2A,WIPF2 | ASB7,CASC3,CEP57,CUL4B,DHX40,DIP2B,KIAA0430, MBTD1,PLEKHA5,PUM2,SAV1,TRMT5,TUG1,WDR48, ZBTB26,ZFP90,ZMYM4,ZNF345,ZNF512,ZNF616,ZNF84 |
 |
|
| MIEN1,CASC3,CDC6,ERBB2,GRB7,MED24,MSL1, NDUFC2,ORMDL3,PGAP3,PPP1R1B,PSMD3,RAPGEFL1,RARA, SMARCE1,SNX32,TCAP,THRA,TOP2A,UGT1A8,WIPF2 | VSTM4,CASC3,CRTC3,DIP2C,DSTYK,EVC,FRMD4A, FYCO1,GLI2,LRIG1,NFIC,NFIX,NPR2,NR2F2, PIP4K2B,RUNX1T1,STAT5B,TRPS1,WDR35,ZBTB4,ZFYVE20 |
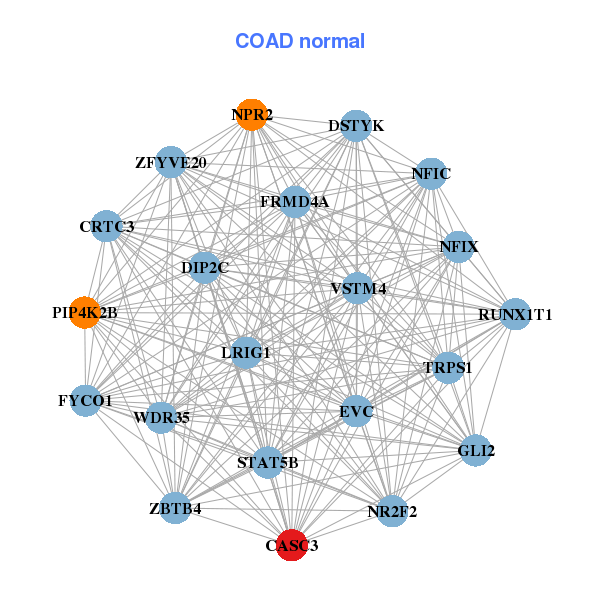
| * Co-Expression network figures were drawn using R package igraph. Only the top 20 genes with the highest correlations were shown. Red circle: input gene, orange circle: cell metabolism gene, sky circle: other gene |
: Open all plots for all cancer types
| Top |
: Open all interacting genes' information including KEGG pathway for all interacting genes from DAVID
| Top |
| Pharmacological Information for CASC3 |
| There's no related Drug. |
| Top |
| Cross referenced IDs for CASC3 |
| * We obtained these cross-references from Uniprot database. It covers 150 different DBs, 18 categories. http://www.uniprot.org/help/cross_references_section |
: Open all cross reference information
|
Copyright © 2016-Present - The Univsersity of Texas Health Science Center at Houston @ |