|
||||||||||||||||||||||||||||||||||||||||||||||||||||||||||||||||||||||||||||||||||||||||||||||||||||||||||||||||||||||||||||||||||||||||||||||||||||||||||||||||||||||||||||||||||||||||||||||||||||||||||||||||||||||||||||||||||||||||||||||||||||||||||||||||||||||||||||||||||||||||||||||||||||||||||||||||||||||||||
| |
| Phenotypic Information (metabolism pathway, cancer, disease, phenome) |
| |
| |
| Gene-Gene Network Information: Co-Expression Network, Interacting Genes & KEGG |
| |
|


| Gene Summary for CHSY1 |
| Basic gene info. | Gene symbol | CHSY1 |
| Gene name | chondroitin sulfate synthase 1 | |
| Synonyms | CHSY|CSS1|ChSy-1|TPBS | |
| Cytomap | UCSC genome browser: 15q26.3 | |
| Genomic location | chr15 :101715927-101792137 | |
| Type of gene | protein-coding | |
| RefGenes | NM_014918.4, | |
| Ensembl id | ENSG00000131873 | |
| Description | N-acetylgalactosaminyl-proteoglycan 3-beta-glucuronosyltransferase 1N-acetylgalactosaminyltransferase IIcarbohydrate synthase 1chondroitin glucuronyltransferase 1chondroitin glucuronyltransferase IIchondroitin synthase 1glucuronosyl-N-acetylgalactos | |
| Modification date | 20141207 | |
| dbXrefs | MIM : 608183 | |
| HGNC : HGNC | ||
| Ensembl : ENSG00000131873 | ||
| HPRD : 10493 | ||
| Vega : OTTHUMG00000149873 | ||
| Protein | UniProt: go to UniProt's Cross Reference DB Table | |
| Expression | CleanEX: HS_CHSY1 | |
| BioGPS: 22856 | ||
| Gene Expression Atlas: ENSG00000131873 | ||
| The Human Protein Atlas: ENSG00000131873 | ||
| Pathway | NCI Pathway Interaction Database: CHSY1 | |
| KEGG: CHSY1 | ||
| REACTOME: CHSY1 | ||
| ConsensusPathDB | ||
| Pathway Commons: CHSY1 | ||
| Metabolism | MetaCyc: CHSY1 | |
| HUMANCyc: CHSY1 | ||
| Regulation | Ensembl's Regulation: ENSG00000131873 | |
| miRBase: chr15 :101,715,927-101,792,137 | ||
| TargetScan: NM_014918 | ||
| cisRED: ENSG00000131873 | ||
| Context | iHOP: CHSY1 | |
| cancer metabolism search in PubMed: CHSY1 | ||
| UCL Cancer Institute: CHSY1 | ||
| Assigned class in ccmGDB | C | |
| Top |
| Phenotypic Information for CHSY1(metabolism pathway, cancer, disease, phenome) |
| Cancer | CGAP: CHSY1 |
| Familial Cancer Database: CHSY1 | |
| * This gene is included in those cancer gene databases. |
|
|
|
|
|
|
| ||||||||||||||||||||||||||||||||||||||||||||||||||||||||||||||||||||||||||||||||||||||||||||||||||||||||||||||||||||||||||||||||||||||||||||||||||||||||||||||||||||||||||||||||||||||||||||||||||||||||||||||||||||||||||||||||||||||||||||||||||||||||||||||||||||||||||||||||||||||||||||||||||||||||||||||||||||
Oncogene 1 | Significant driver gene in | |||||||||||||||||||||||||||||||||||||||||||||||||||||||||||||||||||||||||||||||||||||||||||||||||||||||||||||||||||||||||||||||||||||||||||||||||||||||||||||||||||||||||||||||||||||||||||||||||||||||||||||||||||||||||||||||||||||||||||||||||||||||||||||||||||||||||||||||||||||||||||||||||||||||||||||||||||||||||
| cf) number; DB name 1 Oncogene; http://nar.oxfordjournals.org/content/35/suppl_1/D721.long, 2 Tumor Suppressor gene; https://bioinfo.uth.edu/TSGene/, 3 Cancer Gene Census; http://www.nature.com/nrc/journal/v4/n3/abs/nrc1299.html, 4 CancerGenes; http://nar.oxfordjournals.org/content/35/suppl_1/D721.long, 5 Network of Cancer Gene; http://ncg.kcl.ac.uk/index.php, 1Therapeutic Vulnerabilities in Cancer; http://cbio.mskcc.org/cancergenomics/statius/ |
| REACTOME_METABOLISM_OF_CARBOHYDRATES | |
| OMIM | |
| Orphanet | |
| Disease | KEGG Disease: CHSY1 |
| MedGen: CHSY1 (Human Medical Genetics with Condition) | |
| ClinVar: CHSY1 | |
| Phenotype | MGI: CHSY1 (International Mouse Phenotyping Consortium) |
| PhenomicDB: CHSY1 | |
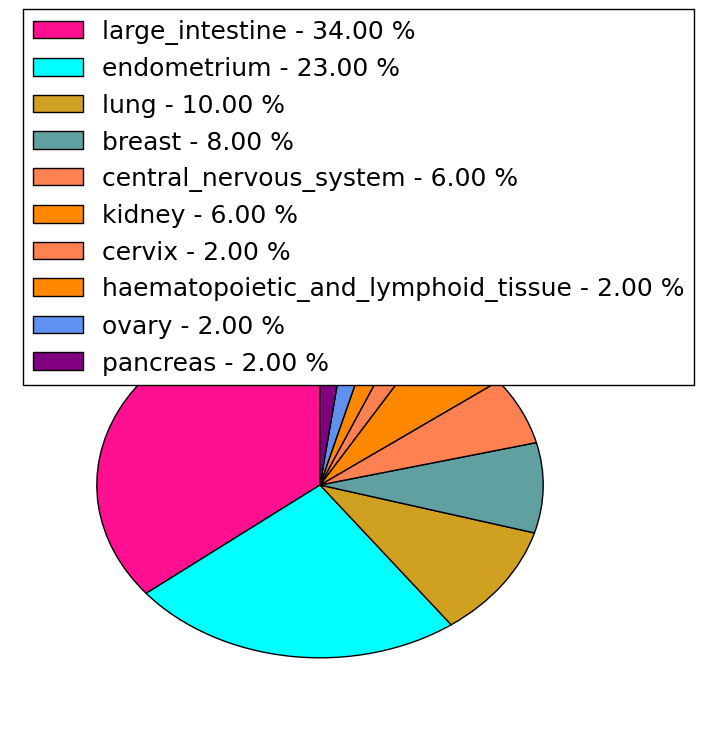
| Mutations for CHSY1 |
| * Under tables are showing count per each tissue to give us broad intuition about tissue specific mutation patterns.You can go to the detailed page for each mutation database's web site. |
| - Statistics for Tissue and Mutation type | Top |
 |
| - For Inter-chromosomal Variations |
| * Inter-chromosomal variantions includes 'interchromosomal amplicon to amplicon', 'interchromosomal amplicon to non-amplified dna', 'interchromosomal insertion', 'Interchromosomal unknown type'. |
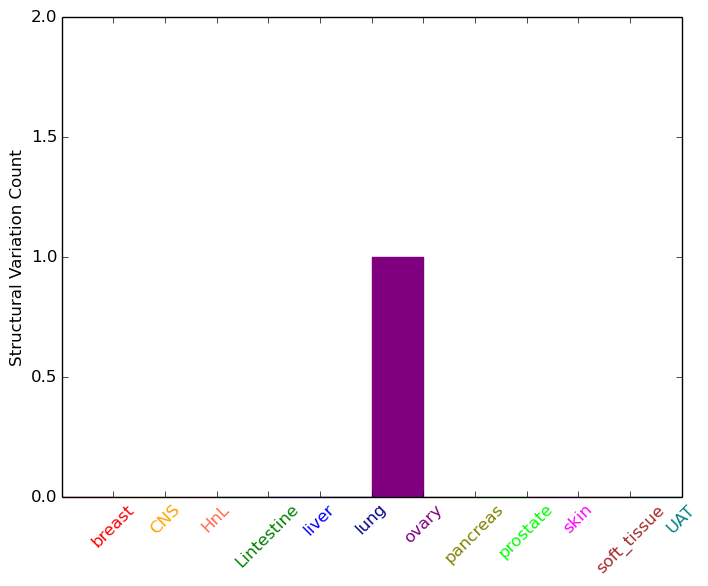 |
| - For Intra-chromosomal Variations |
| * Intra-chromosomal variantions includes 'intrachromosomal amplicon to amplicon', 'intrachromosomal amplicon to non-amplified dna', 'intrachromosomal deletion', 'intrachromosomal fold-back inversion', 'intrachromosomal inversion', 'intrachromosomal tandem duplication', 'Intrachromosomal unknown type', 'intrachromosomal with inverted orientation', 'intrachromosomal with non-inverted orientation'. |
 |
| Sample | Symbol_a | Chr_a | Start_a | End_a | Symbol_b | Chr_b | Start_b | End_b |
| ovary | CHSY1 | chr15 | 101746849 | 101746869 | CHSY1 | chr15 | 101748013 | 101748033 |
| ovary | CHSY1 | chr15 | 101763239 | 101763439 | CHSY1 | chr15 | 101781306 | 101781506 |
| ovary | CHSY1 | chr15 | 101763246 | 101763446 | CHSY1 | chr15 | 101781300 | 101781500 |
| ovary | CHSY1 | chr15 | 101763316 | 101763336 | CHSY1 | chr15 | 101781394 | 101781414 |
| ovary | CHSY1 | chr15 | 101779685 | 101779705 | CHSY1 | chr15 | 101779806 | 101779826 |
| cf) Tissue number; Tissue name (1;Breast, 2;Central_nervous_system, 3;Haematopoietic_and_lymphoid_tissue, 4;Large_intestine, 5;Liver, 6;Lung, 7;Ovary, 8;Pancreas, 9;Prostate, 10;Skin, 11;Soft_tissue, 12;Upper_aerodigestive_tract) |
| * From mRNA Sanger sequences, Chitars2.0 arranged chimeric transcripts. This table shows CHSY1 related fusion information. |
| ID | Head Gene | Tail Gene | Accession | Gene_a | qStart_a | qEnd_a | Chromosome_a | tStart_a | tEnd_a | Gene_a | qStart_a | qEnd_a | Chromosome_a | tStart_a | tEnd_a |
| BF988508 | LPP | 37 | 158 | 3 | 187972092 | 187972215 | CHSY1 | 153 | 256 | 15 | 101772190 | 101772293 | |
| BI035919 | CHSY1 | 1 | 213 | 15 | 101742093 | 101742305 | SRCAP | 204 | 384 | 16 | 30748539 | 30748719 | |
| Top |
| Mutation type/ Tissue ID | brca | cns | cerv | endome | haematopo | kidn | Lintest | liver | lung | ns | ovary | pancre | prost | skin | stoma | thyro | urina | |||
| Total # sample | 2 | 1 | 2 | |||||||||||||||||
| GAIN (# sample) | 1 | 1 | ||||||||||||||||||
| LOSS (# sample) | 1 | 2 |
| cf) Tissue ID; Tissue type (1; Breast, 2; Central_nervous_system, 3; Cervix, 4; Endometrium, 5; Haematopoietic_and_lymphoid_tissue, 6; Kidney, 7; Large_intestine, 8; Liver, 9; Lung, 10; NS, 11; Ovary, 12; Pancreas, 13; Prostate, 14; Skin, 15; Stomach, 16; Thyroid, 17; Urinary_tract) |
| Top |
|
 |
| Top |
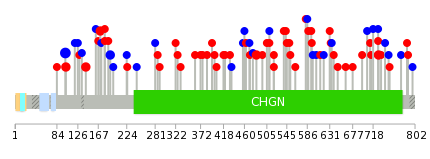
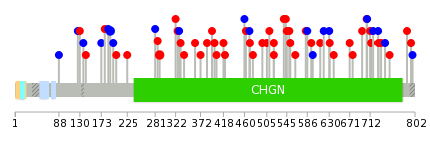
| Stat. for Non-Synonymous SNVs (# total SNVs=46) | (# total SNVs=22) |
 |  |
(# total SNVs=5) | (# total SNVs=0) |
 |
| Top |
| * When you move the cursor on each content, you can see more deailed mutation information on the Tooltip. Those are primary_site,primary_histology,mutation(aa),pubmedID. |
| GRCh37 position | Mutation(aa) | Unique sampleID count |
| chr15:101791359-101791359 | p.R101R | 4 |
| chr15:101775678-101775678 | p.S142Y | 2 |
| chr15:101775437-101775437 | p.P223fs*3 | 2 |
| chr15:101775530-101775530 | p.S191S | 2 |
| chr15:101718551-101718551 | p.E484V | 2 |
| chr15:101791357-101791357 | p.A102V | 2 |
| chr15:101717815-101717815 | p.Q729H | 2 |
| chr15:101775592-101775592 | p.D171H | 2 |
| chr15:101718236-101718239 | p.R588fs*28 | 2 |
| chr15:101718450-101718450 | p.Q518* | 1 |
| Top |
|
 |
| Point Mutation/ Tissue ID | 1 | 2 | 3 | 4 | 5 | 6 | 7 | 8 | 9 | 10 | 11 | 12 | 13 | 14 | 15 | 16 | 17 | 18 | 19 | 20 |
| # sample | 3 | 1 | 1 | 12 | 1 | 4 | 2 | 6 | 2 | 1 | 12 | 6 | 14 | |||||||
| # mutation | 3 | 1 | 1 | 16 | 1 | 4 | 2 | 6 | 2 | 1 | 12 | 6 | 15 | |||||||
| nonsynonymous SNV | 2 | 1 | 1 | 10 | 1 | 2 | 2 | 4 | 2 | 1 | 9 | 3 | 11 | |||||||
| synonymous SNV | 1 | 6 | 2 | 2 | 3 | 3 | 4 |
| cf) Tissue ID; Tissue type (1; BLCA[Bladder Urothelial Carcinoma], 2; BRCA[Breast invasive carcinoma], 3; CESC[Cervical squamous cell carcinoma and endocervical adenocarcinoma], 4; COAD[Colon adenocarcinoma], 5; GBM[Glioblastoma multiforme], 6; Glioma Low Grade, 7; HNSC[Head and Neck squamous cell carcinoma], 8; KICH[Kidney Chromophobe], 9; KIRC[Kidney renal clear cell carcinoma], 10; KIRP[Kidney renal papillary cell carcinoma], 11; LAML[Acute Myeloid Leukemia], 12; LUAD[Lung adenocarcinoma], 13; LUSC[Lung squamous cell carcinoma], 14; OV[Ovarian serous cystadenocarcinoma ], 15; PAAD[Pancreatic adenocarcinoma], 16; PRAD[Prostate adenocarcinoma], 17; SKCM[Skin Cutaneous Melanoma], 18:STAD[Stomach adenocarcinoma], 19:THCA[Thyroid carcinoma], 20:UCEC[Uterine Corpus Endometrial Carcinoma]) |
| Top |
| * We represented just top 10 SNVs. When you move the cursor on each content, you can see more deailed mutation information on the Tooltip. Those are primary_site, primary_histology, mutation(aa), pubmedID. |
| Genomic Position | Mutation(aa) | Unique sampleID count |
| chr15:101775530 | p.R290T | 2 |
| chr15:101719133 | p.S191S | 2 |
| chr15:101718804 | p.R496I | 1 |
| chr15:101717888 | p.H329H | 1 |
| chr15:101719144 | p.D126D | 1 |
| chr15:101718244 | p.C751S | 1 |
| chr15:101718489 | p.S619S | 1 |
| chr15:101775715 | p.L612Q | 1 |
| chr15:101717646 | p.F477L | 1 |
| chr15:101718818 | p.E326K | 1 |
| * Copy number data were extracted from TCGA using R package TCGA-Assembler. The URLs of all public data files on TCGA DCC data server were gathered on Jan-05-2015. Function ProcessCNAData in TCGA-Assembler package was used to obtain gene-level copy number value which is calculated as the average copy number of the genomic region of a gene. |
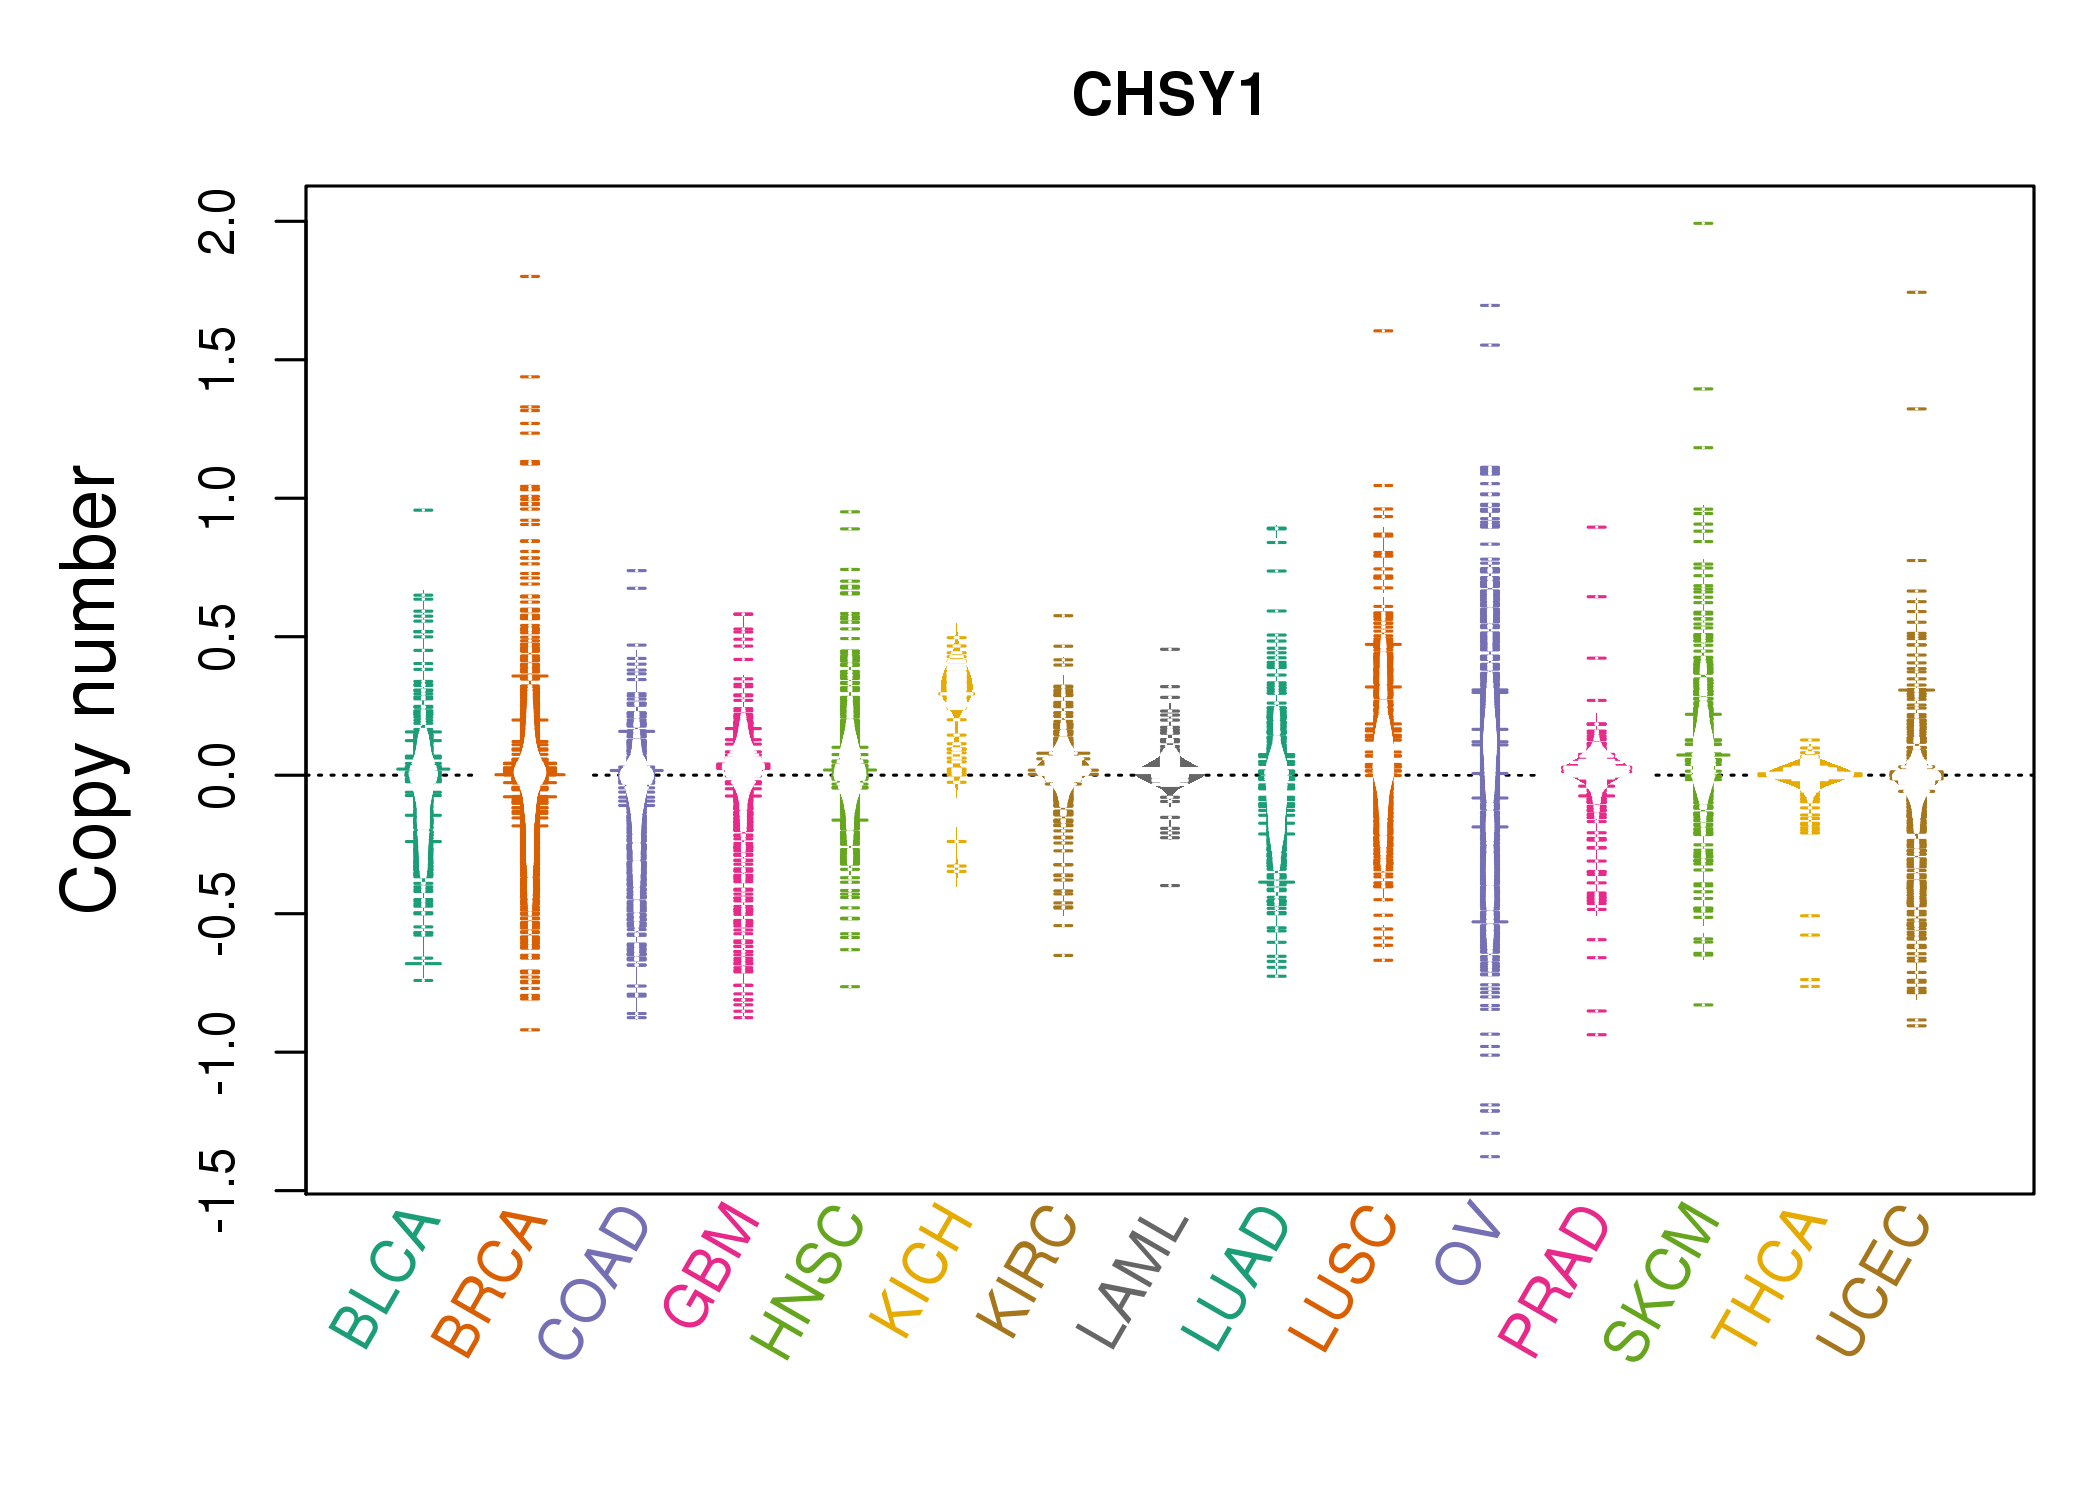 |
| cf) Tissue ID[Tissue type]: BLCA[Bladder Urothelial Carcinoma], BRCA[Breast invasive carcinoma], CESC[Cervical squamous cell carcinoma and endocervical adenocarcinoma], COAD[Colon adenocarcinoma], GBM[Glioblastoma multiforme], Glioma Low Grade, HNSC[Head and Neck squamous cell carcinoma], KICH[Kidney Chromophobe], KIRC[Kidney renal clear cell carcinoma], KIRP[Kidney renal papillary cell carcinoma], LAML[Acute Myeloid Leukemia], LUAD[Lung adenocarcinoma], LUSC[Lung squamous cell carcinoma], OV[Ovarian serous cystadenocarcinoma ], PAAD[Pancreatic adenocarcinoma], PRAD[Prostate adenocarcinoma], SKCM[Skin Cutaneous Melanoma], STAD[Stomach adenocarcinoma], THCA[Thyroid carcinoma], UCEC[Uterine Corpus Endometrial Carcinoma] |
| Top |
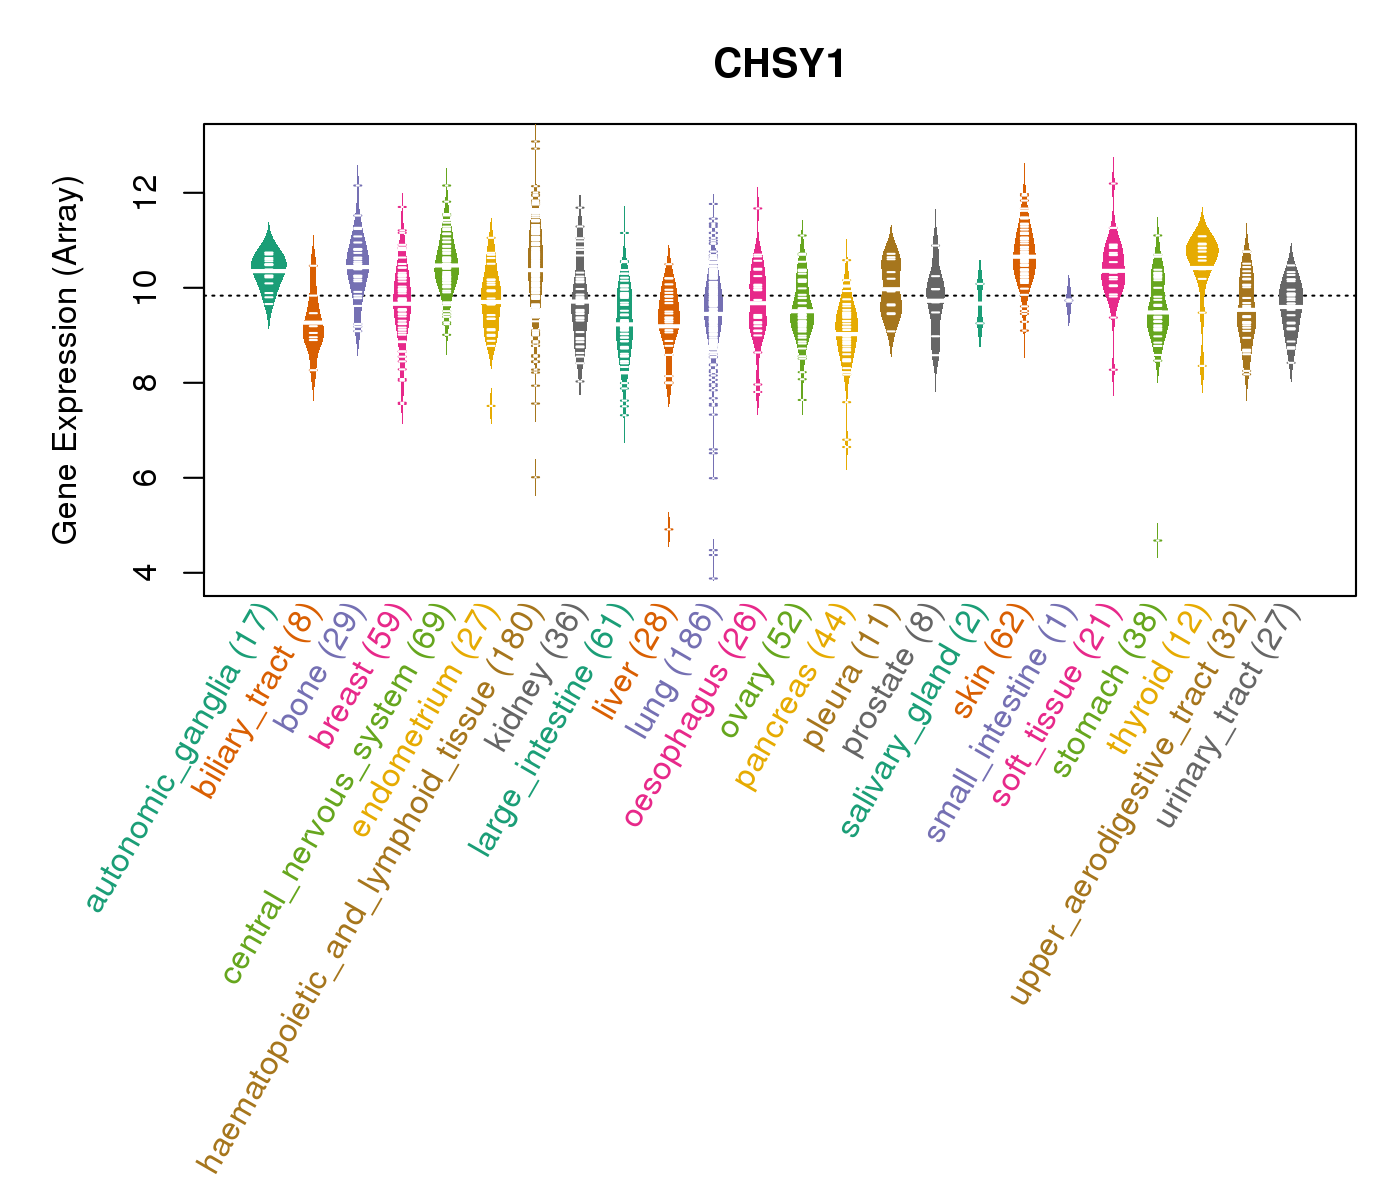
| Gene Expression for CHSY1 |
| * CCLE gene expression data were extracted from CCLE_Expression_Entrez_2012-10-18.res: Gene-centric RMA-normalized mRNA expression data. |
 |
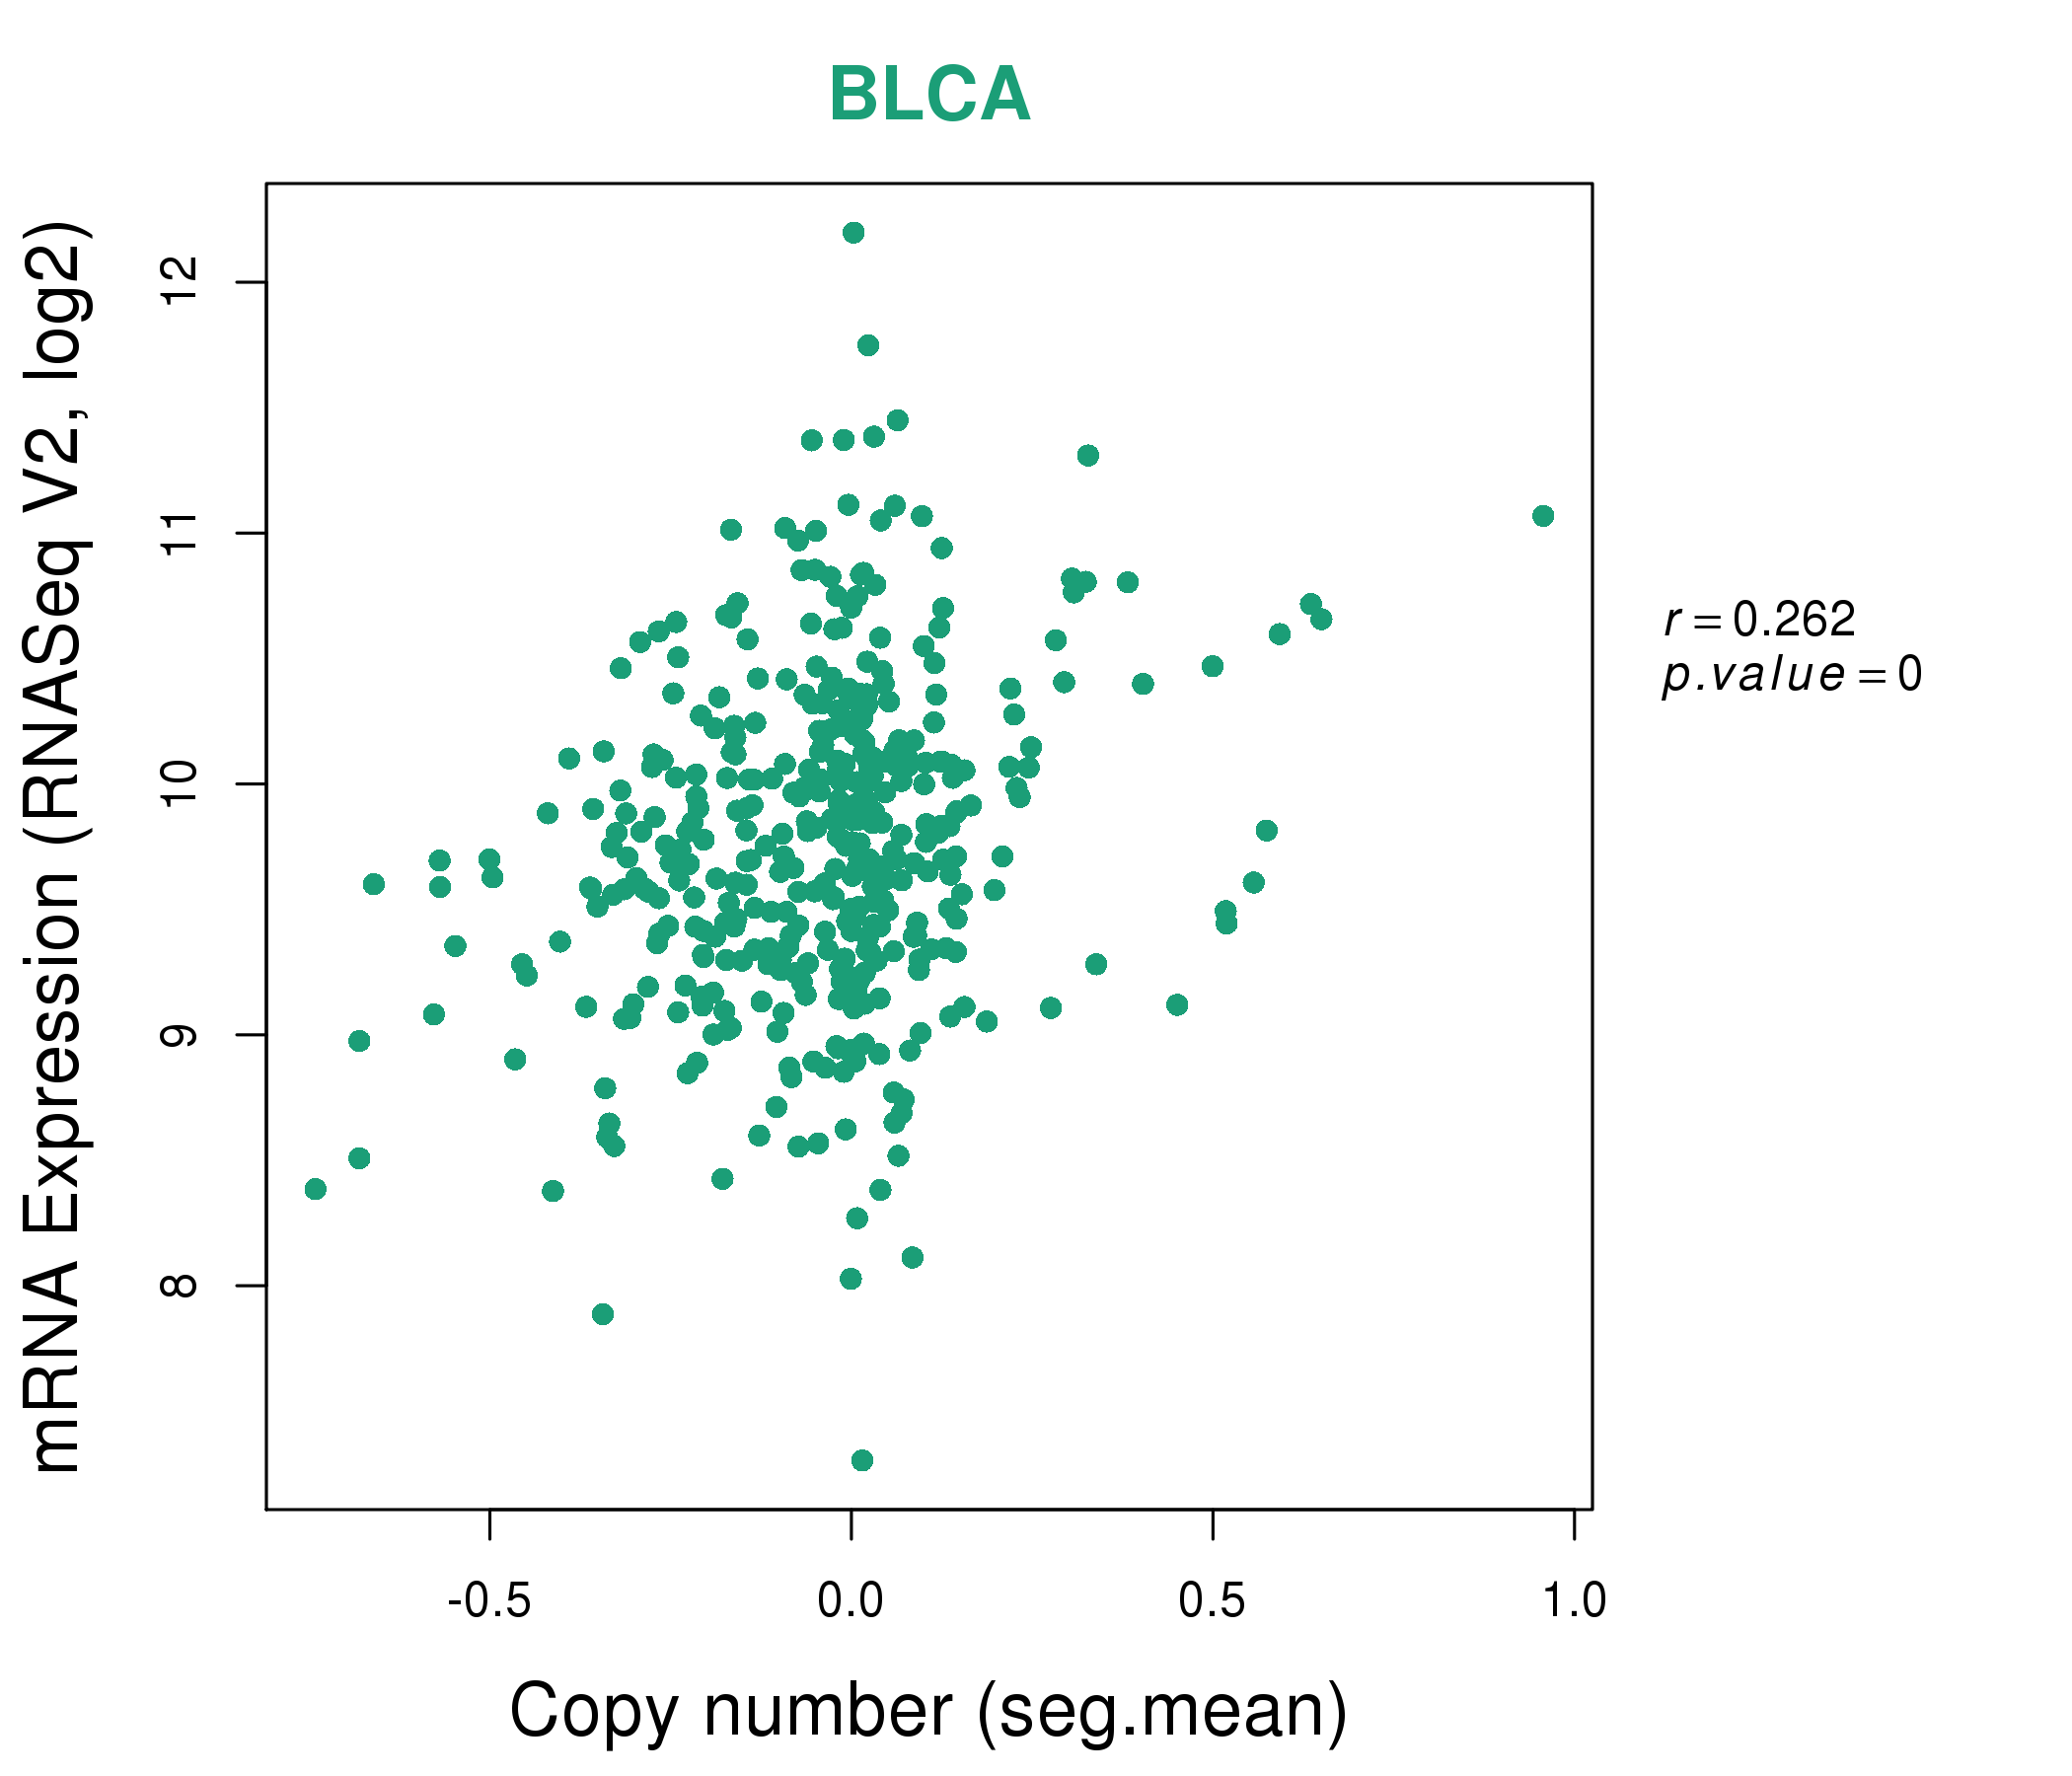
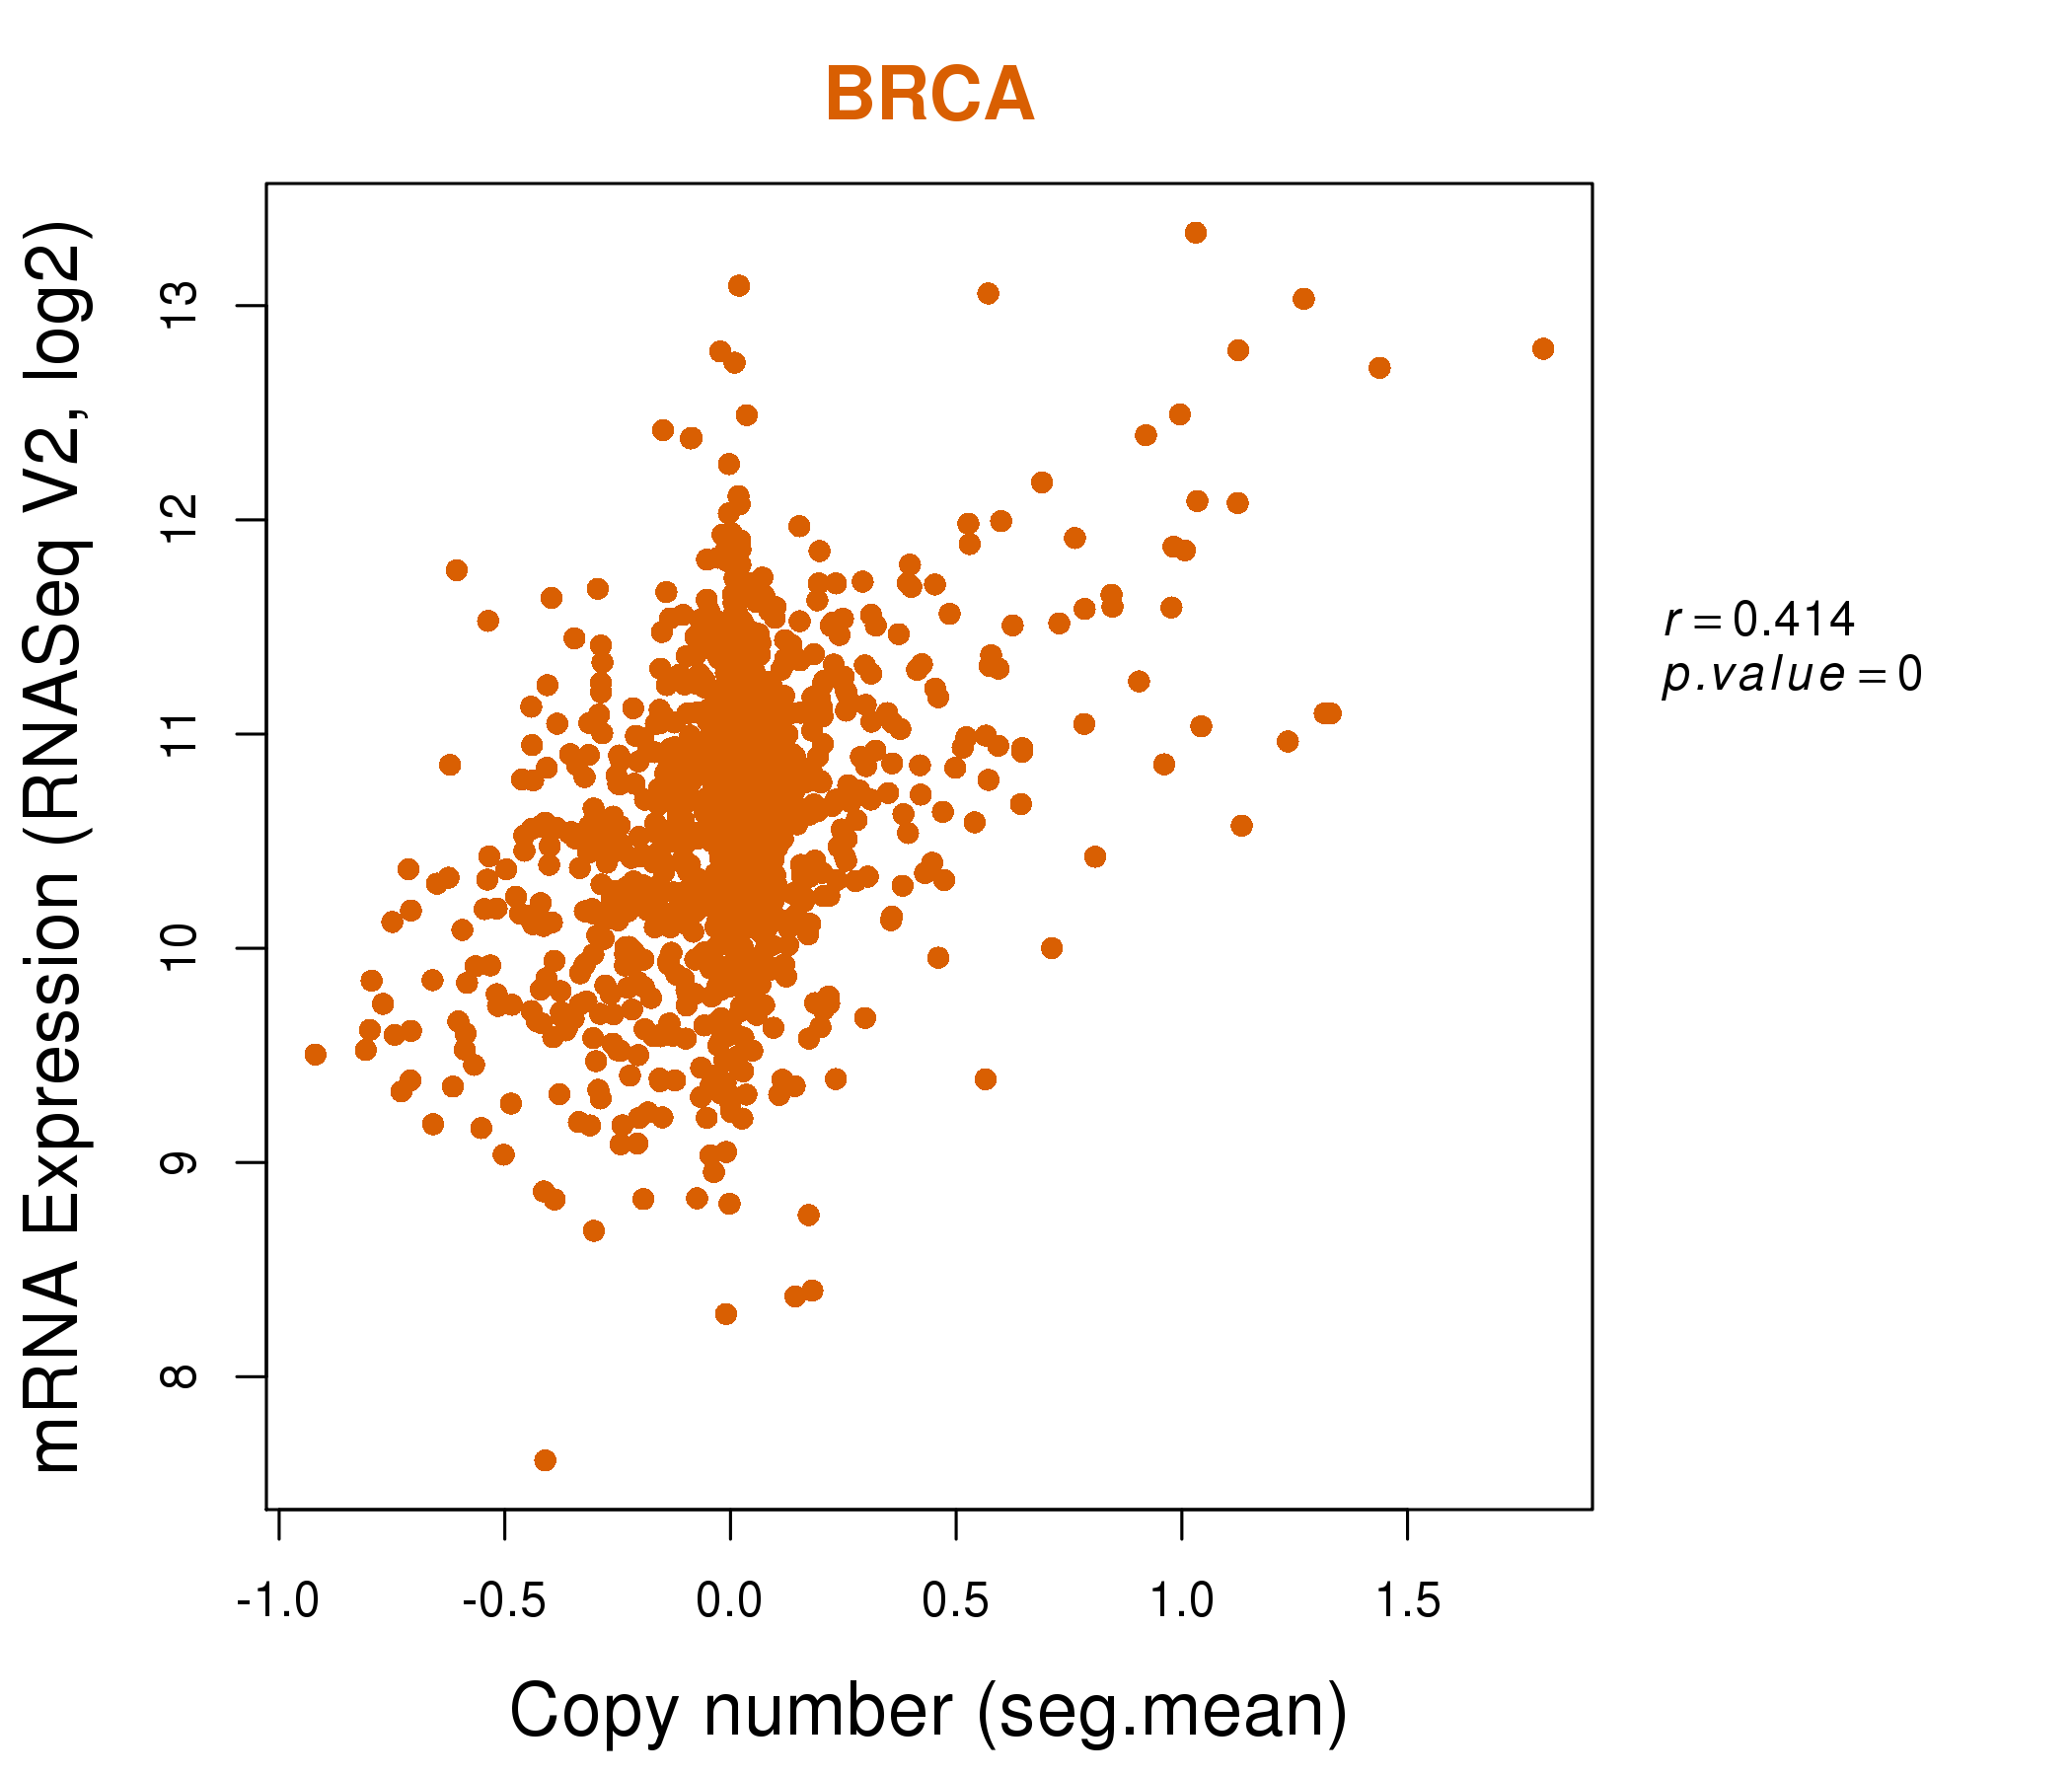
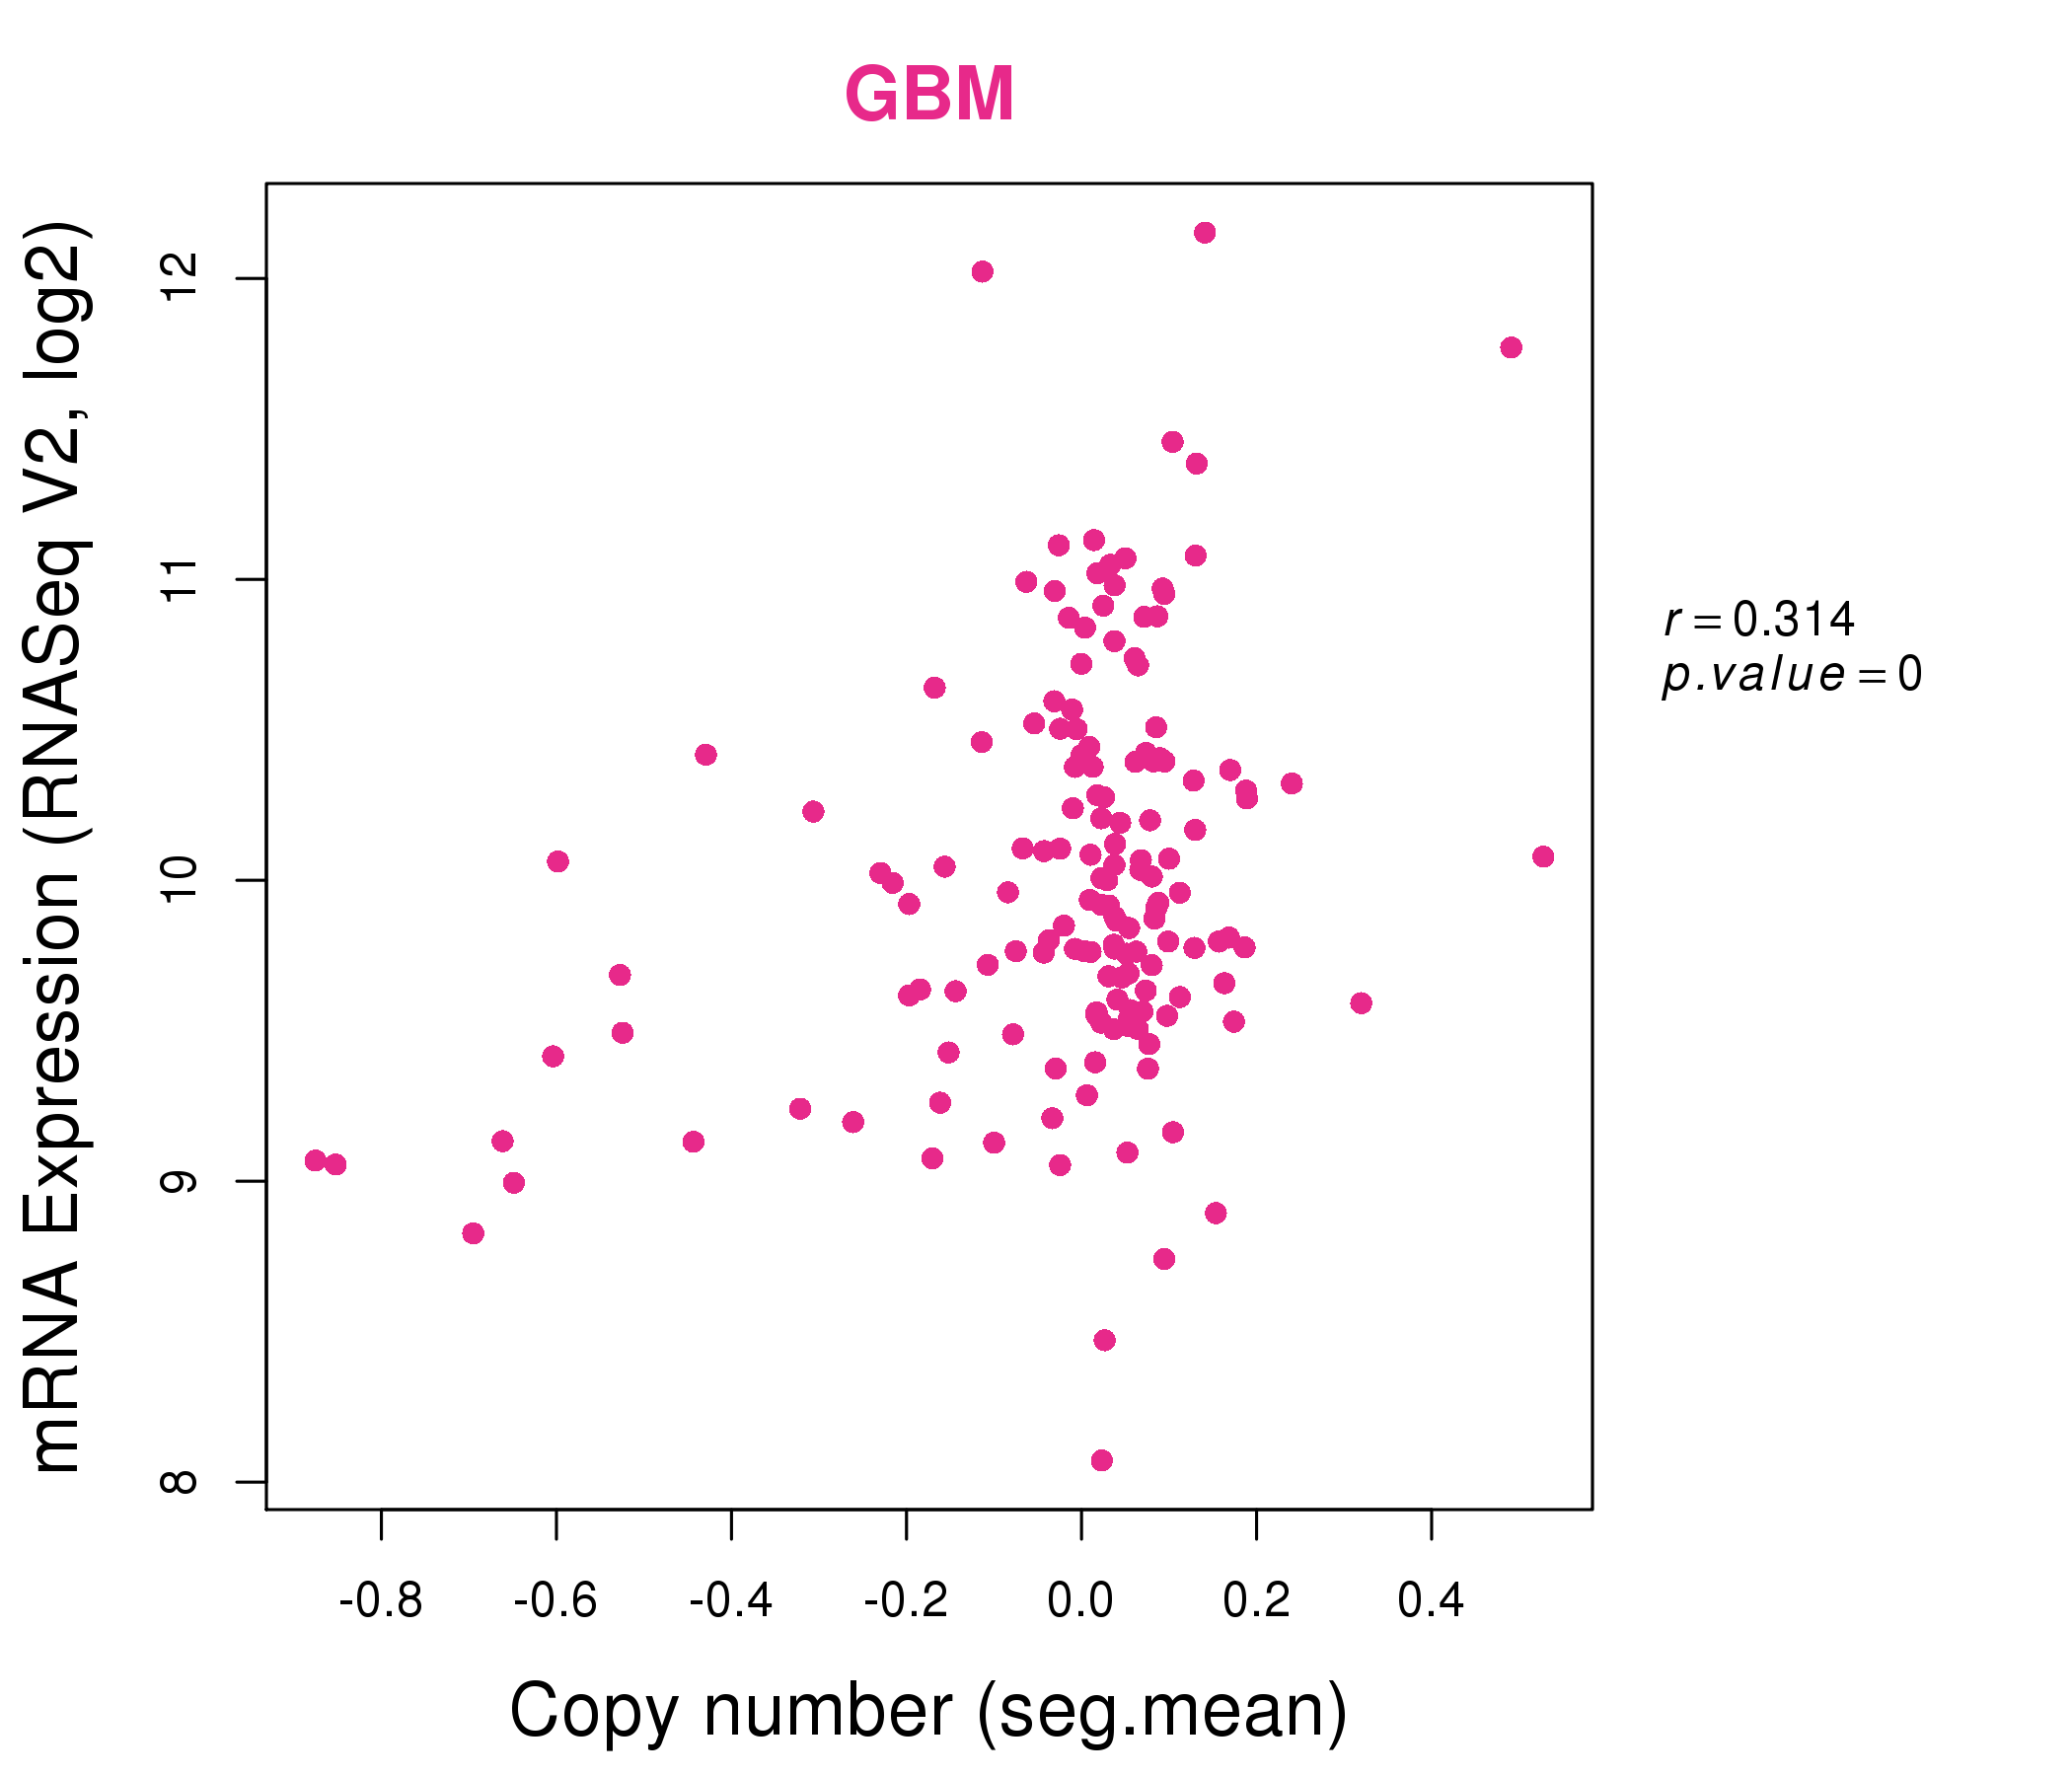
| * Normalized gene expression data of RNASeqV2 was extracted from TCGA using R package TCGA-Assembler. The URLs of all public data files on TCGA DCC data server were gathered at Jan-05-2015. Only eight cancer types have enough normal control samples for differential expression analysis. (t test, adjusted p<0.05 (using Benjamini-Hochberg FDR)) |
 |
| Top |
| * This plots show the correlation between CNV and gene expression. |
: Open all plots for all cancer types
 |
|
 |
|
| Top |
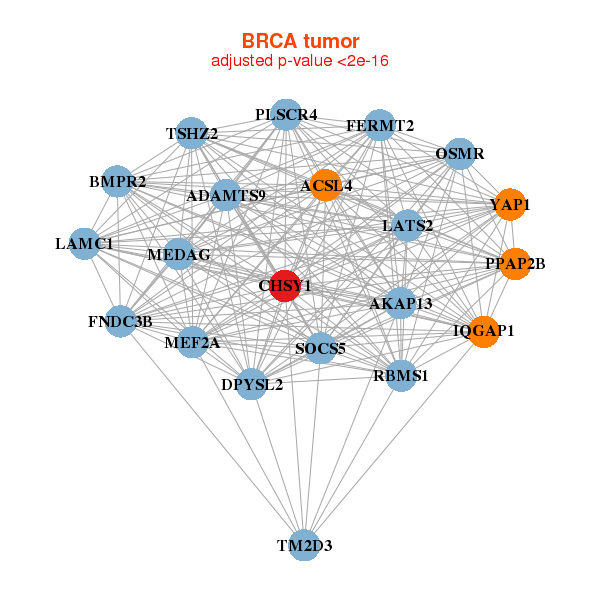
| Gene-Gene Network Information |
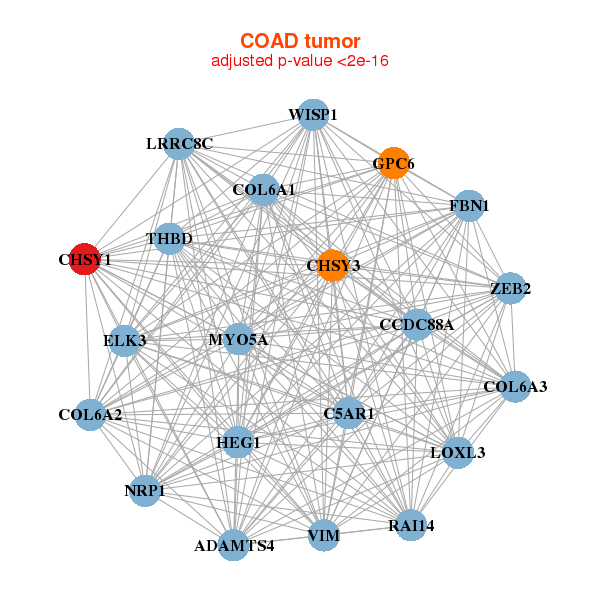
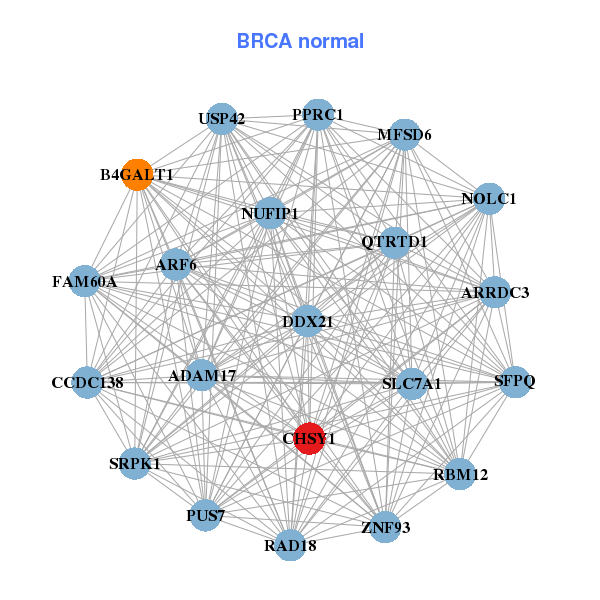
| * Co-Expression network figures were drawn using R package igraph. Only the top 20 genes with the highest correlations were shown. Red circle: input gene, orange circle: cell metabolism gene, sky circle: other gene |
: Open all plots for all cancer types
 |
|
| ACSL4,ADAMTS9,AKAP13,BMPR2,MEDAG,CHSY1,DPYSL2, FERMT2,FNDC3B,IQGAP1,LAMC1,LATS2,MEF2A,OSMR, PLSCR4,PPAP2B,RBMS1,SOCS5,TM2D3,TSHZ2,YAP1 | ADAM17,ARF6,ARRDC3,B4GALT1,CCDC138,CHSY1,DDX21, FAM60A,MFSD6,NOLC1,NUFIP1,PPRC1,PUS7,QTRTD1, RAD18,RBM12,SFPQ,SLC7A1,SRPK1,USP42,ZNF93 |
 |
|
| ADAMTS4,C5AR1,CCDC88A,CHSY1,CHSY3,COL6A1,COL6A2, COL6A3,ELK3,FBN1,GPC6,HEG1,LOXL3,LRRC8C, MYO5A,NRP1,RAI14,THBD,VIM,WISP1,ZEB2 | ABL2,AGR2___C11orf96,BPY2,CHSY1,FGF18,FOSL1,GPR3, GPR4,HEYL,KIAA0040,KRT78,MMP19,OR2T12,OR52M1, PHLDA1,PNPLA5,PPRC1,RRS1,SCARNA9,SLC7A1,SYCN, |
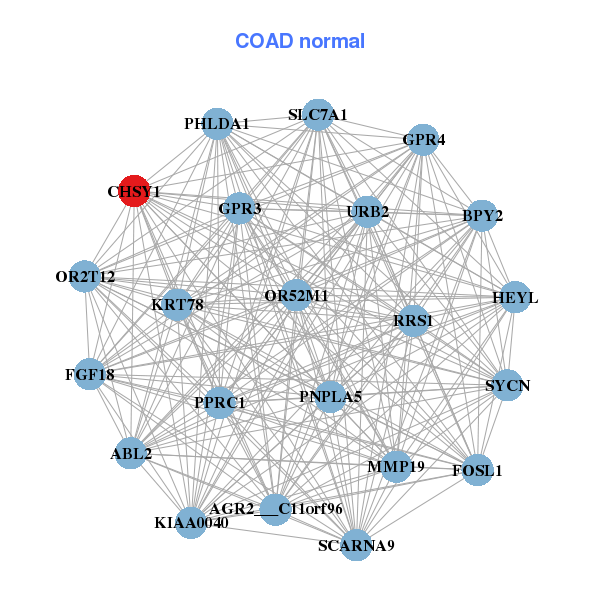
| * Co-Expression network figures were drawn using R package igraph. Only the top 20 genes with the highest correlations were shown. Red circle: input gene, orange circle: cell metabolism gene, sky circle: other gene |
: Open all plots for all cancer types
| Top |
: Open all interacting genes' information including KEGG pathway for all interacting genes from DAVID
| Top |
| Pharmacological Information for CHSY1 |
| There's no related Drug. |
| Top |
| Cross referenced IDs for CHSY1 |
| * We obtained these cross-references from Uniprot database. It covers 150 different DBs, 18 categories. http://www.uniprot.org/help/cross_references_section |
: Open all cross reference information
|
Copyright © 2016-Present - The Univsersity of Texas Health Science Center at Houston @ |