|
||||||||||||||||||||
| |
| Phenotypic Information (metabolism pathway, cancer, disease, phenome) |
| |
| |
| Gene-Gene Network Information: Co-Expression Network, Interacting Genes & KEGG |
| |
|


| Gene Summary for DIS3 |
| Basic gene info. | Gene symbol | DIS3 |
| Gene name | DIS3 exosome endoribonuclease and 3'-5' exoribonuclease | |
| Synonyms | 2810028N01Rik|EXOSC11|KIAA1008|RRP44|dis3p | |
| Cytomap | UCSC genome browser: 13q22.1 | |
| Genomic location | chr13 :73329539-73356344 | |
| Type of gene | protein-coding | |
| RefGenes | NM_001128226.2, NM_014953.4, | |
| Ensembl id | ENSG00000083520 | |
| Description | DIS3 mitotic control homologexosome complex exonuclease RRP44exosome component 11mitotic control protein dis3 homologribosomal RNA-processing protein 44 | |
| Modification date | 20141207 | |
| dbXrefs | MIM : 607533 | |
| HGNC : HGNC | ||
| Ensembl : ENSG00000083520 | ||
| HPRD : 06338 | ||
| Protein | UniProt: Q9Y2L1 go to UniProt's Cross Reference DB Table | |
| Expression | CleanEX: HS_DIS3 | |
| BioGPS: 22894 | ||
| Gene Expression Atlas: ENSG00000083520 | ||
| The Human Protein Atlas: ENSG00000083520 | ||
| Pathway | NCI Pathway Interaction Database: DIS3 | |
| KEGG: DIS3 | ||
| REACTOME: DIS3 | ||
| ConsensusPathDB | ||
| Pathway Commons: DIS3 | ||
| Metabolism | MetaCyc: DIS3 | |
| HUMANCyc: DIS3 | ||
| Regulation | Ensembl's Regulation: ENSG00000083520 | |
| miRBase: chr13 :73,329,539-73,356,344 | ||
| TargetScan: NM_001128226 | ||
| cisRED: ENSG00000083520 | ||
| Context | iHOP: DIS3 | |
| cancer metabolism search in PubMed: DIS3 | ||
| UCL Cancer Institute: DIS3 | ||
| Assigned class in ccmGDB | A - This gene has a literature evidence and it belongs to cancer gene. | |
| References showing role of DIS3 in cancer cell metabolism | 1. Rose AE, Poliseno L, Wang J, Clark M, Pearlman A, et al. (2011) Integrative genomics identifies molecular alterations that challenge the linear model of melanoma progression. Cancer Res 71: 2561-2571. doi: 10.1158/0008-5472.CAN-10-2958. pmid: 3070783. go to article 2. Murakami H, Goto DB, Toda T, Chen ES, Grewal SI, et al. (2007) Ribonuclease activity of Dis3 is required for mitotic progression and provides a possible link between heterochromatin and kinetochore function. PLoS One 2: e317. doi: 10.1371/journal.pone.0000317. pmid: 1820850. go to article 3. de Groen FL, Krijgsman O, Tijssen M, Vriend LE, Ylstra B, et al. (2014) Gene-dosage dependent overexpression at the 13q amplicon identifies DIS3 as candidate oncogene in colorectal cancer progression. Genes Chromosomes Cancer 53: 339-348. doi: 10.1002/gcc.22144. go to article 4. Astuti D, Morris MR, Cooper WN, Staals RH, Wake NC, et al. (2012) Germline mutations in DIS3L2 cause the Perlman syndrome of overgrowth and Wilms tumor susceptibility. Nat Genet 44: 277-284. doi: 10.1038/ng.1071. go to article | |
| Top |
| Phenotypic Information for DIS3(metabolism pathway, cancer, disease, phenome) |
| Cancer | CGAP: DIS3 |
| Familial Cancer Database: DIS3 | |
| * This gene is included in those cancer gene databases. |
|
|
|
|
|
| . | ||||||||||||||
Oncogene 1 | Significant driver gene in MM 6, | |||||||||||||||||||
| cf) number; DB name 1 Oncogene; http://nar.oxfordjournals.org/content/35/suppl_1/D721.long, 2 Tumor Suppressor gene; https://bioinfo.uth.edu/TSGene/, 3 Cancer Gene Census; http://www.nature.com/nrc/journal/v4/n3/abs/nrc1299.html, 4 CancerGenes; http://nar.oxfordjournals.org/content/35/suppl_1/D721.long, 5 Network of Cancer Gene; http://ncg.kcl.ac.uk/index.php, 6 http://www.nature.com/nature/journal/v505/n7484/full/nature12912.html, 7Therapeutic Vulnerabilities in Cancer; http://cbio.mskcc.org/cancergenomics/statius/ |
| REACTOME_METABOLISM_OF_MRNA REACTOME_METABOLISM_OF_RNA | |
| OMIM | 607533; gene. 607533; gene. |
| Orphanet | |
| Disease | KEGG Disease: DIS3 |
| MedGen: DIS3 (Human Medical Genetics with Condition) | |
| ClinVar: DIS3 | |
| Phenotype | MGI: DIS3 (International Mouse Phenotyping Consortium) |
| PhenomicDB: DIS3 | |
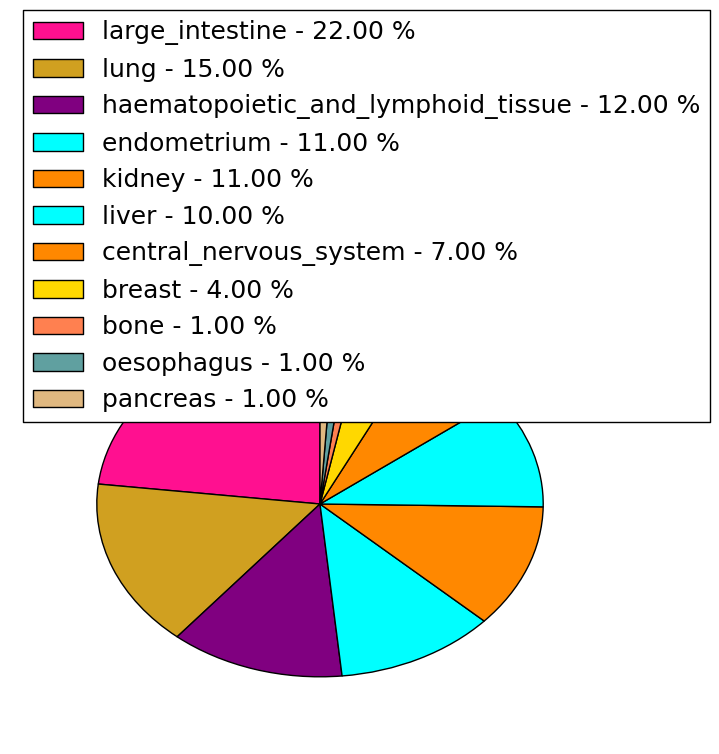
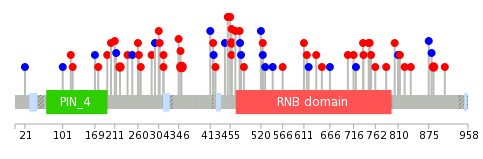
| Mutations for DIS3 |
| * Under tables are showing count per each tissue to give us broad intuition about tissue specific mutation patterns.You can go to the detailed page for each mutation database's web site. |
| - Statistics for Tissue and Mutation type | Top |
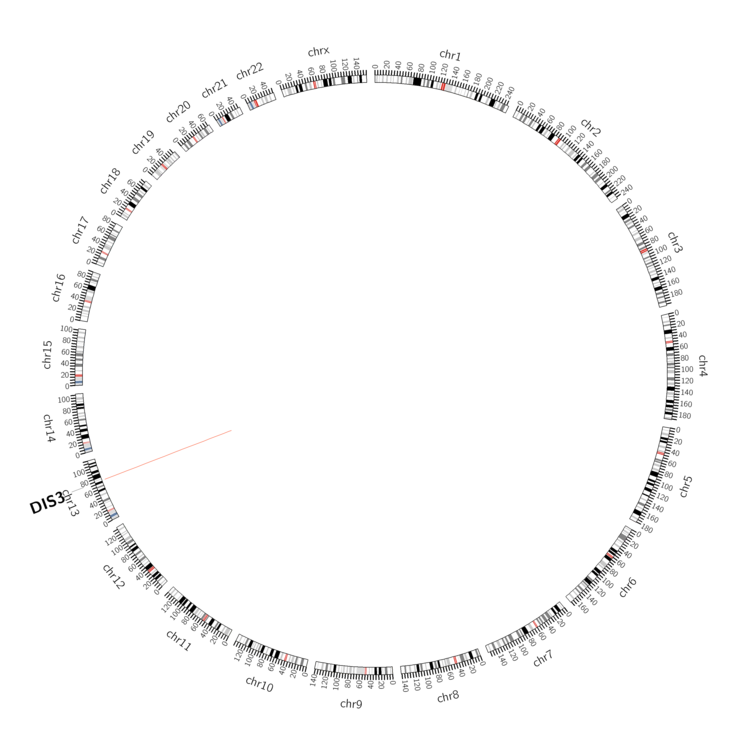 |
| - For Inter-chromosomal Variations |
| There's no inter-chromosomal structural variation. |
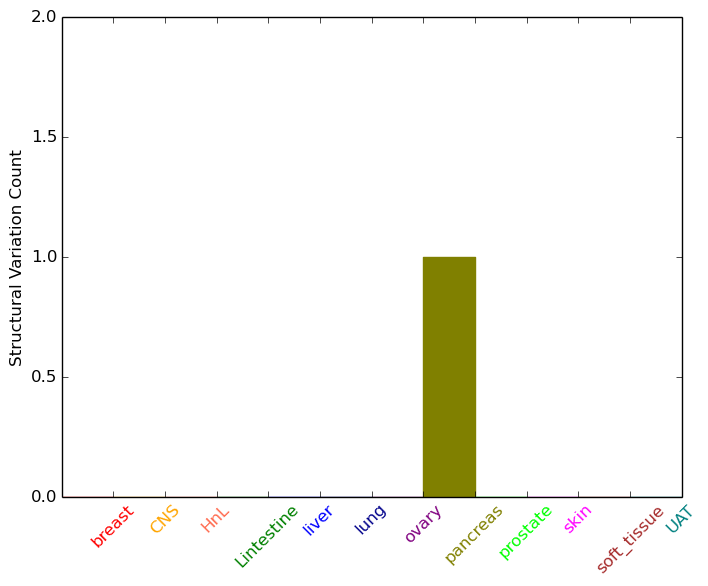
| - For Intra-chromosomal Variations |
| * Intra-chromosomal variantions includes 'intrachromosomal amplicon to amplicon', 'intrachromosomal amplicon to non-amplified dna', 'intrachromosomal deletion', 'intrachromosomal fold-back inversion', 'intrachromosomal inversion', 'intrachromosomal tandem duplication', 'Intrachromosomal unknown type', 'intrachromosomal with inverted orientation', 'intrachromosomal with non-inverted orientation'. |
 |
| Sample | Symbol_a | Chr_a | Start_a | End_a | Symbol_b | Chr_b | Start_b | End_b |
| pancreas | DIS3 | chr13 | 73335378 | 73335398 | DIS3 | chr13 | 73338250 | 73338270 |
| cf) Tissue number; Tissue name (1;Breast, 2;Central_nervous_system, 3;Haematopoietic_and_lymphoid_tissue, 4;Large_intestine, 5;Liver, 6;Lung, 7;Ovary, 8;Pancreas, 9;Prostate, 10;Skin, 11;Soft_tissue, 12;Upper_aerodigestive_tract) |
| * From mRNA Sanger sequences, Chitars2.0 arranged chimeric transcripts. This table shows DIS3 related fusion information. |
| ID | Head Gene | Tail Gene | Accession | Gene_a | qStart_a | qEnd_a | Chromosome_a | tStart_a | tEnd_a | Gene_a | qStart_a | qEnd_a | Chromosome_a | tStart_a | tEnd_a |
| AW993722 | BORA | 9 | 324 | 13 | 73329118 | 73329436 | DIS3 | 316 | 621 | 13 | 73336895 | 73337200 | |
| BE813339 | BORA | 6 | 323 | 13 | 73329118 | 73329436 | DIS3 | 315 | 566 | 13 | 73336950 | 73337200 | |
| Top |
| There's no copy number variation information in COSMIC data for this gene. |
| Top |
|
 |
| Top |
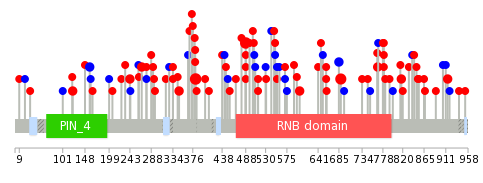
| Stat. for Non-Synonymous SNVs (# total SNVs=88) | (# total SNVs=24) |
 | 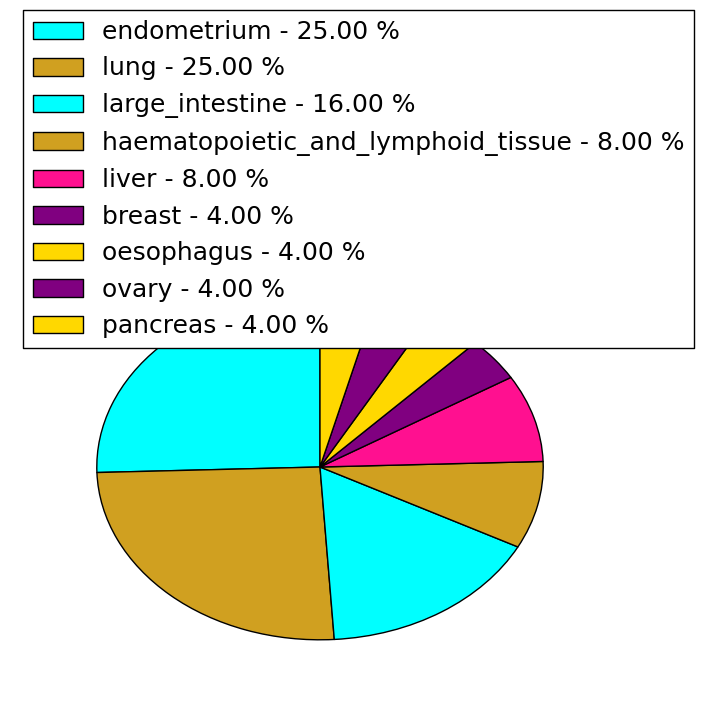 |
(# total SNVs=2) | (# total SNVs=1) |
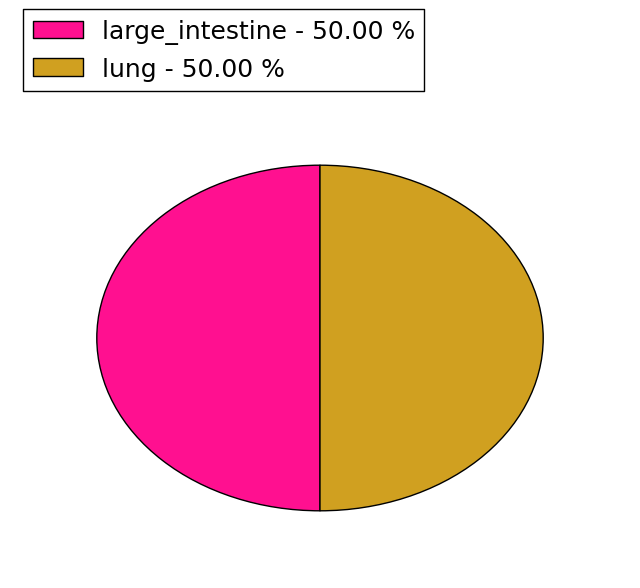 | 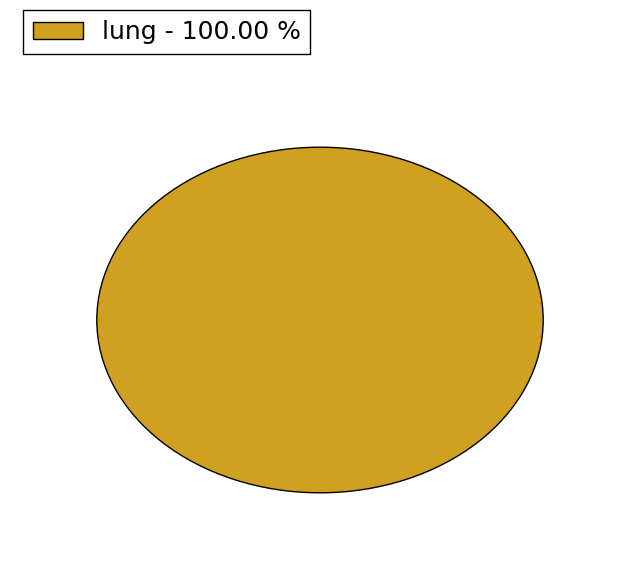 |
| Top |
| * When you move the cursor on each content, you can see more deailed mutation information on the Tooltip. Those are primary_site,primary_histology,mutation(aa),pubmedID. |
| GRCh37 position | Mutation(aa) | Unique sampleID count |
| chr13:73346338-73346338 | p.D488N | 7 |
| chr13:73347916-73347916 | p.R382Q | 6 |
| chr13:73337650-73337650 | p.R689Q | 5 |
| chr13:73345227-73345227 | p.D554D | 2 |
| chr13:73350157-73350157 | p.S243Y | 2 |
| chr13:73355005-73355005 | p.T122I | 2 |
| chr13:73346337-73346337 | p.D488A | 2 |
| chr13:73337661-73337661 | p.H685H | 2 |
| chr13:73348145-73348145 | p.G347E | 2 |
| chr13:73334716-73334716 | p.S915L | 2 |
| Top |
|
 |
| Point Mutation/ Tissue ID | 1 | 2 | 3 | 4 | 5 | 6 | 7 | 8 | 9 | 10 | 11 | 12 | 13 | 14 | 15 | 16 | 17 | 18 | 19 | 20 |
| # sample | 2 | 4 | 13 | 2 | 5 | 1 | 4 | 3 | 12 | 1 | 7 | 5 | 1 | 11 | ||||||
| # mutation | 2 | 4 | 13 | 2 | 5 | 1 | 4 | 3 | 11 | 1 | 6 | 7 | 1 | 13 | ||||||
| nonsynonymous SNV | 1 | 3 | 9 | 2 | 4 | 1 | 4 | 3 | 8 | 5 | 4 | 1 | 7 | |||||||
| synonymous SNV | 1 | 1 | 4 | 1 | 3 | 1 | 1 | 3 | 6 |
| cf) Tissue ID; Tissue type (1; BLCA[Bladder Urothelial Carcinoma], 2; BRCA[Breast invasive carcinoma], 3; CESC[Cervical squamous cell carcinoma and endocervical adenocarcinoma], 4; COAD[Colon adenocarcinoma], 5; GBM[Glioblastoma multiforme], 6; Glioma Low Grade, 7; HNSC[Head and Neck squamous cell carcinoma], 8; KICH[Kidney Chromophobe], 9; KIRC[Kidney renal clear cell carcinoma], 10; KIRP[Kidney renal papillary cell carcinoma], 11; LAML[Acute Myeloid Leukemia], 12; LUAD[Lung adenocarcinoma], 13; LUSC[Lung squamous cell carcinoma], 14; OV[Ovarian serous cystadenocarcinoma ], 15; PAAD[Pancreatic adenocarcinoma], 16; PRAD[Prostate adenocarcinoma], 17; SKCM[Skin Cutaneous Melanoma], 18:STAD[Stomach adenocarcinoma], 19:THCA[Thyroid carcinoma], 20:UCEC[Uterine Corpus Endometrial Carcinoma]) |
| Top |
| * We represented just top 10 SNVs. When you move the cursor on each content, you can see more deailed mutation information on the Tooltip. Those are primary_site, primary_histology, mutation(aa), pubmedID. |
| Genomic Position | Mutation(aa) | Unique sampleID count |
| chr13:73347916 | p.R352Q,DIS3 | 4 |
| chr13:73334716 | p.R222T,DIS3 | 2 |
| chr13:73346337 | p.D524E,DIS3 | 2 |
| chr13:73350130 | p.R314T,DIS3 | 2 |
| chr13:73346338 | p.S885L,DIS3 | 2 |
| chr13:73348154 | p.D458G,DIS3 | 2 |
| chr13:73345227 | p.D458N,DIS3 | 2 |
| chr13:73349468 | p.G814R,DIS3 | 1 |
| chr13:73340127 | p.L621L,DIS3 | 1 |
| chr13:73355005 | p.P450Q,DIS3 | 1 |
| * Copy number data were extracted from TCGA using R package TCGA-Assembler. The URLs of all public data files on TCGA DCC data server were gathered on Jan-05-2015. Function ProcessCNAData in TCGA-Assembler package was used to obtain gene-level copy number value which is calculated as the average copy number of the genomic region of a gene. |
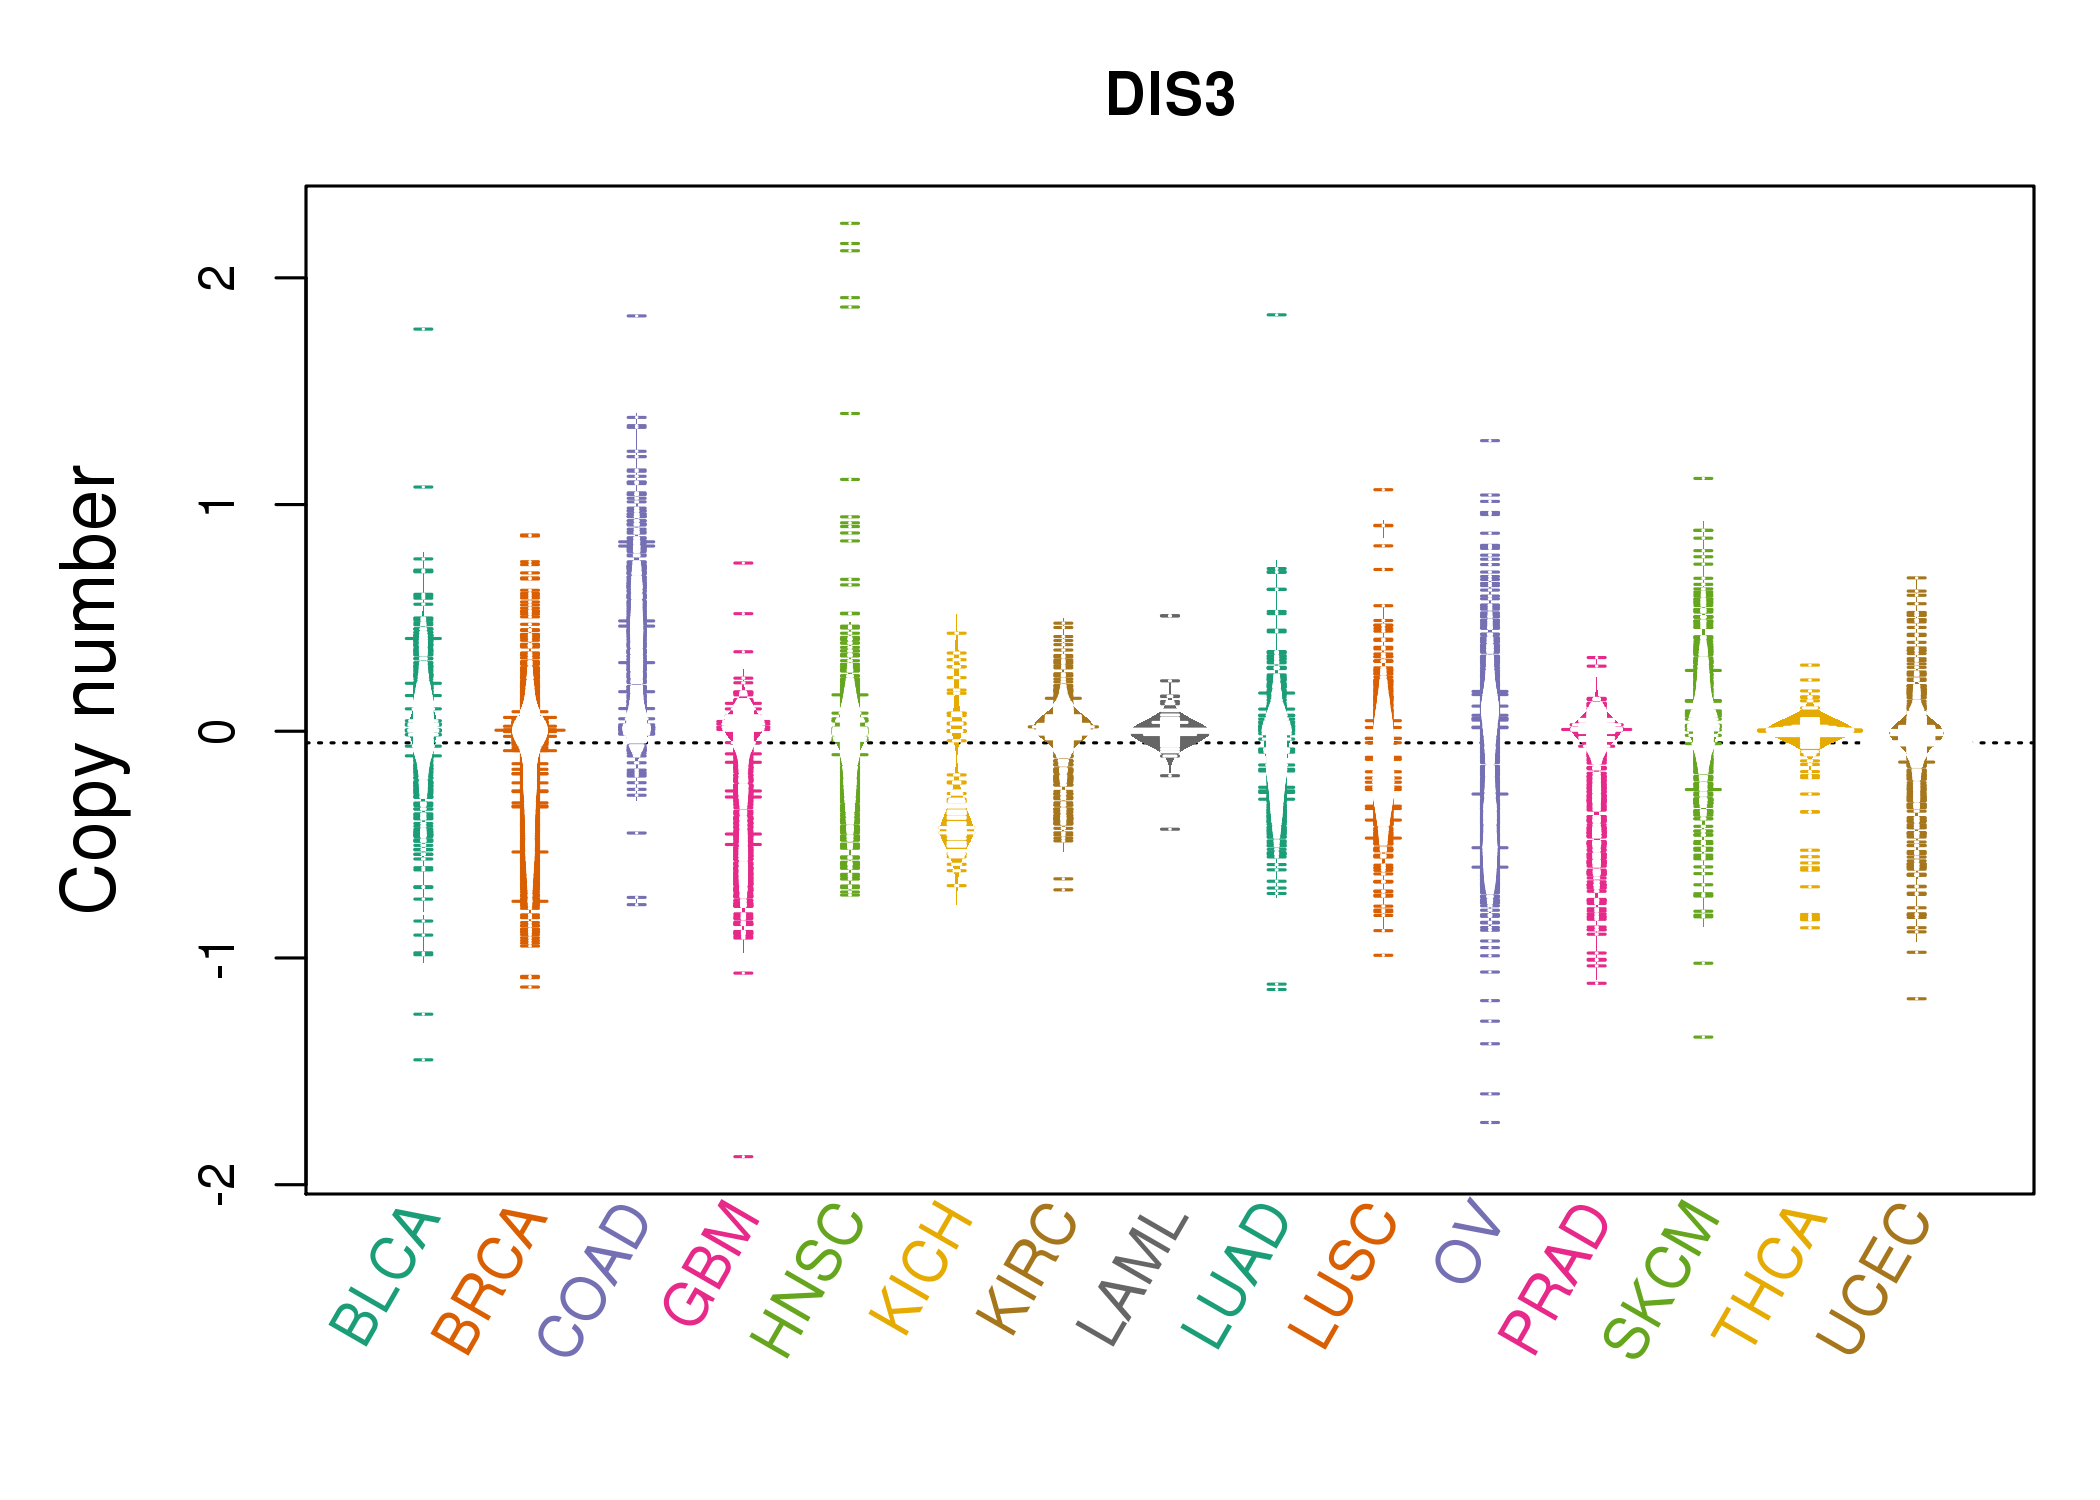 |
| cf) Tissue ID[Tissue type]: BLCA[Bladder Urothelial Carcinoma], BRCA[Breast invasive carcinoma], CESC[Cervical squamous cell carcinoma and endocervical adenocarcinoma], COAD[Colon adenocarcinoma], GBM[Glioblastoma multiforme], Glioma Low Grade, HNSC[Head and Neck squamous cell carcinoma], KICH[Kidney Chromophobe], KIRC[Kidney renal clear cell carcinoma], KIRP[Kidney renal papillary cell carcinoma], LAML[Acute Myeloid Leukemia], LUAD[Lung adenocarcinoma], LUSC[Lung squamous cell carcinoma], OV[Ovarian serous cystadenocarcinoma ], PAAD[Pancreatic adenocarcinoma], PRAD[Prostate adenocarcinoma], SKCM[Skin Cutaneous Melanoma], STAD[Stomach adenocarcinoma], THCA[Thyroid carcinoma], UCEC[Uterine Corpus Endometrial Carcinoma] |
| Top |
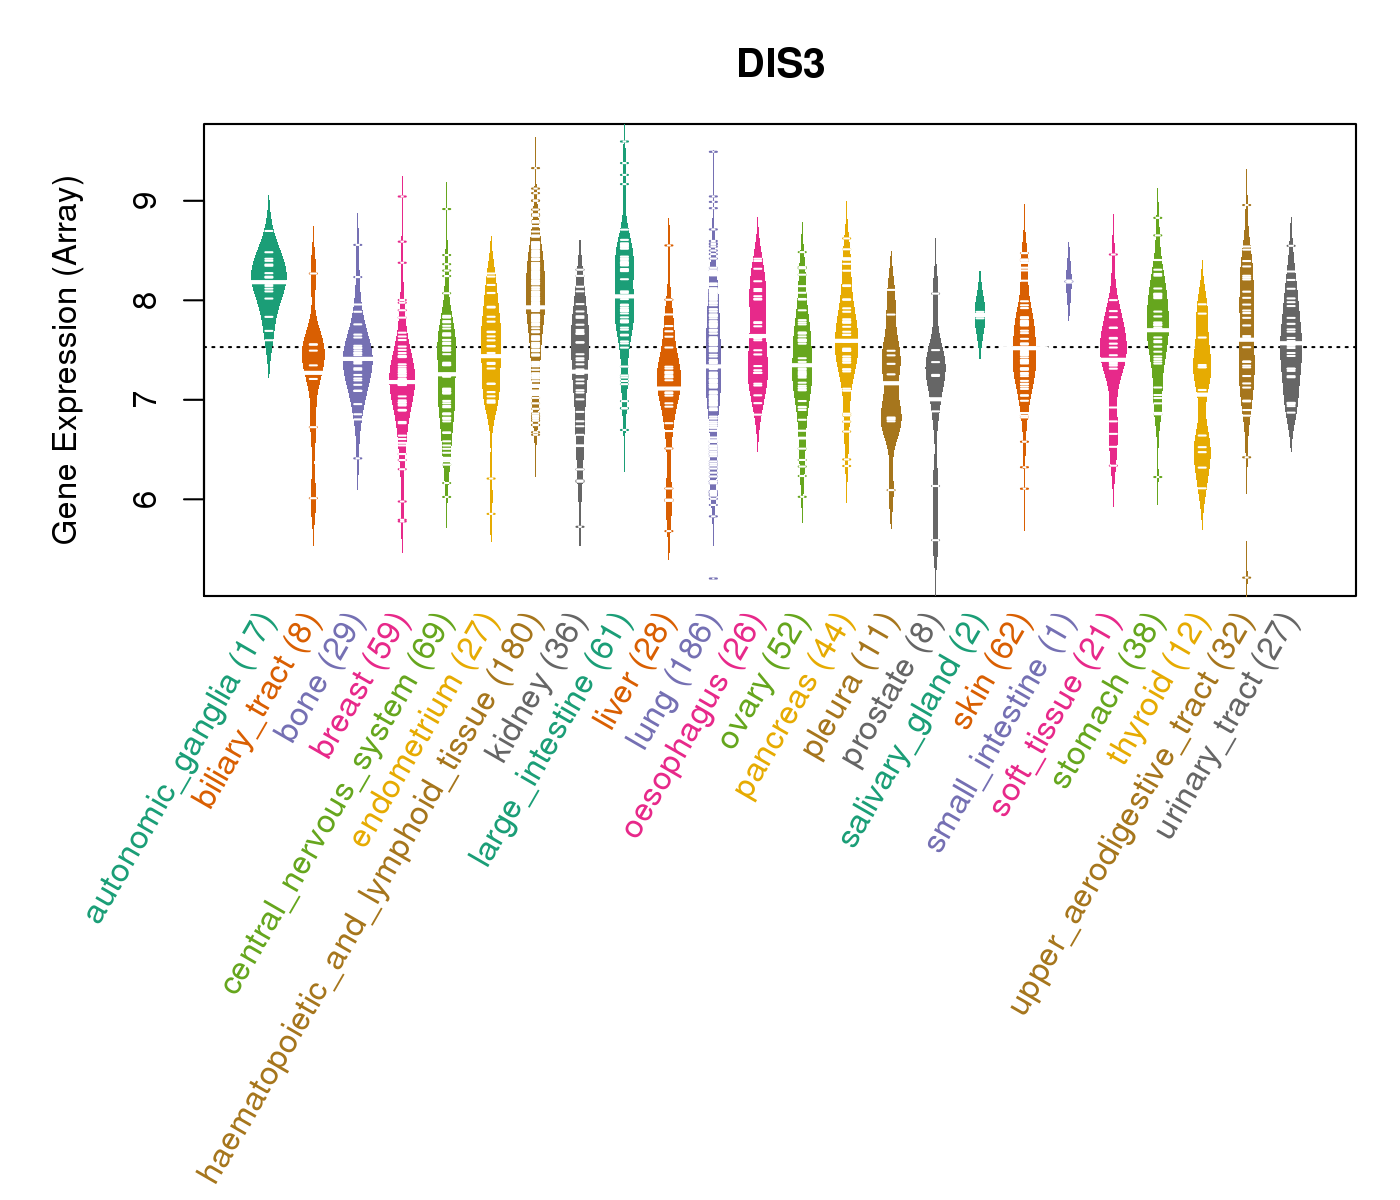
| Gene Expression for DIS3 |
| * CCLE gene expression data were extracted from CCLE_Expression_Entrez_2012-10-18.res: Gene-centric RMA-normalized mRNA expression data. |
 |
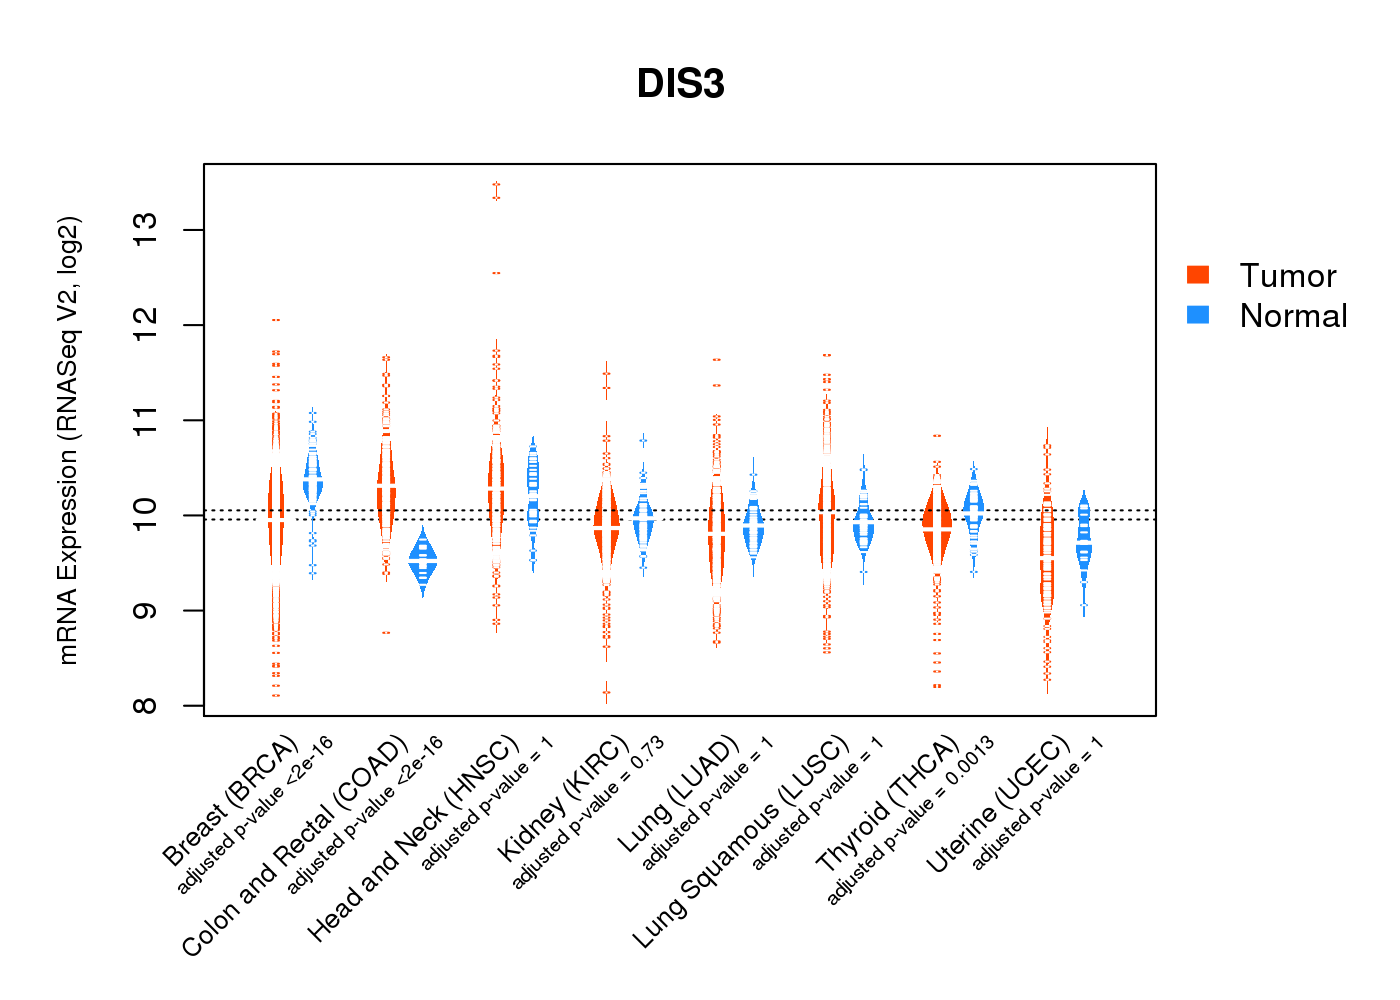
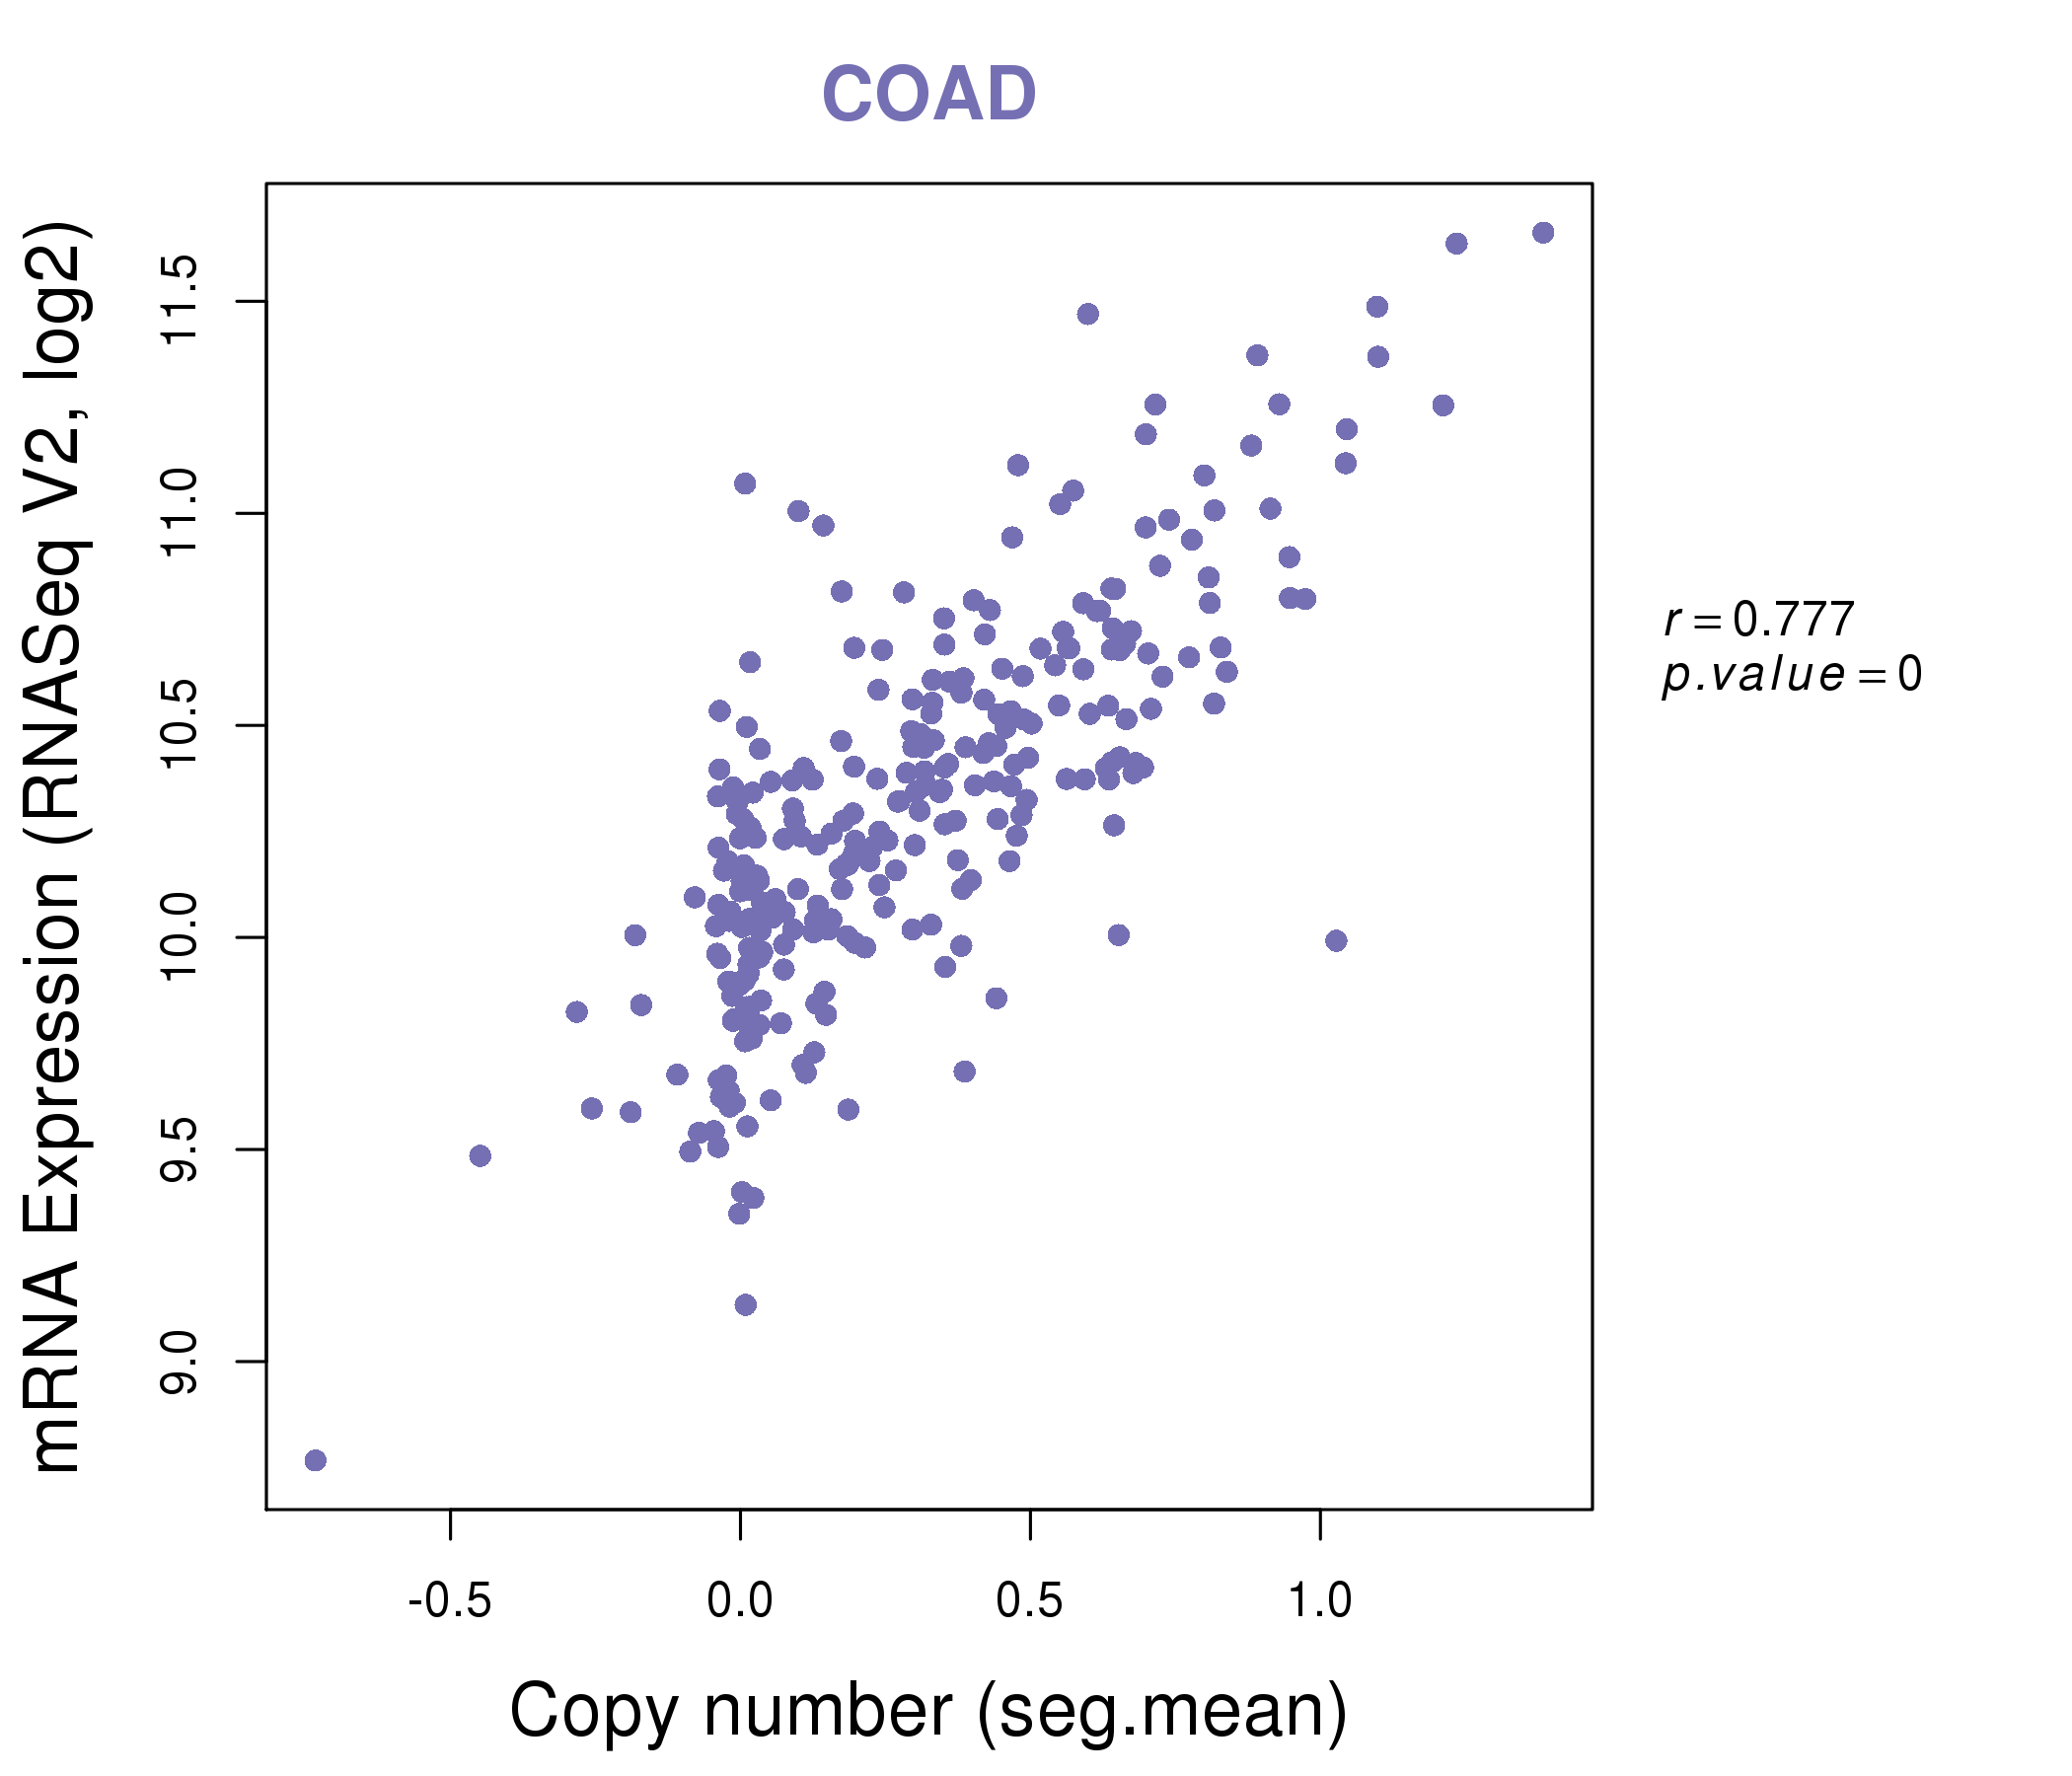
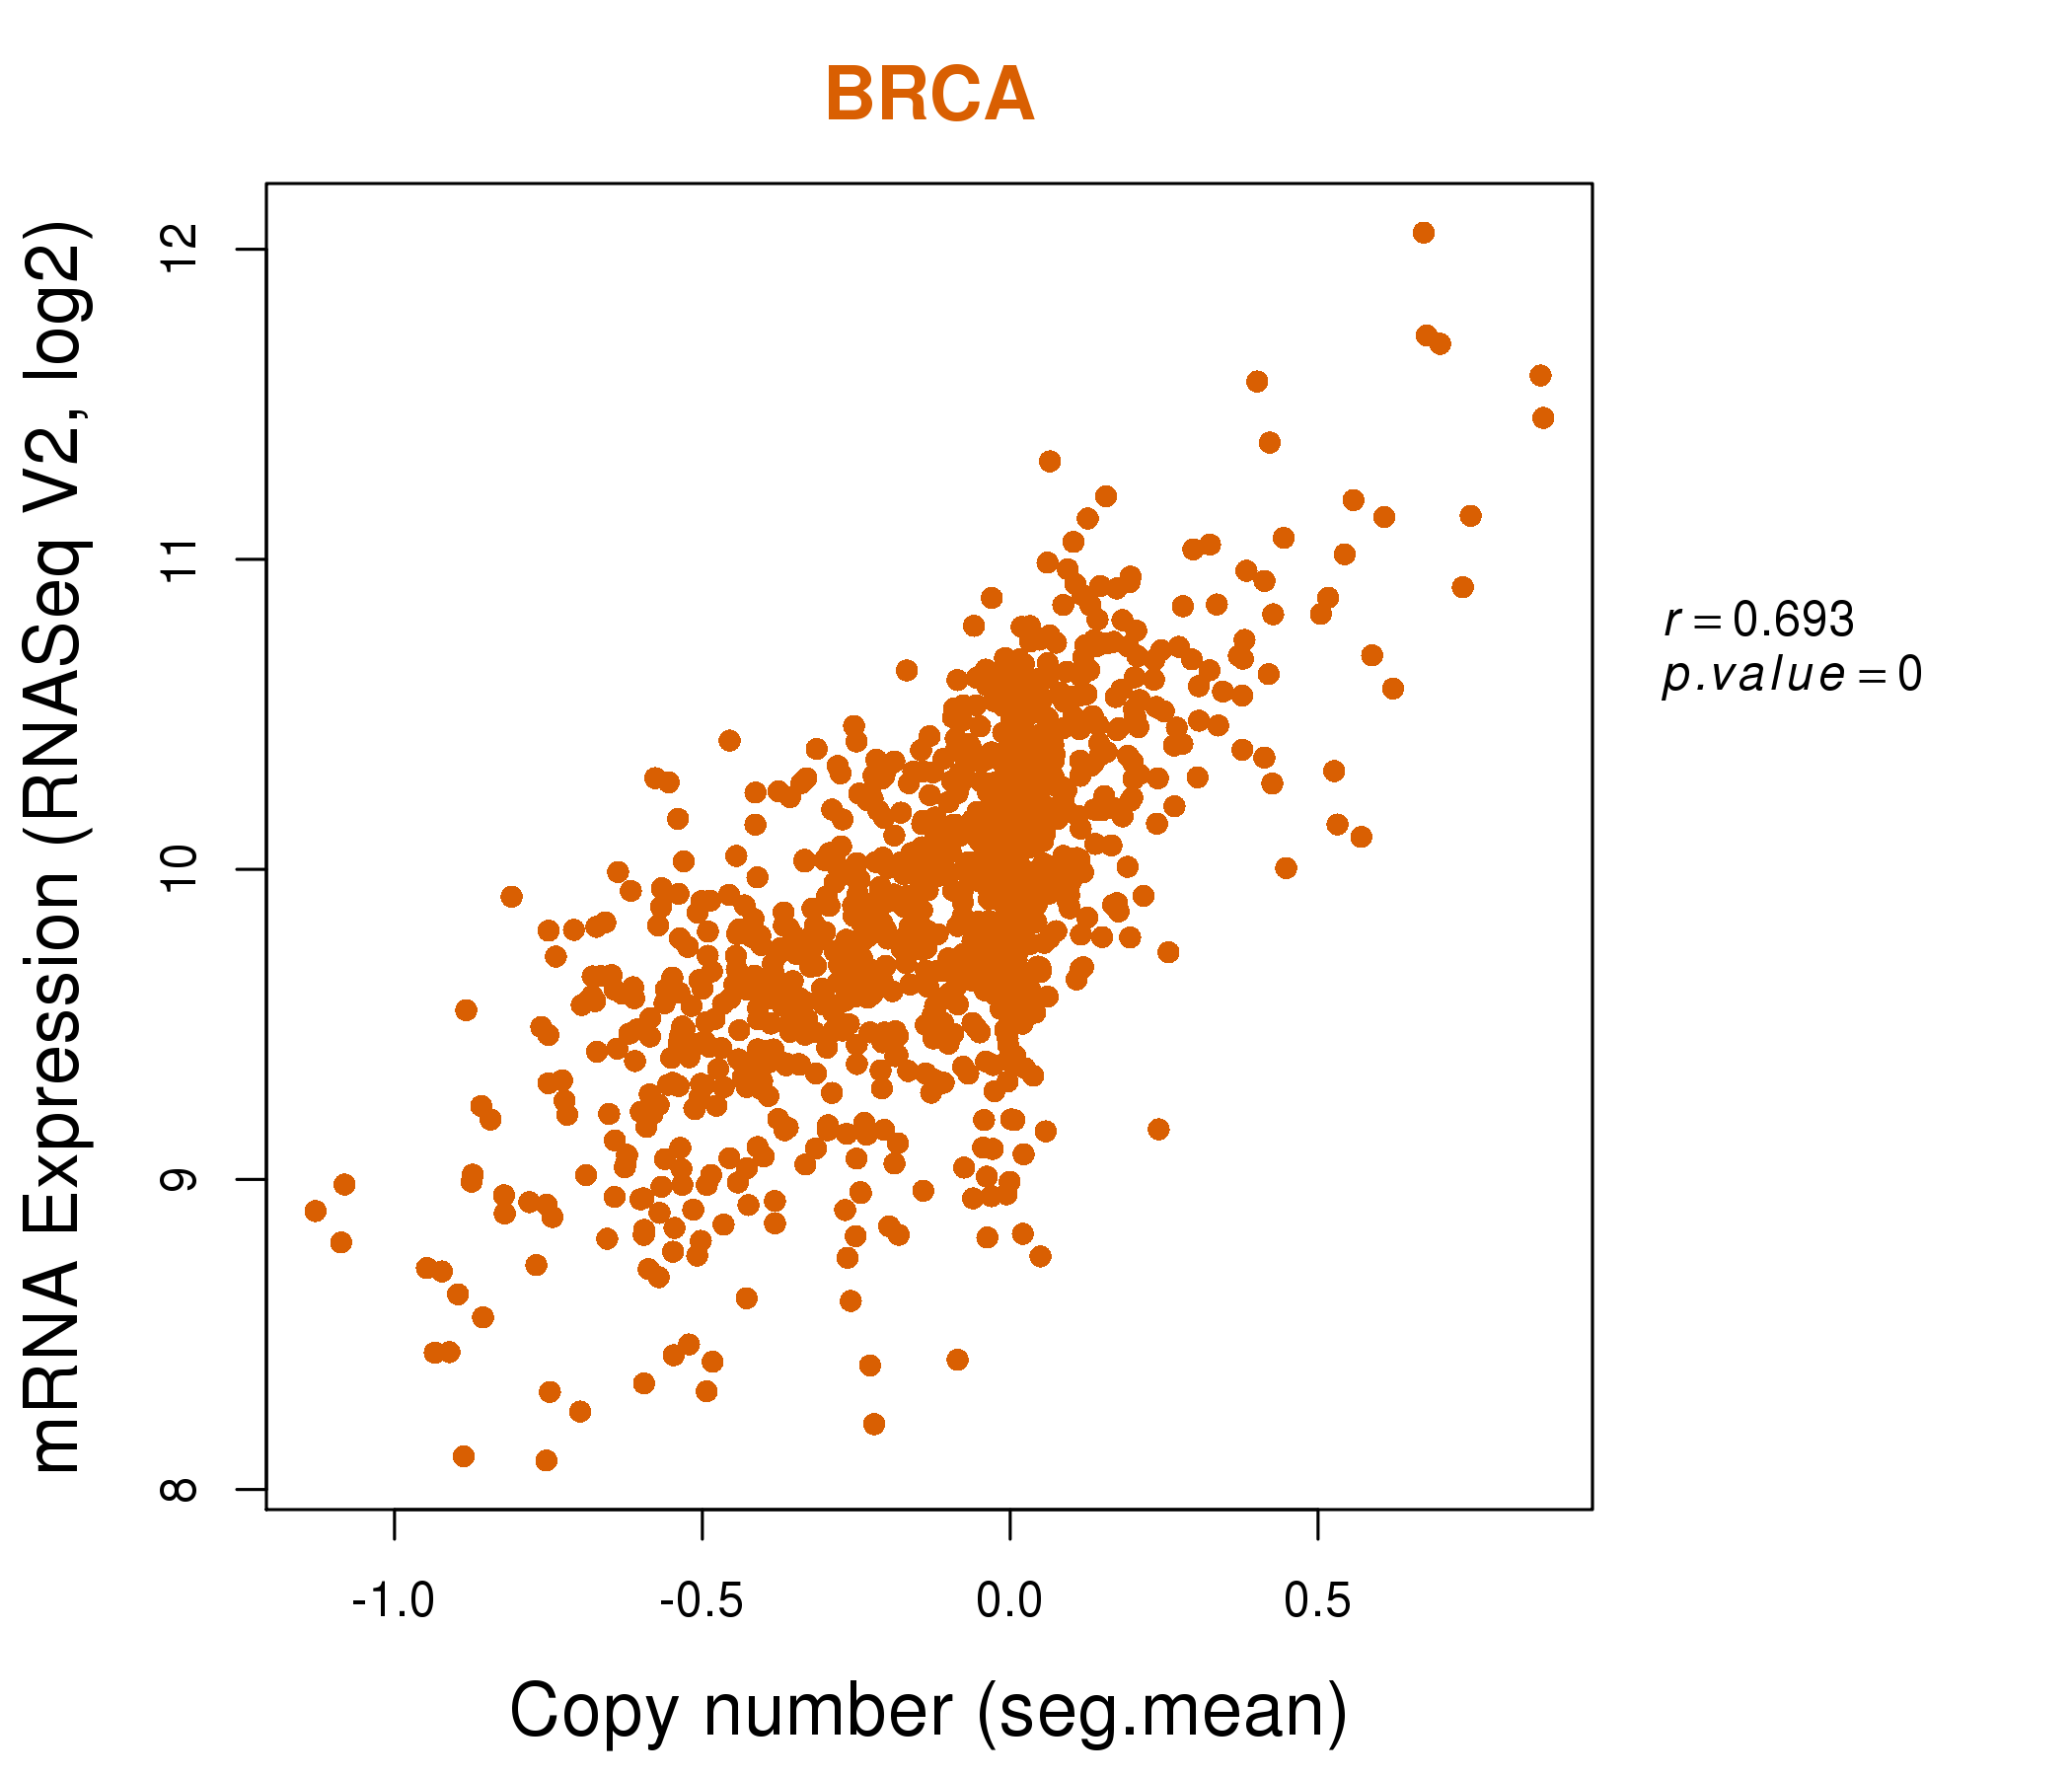
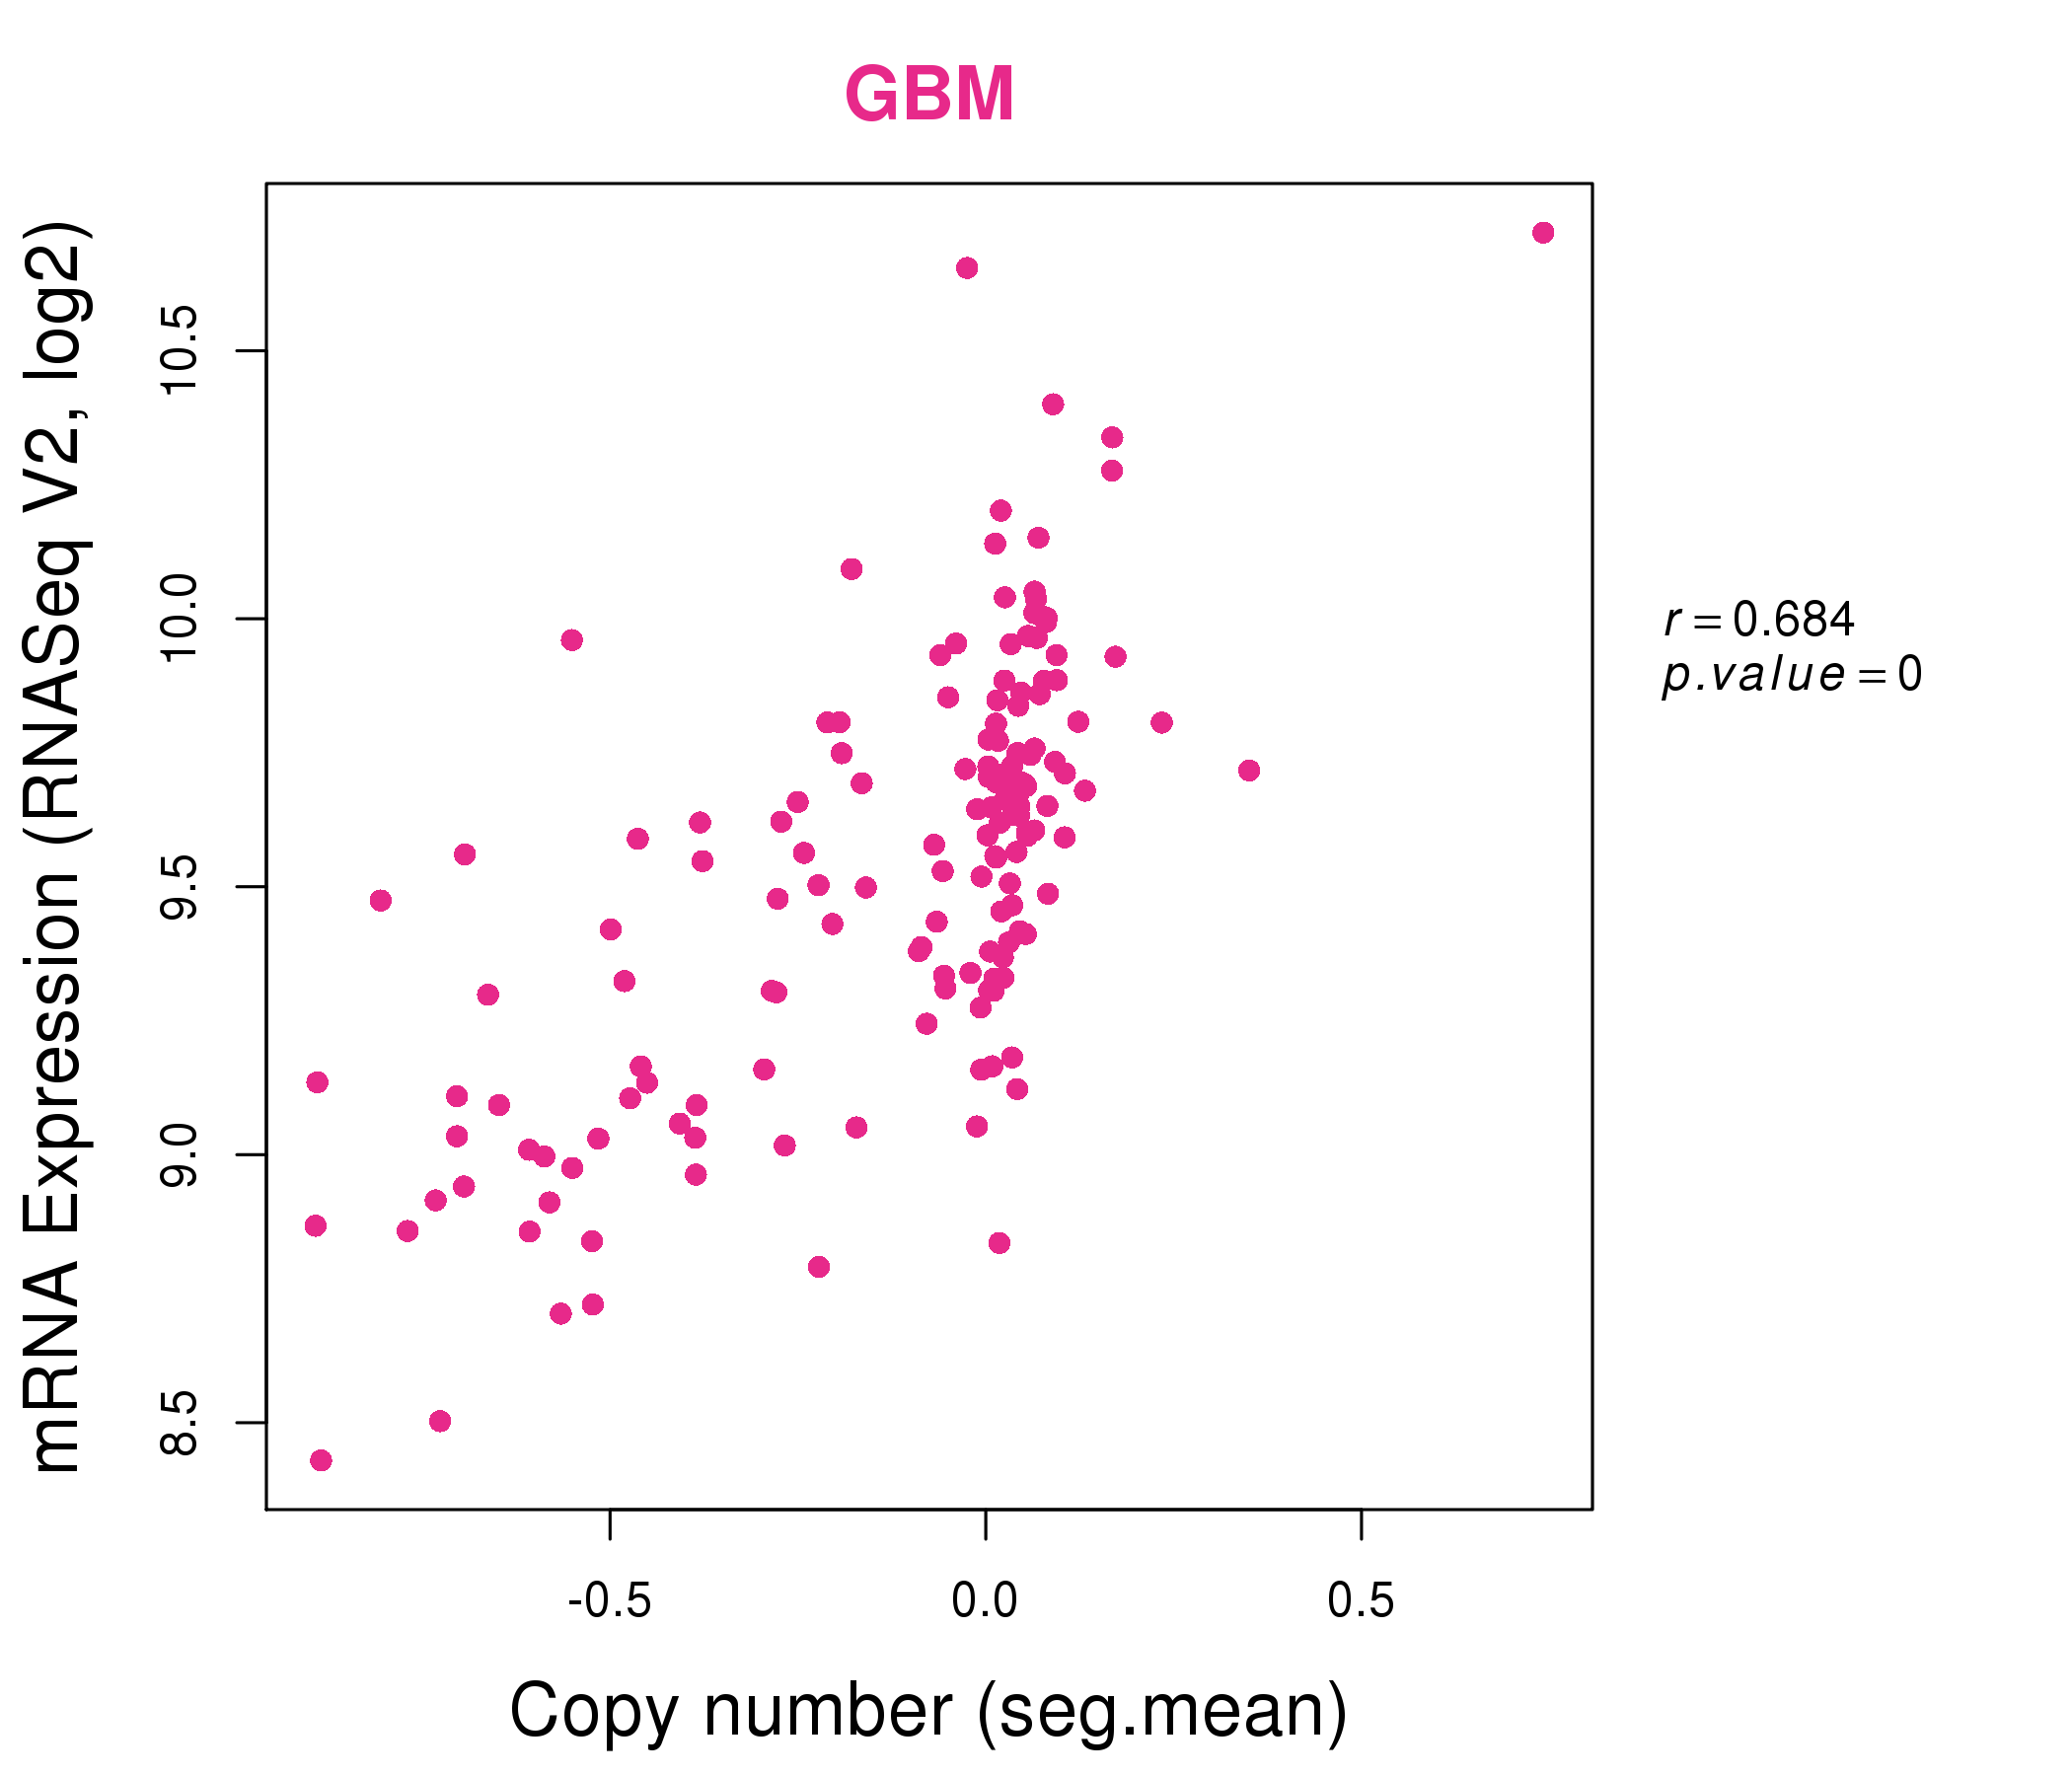
| * Normalized gene expression data of RNASeqV2 was extracted from TCGA using R package TCGA-Assembler. The URLs of all public data files on TCGA DCC data server were gathered at Jan-05-2015. Only eight cancer types have enough normal control samples for differential expression analysis. (t test, adjusted p<0.05 (using Benjamini-Hochberg FDR)) |
 |
| Top |
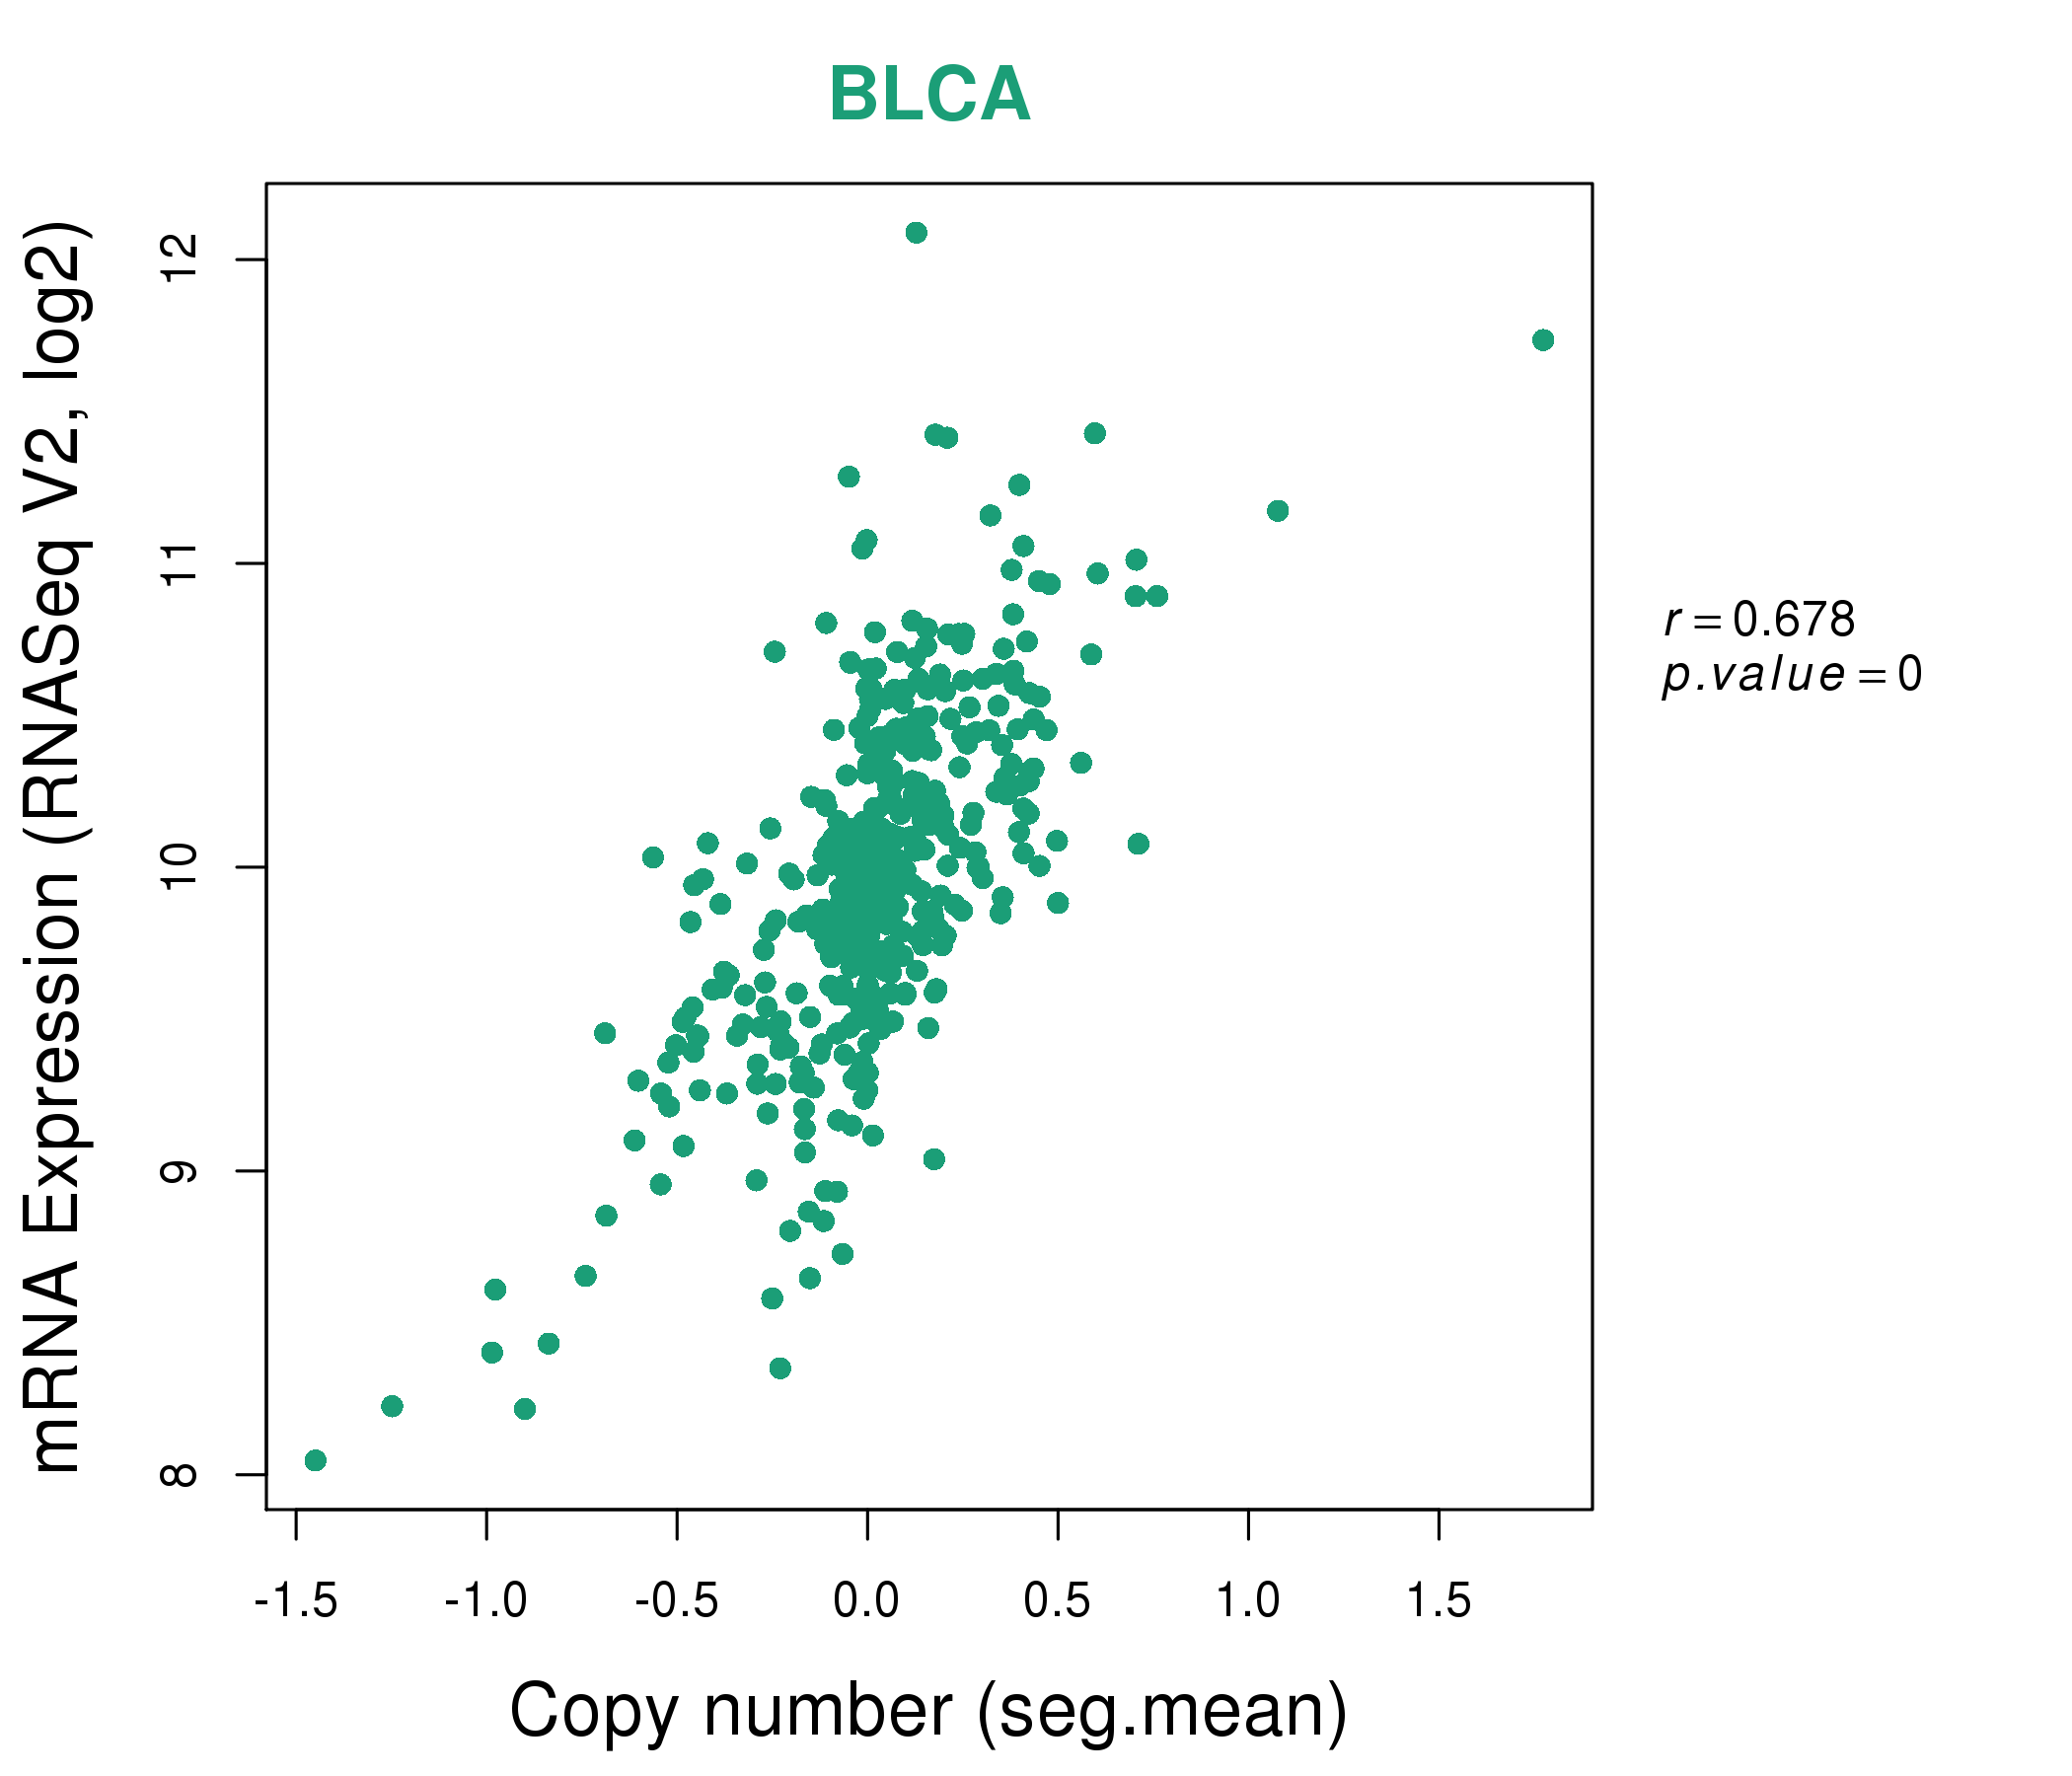
| * This plots show the correlation between CNV and gene expression. |
: Open all plots for all cancer types
 |
|
 |
|
| Top |
| Gene-Gene Network Information |
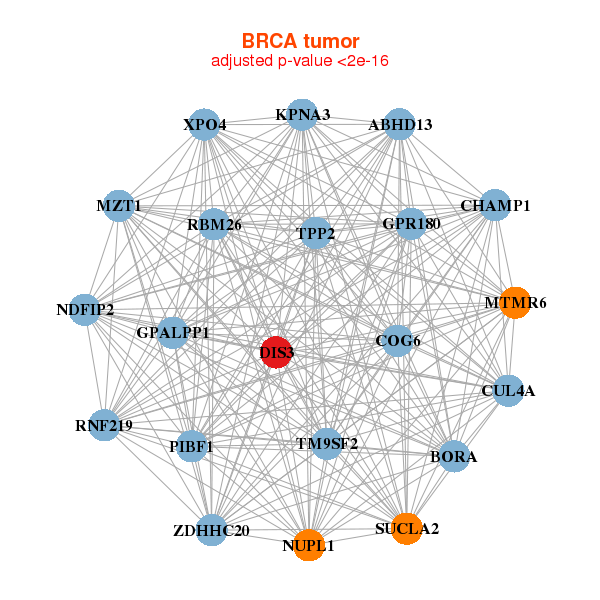
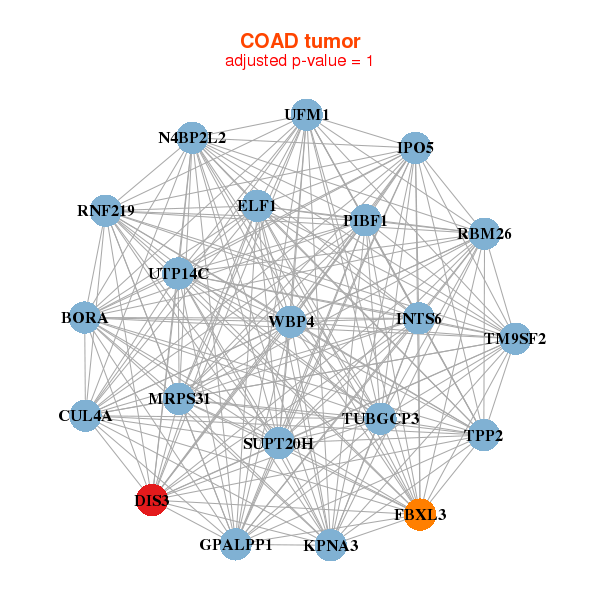
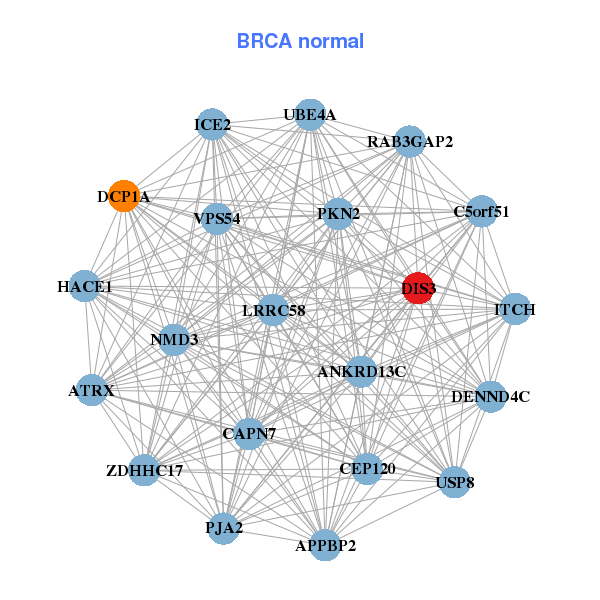
| * Co-Expression network figures were drawn using R package igraph. Only the top 20 genes with the highest correlations were shown. Red circle: input gene, orange circle: cell metabolism gene, sky circle: other gene |
: Open all plots for all cancer types
 |
|
| ABHD13,BORA,MZT1,COG6,CUL4A,DIS3,GPR180, GPALPP1,KPNA3,MTMR6,NDFIP2,NUPL1,PIBF1,RBM26, RNF219,SUCLA2,TM9SF2,TPP2,XPO4,ZDHHC20,CHAMP1 | ANKRD13C,APPBP2,ATRX,C5orf51,CAPN7,CEP120,DCP1A, DENND4C,DIS3,HACE1,ITCH,LRRC58,ICE2,NMD3, PJA2,PKN2,RAB3GAP2,UBE4A,USP8,VPS54,ZDHHC17 |
 |
|
| BORA,CUL4A,DIS3,ELF1,SUPT20H,FBXL3,INTS6, IPO5,GPALPP1,KPNA3,MRPS31,N4BP2L2,PIBF1,RBM26, RNF219,TM9SF2,TPP2,TUBGCP3,UFM1,UTP14C,WBP4 | CAND1,CWC22,DIS3,EYA3,OTULIN,FUBP1,HNRNPR, KIAA1033,MTDH,NAA50,NUP160,PRPF40A,RAB3GAP2,RBM12, RBM27,SEC23IP,SMARCA5,STT3B,SUZ12,TAF2,UBE3A |
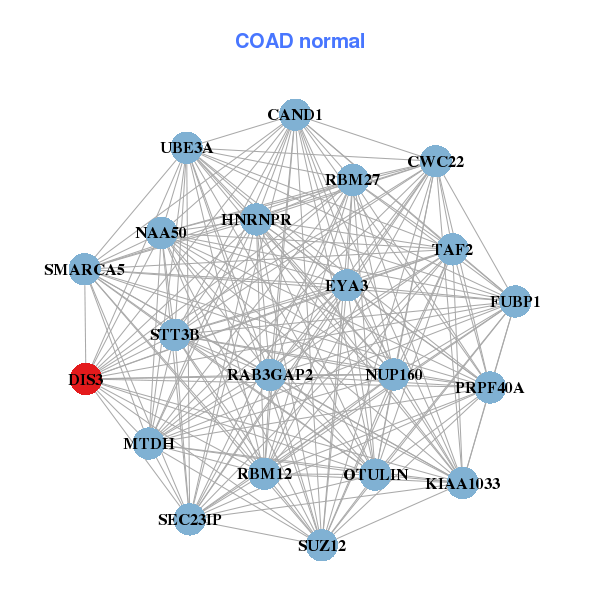
| * Co-Expression network figures were drawn using R package igraph. Only the top 20 genes with the highest correlations were shown. Red circle: input gene, orange circle: cell metabolism gene, sky circle: other gene |
: Open all plots for all cancer types
| Top |
: Open all interacting genes' information including KEGG pathway for all interacting genes from DAVID
| Top |
| Pharmacological Information for DIS3 |
| There's no related Drug. |
| Top |
| Cross referenced IDs for DIS3 |
| * We obtained these cross-references from Uniprot database. It covers 150 different DBs, 18 categories. http://www.uniprot.org/help/cross_references_section |
: Open all cross reference information
|
Copyright © 2016-Present - The Univsersity of Texas Health Science Center at Houston @ |