|
||||||||||||||||||||||||||||||||||||||||||||||||||||||||||||||||||||||||||||||||||||||||||||||||||||||||||||||||||||||||||||||||||||||||||||||||||||||||||||||||||||||||||||||||||||||||||||||||||||||||||||||||||||||||||||||||||||||||||||||||||||||||||||||||||||||||||||||||||||||||||||||||||||||||||||||||||||||||||
| |
| Phenotypic Information (metabolism pathway, cancer, disease, phenome) |
| |
| |
| Gene-Gene Network Information: Co-Expression Network, Interacting Genes & KEGG |
| |
|


| Gene Summary for ARSG |
| Basic gene info. | Gene symbol | ARSG |
| Gene name | arylsulfatase G | |
| Synonyms | - | |
| Cytomap | UCSC genome browser: 17q24.2 | |
| Genomic location | chr17 :66255322-66417000 | |
| Type of gene | protein-coding | |
| RefGenes | NM_001267727.1, NM_014960.4, | |
| Ensembl id | ENSG00000263074 | |
| Description | ASG | |
| Modification date | 20141222 | |
| dbXrefs | MIM : 610008 | |
| HGNC : HGNC | ||
| Ensembl : ENSG00000141337 | ||
| HPRD : 13826 | ||
| Protein | UniProt: go to UniProt's Cross Reference DB Table | |
| Expression | CleanEX: HS_ARSG | |
| BioGPS: 22901 | ||
| Gene Expression Atlas: ENSG00000263074 | ||
| The Human Protein Atlas: ENSG00000263074 | ||
| Pathway | NCI Pathway Interaction Database: ARSG | |
| KEGG: ARSG | ||
| REACTOME: ARSG | ||
| ConsensusPathDB | ||
| Pathway Commons: ARSG | ||
| Metabolism | MetaCyc: ARSG | |
| HUMANCyc: ARSG | ||
| Regulation | Ensembl's Regulation: ENSG00000263074 | |
| miRBase: chr17 :66,255,322-66,417,000 | ||
| TargetScan: NM_001267727 | ||
| cisRED: ENSG00000263074 | ||
| Context | iHOP: ARSG | |
| cancer metabolism search in PubMed: ARSG | ||
| UCL Cancer Institute: ARSG | ||
| Assigned class in ccmGDB | C | |
| Top |
| Phenotypic Information for ARSG(metabolism pathway, cancer, disease, phenome) |
| Cancer | CGAP: ARSG |
| Familial Cancer Database: ARSG | |
| * This gene is included in those cancer gene databases. |
|
|
|
|
|
| . | ||||||||||||||||||||||||||||||||||||||||||||||||||||||||||||||||||||||||||||||||||||||||||||||||||||||||||||||||||||||||||||||||||||||||||||||||||||||||||||||||||||||||||||||||||||||||||||||||||||||||||||||||||||||||||||||||||||||||||||||||||||||||||||||||||||||||||||||||||||||||||||||||||||||||||||||||||||
Oncogene 1 | Significant driver gene in | |||||||||||||||||||||||||||||||||||||||||||||||||||||||||||||||||||||||||||||||||||||||||||||||||||||||||||||||||||||||||||||||||||||||||||||||||||||||||||||||||||||||||||||||||||||||||||||||||||||||||||||||||||||||||||||||||||||||||||||||||||||||||||||||||||||||||||||||||||||||||||||||||||||||||||||||||||||||||
| cf) number; DB name 1 Oncogene; http://nar.oxfordjournals.org/content/35/suppl_1/D721.long, 2 Tumor Suppressor gene; https://bioinfo.uth.edu/TSGene/, 3 Cancer Gene Census; http://www.nature.com/nrc/journal/v4/n3/abs/nrc1299.html, 4 CancerGenes; http://nar.oxfordjournals.org/content/35/suppl_1/D721.long, 5 Network of Cancer Gene; http://ncg.kcl.ac.uk/index.php, 1Therapeutic Vulnerabilities in Cancer; http://cbio.mskcc.org/cancergenomics/statius/ |
| REACTOME_GLYCOSPHINGOLIPID_METABOLISM REACTOME_PHOSPHOLIPID_METABOLISM REACTOME_METABOLISM_OF_PROTEINS REACTOME_SPHINGOLIPID_METABOLISM REACTOME_METABOLISM_OF_LIPIDS_AND_LIPOPROTEINS | |
| OMIM | |
| Orphanet | |
| Disease | KEGG Disease: ARSG |
| MedGen: ARSG (Human Medical Genetics with Condition) | |
| ClinVar: ARSG | |
| Phenotype | MGI: ARSG (International Mouse Phenotyping Consortium) |
| PhenomicDB: ARSG | |
| Mutations for ARSG |
| * Under tables are showing count per each tissue to give us broad intuition about tissue specific mutation patterns.You can go to the detailed page for each mutation database's web site. |
| - Statistics for Tissue and Mutation type | Top |
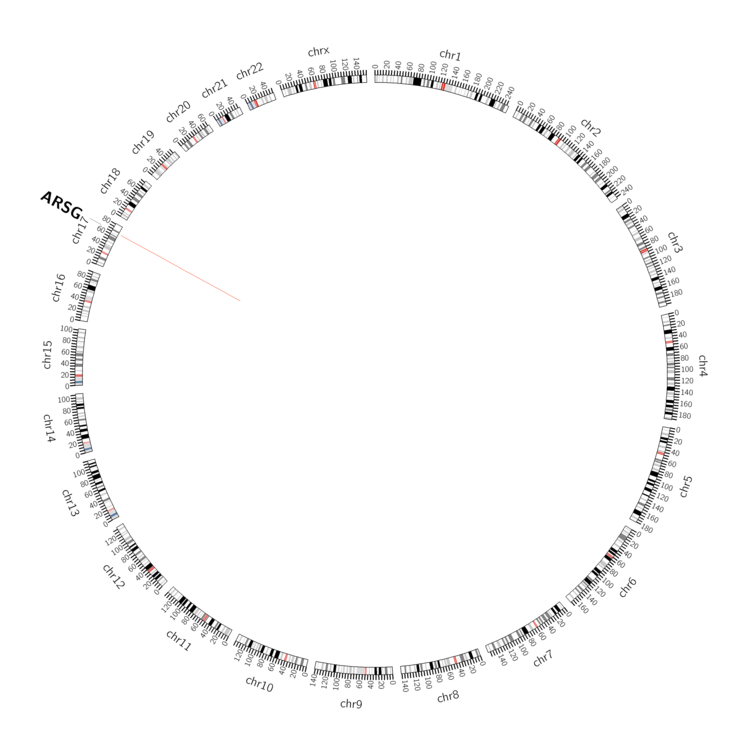 |
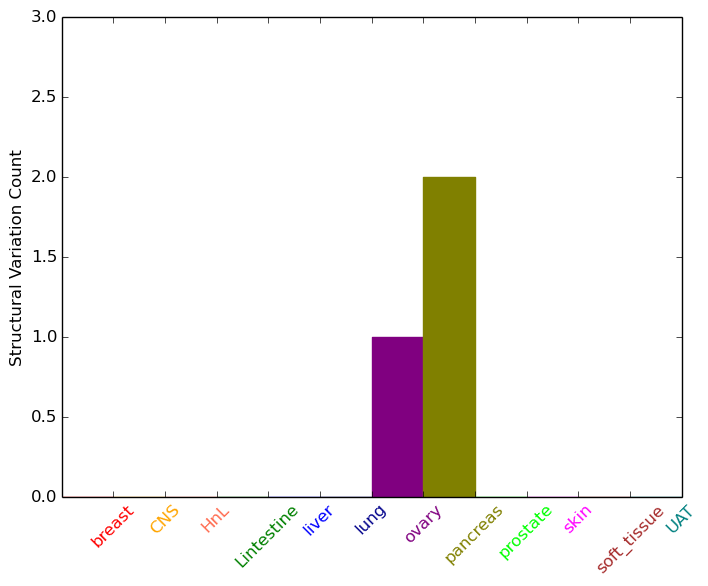
| - For Inter-chromosomal Variations |
| There's no inter-chromosomal structural variation. |
| - For Intra-chromosomal Variations |
| * Intra-chromosomal variantions includes 'intrachromosomal amplicon to amplicon', 'intrachromosomal amplicon to non-amplified dna', 'intrachromosomal deletion', 'intrachromosomal fold-back inversion', 'intrachromosomal inversion', 'intrachromosomal tandem duplication', 'Intrachromosomal unknown type', 'intrachromosomal with inverted orientation', 'intrachromosomal with non-inverted orientation'. |
 |
| Sample | Symbol_a | Chr_a | Start_a | End_a | Symbol_b | Chr_b | Start_b | End_b |
| ovary | ARSG | chr17 | 66380170 | 66380190 | ARSG | chr17 | 66380280 | 66380300 |
| pancreas | ARSG | chr17 | 66346880 | 66346900 | ARSG | chr17 | 66357914 | 66357934 |
| pancreas | ARSG | chr17 | 66346880 | 66346900 | ARSG | chr17 | 66359766 | 66359786 |
| cf) Tissue number; Tissue name (1;Breast, 2;Central_nervous_system, 3;Haematopoietic_and_lymphoid_tissue, 4;Large_intestine, 5;Liver, 6;Lung, 7;Ovary, 8;Pancreas, 9;Prostate, 10;Skin, 11;Soft_tissue, 12;Upper_aerodigestive_tract) |
| * From mRNA Sanger sequences, Chitars2.0 arranged chimeric transcripts. This table shows ARSG related fusion information. |
| ID | Head Gene | Tail Gene | Accession | Gene_a | qStart_a | qEnd_a | Chromosome_a | tStart_a | tEnd_a | Gene_a | qStart_a | qEnd_a | Chromosome_a | tStart_a | tEnd_a |
| BF333842 | ARSG | 13 | 138 | 17 | 66303372 | 66303497 | ARSG | 132 | 229 | 17 | 66303503 | 66303600 | |
| BE010668 | LOC100507391 | 11 | 31 | 3 | 194460335 | 194460355 | ARSG | 17 | 312 | 17 | 66358361 | 66358658 | |
| Top |
| Mutation type/ Tissue ID | brca | cns | cerv | endome | haematopo | kidn | Lintest | liver | lung | ns | ovary | pancre | prost | skin | stoma | thyro | urina | |||
| Total # sample | 11 | 1 | 1 | 2 | 1 | |||||||||||||||
| GAIN (# sample) | 11 | 1 | 1 | 1 | 1 | |||||||||||||||
| LOSS (# sample) | 1 |
| cf) Tissue ID; Tissue type (1; Breast, 2; Central_nervous_system, 3; Cervix, 4; Endometrium, 5; Haematopoietic_and_lymphoid_tissue, 6; Kidney, 7; Large_intestine, 8; Liver, 9; Lung, 10; NS, 11; Ovary, 12; Pancreas, 13; Prostate, 14; Skin, 15; Stomach, 16; Thyroid, 17; Urinary_tract) |
| Top |
|
 |
| Top |
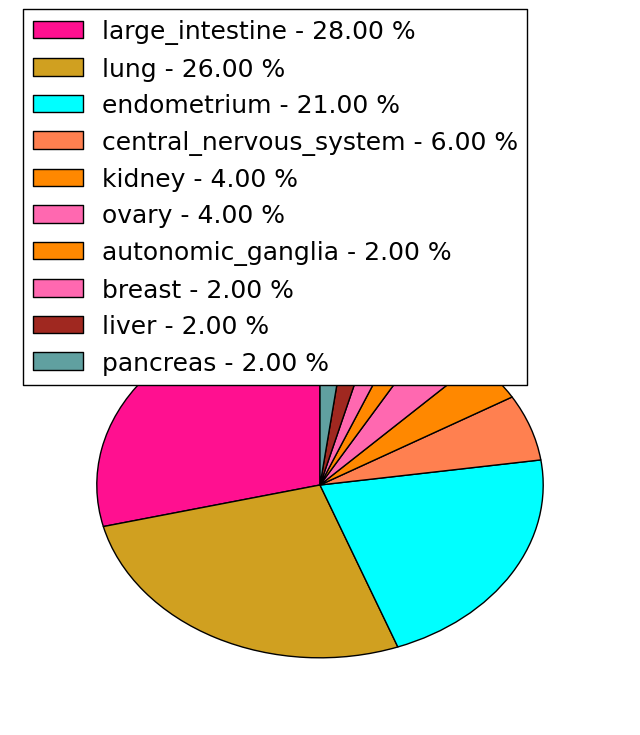
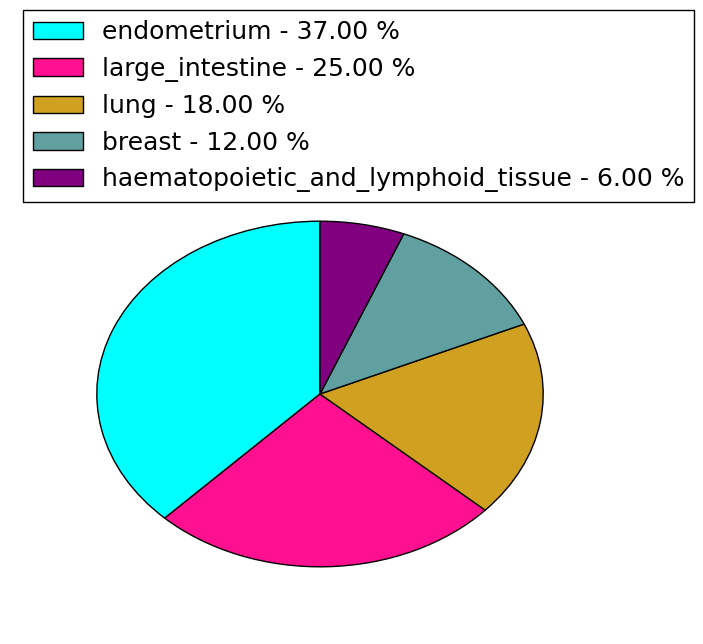
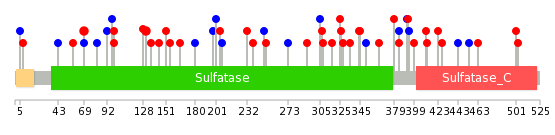
| Stat. for Non-Synonymous SNVs (# total SNVs=46) | (# total SNVs=16) |
 |  |
(# total SNVs=0) | (# total SNVs=0) |
| Top |
| * When you move the cursor on each content, you can see more deailed mutation information on the Tooltip. Those are primary_site,primary_histology,mutation(aa),pubmedID. |
| GRCh37 position | Mutation(aa) | Unique sampleID count |
| chr17:66381205-66381205 | p.G328V | 2 |
| chr17:66339821-66339821 | p.R99C | 2 |
| chr17:66391314-66391314 | p.R398W | 2 |
| chr17:66339917-66339917 | p.V131I | 2 |
| chr17:66303840-66303840 | p.S69L | 2 |
| chr17:66391258-66391258 | p.S379N | 2 |
| chr17:66364691-66364691 | p.T236S | 1 |
| chr17:66397567-66397567 | p.R427C | 1 |
| chr17:66416527-66416527 | p.A501T | 1 |
| chr17:66339772-66339772 | p.S82S | 1 |
| Top |
|
 |
| Point Mutation/ Tissue ID | 1 | 2 | 3 | 4 | 5 | 6 | 7 | 8 | 9 | 10 | 11 | 12 | 13 | 14 | 15 | 16 | 17 | 18 | 19 | 20 |
| # sample | 2 | 11 | 1 | 5 | 2 | 7 | 3 | 1 | 6 | 5 | 12 | |||||||||
| # mutation | 2 | 10 | 1 | 5 | 2 | 8 | 3 | 1 | 6 | 5 | 15 | |||||||||
| nonsynonymous SNV | 1 | 7 | 1 | 3 | 2 | 7 | 2 | 1 | 3 | 3 | 9 | |||||||||
| synonymous SNV | 1 | 3 | 2 | 1 | 1 | 3 | 2 | 6 |
| cf) Tissue ID; Tissue type (1; BLCA[Bladder Urothelial Carcinoma], 2; BRCA[Breast invasive carcinoma], 3; CESC[Cervical squamous cell carcinoma and endocervical adenocarcinoma], 4; COAD[Colon adenocarcinoma], 5; GBM[Glioblastoma multiforme], 6; Glioma Low Grade, 7; HNSC[Head and Neck squamous cell carcinoma], 8; KICH[Kidney Chromophobe], 9; KIRC[Kidney renal clear cell carcinoma], 10; KIRP[Kidney renal papillary cell carcinoma], 11; LAML[Acute Myeloid Leukemia], 12; LUAD[Lung adenocarcinoma], 13; LUSC[Lung squamous cell carcinoma], 14; OV[Ovarian serous cystadenocarcinoma ], 15; PAAD[Pancreatic adenocarcinoma], 16; PRAD[Prostate adenocarcinoma], 17; SKCM[Skin Cutaneous Melanoma], 18:STAD[Stomach adenocarcinoma], 19:THCA[Thyroid carcinoma], 20:UCEC[Uterine Corpus Endometrial Carcinoma]) |
| Top |
| * We represented just top 10 SNVs. When you move the cursor on each content, you can see more deailed mutation information on the Tooltip. Those are primary_site, primary_histology, mutation(aa), pubmedID. |
| Genomic Position | Mutation(aa) | Unique sampleID count |
| chr17:66339917 | p.V131I,ARSG | 2 |
| chr17:66303840 | p.S69L,ARSG | 2 |
| chr17:66366602 | p.A463T,ARSG | 1 |
| chr17:66339821 | p.S82S,ARSG | 1 |
| chr17:66391258 | p.L207L,ARSG | 1 |
| chr17:66352844 | p.A345S,ARSG | 1 |
| chr17:66416355 | p.A501T,ARSG | 1 |
| chr17:66366606 | p.L92L,ARSG | 1 |
| chr17:66339822 | p.Q232L,ARSG | 1 |
| chr17:66391272 | p.G351G,ARSG | 1 |
| * Copy number data were extracted from TCGA using R package TCGA-Assembler. The URLs of all public data files on TCGA DCC data server were gathered on Jan-05-2015. Function ProcessCNAData in TCGA-Assembler package was used to obtain gene-level copy number value which is calculated as the average copy number of the genomic region of a gene. |
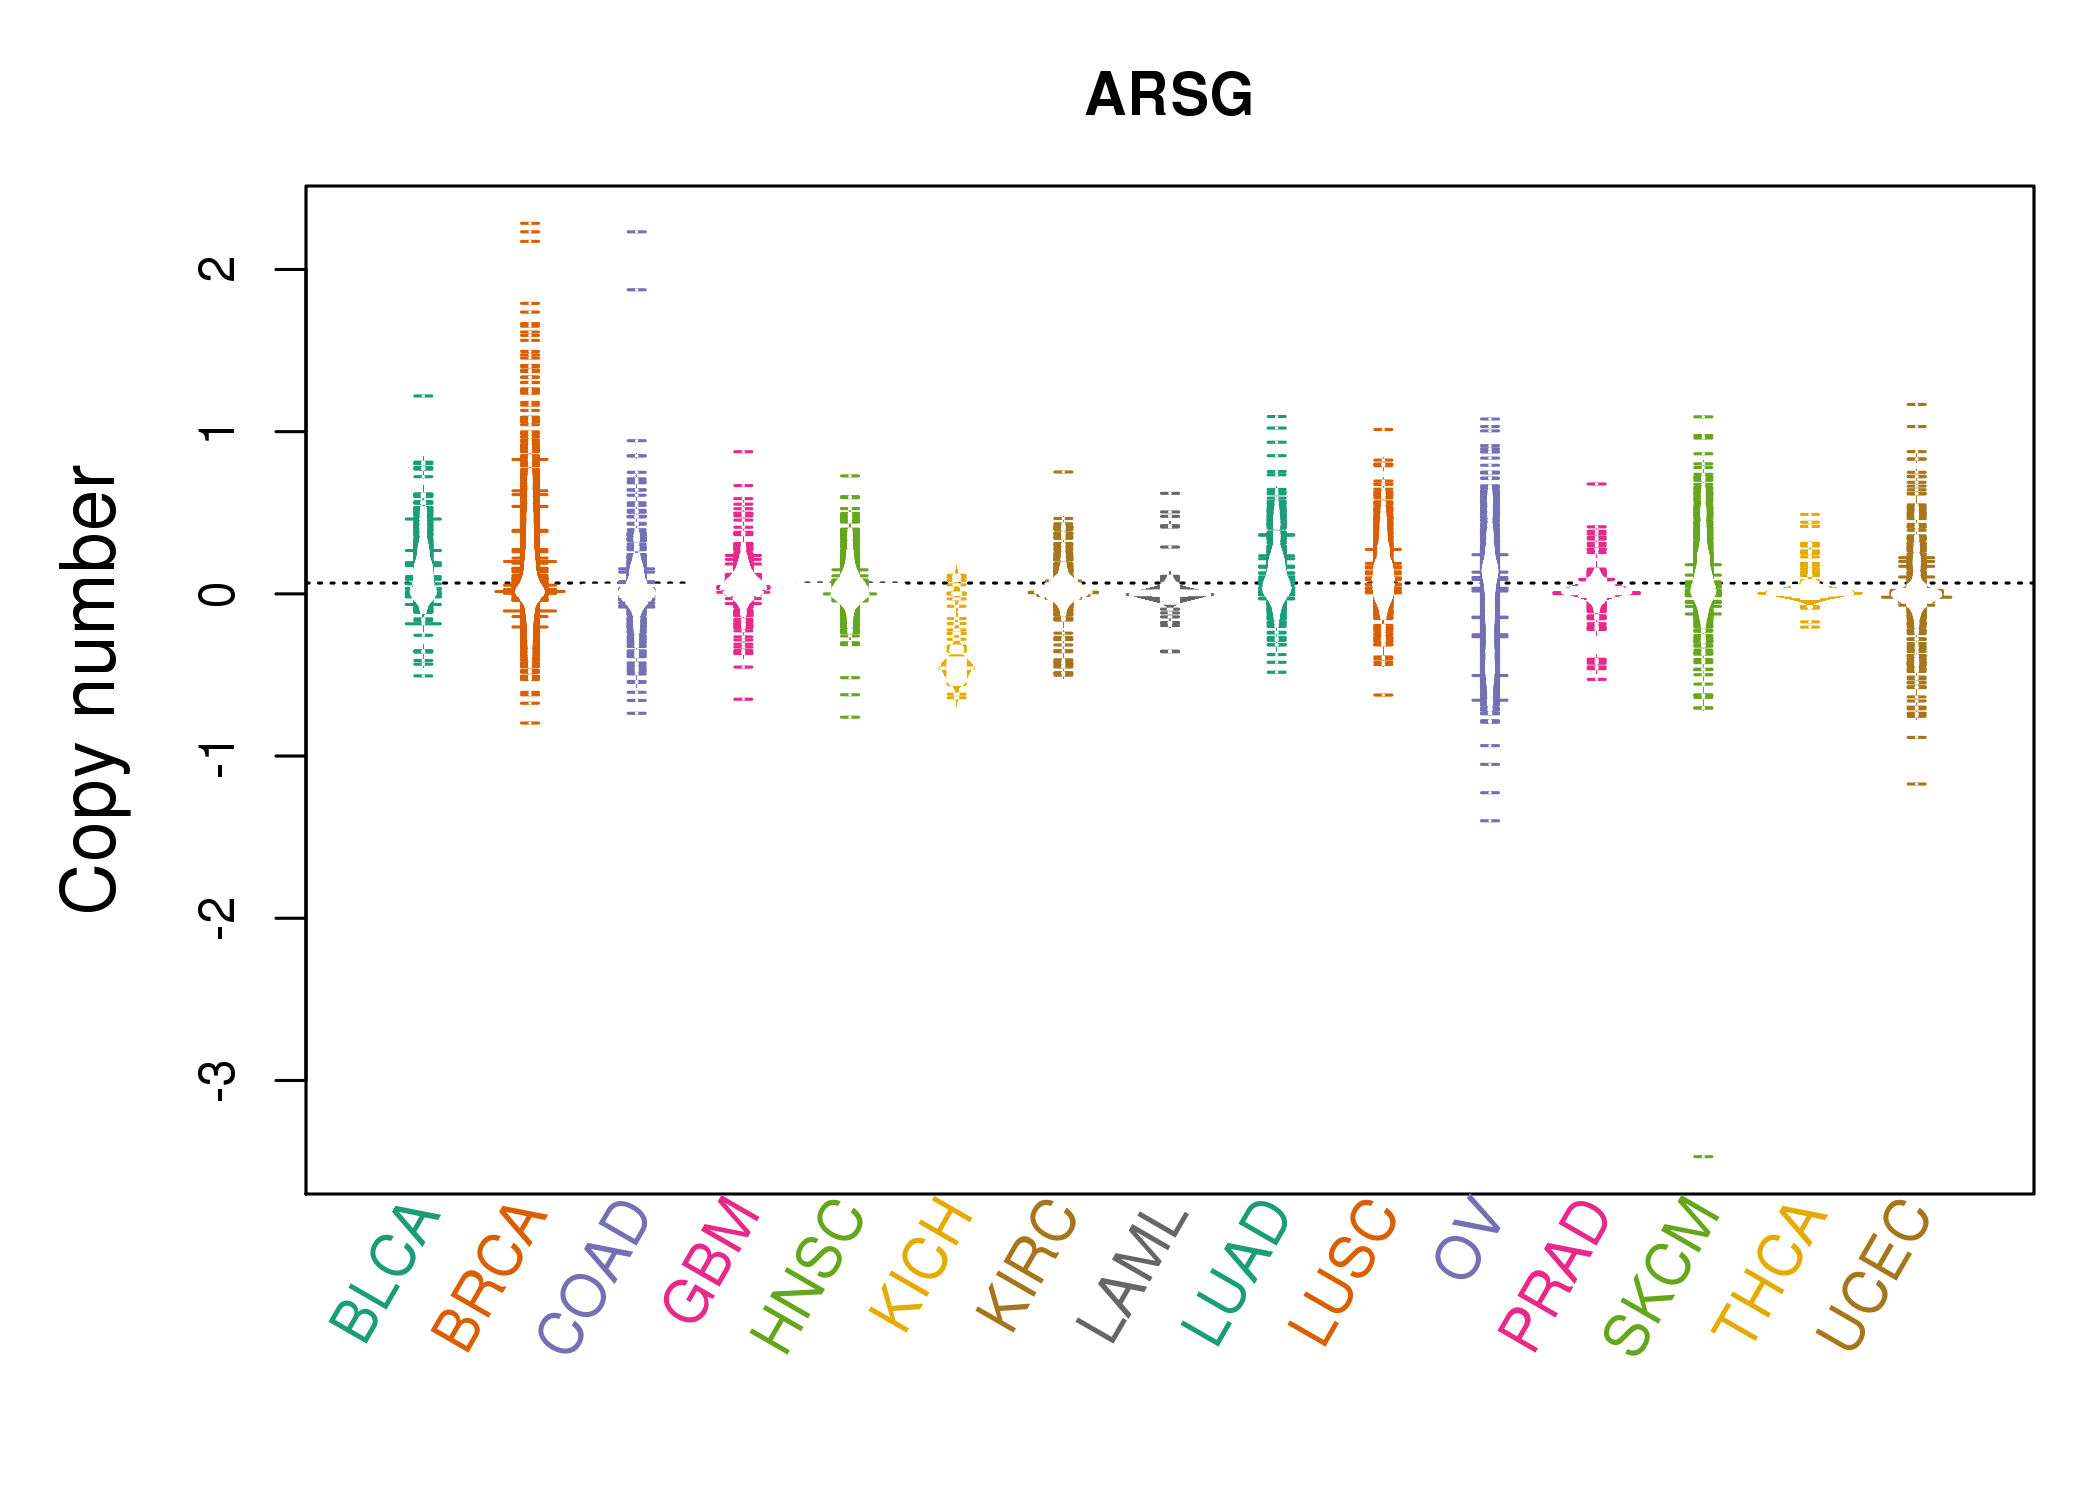 |
| cf) Tissue ID[Tissue type]: BLCA[Bladder Urothelial Carcinoma], BRCA[Breast invasive carcinoma], CESC[Cervical squamous cell carcinoma and endocervical adenocarcinoma], COAD[Colon adenocarcinoma], GBM[Glioblastoma multiforme], Glioma Low Grade, HNSC[Head and Neck squamous cell carcinoma], KICH[Kidney Chromophobe], KIRC[Kidney renal clear cell carcinoma], KIRP[Kidney renal papillary cell carcinoma], LAML[Acute Myeloid Leukemia], LUAD[Lung adenocarcinoma], LUSC[Lung squamous cell carcinoma], OV[Ovarian serous cystadenocarcinoma ], PAAD[Pancreatic adenocarcinoma], PRAD[Prostate adenocarcinoma], SKCM[Skin Cutaneous Melanoma], STAD[Stomach adenocarcinoma], THCA[Thyroid carcinoma], UCEC[Uterine Corpus Endometrial Carcinoma] |
| Top |
| Gene Expression for ARSG |
| * CCLE gene expression data were extracted from CCLE_Expression_Entrez_2012-10-18.res: Gene-centric RMA-normalized mRNA expression data. |
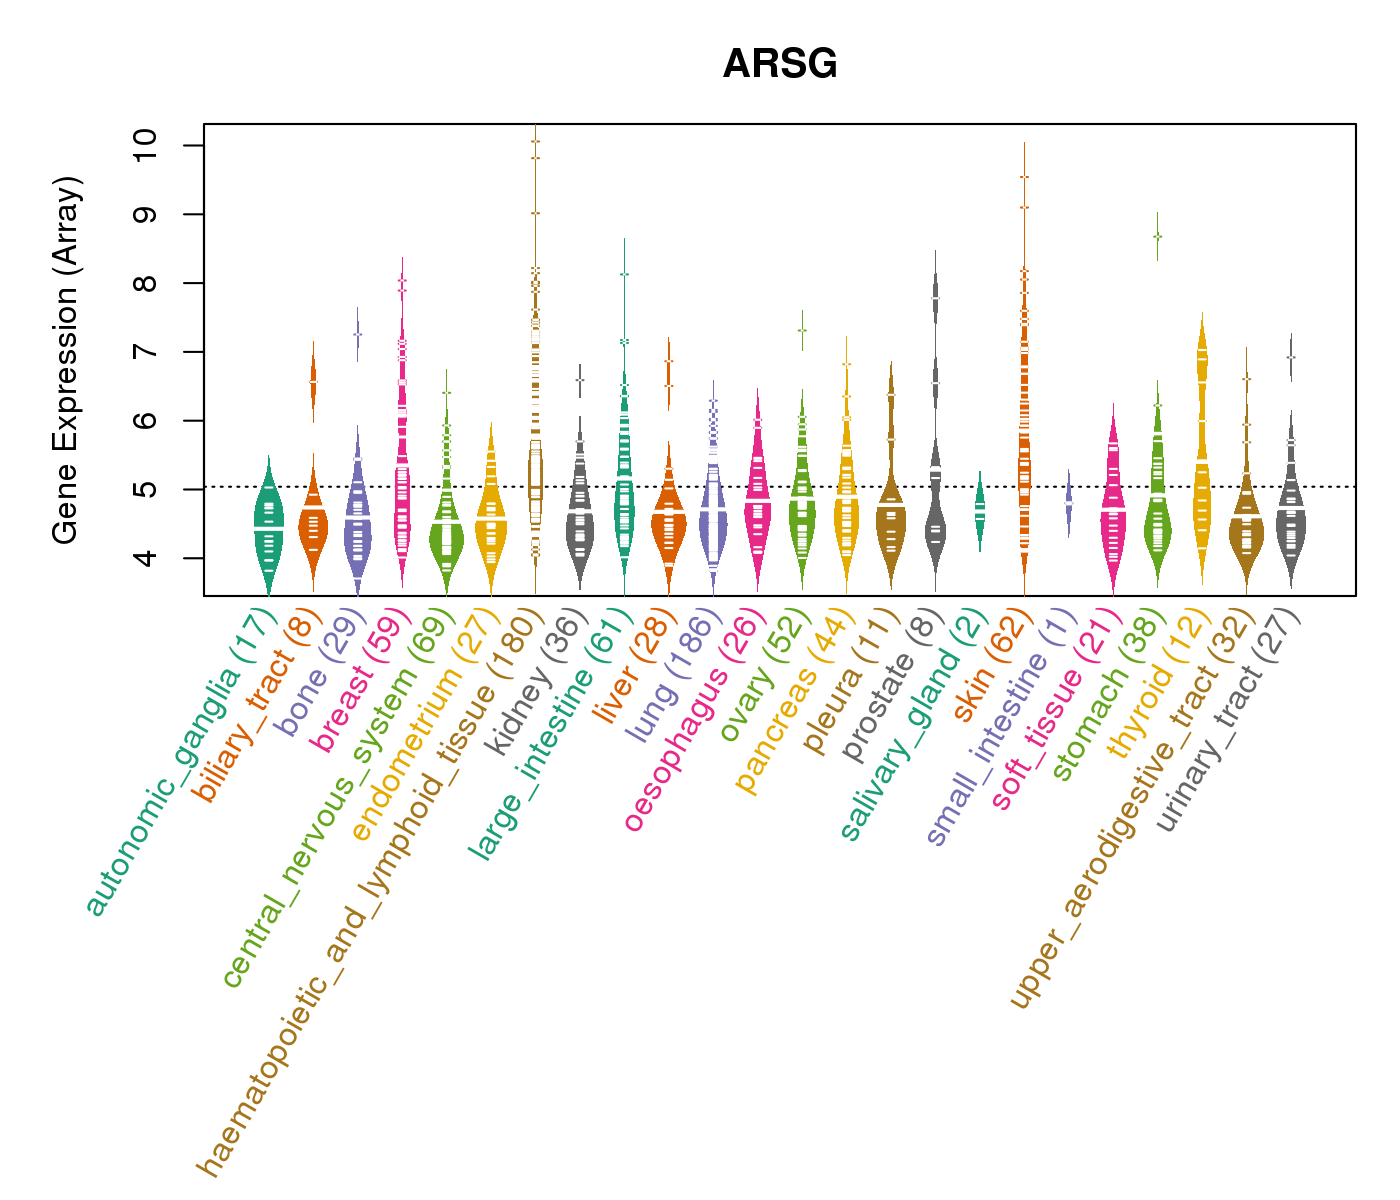 |
| * Normalized gene expression data of RNASeqV2 was extracted from TCGA using R package TCGA-Assembler. The URLs of all public data files on TCGA DCC data server were gathered at Jan-05-2015. Only eight cancer types have enough normal control samples for differential expression analysis. (t test, adjusted p<0.05 (using Benjamini-Hochberg FDR)) |
 |
| Top |
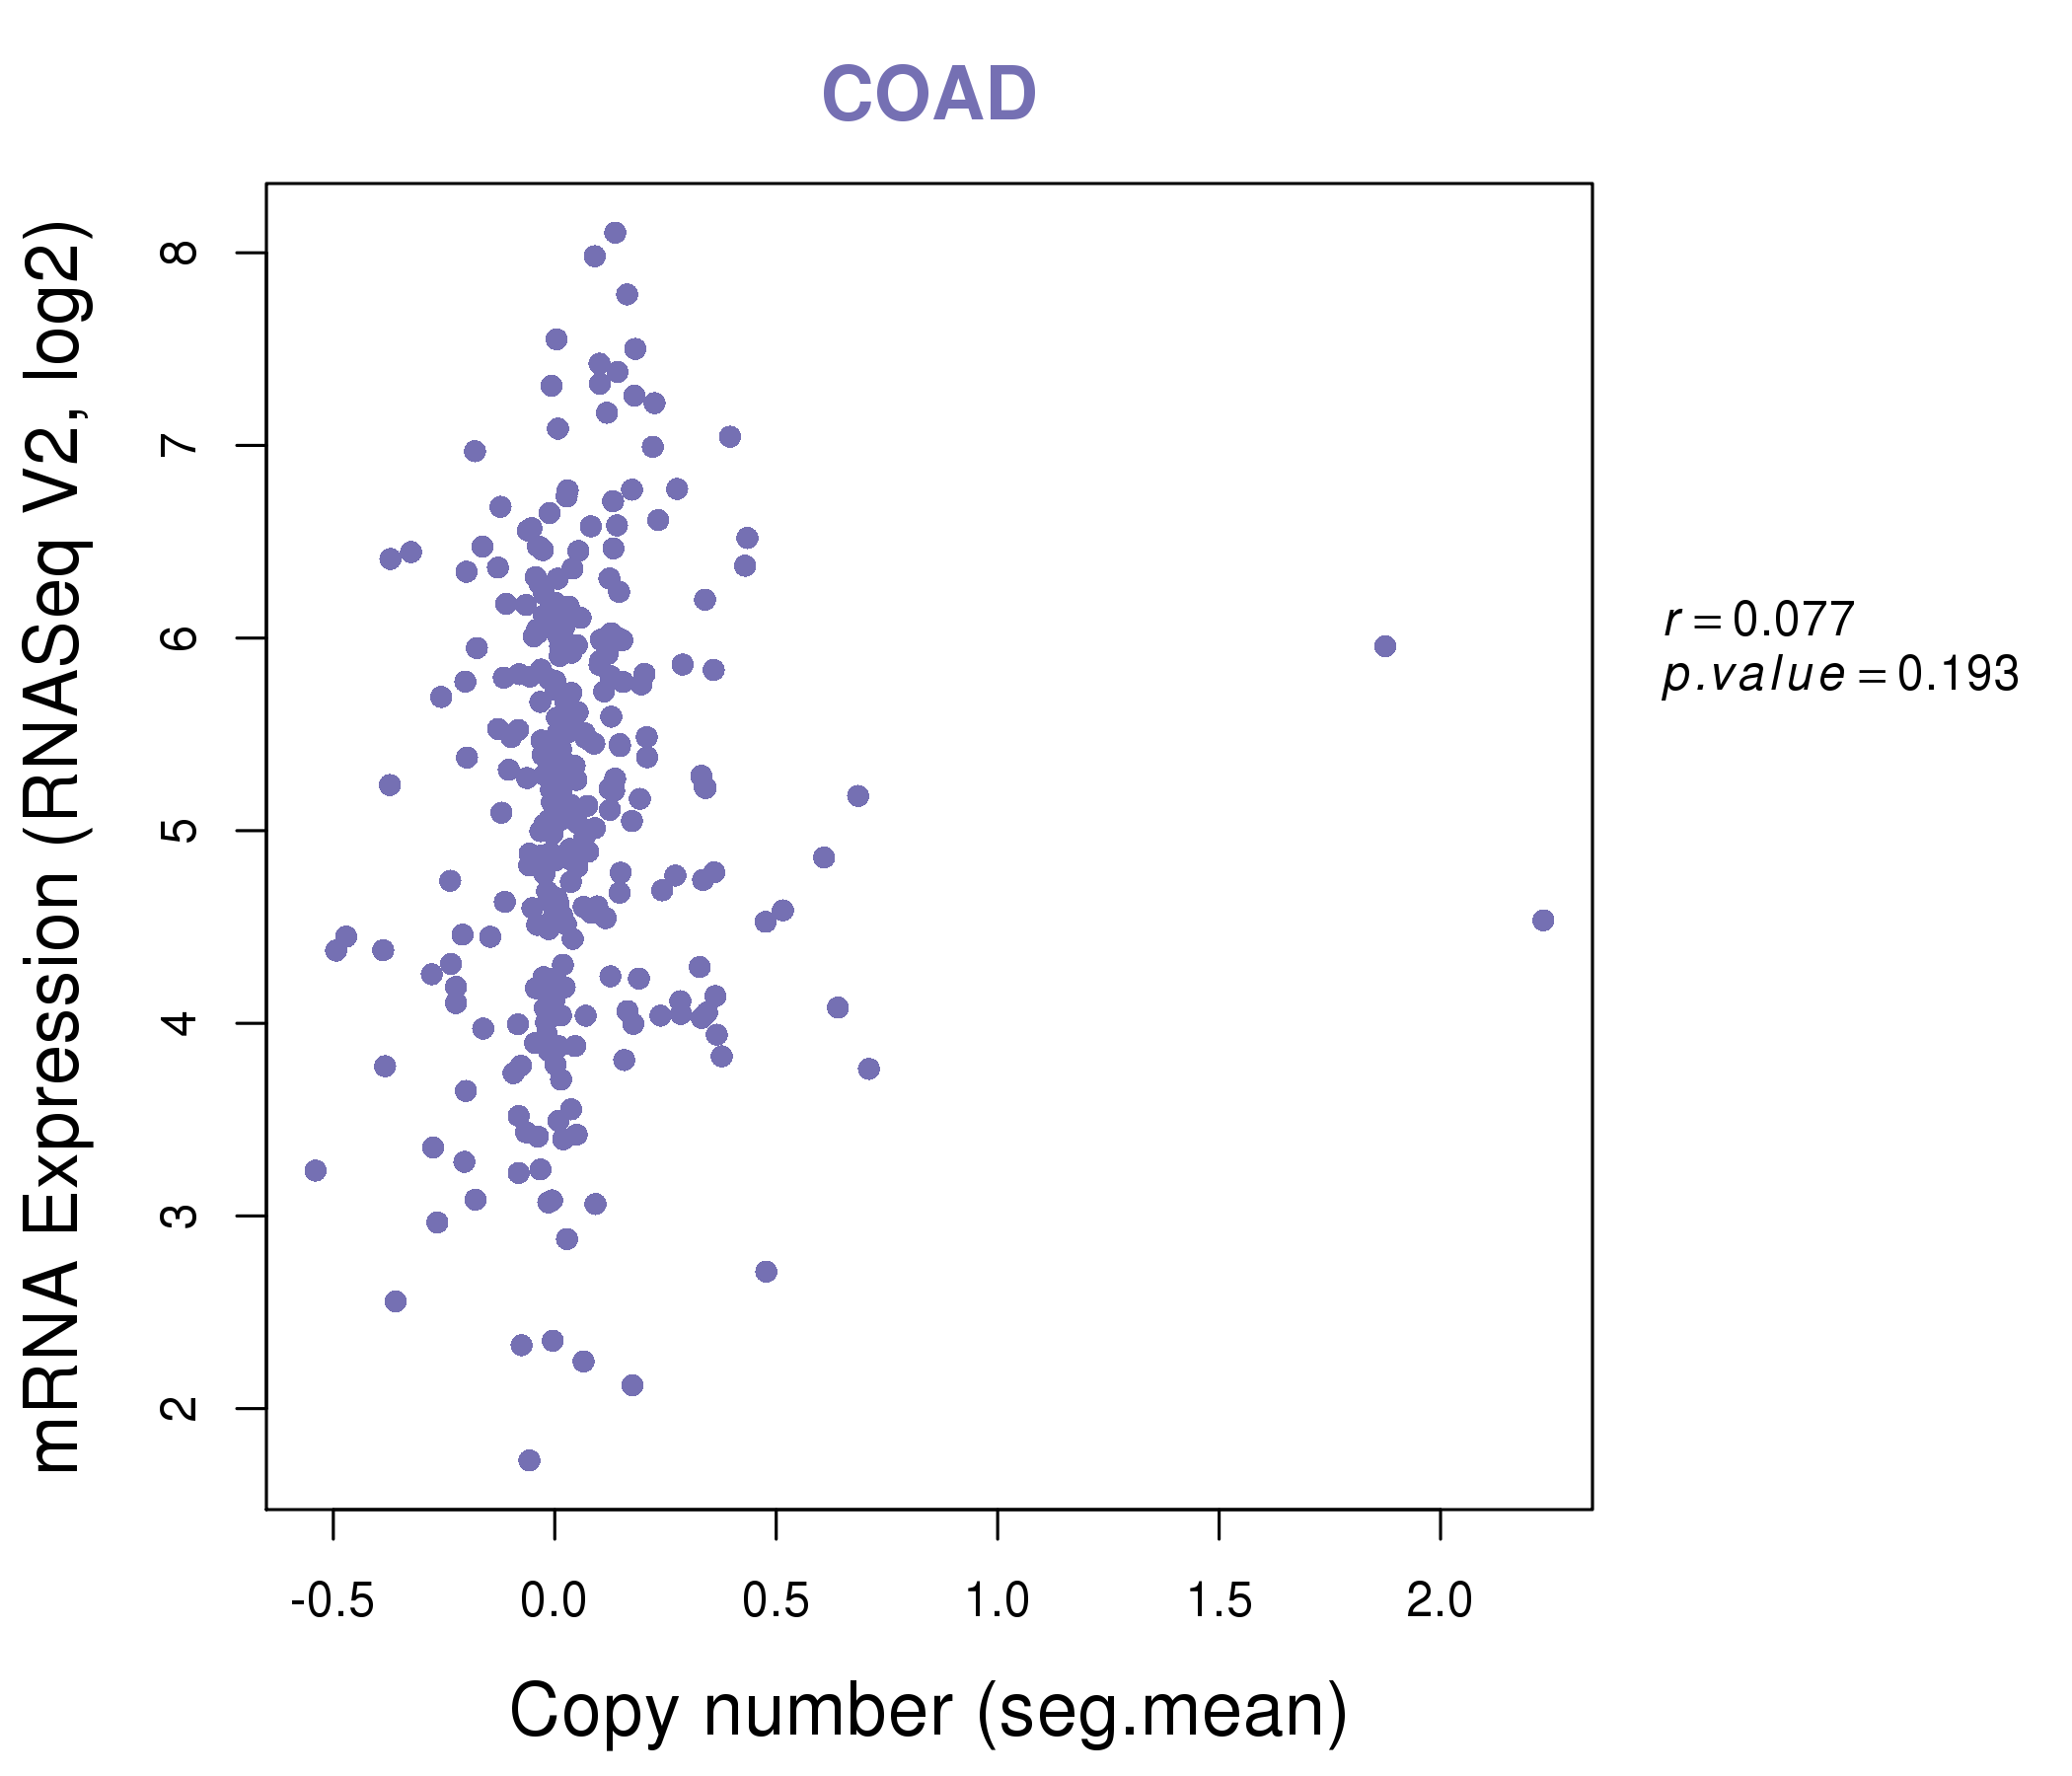
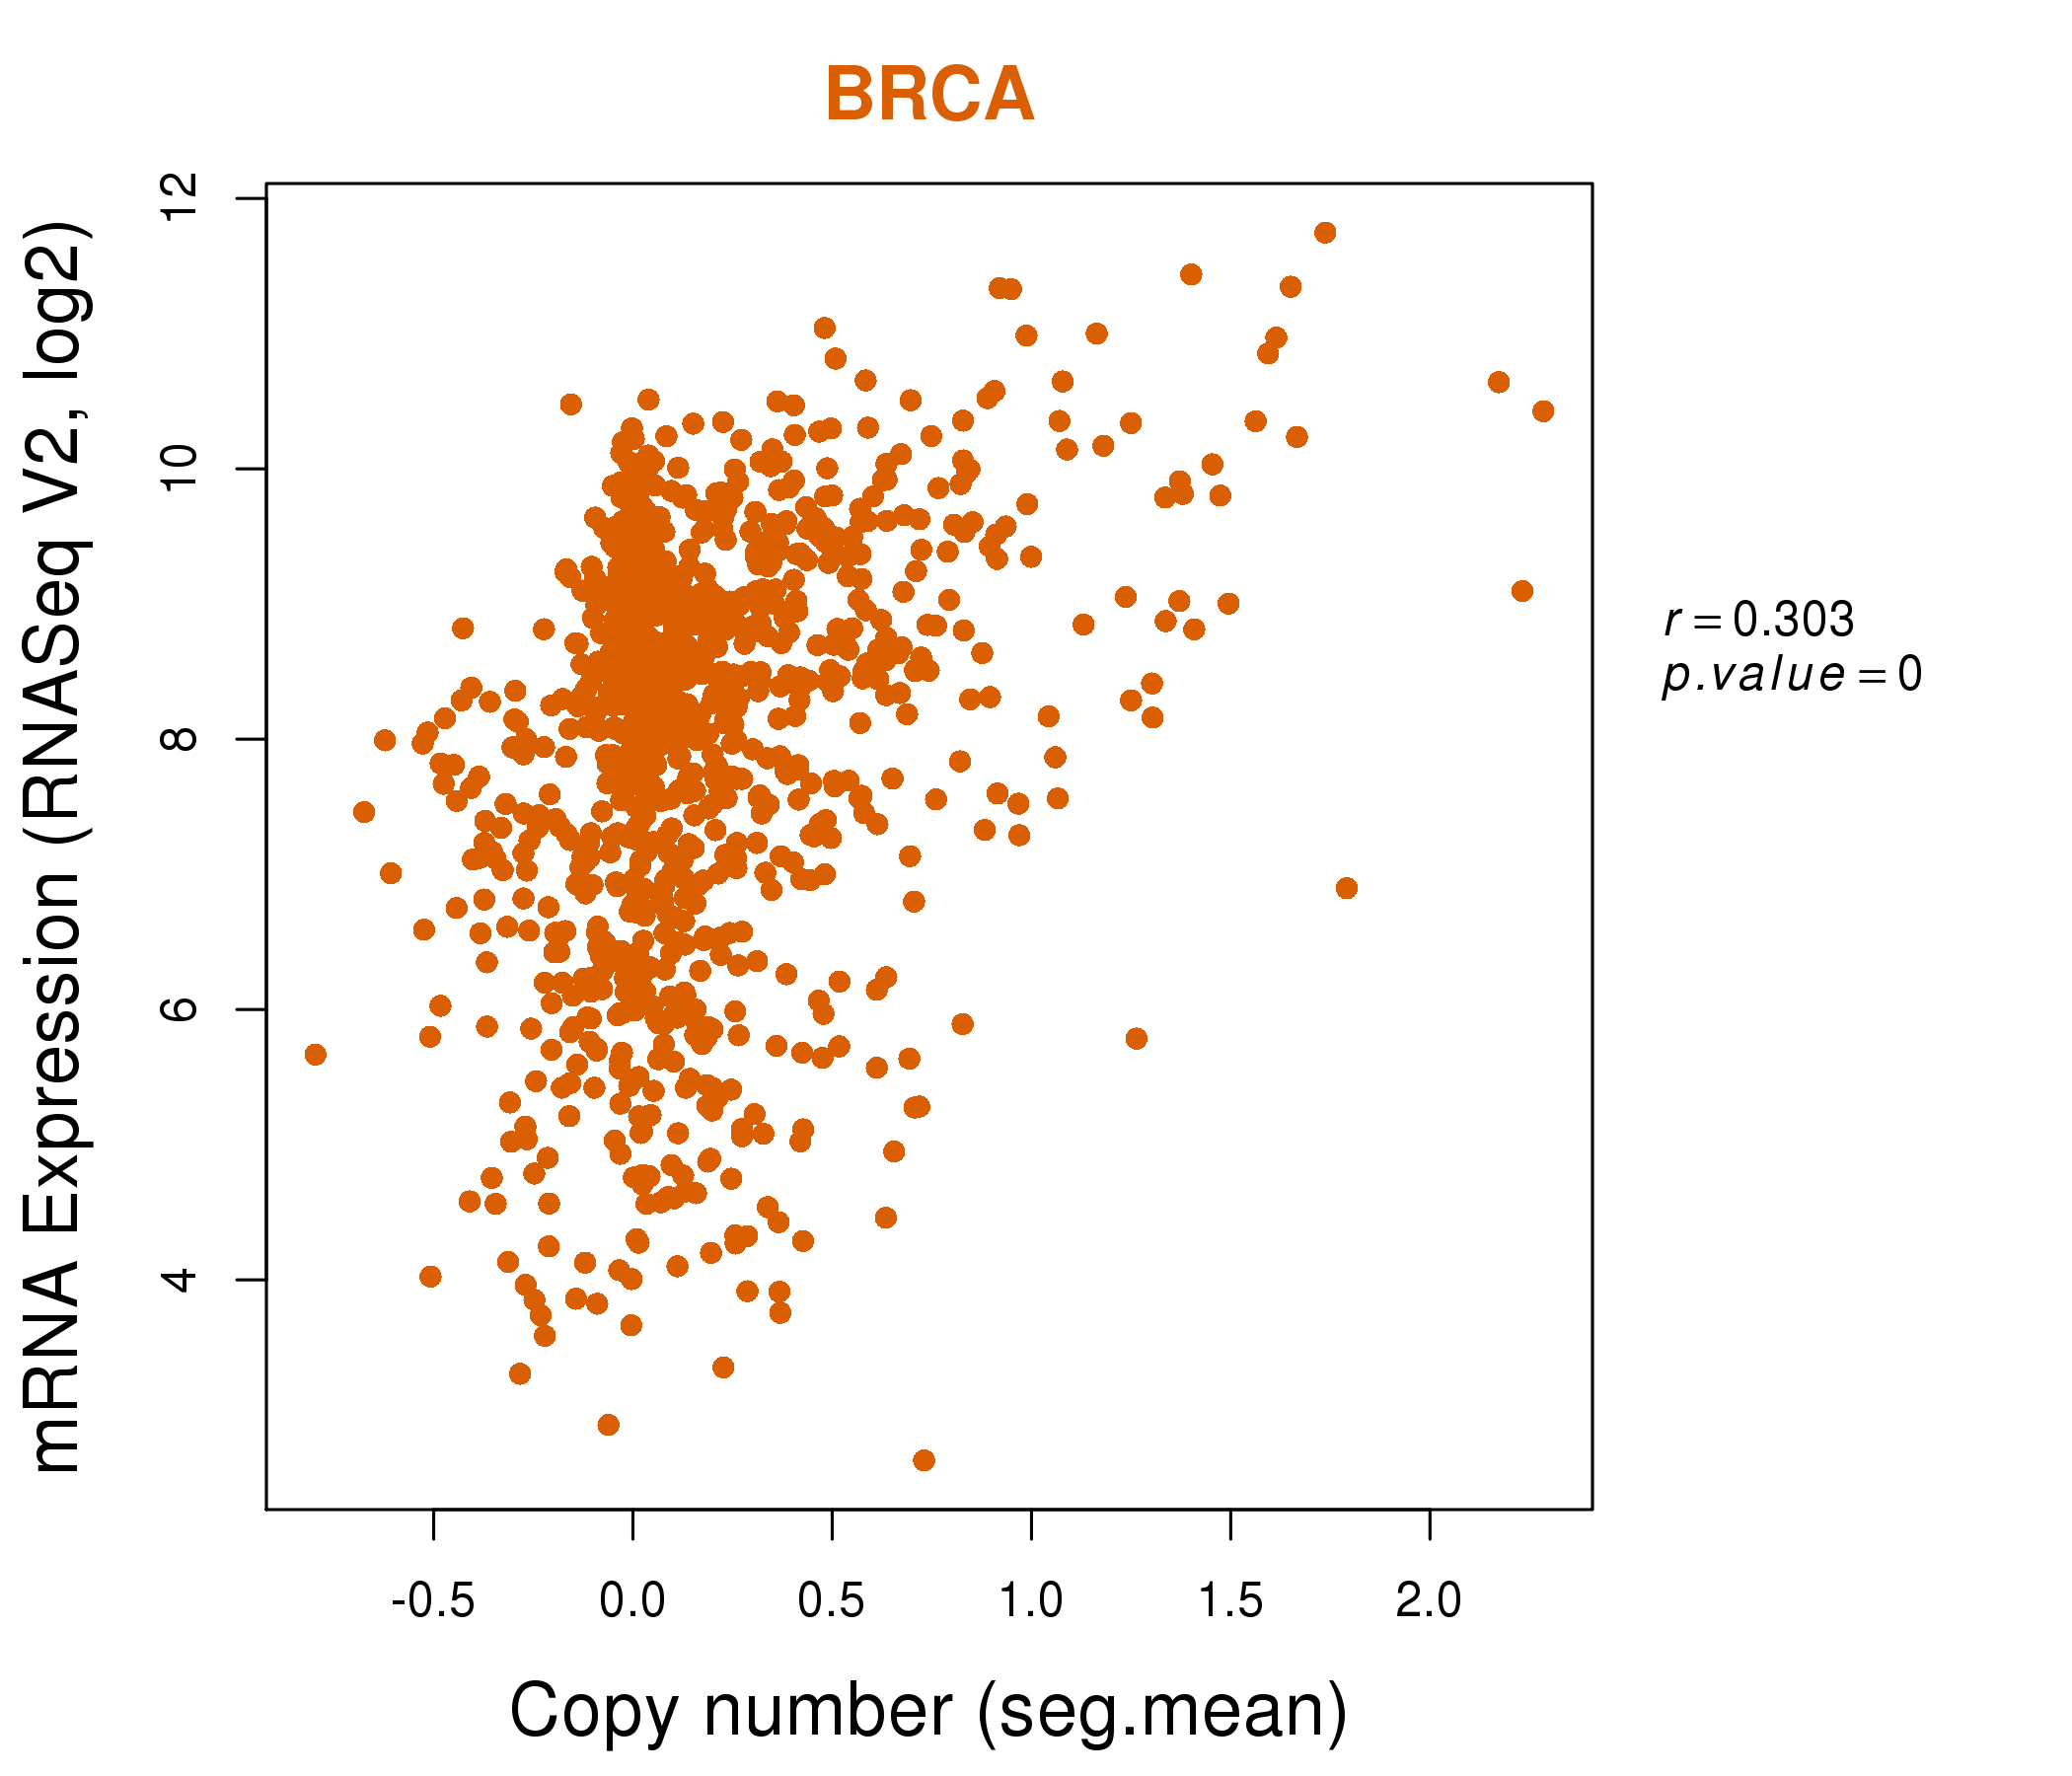
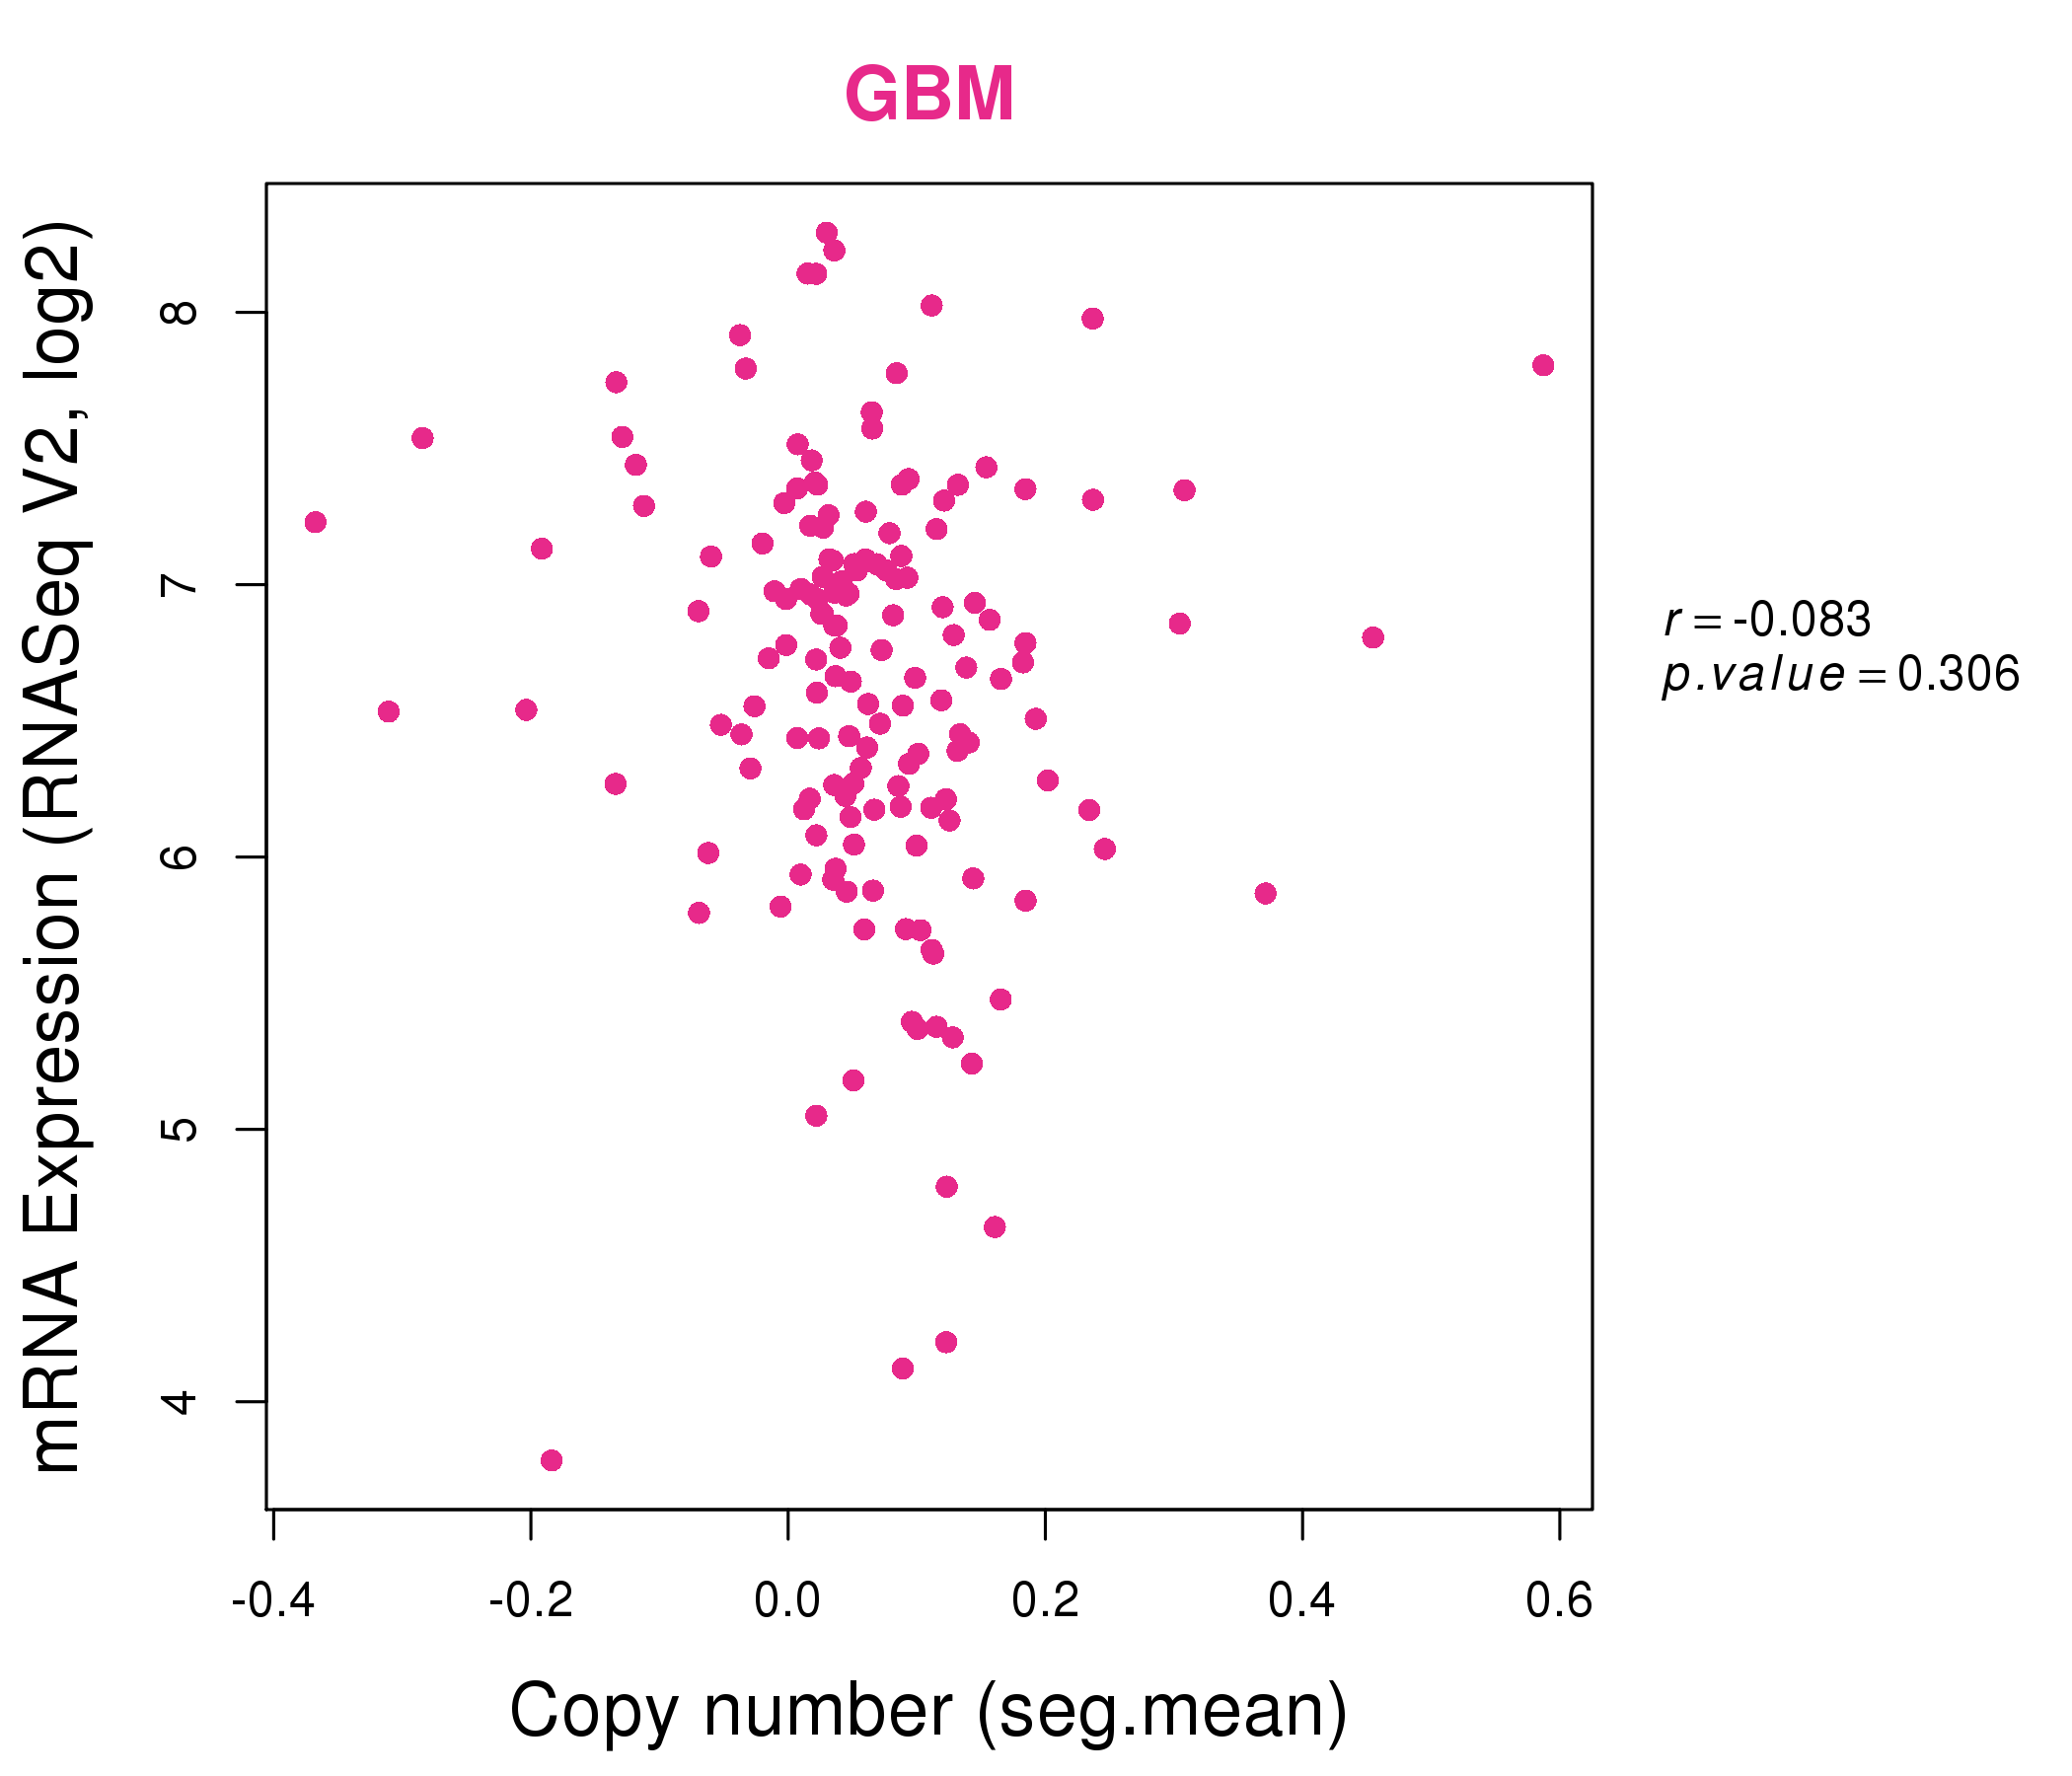
| * This plots show the correlation between CNV and gene expression. |
: Open all plots for all cancer types
 |
|
 |
|
| Top |
| Gene-Gene Network Information |
| * Co-Expression network figures were drawn using R package igraph. Only the top 20 genes with the highest correlations were shown. Red circle: input gene, orange circle: cell metabolism gene, sky circle: other gene |
: Open all plots for all cancer types
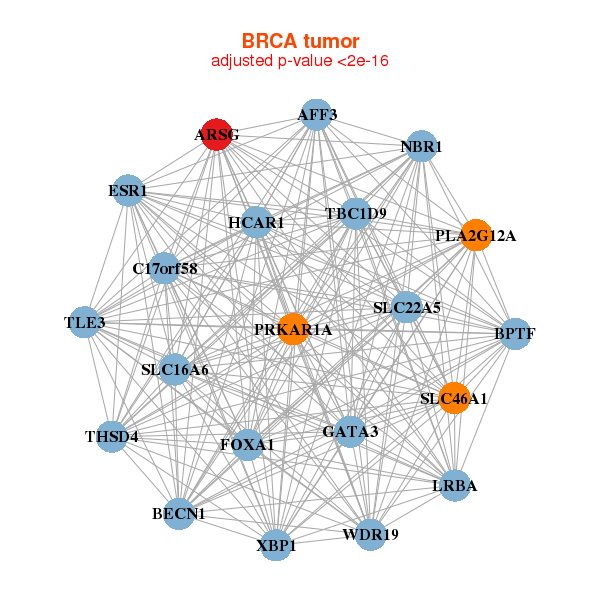 |
|
| AFF3,ARSG,BECN1,BPTF,C17orf58,ESR1,FOXA1, GATA3,HCAR1,LRBA,NBR1,PLA2G12A,PRKAR1A,SLC16A6, SLC22A5,SLC46A1,TBC1D9,THSD4,TLE3,WDR19,XBP1 | ARSD,ARSG,ATP2C2,C9orf152,CACNA2D2,DNALI1,EDARADD, GALNT6,GPR39,HHAT,LMX1B,LRRC48,MSX2,PRRG4, RUNDC1,SIDT1,SYTL2,TMEM25,VAV3,WNK4,XBP1 |
 |
|
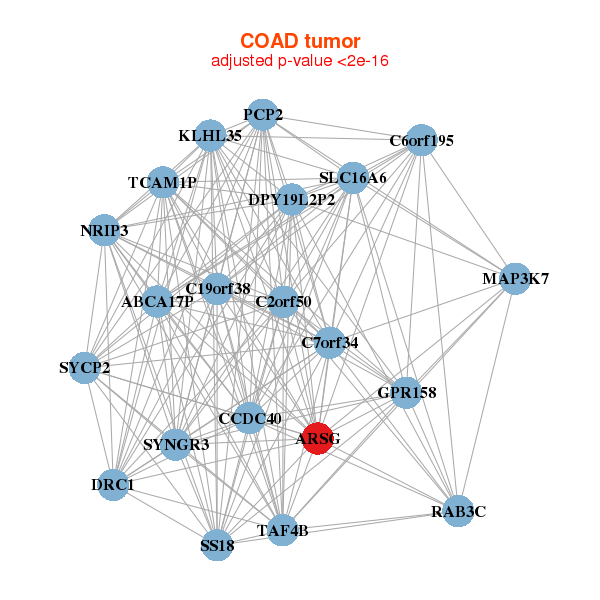
| ABCA17P,ARSG,C19orf38,DRC1,C2orf50,C6orf195,C7orf34, CCDC40,DPY19L2P2,GPR158,KLHL35,MAP3K7,NRIP3,PCP2, RAB3C,SLC16A6,SS18,SYCP2,SYNGR3,TAF4B,TCAM1P | APLF,ARSG,CIART,CCKAR,CCKBR,CNKSR2,ENTPD1, F2R,FAM117A,GNG2,KCNK9,LOC100130093,LOC100192378,MSN, ODAM,PLSCR5,RPL23AP7,RSU1,SLC24A5,TTYH2,WNT5B |
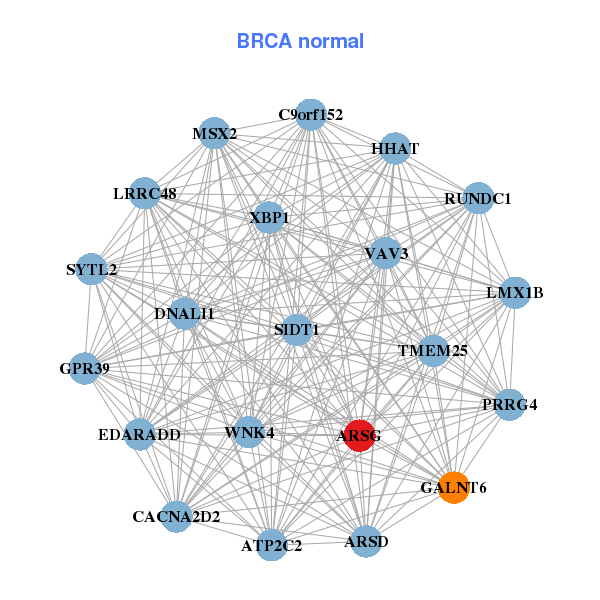
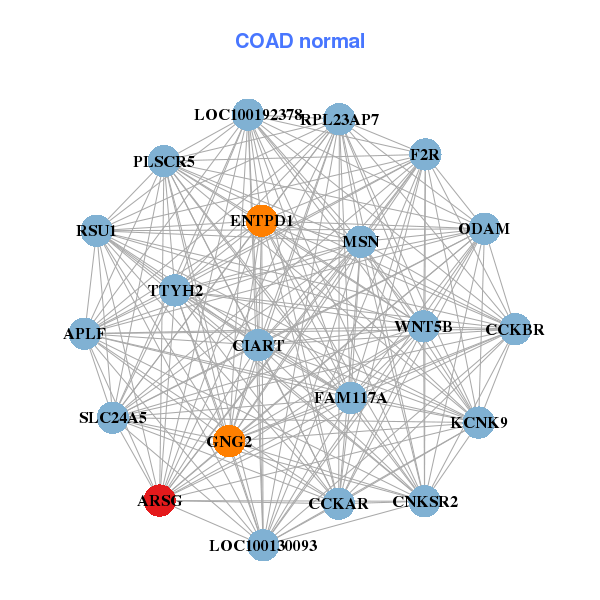
| * Co-Expression network figures were drawn using R package igraph. Only the top 20 genes with the highest correlations were shown. Red circle: input gene, orange circle: cell metabolism gene, sky circle: other gene |
: Open all plots for all cancer types
| Top |
: Open all interacting genes' information including KEGG pathway for all interacting genes from DAVID
| Top |
| Pharmacological Information for ARSG |
| There's no related Drug. |
| Top |
| Cross referenced IDs for ARSG |
| * We obtained these cross-references from Uniprot database. It covers 150 different DBs, 18 categories. http://www.uniprot.org/help/cross_references_section |
: Open all cross reference information
|
Copyright © 2016-Present - The Univsersity of Texas Health Science Center at Houston @ |