|
||||||||||||||||||||||||||||||||||||||||||||||||||||||||||||||||||||||||||||||||||||||||||||||||||||||||||||||||||||||||||||||||||||||||||||||||||||||||||||||||||||||||||||||||||||||||||||||||||||||||||||||||||||||||||||||||||||||||||||||||||||||||||||||||||||||||||||||||||||||||||||||||||||||||||||||||||||||||||
| |
| Phenotypic Information (metabolism pathway, cancer, disease, phenome) |
| |
| |
| Gene-Gene Network Information: Co-Expression Network, Interacting Genes & KEGG |
| |
|


| Gene Summary for NCBP2 |
| Basic gene info. | Gene symbol | NCBP2 |
| Gene name | nuclear cap binding protein subunit 2, 20kDa | |
| Synonyms | CBC2|CBP20|NIP1 | |
| Cytomap | UCSC genome browser: 3q29 | |
| Genomic location | chr3 :196662272-196669464 | |
| Type of gene | protein-coding | |
| RefGenes | NM_001042540.1, NM_007362.3, | |
| Ensembl id | ENSG00000114503 | |
| Description | 20 kDa nuclear cap-binding proteinNCBP 20 kDa subunitNCBP interacting protein 1NCBP-interacting protein 1cell proliferation-inducing gene 55 proteinnuclear cap binding protein subunit 2, 20kDnuclear cap-binding protein subunit 2 | |
| Modification date | 20141207 | |
| dbXrefs | MIM : 605133 | |
| HGNC : HGNC | ||
| Ensembl : ENSG00000114503 | ||
| HPRD : 05503 | ||
| Vega : OTTHUMG00000155520 | ||
| Protein | UniProt: go to UniProt's Cross Reference DB Table | |
| Expression | CleanEX: HS_NCBP2 | |
| BioGPS: 22916 | ||
| Gene Expression Atlas: ENSG00000114503 | ||
| The Human Protein Atlas: ENSG00000114503 | ||
| Pathway | NCI Pathway Interaction Database: NCBP2 | |
| KEGG: NCBP2 | ||
| REACTOME: NCBP2 | ||
| ConsensusPathDB | ||
| Pathway Commons: NCBP2 | ||
| Metabolism | MetaCyc: NCBP2 | |
| HUMANCyc: NCBP2 | ||
| Regulation | Ensembl's Regulation: ENSG00000114503 | |
| miRBase: chr3 :196,662,272-196,669,464 | ||
| TargetScan: NM_001042540 | ||
| cisRED: ENSG00000114503 | ||
| Context | iHOP: NCBP2 | |
| cancer metabolism search in PubMed: NCBP2 | ||
| UCL Cancer Institute: NCBP2 | ||
| Assigned class in ccmGDB | C | |
| Top |
| Phenotypic Information for NCBP2(metabolism pathway, cancer, disease, phenome) |
| Cancer | CGAP: NCBP2 |
| Familial Cancer Database: NCBP2 | |
| * This gene is included in those cancer gene databases. |
|
|
|
|
|
| . | ||||||||||||||||||||||||||||||||||||||||||||||||||||||||||||||||||||||||||||||||||||||||||||||||||||||||||||||||||||||||||||||||||||||||||||||||||||||||||||||||||||||||||||||||||||||||||||||||||||||||||||||||||||||||||||||||||||||||||||||||||||||||||||||||||||||||||||||||||||||||||||||||||||||||||||||||||||
Oncogene 1 | Significant driver gene in | |||||||||||||||||||||||||||||||||||||||||||||||||||||||||||||||||||||||||||||||||||||||||||||||||||||||||||||||||||||||||||||||||||||||||||||||||||||||||||||||||||||||||||||||||||||||||||||||||||||||||||||||||||||||||||||||||||||||||||||||||||||||||||||||||||||||||||||||||||||||||||||||||||||||||||||||||||||||||
| cf) number; DB name 1 Oncogene; http://nar.oxfordjournals.org/content/35/suppl_1/D721.long, 2 Tumor Suppressor gene; https://bioinfo.uth.edu/TSGene/, 3 Cancer Gene Census; http://www.nature.com/nrc/journal/v4/n3/abs/nrc1299.html, 4 CancerGenes; http://nar.oxfordjournals.org/content/35/suppl_1/D721.long, 5 Network of Cancer Gene; http://ncg.kcl.ac.uk/index.php, 1Therapeutic Vulnerabilities in Cancer; http://cbio.mskcc.org/cancergenomics/statius/ |
| REACTOME_METABOLISM_OF_NON_CODING_RNA REACTOME_METABOLISM_OF_MRNA REACTOME_METABOLISM_OF_RNA | |
| OMIM | |
| Orphanet | |
| Disease | KEGG Disease: NCBP2 |
| MedGen: NCBP2 (Human Medical Genetics with Condition) | |
| ClinVar: NCBP2 | |
| Phenotype | MGI: NCBP2 (International Mouse Phenotyping Consortium) |
| PhenomicDB: NCBP2 | |
| Mutations for NCBP2 |
| * Under tables are showing count per each tissue to give us broad intuition about tissue specific mutation patterns.You can go to the detailed page for each mutation database's web site. |
| - Statistics for Tissue and Mutation type | Top |
 |
| - For Inter-chromosomal Variations |
| * Inter-chromosomal variantions includes 'interchromosomal amplicon to amplicon', 'interchromosomal amplicon to non-amplified dna', 'interchromosomal insertion', 'Interchromosomal unknown type'. |
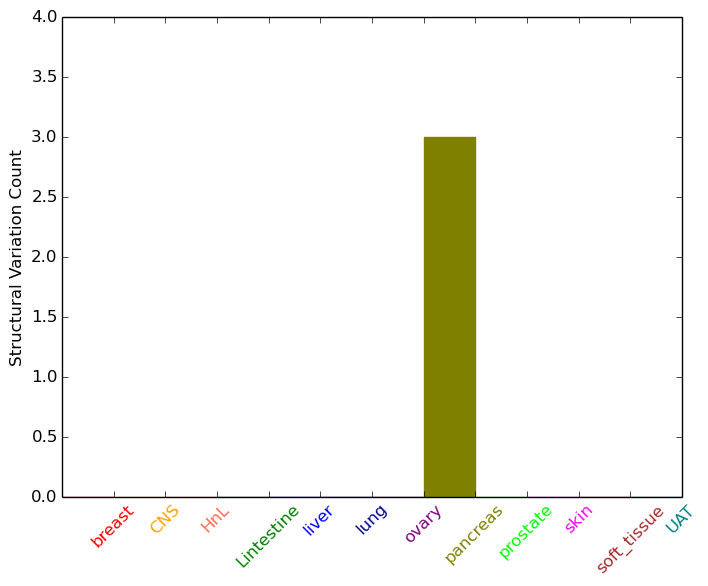 |
| - For Intra-chromosomal Variations |
| There's no intra-chromosomal structural variation. |
| Sample | Symbol_a | Chr_a | Start_a | End_a | Symbol_b | Chr_b | Start_b | End_b |
| pancreas | NCBP2 | chr3 | 196662594 | 196662614 | MAST4 | chr5 | 66414017 | 66414037 |
| cf) Tissue number; Tissue name (1;Breast, 2;Central_nervous_system, 3;Haematopoietic_and_lymphoid_tissue, 4;Large_intestine, 5;Liver, 6;Lung, 7;Ovary, 8;Pancreas, 9;Prostate, 10;Skin, 11;Soft_tissue, 12;Upper_aerodigestive_tract) |
| * From mRNA Sanger sequences, Chitars2.0 arranged chimeric transcripts. This table shows NCBP2 related fusion information. |
| ID | Head Gene | Tail Gene | Accession | Gene_a | qStart_a | qEnd_a | Chromosome_a | tStart_a | tEnd_a | Gene_a | qStart_a | qEnd_a | Chromosome_a | tStart_a | tEnd_a |
| DA659977 | NCBP2 | 1 | 81 | 3 | 196669297 | 196669377 | FBXL2 | 82 | 569 | 3 | 33400769 | 33415357 | |
| AA625748 | NCBP2 | 54 | 392 | 3 | 196662329 | 196662667 | PEX5 | 393 | 548 | 12 | 7362279 | 7362434 | |
| BU536214 | YBX1 | 4 | 266 | 1 | 43148098 | 43148360 | NCBP2 | 267 | 497 | 3 | 196663726 | 196663955 | |
| F01144 | NCBP2 | 1 | 177 | 3 | 196662339 | 196662515 | GDF9 | 175 | 337 | 5 | 132202339 | 132202681 | |
| Top |
| Mutation type/ Tissue ID | brca | cns | cerv | endome | haematopo | kidn | Lintest | liver | lung | ns | ovary | pancre | prost | skin | stoma | thyro | urina | |||
| Total # sample | 1 | |||||||||||||||||||
| GAIN (# sample) | 1 | |||||||||||||||||||
| LOSS (# sample) |
| cf) Tissue ID; Tissue type (1; Breast, 2; Central_nervous_system, 3; Cervix, 4; Endometrium, 5; Haematopoietic_and_lymphoid_tissue, 6; Kidney, 7; Large_intestine, 8; Liver, 9; Lung, 10; NS, 11; Ovary, 12; Pancreas, 13; Prostate, 14; Skin, 15; Stomach, 16; Thyroid, 17; Urinary_tract) |
| Top |
|
 |
| Top |
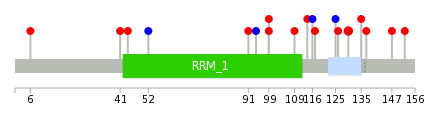
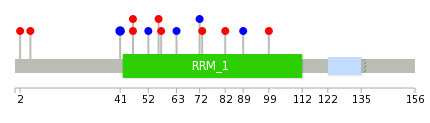
| Stat. for Non-Synonymous SNVs (# total SNVs=14) | (# total SNVs=3) |
 |  |
(# total SNVs=0) | (# total SNVs=0) |
| Top |
| * When you move the cursor on each content, you can see more deailed mutation information on the Tooltip. Those are primary_site,primary_histology,mutation(aa),pubmedID. |
| GRCh37 position | Mutation(aa) | Unique sampleID count |
| chr3:196664391-196664391 | p.S130Y | 2 |
| chr3:196664509-196664509 | p.R91C | 1 |
| chr3:196666226-196666226 | p.T52T | 1 |
| chr3:196664404-196664404 | p.G126S | 1 |
| chr3:196666252-196666252 | p.V44F | 1 |
| chr3:196664405-196664405 | p.Y125Y | 1 |
| chr3:196666260-196666260 | p.T41M | 1 |
| chr3:196664431-196664431 | p.A117T | 1 |
| chr3:196669315-196669315 | p.Y20* | 1 |
| chr3:196664432-196664432 | p.D116D | 1 |
| Top |
|
 |
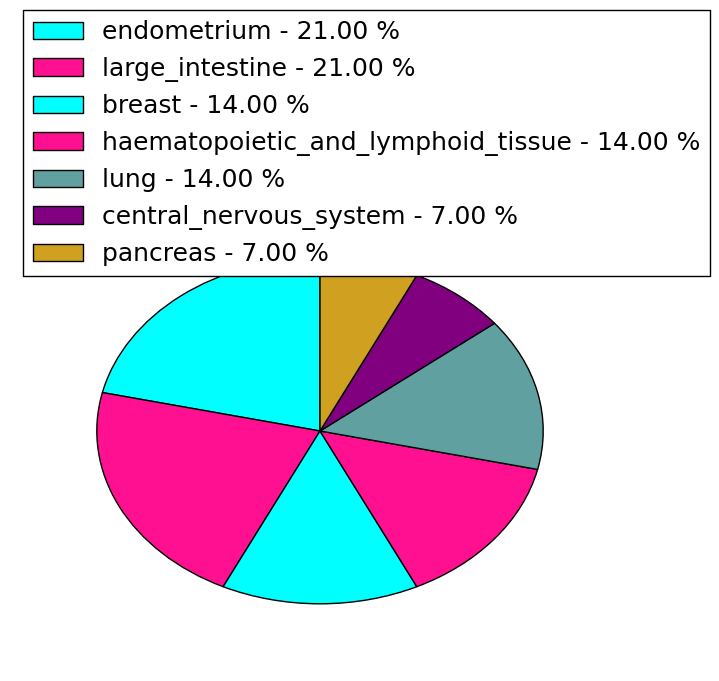
| Point Mutation/ Tissue ID | 1 | 2 | 3 | 4 | 5 | 6 | 7 | 8 | 9 | 10 | 11 | 12 | 13 | 14 | 15 | 16 | 17 | 18 | 19 | 20 |
| # sample | 5 | 1 | 2 | 1 | 1 | 4 | ||||||||||||||
| # mutation | 4 | 1 | 2 | 1 | 1 | 4 | ||||||||||||||
| nonsynonymous SNV | 2 | 1 | 2 | 1 | 3 | |||||||||||||||
| synonymous SNV | 2 | 1 | 1 |
| cf) Tissue ID; Tissue type (1; BLCA[Bladder Urothelial Carcinoma], 2; BRCA[Breast invasive carcinoma], 3; CESC[Cervical squamous cell carcinoma and endocervical adenocarcinoma], 4; COAD[Colon adenocarcinoma], 5; GBM[Glioblastoma multiforme], 6; Glioma Low Grade, 7; HNSC[Head and Neck squamous cell carcinoma], 8; KICH[Kidney Chromophobe], 9; KIRC[Kidney renal clear cell carcinoma], 10; KIRP[Kidney renal papillary cell carcinoma], 11; LAML[Acute Myeloid Leukemia], 12; LUAD[Lung adenocarcinoma], 13; LUSC[Lung squamous cell carcinoma], 14; OV[Ovarian serous cystadenocarcinoma ], 15; PAAD[Pancreatic adenocarcinoma], 16; PRAD[Prostate adenocarcinoma], 17; SKCM[Skin Cutaneous Melanoma], 18:STAD[Stomach adenocarcinoma], 19:THCA[Thyroid carcinoma], 20:UCEC[Uterine Corpus Endometrial Carcinoma]) |
| Top |
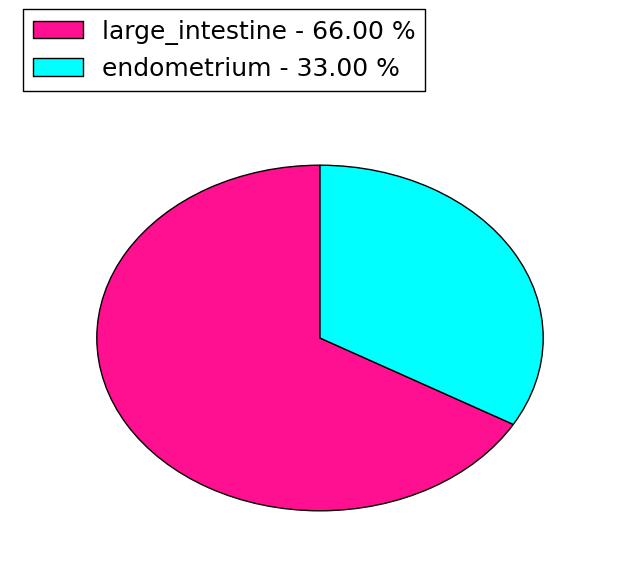
| * We represented just top 10 SNVs. When you move the cursor on each content, you can see more deailed mutation information on the Tooltip. Those are primary_site, primary_histology, mutation(aa), pubmedID. |
| Genomic Position | Mutation(aa) | Unique sampleID count |
| chr3:196664498 | p.A41A,NCBP2 | 2 |
| chr3:196664405 | p.T52T | 1 |
| chr3:196664432 | p.L6Q,NCBP2 | 1 |
| chr3:196664450 | p.S2T,NCBP2 | 1 |
| chr3:196664454 | p.L99P,NCBP2 | 1 |
| chr3:196664484 | p.Y89Y,NCBP2 | 1 |
| chr3:196664485 | p.R82W,NCBP2 | 1 |
| chr3:196663898 | p.G73S,NCBP2 | 1 |
| chr3:196666226 | p.Y72Y,NCBP2 | 1 |
| chr3:196663927 | p.D63D,NCBP2 | 1 |
| * Copy number data were extracted from TCGA using R package TCGA-Assembler. The URLs of all public data files on TCGA DCC data server were gathered on Jan-05-2015. Function ProcessCNAData in TCGA-Assembler package was used to obtain gene-level copy number value which is calculated as the average copy number of the genomic region of a gene. |
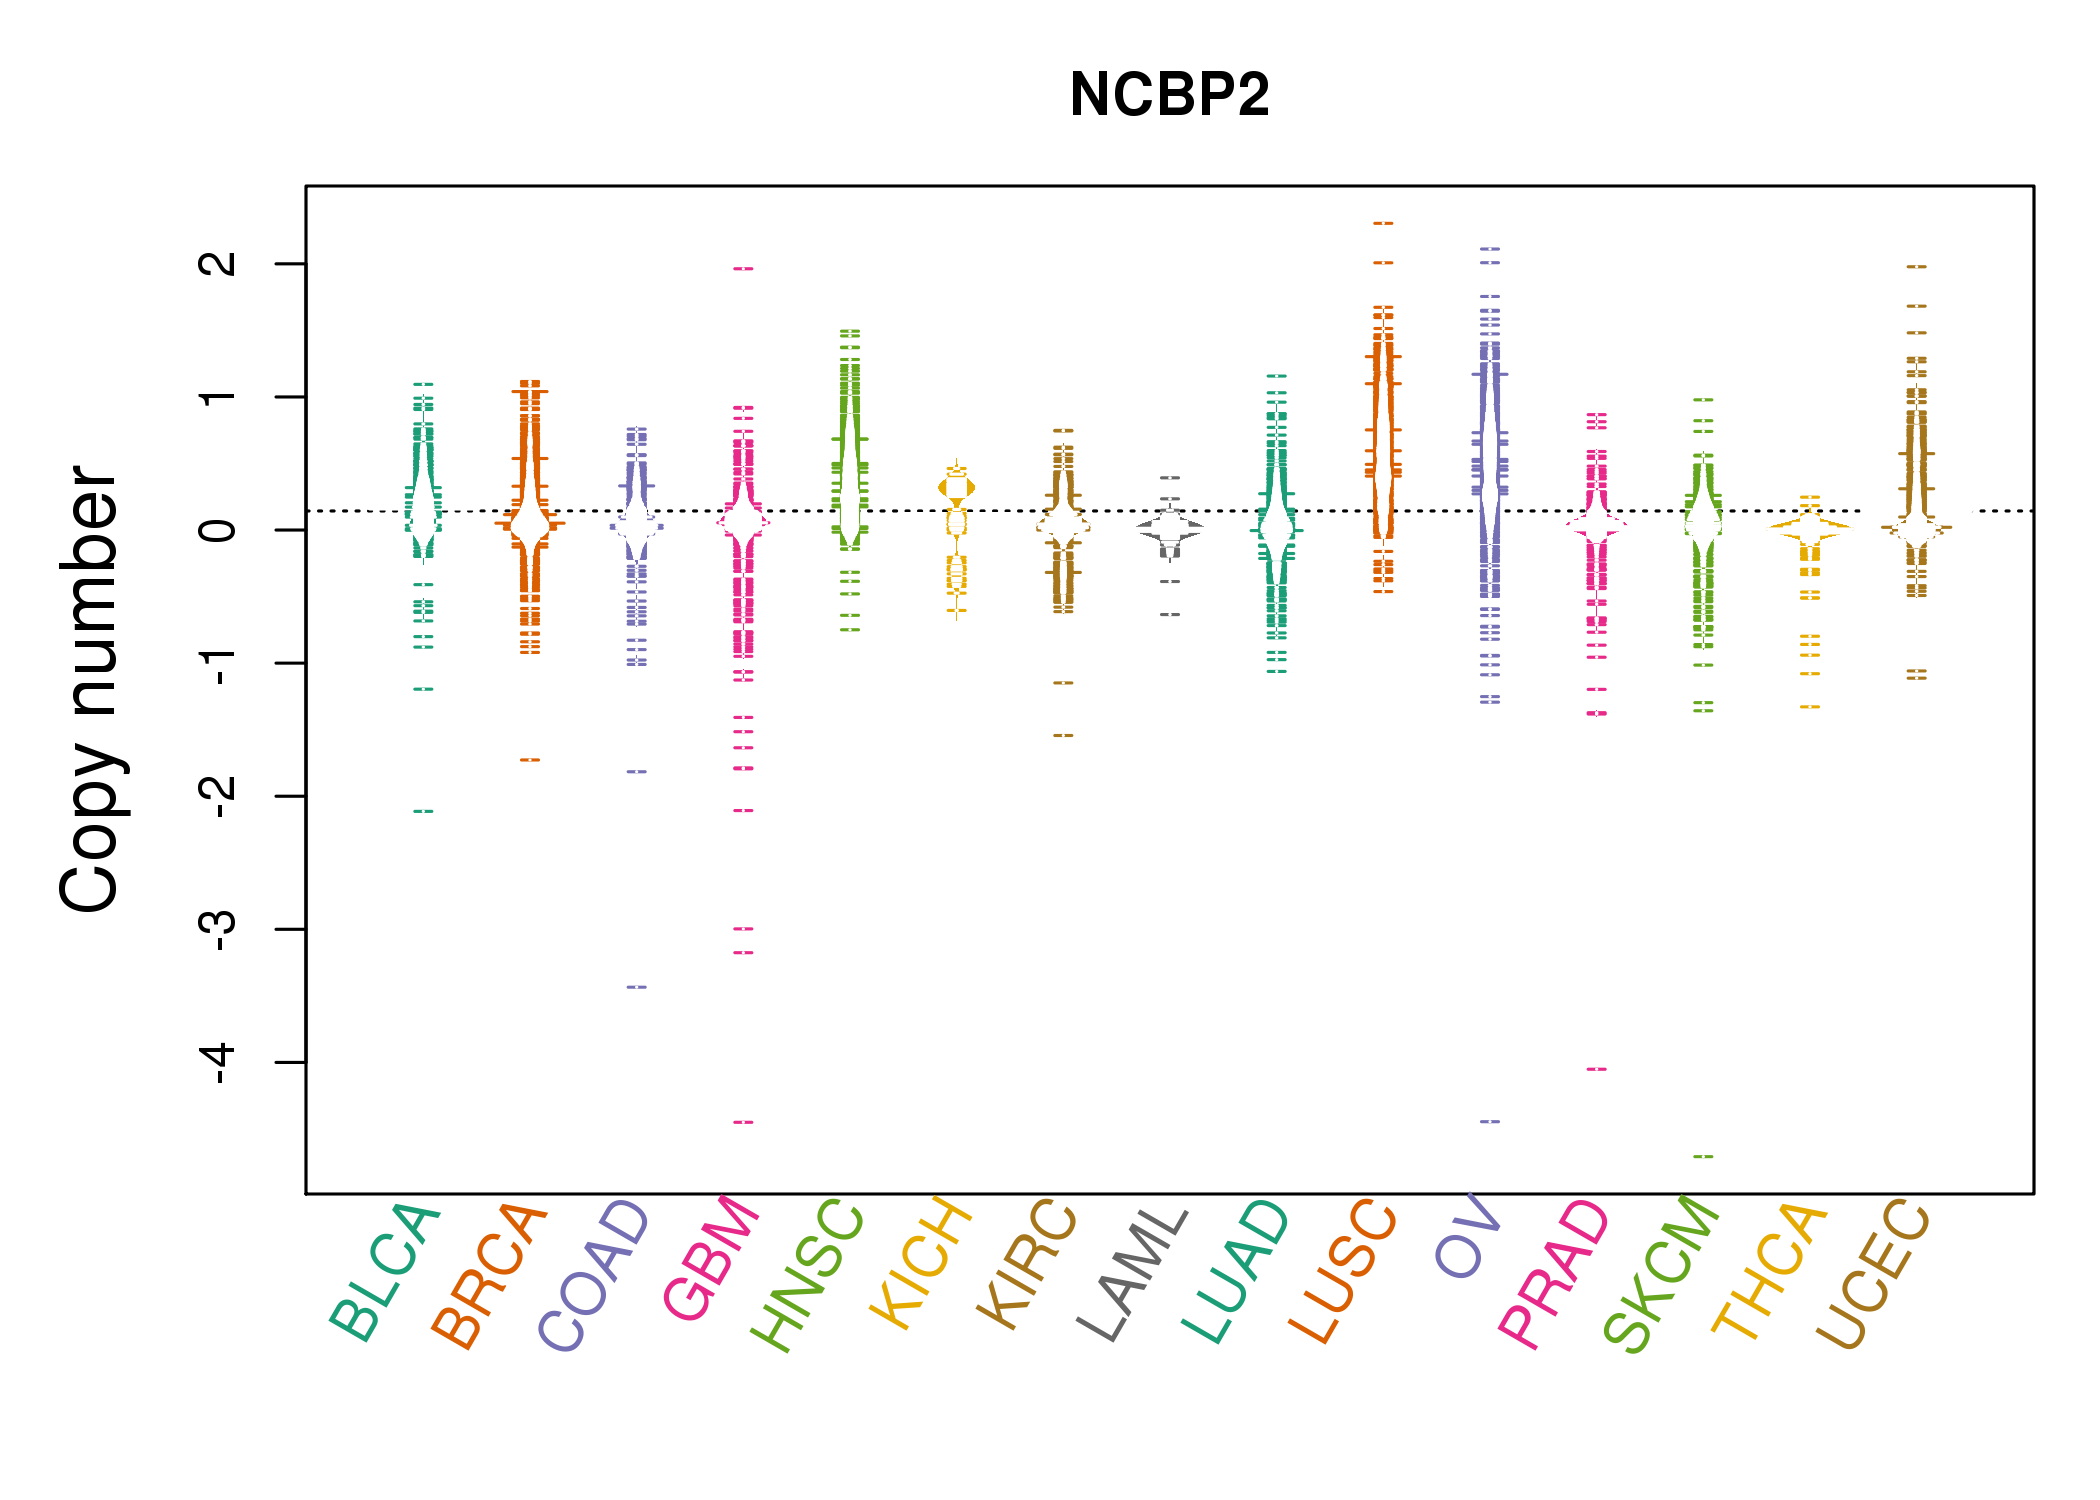 |
| cf) Tissue ID[Tissue type]: BLCA[Bladder Urothelial Carcinoma], BRCA[Breast invasive carcinoma], CESC[Cervical squamous cell carcinoma and endocervical adenocarcinoma], COAD[Colon adenocarcinoma], GBM[Glioblastoma multiforme], Glioma Low Grade, HNSC[Head and Neck squamous cell carcinoma], KICH[Kidney Chromophobe], KIRC[Kidney renal clear cell carcinoma], KIRP[Kidney renal papillary cell carcinoma], LAML[Acute Myeloid Leukemia], LUAD[Lung adenocarcinoma], LUSC[Lung squamous cell carcinoma], OV[Ovarian serous cystadenocarcinoma ], PAAD[Pancreatic adenocarcinoma], PRAD[Prostate adenocarcinoma], SKCM[Skin Cutaneous Melanoma], STAD[Stomach adenocarcinoma], THCA[Thyroid carcinoma], UCEC[Uterine Corpus Endometrial Carcinoma] |
| Top |
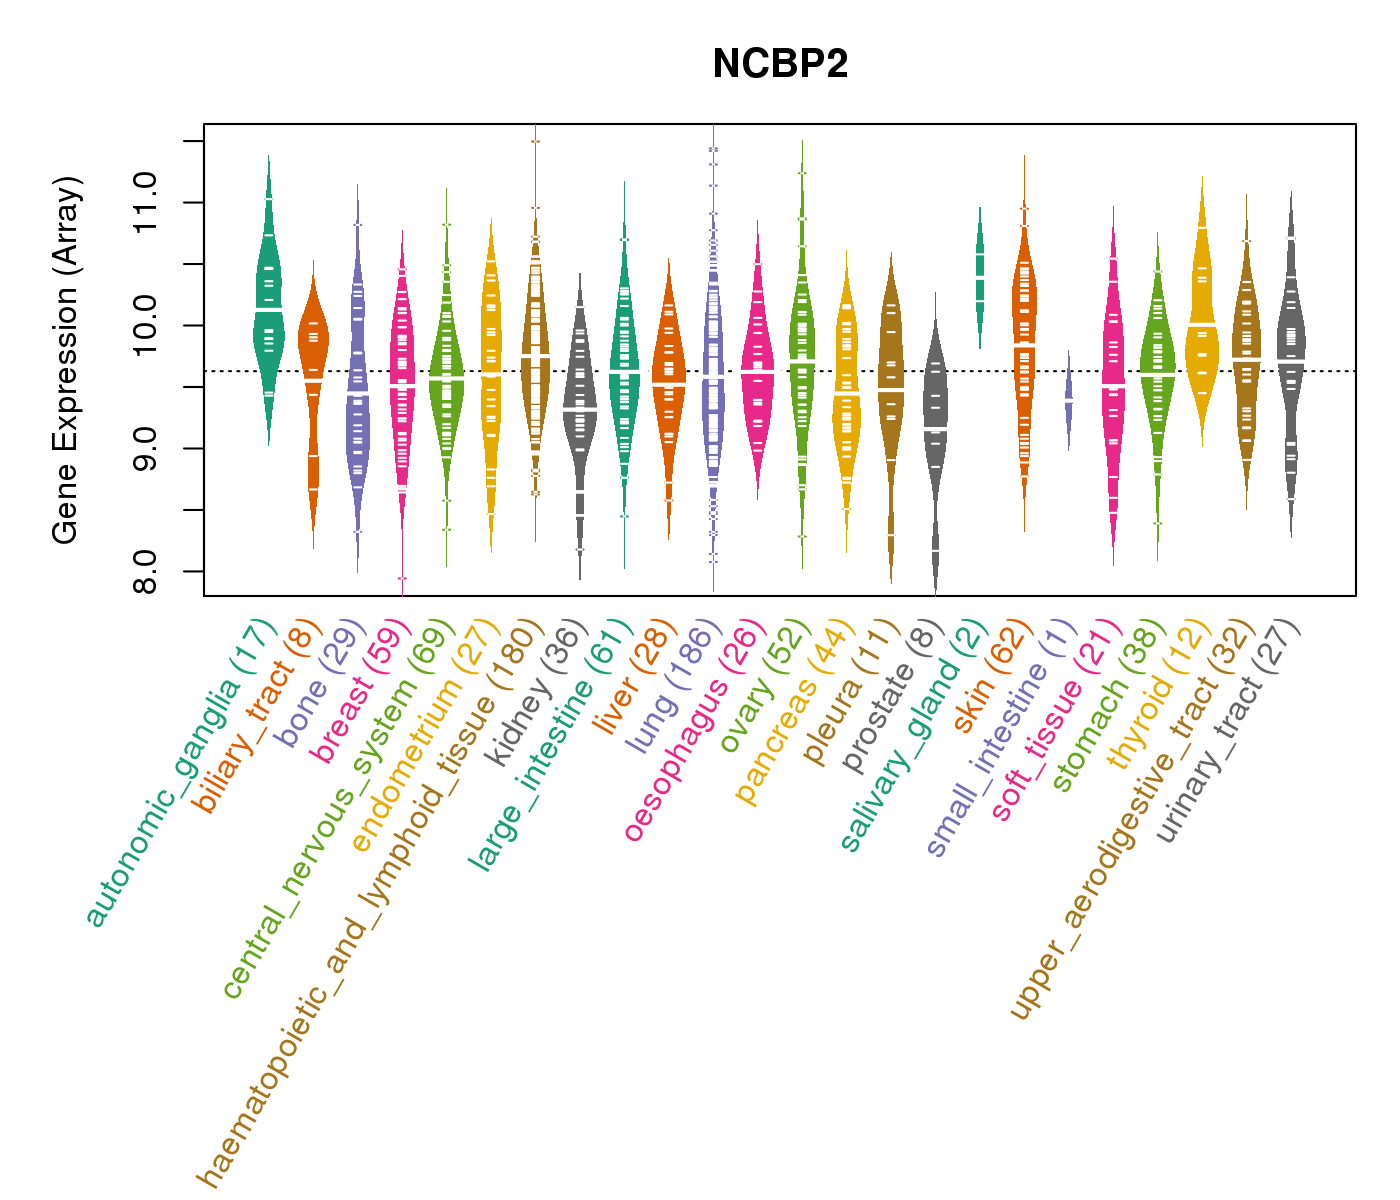
| Gene Expression for NCBP2 |
| * CCLE gene expression data were extracted from CCLE_Expression_Entrez_2012-10-18.res: Gene-centric RMA-normalized mRNA expression data. |
 |
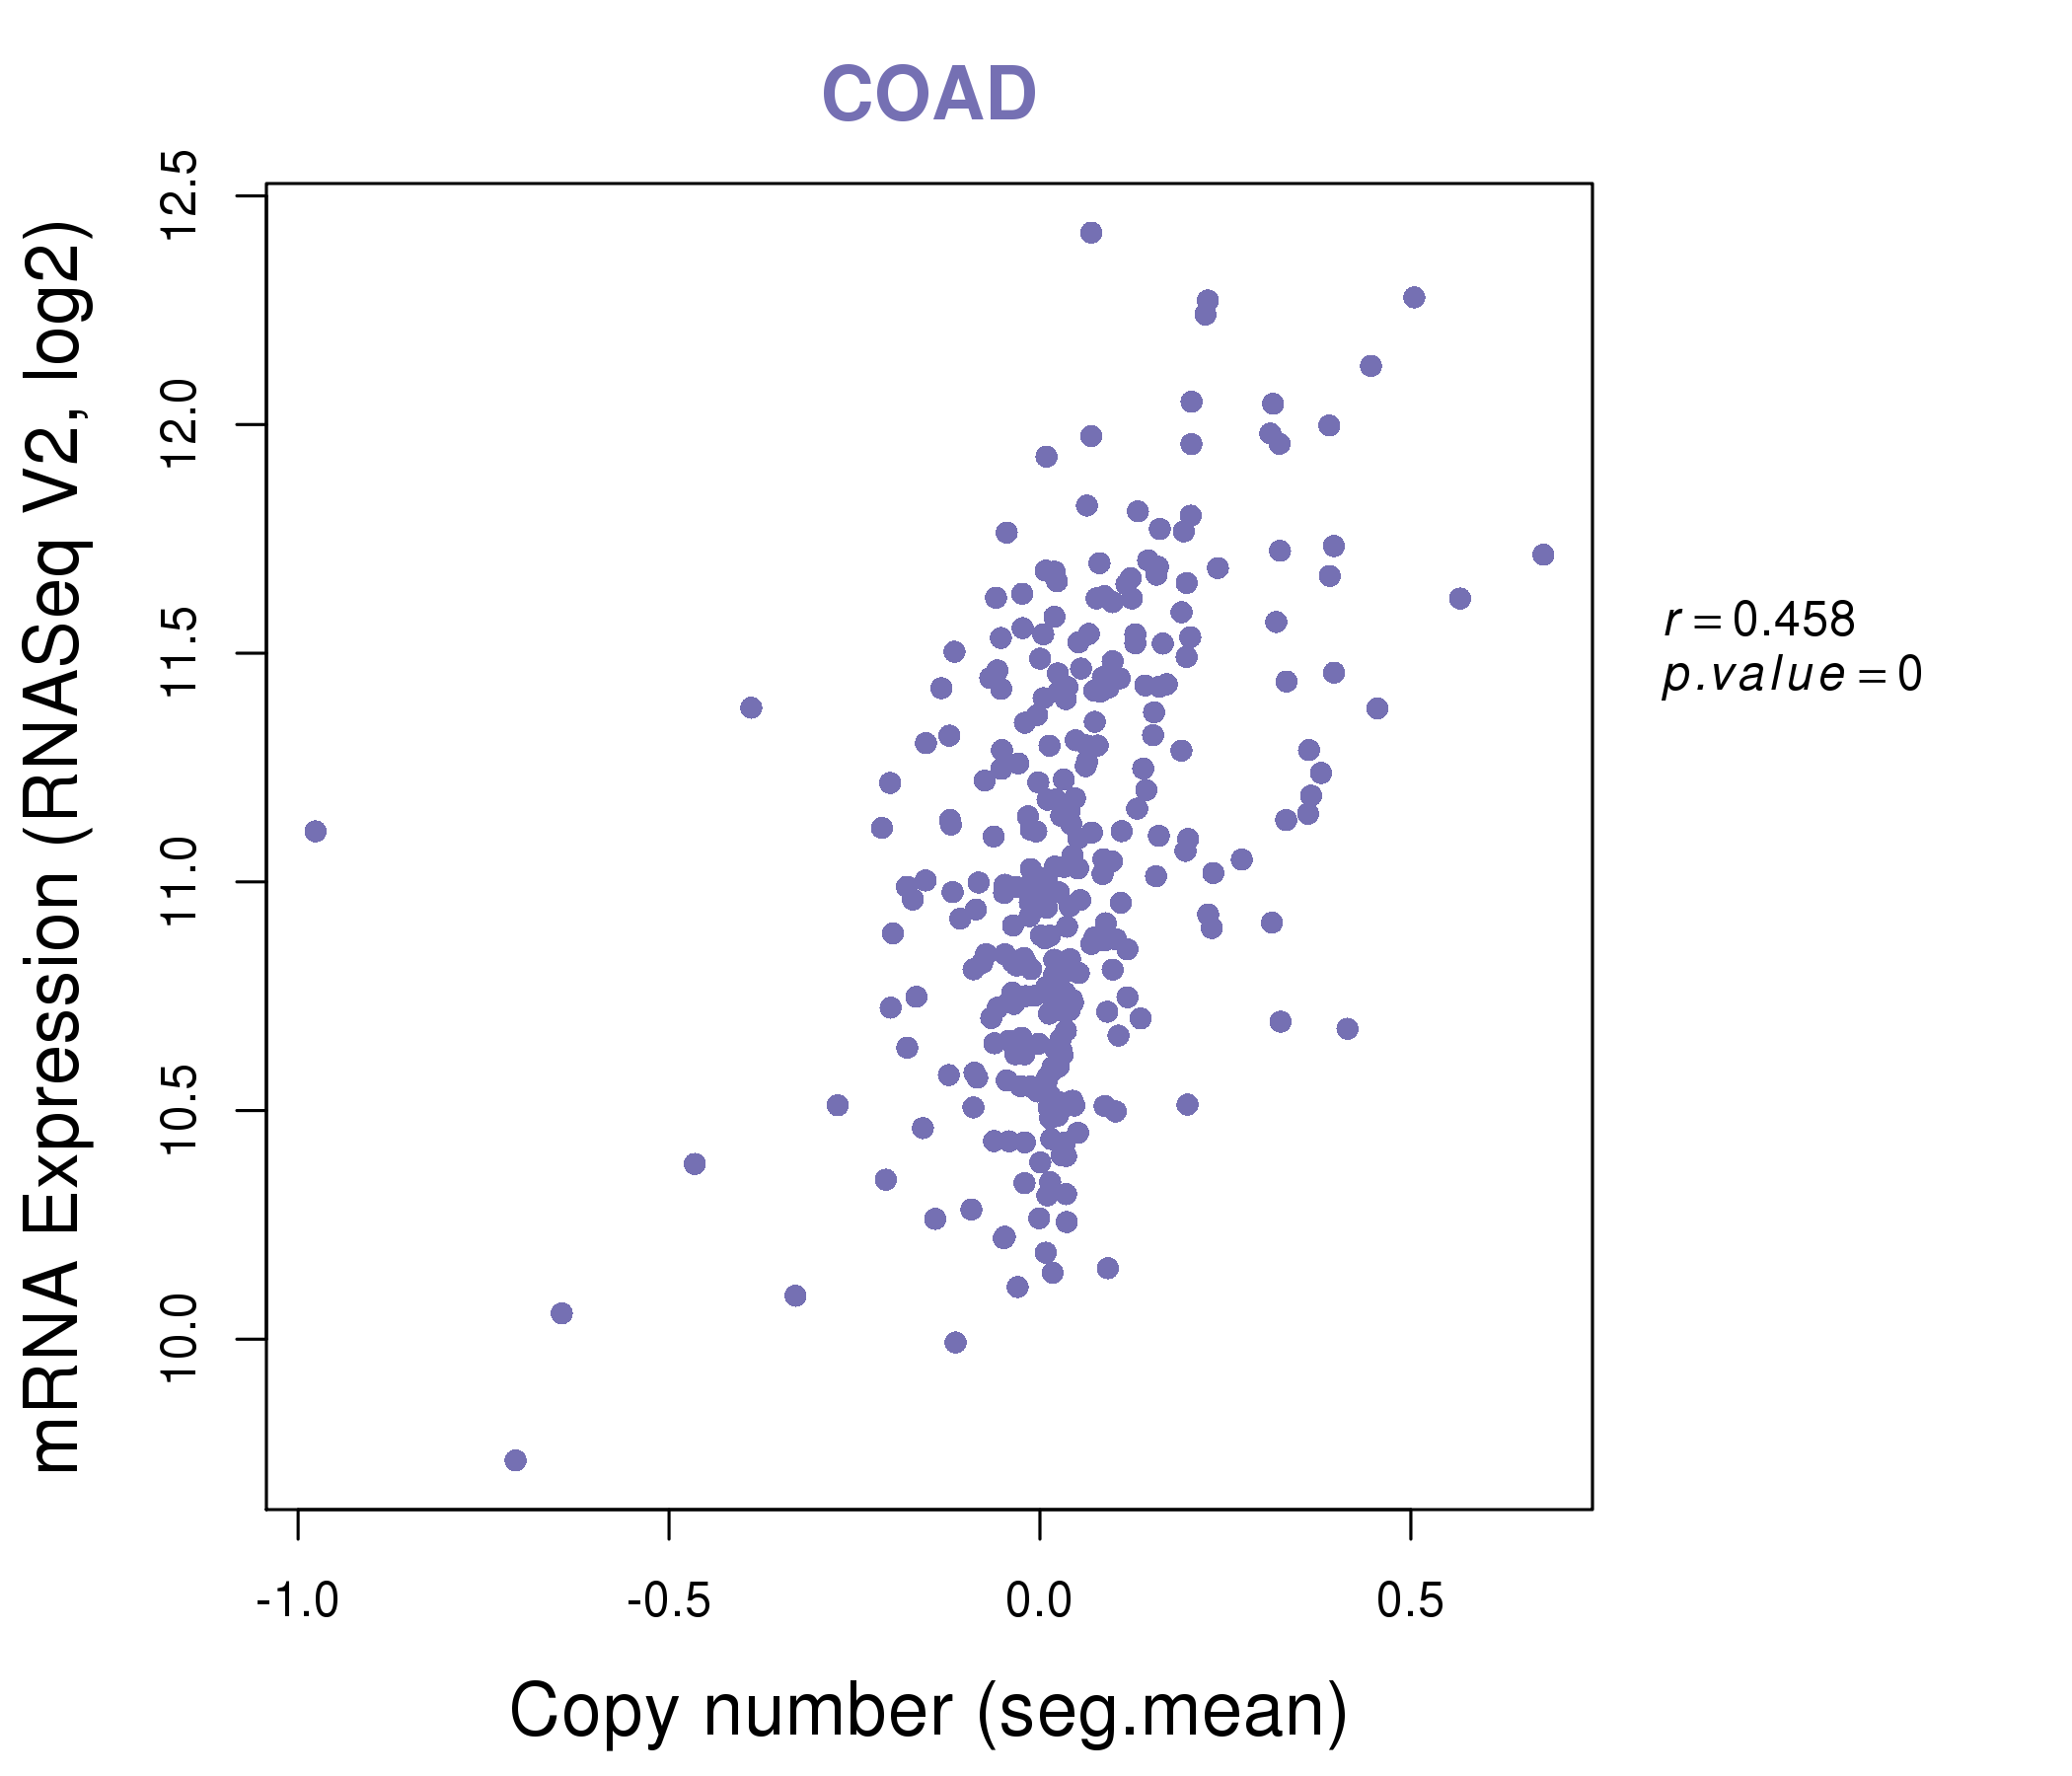
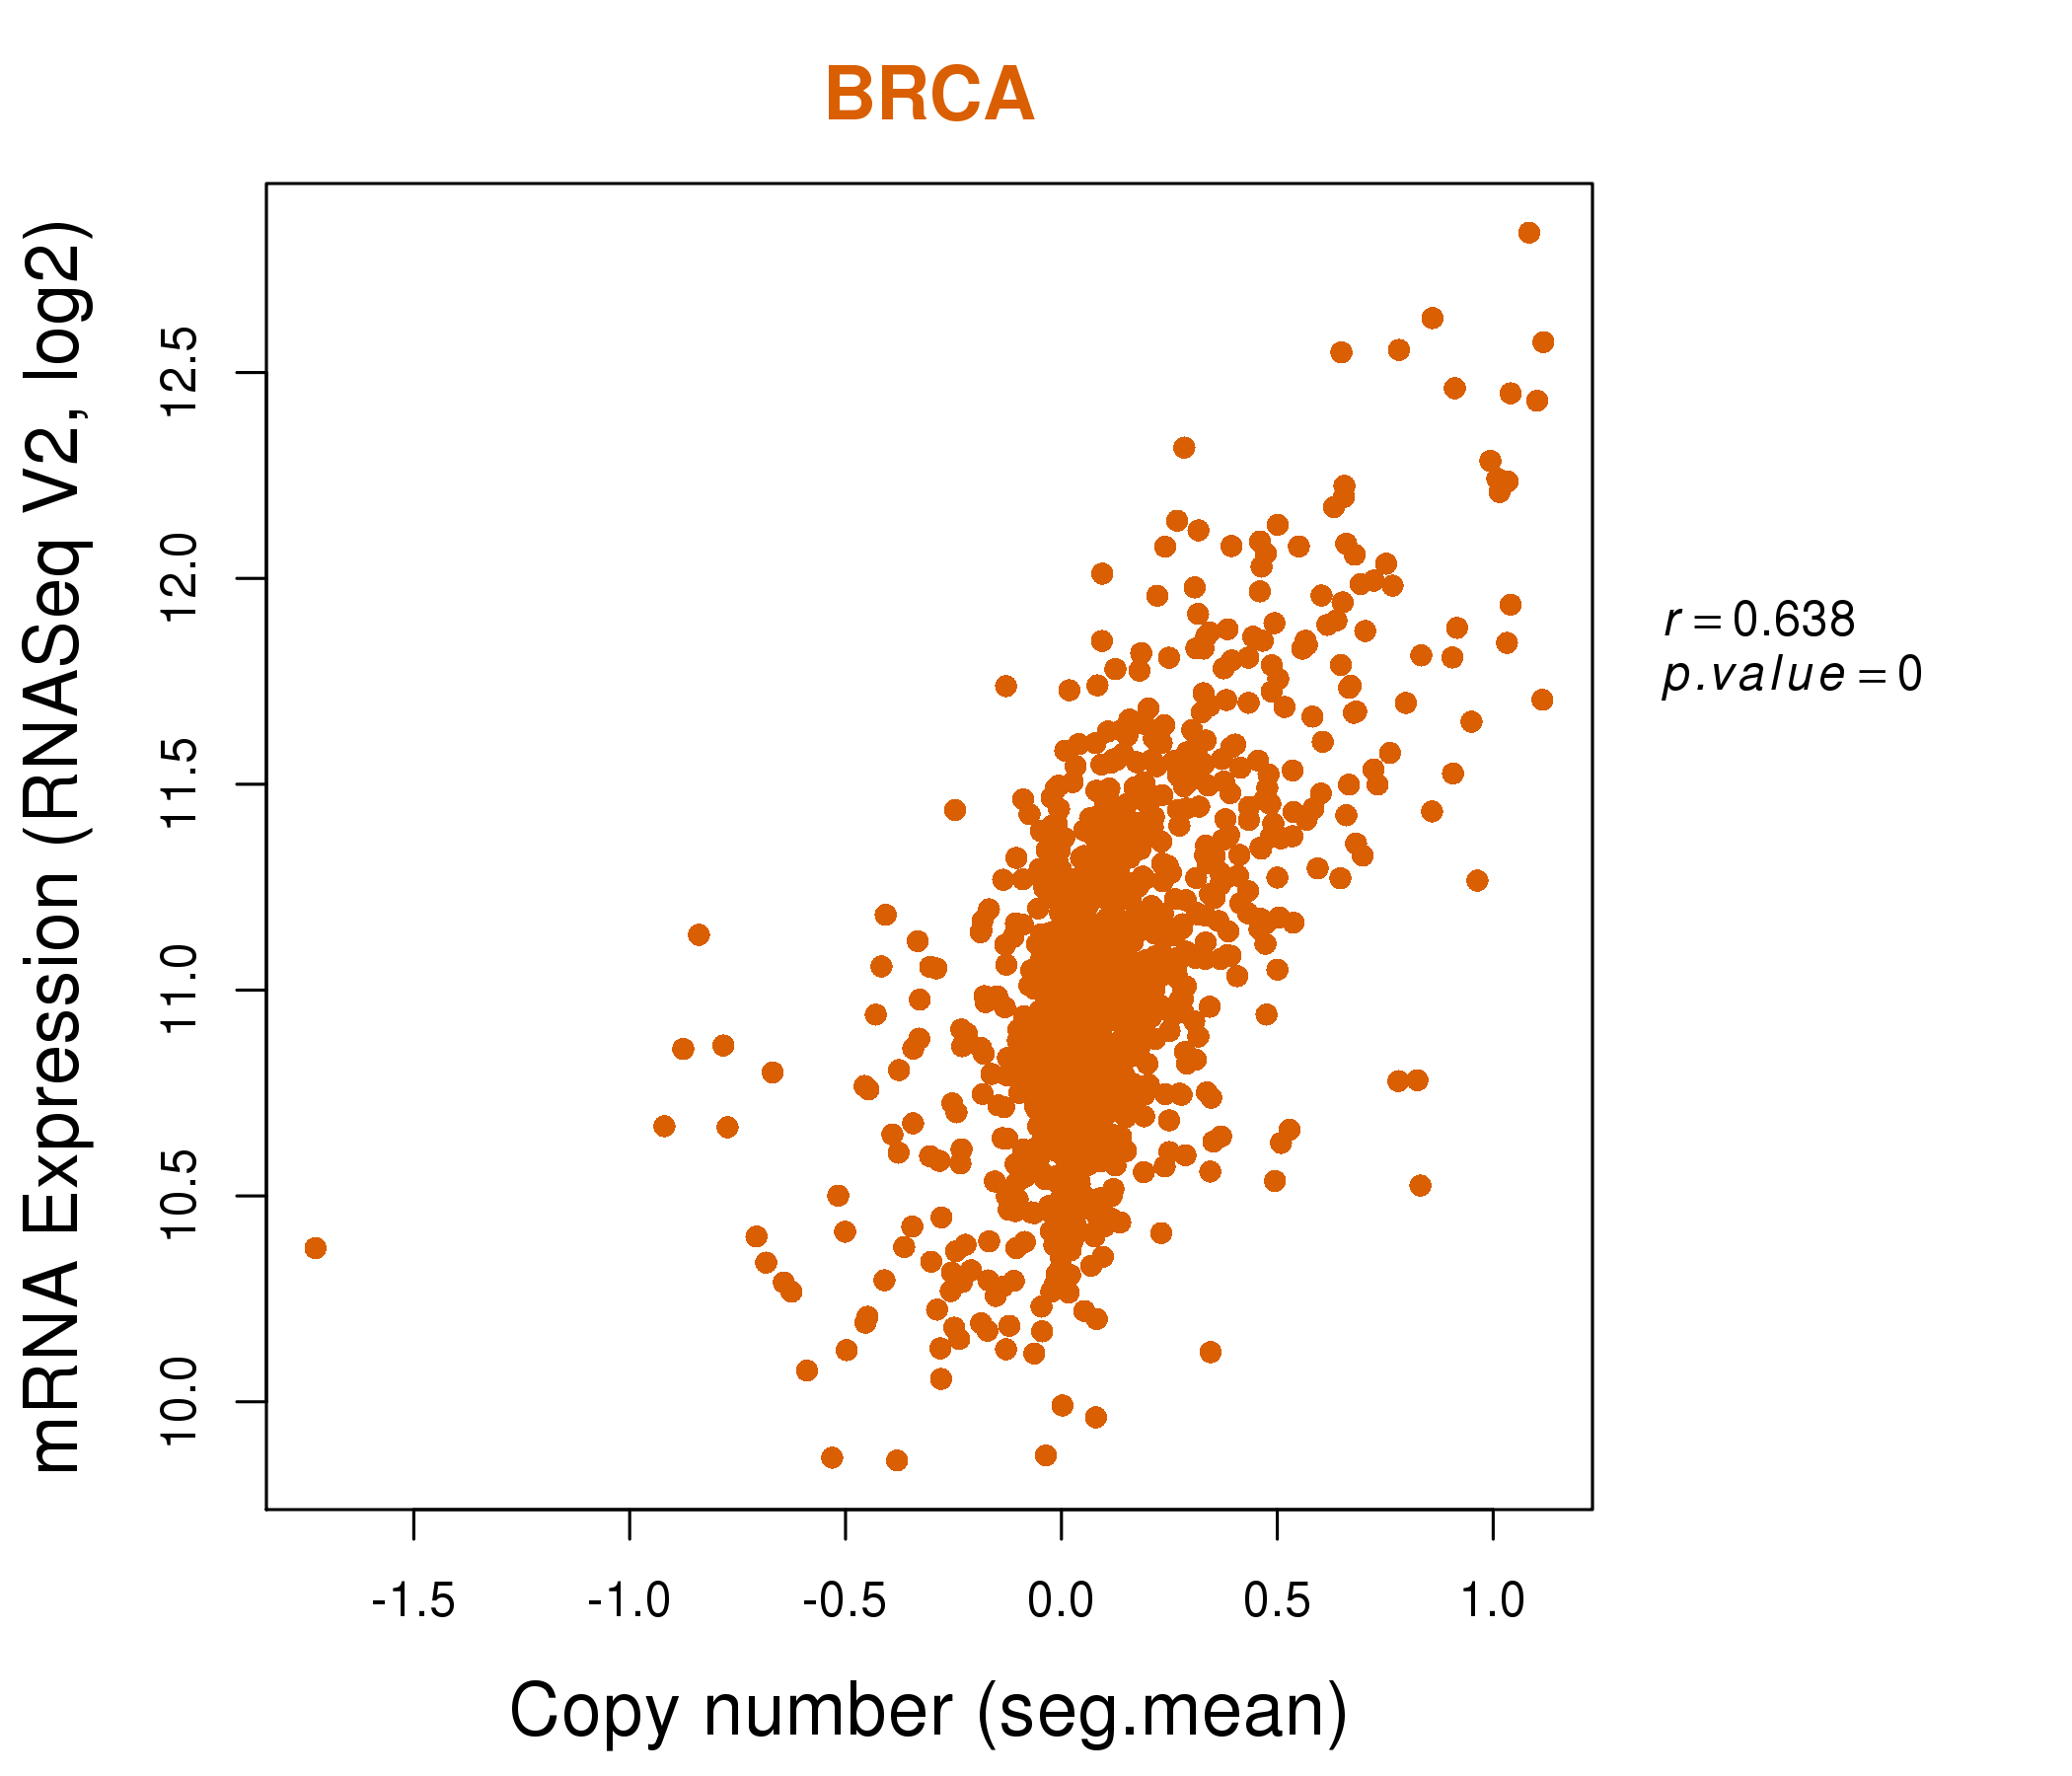
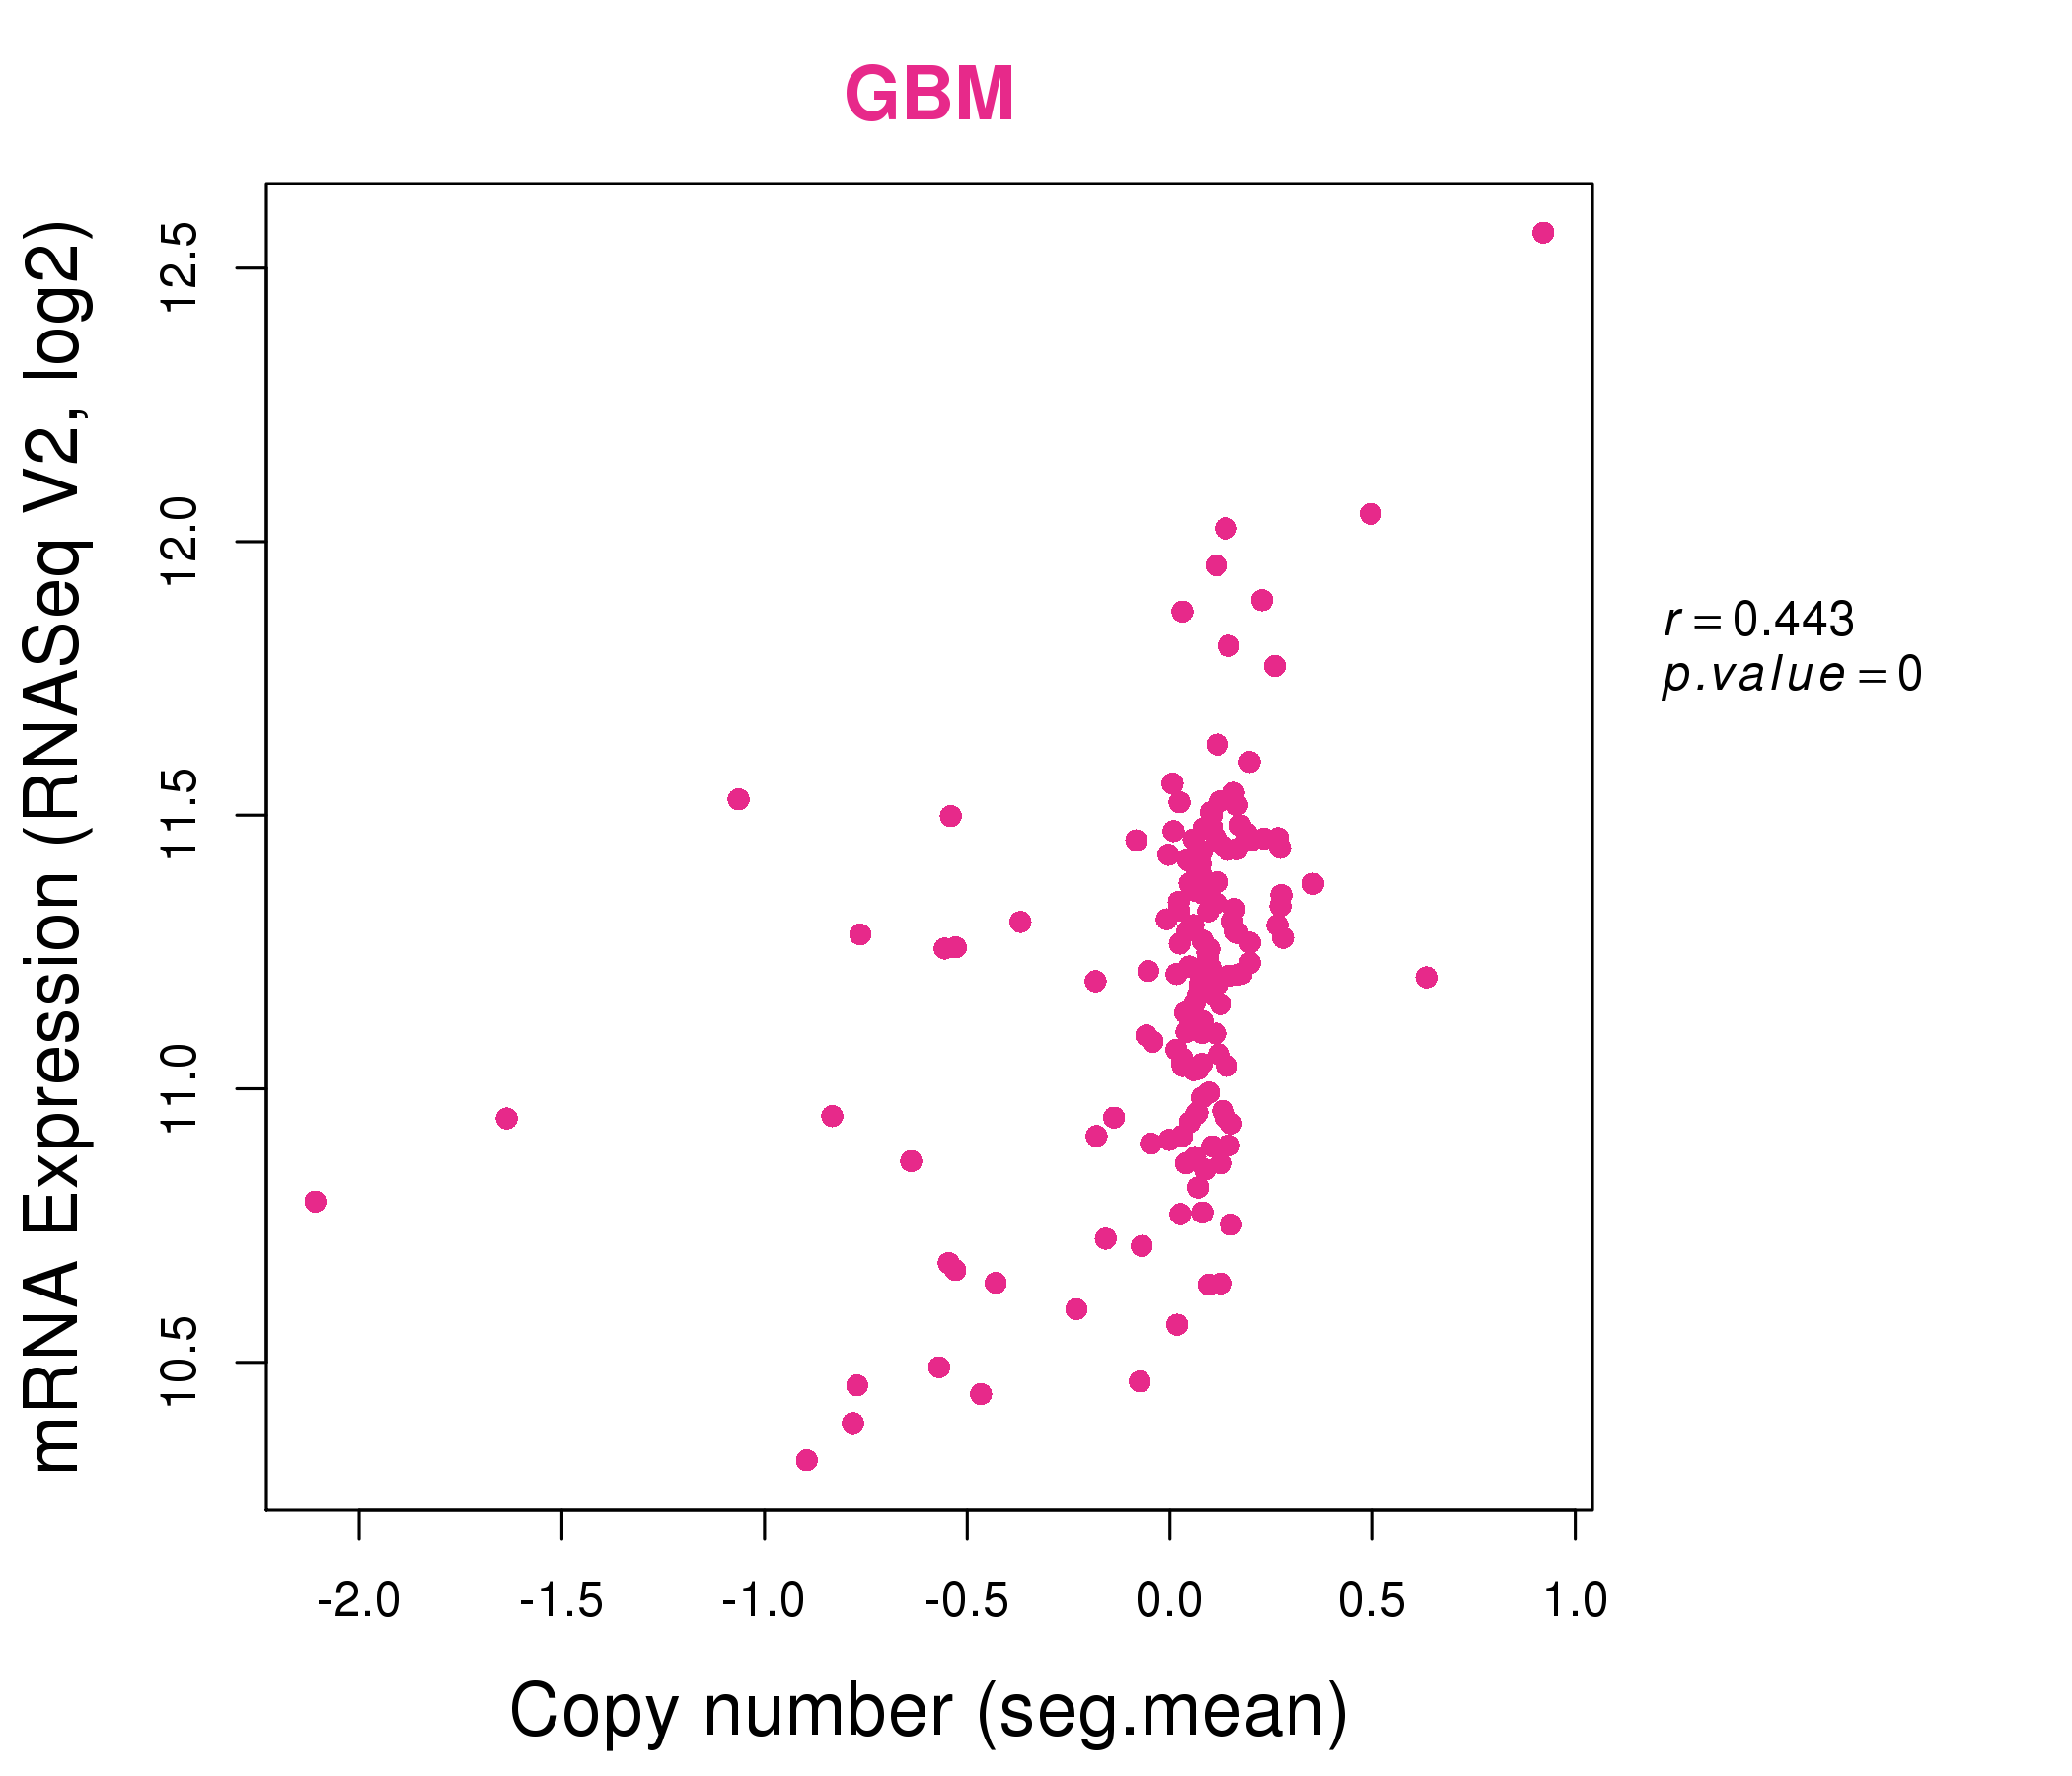
| * Normalized gene expression data of RNASeqV2 was extracted from TCGA using R package TCGA-Assembler. The URLs of all public data files on TCGA DCC data server were gathered at Jan-05-2015. Only eight cancer types have enough normal control samples for differential expression analysis. (t test, adjusted p<0.05 (using Benjamini-Hochberg FDR)) |
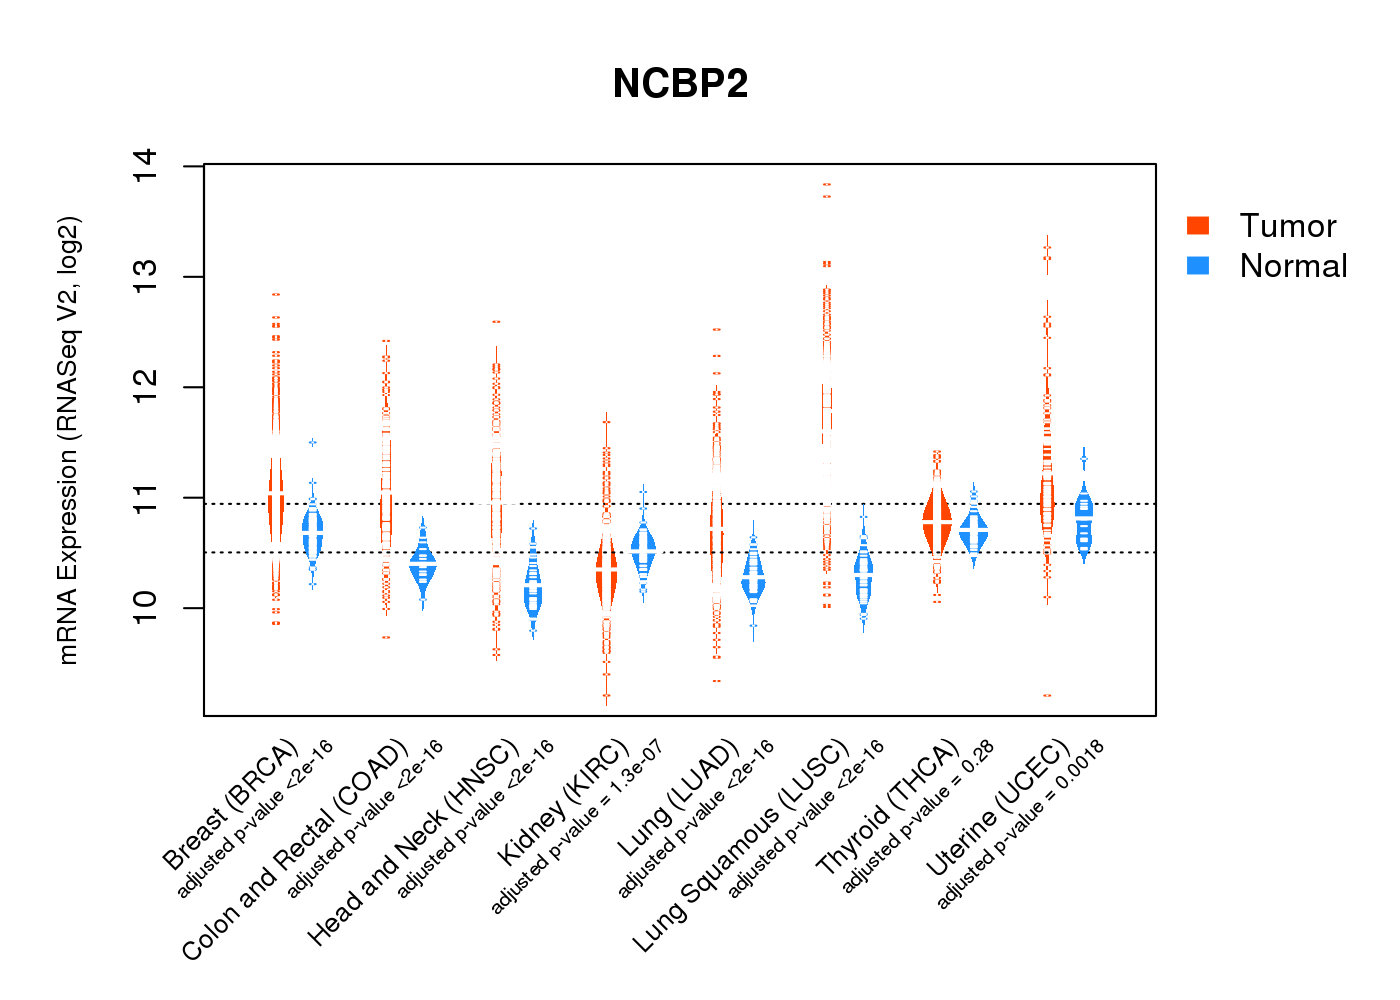 |
| Top |
| * This plots show the correlation between CNV and gene expression. |
: Open all plots for all cancer types
 |
|
 |
|
| Top |
| Gene-Gene Network Information |
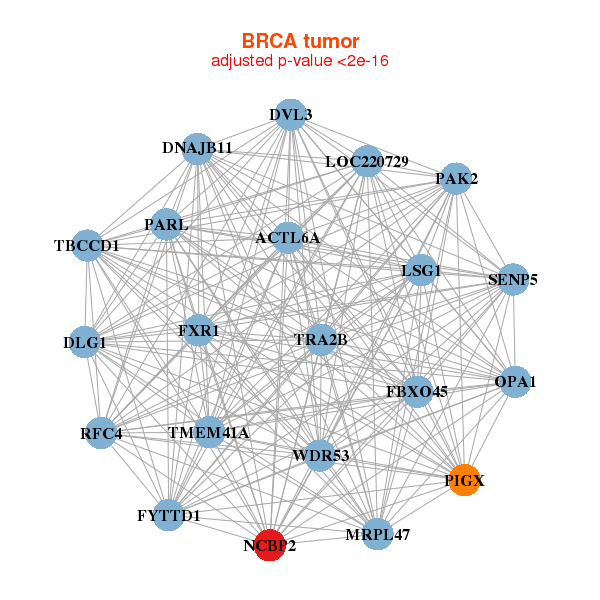
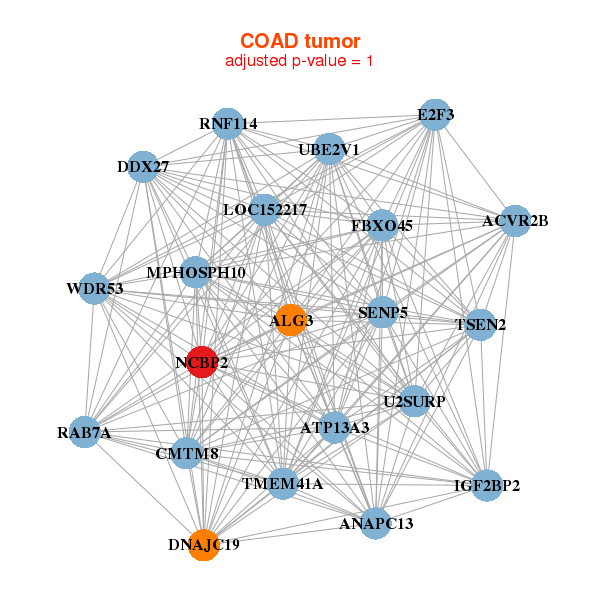
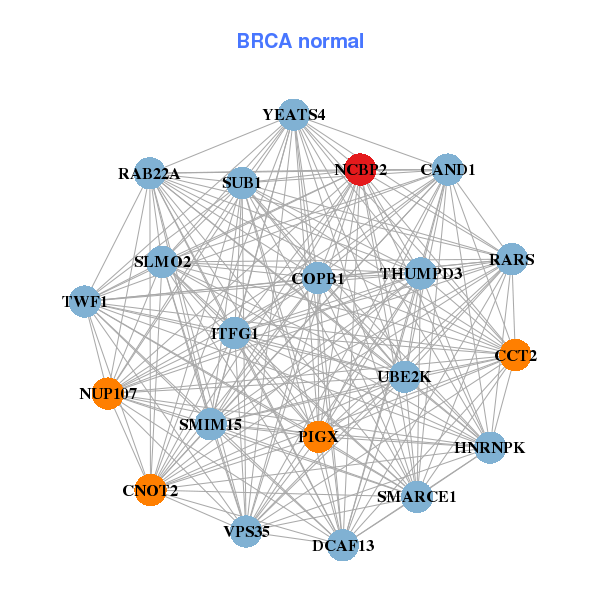
| * Co-Expression network figures were drawn using R package igraph. Only the top 20 genes with the highest correlations were shown. Red circle: input gene, orange circle: cell metabolism gene, sky circle: other gene |
: Open all plots for all cancer types
 |
|
| ACTL6A,DLG1,DNAJB11,DVL3,FBXO45,FXR1,FYTTD1, LOC220729,LSG1,MRPL47,NCBP2,OPA1,PAK2,PARL, PIGX,RFC4,SENP5,TBCCD1,TMEM41A,TRA2B,WDR53 | SMIM15,CAND1,CCT2,CNOT2,COPB1,DCAF13,HNRNPK, ITFG1,NCBP2,NUP107,PIGX,RAB22A,RARS,SLMO2, SMARCE1,SUB1,THUMPD3,TWF1,UBE2K,VPS35,YEATS4 |
 |
|
| ACVR2B,ALG3,ANAPC13,ATP13A3,CMTM8,DDX27,DNAJC19, E2F3,FBXO45,IGF2BP2,LOC152217,MPHOSPH10,NCBP2,RAB7A, RNF114,SENP5,U2SURP,TMEM41A,TSEN2,UBE2V1,WDR53 | URI1,DNAI2,TVP23B,GAB1,GABPA,HDHD2,NCBP2, P4HA1,PPP3CA,DESI2,PSG9,SMAD1,SPHAR,SPOPL, SYTL4,TLK1,TMC1,TMEM30A,WEE2,ZNF24,ZNF442 |
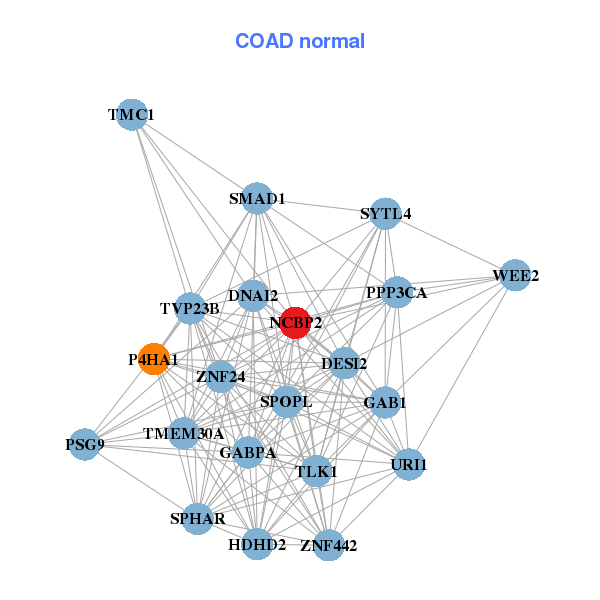
| * Co-Expression network figures were drawn using R package igraph. Only the top 20 genes with the highest correlations were shown. Red circle: input gene, orange circle: cell metabolism gene, sky circle: other gene |
: Open all plots for all cancer types
| Top |
: Open all interacting genes' information including KEGG pathway for all interacting genes from DAVID
| Top |
| Pharmacological Information for NCBP2 |
| There's no related Drug. |
| Top |
| Cross referenced IDs for NCBP2 |
| * We obtained these cross-references from Uniprot database. It covers 150 different DBs, 18 categories. http://www.uniprot.org/help/cross_references_section |
: Open all cross reference information
|
Copyright © 2016-Present - The Univsersity of Texas Health Science Center at Houston @ |