|
||||||||||||||||||||
| |
| Phenotypic Information (metabolism pathway, cancer, disease, phenome) |
| |
| |
| Gene-Gene Network Information: Co-Expression Network, Interacting Genes & KEGG |
| |
|


| Gene Summary for SEPHS2 |
| Basic gene info. | Gene symbol | SEPHS2 |
| Gene name | selenophosphate synthetase 2 | |
| Synonyms | SPS2|SPS2b | |
| Cytomap | UCSC genome browser: 16p11.2 | |
| Genomic location | chr16 :30454951-30457224 | |
| Type of gene | protein-coding | |
| RefGenes | NM_012248.3, | |
| Ensembl id | ENSG00000179918 | |
| Description | selenide, water dikinase 2selenium donor protein 2selenophosphate synthase 2 | |
| Modification date | 20141207 | |
| dbXrefs | MIM : 606218 | |
| HGNC : HGNC | ||
| Ensembl : ENSG00000179918 | ||
| HPRD : 12096 | ||
| Vega : OTTHUMG00000176988 | ||
| Protein | UniProt: Q99611 go to UniProt's Cross Reference DB Table | |
| Expression | CleanEX: HS_SEPHS2 | |
| BioGPS: 22928 | ||
| Gene Expression Atlas: ENSG00000179918 | ||
| The Human Protein Atlas: ENSG00000179918 | ||
| Pathway | NCI Pathway Interaction Database: SEPHS2 | |
| KEGG: SEPHS2 | ||
| REACTOME: SEPHS2 | ||
| ConsensusPathDB | ||
| Pathway Commons: SEPHS2 | ||
| Metabolism | MetaCyc: SEPHS2 | |
| HUMANCyc: SEPHS2 | ||
| Regulation | Ensembl's Regulation: ENSG00000179918 | |
| miRBase: chr16 :30,454,951-30,457,224 | ||
| TargetScan: NM_012248 | ||
| cisRED: ENSG00000179918 | ||
| Context | iHOP: SEPHS2 | |
| cancer metabolism search in PubMed: SEPHS2 | ||
| UCL Cancer Institute: SEPHS2 | ||
| Assigned class in ccmGDB | A - This gene has a literature evidence and it belongs to cancer gene. | |
| References showing role of SEPHS2 in cancer cell metabolism | 1. Dudaladava V, Jarząb M, Stobiecka E, Chmielik E, Simek K, et al. (2006) Gene expression profiling in hereditary, BRCA1-linked breast cancer: preliminary report. Hered Cancer Clin Pract 4: 28. go to article | |
| Top |
| Phenotypic Information for SEPHS2(metabolism pathway, cancer, disease, phenome) |
| Cancer | CGAP: SEPHS2 |
| Familial Cancer Database: SEPHS2 | |
| * This gene is included in those cancer gene databases. |
|
|
|
|
|
|
| ||||||||||||||
Oncogene 1 | Significant driver gene in | |||||||||||||||||||
| cf) number; DB name 1 Oncogene; http://nar.oxfordjournals.org/content/35/suppl_1/D721.long, 2 Tumor Suppressor gene; https://bioinfo.uth.edu/TSGene/, 3 Cancer Gene Census; http://www.nature.com/nrc/journal/v4/n3/abs/nrc1299.html, 4 CancerGenes; http://nar.oxfordjournals.org/content/35/suppl_1/D721.long, 5 Network of Cancer Gene; http://ncg.kcl.ac.uk/index.php, 1Therapeutic Vulnerabilities in Cancer; http://cbio.mskcc.org/cancergenomics/statius/ |
| KEGG_SELENOAMINO_ACID_METABOLISM | |
| OMIM | 606218; gene. |
| Orphanet | |
| Disease | KEGG Disease: SEPHS2 |
| MedGen: SEPHS2 (Human Medical Genetics with Condition) | |
| ClinVar: SEPHS2 | |
| Phenotype | MGI: SEPHS2 (International Mouse Phenotyping Consortium) |
| PhenomicDB: SEPHS2 | |
| Mutations for SEPHS2 |
| * Under tables are showing count per each tissue to give us broad intuition about tissue specific mutation patterns.You can go to the detailed page for each mutation database's web site. |
| There's no structural variation information in COSMIC data for this gene. |
| * From mRNA Sanger sequences, Chitars2.0 arranged chimeric transcripts. This table shows SEPHS2 related fusion information. |
| ID | Head Gene | Tail Gene | Accession | Gene_a | qStart_a | qEnd_a | Chromosome_a | tStart_a | tEnd_a | Gene_a | qStart_a | qEnd_a | Chromosome_a | tStart_a | tEnd_a |
| AA344463 | CRP | 1 | 190 | 1 | 159683023 | 159683212 | SEPHS2 | 186 | 276 | 16 | 30456286 | 30456377 | |
| Top |
| There's no copy number variation information in COSMIC data for this gene. |
| Top |
|
 |
| Top |
| Stat. for Non-Synonymous SNVs (# total SNVs=26) | (# total SNVs=10) |
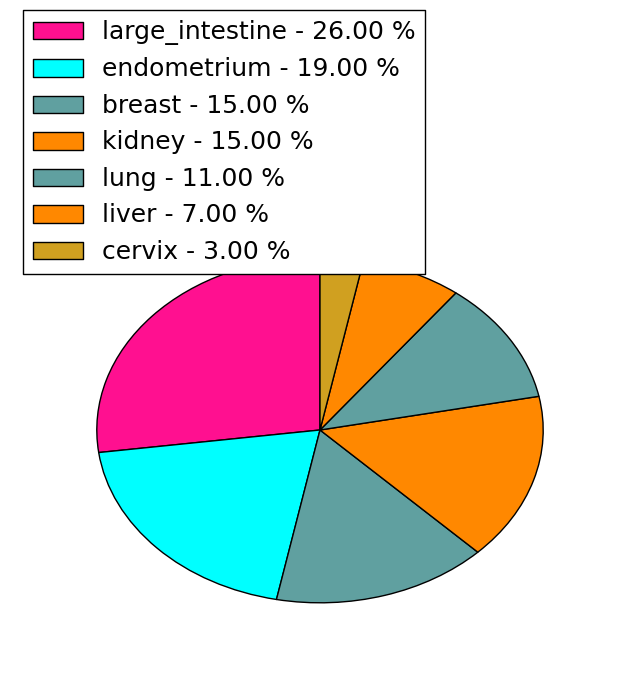 | 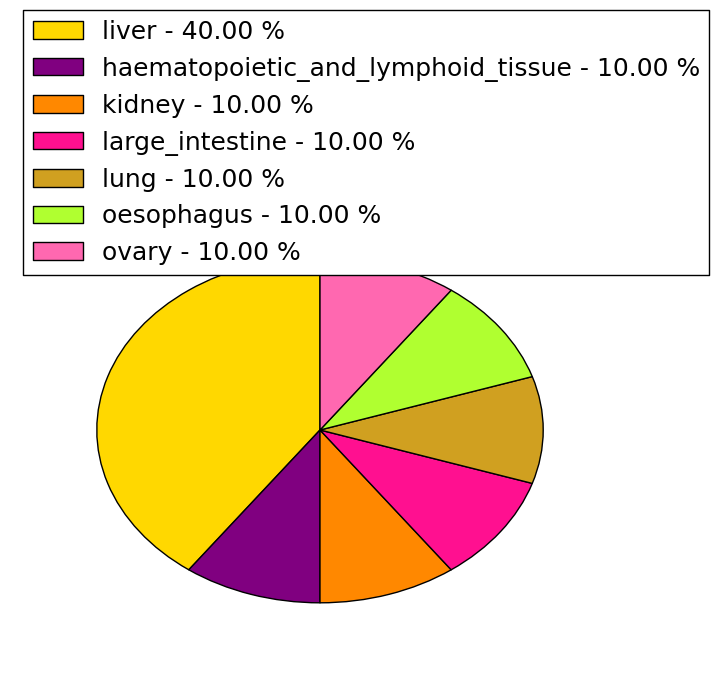 |
(# total SNVs=0) | (# total SNVs=0) |
| Top |
| * When you move the cursor on each content, you can see more deailed mutation information on the Tooltip. Those are primary_site,primary_histology,mutation(aa),pubmedID. |
| GRCh37 position | Mutation(aa) | Unique sampleID count |
| chr16:30455863-30455863 | p.G396R | 3 |
| chr16:30456542-30456542 | p.E169E | 2 |
| chr16:30456293-30456293 | p.K252N | 2 |
| chr16:30456698-30456698 | p.I117I | 2 |
| chr16:30456699-30456699 | p.I117T | 2 |
| chr16:30456144-30456144 | p.A302D | 1 |
| chr16:30455783-30455783 | p.V422V | 1 |
| chr16:30456518-30456518 | p.L177L | 1 |
| chr16:30455897-30455897 | p.A384A | 1 |
| chr16:30456187-30456187 | p.Y288H | 1 |
| Top |
|
 |
| Point Mutation/ Tissue ID | 1 | 2 | 3 | 4 | 5 | 6 | 7 | 8 | 9 | 10 | 11 | 12 | 13 | 14 | 15 | 16 | 17 | 18 | 19 | 20 |
| # sample | ||||||||||||||||||||
| # mutation | ||||||||||||||||||||
| nonsynonymous SNV | ||||||||||||||||||||
| synonymous SNV |
| cf) Tissue ID; Tissue type (1; BLCA[Bladder Urothelial Carcinoma], 2; BRCA[Breast invasive carcinoma], 3; CESC[Cervical squamous cell carcinoma and endocervical adenocarcinoma], 4; COAD[Colon adenocarcinoma], 5; GBM[Glioblastoma multiforme], 6; Glioma Low Grade, 7; HNSC[Head and Neck squamous cell carcinoma], 8; KICH[Kidney Chromophobe], 9; KIRC[Kidney renal clear cell carcinoma], 10; KIRP[Kidney renal papillary cell carcinoma], 11; LAML[Acute Myeloid Leukemia], 12; LUAD[Lung adenocarcinoma], 13; LUSC[Lung squamous cell carcinoma], 14; OV[Ovarian serous cystadenocarcinoma ], 15; PAAD[Pancreatic adenocarcinoma], 16; PRAD[Prostate adenocarcinoma], 17; SKCM[Skin Cutaneous Melanoma], 18:STAD[Stomach adenocarcinoma], 19:THCA[Thyroid carcinoma], 20:UCEC[Uterine Corpus Endometrial Carcinoma]) |
| Top |
| * We represented just top 10 SNVs. When you move the cursor on each content, you can see more deailed mutation information on the Tooltip. Those are primary_site, primary_histology, mutation(aa), pubmedID. |
| Genomic Position | Mutation(aa) | Unique sampleID count |
| * Copy number data were extracted from TCGA using R package TCGA-Assembler. The URLs of all public data files on TCGA DCC data server were gathered on Jan-05-2015. Function ProcessCNAData in TCGA-Assembler package was used to obtain gene-level copy number value which is calculated as the average copy number of the genomic region of a gene. |
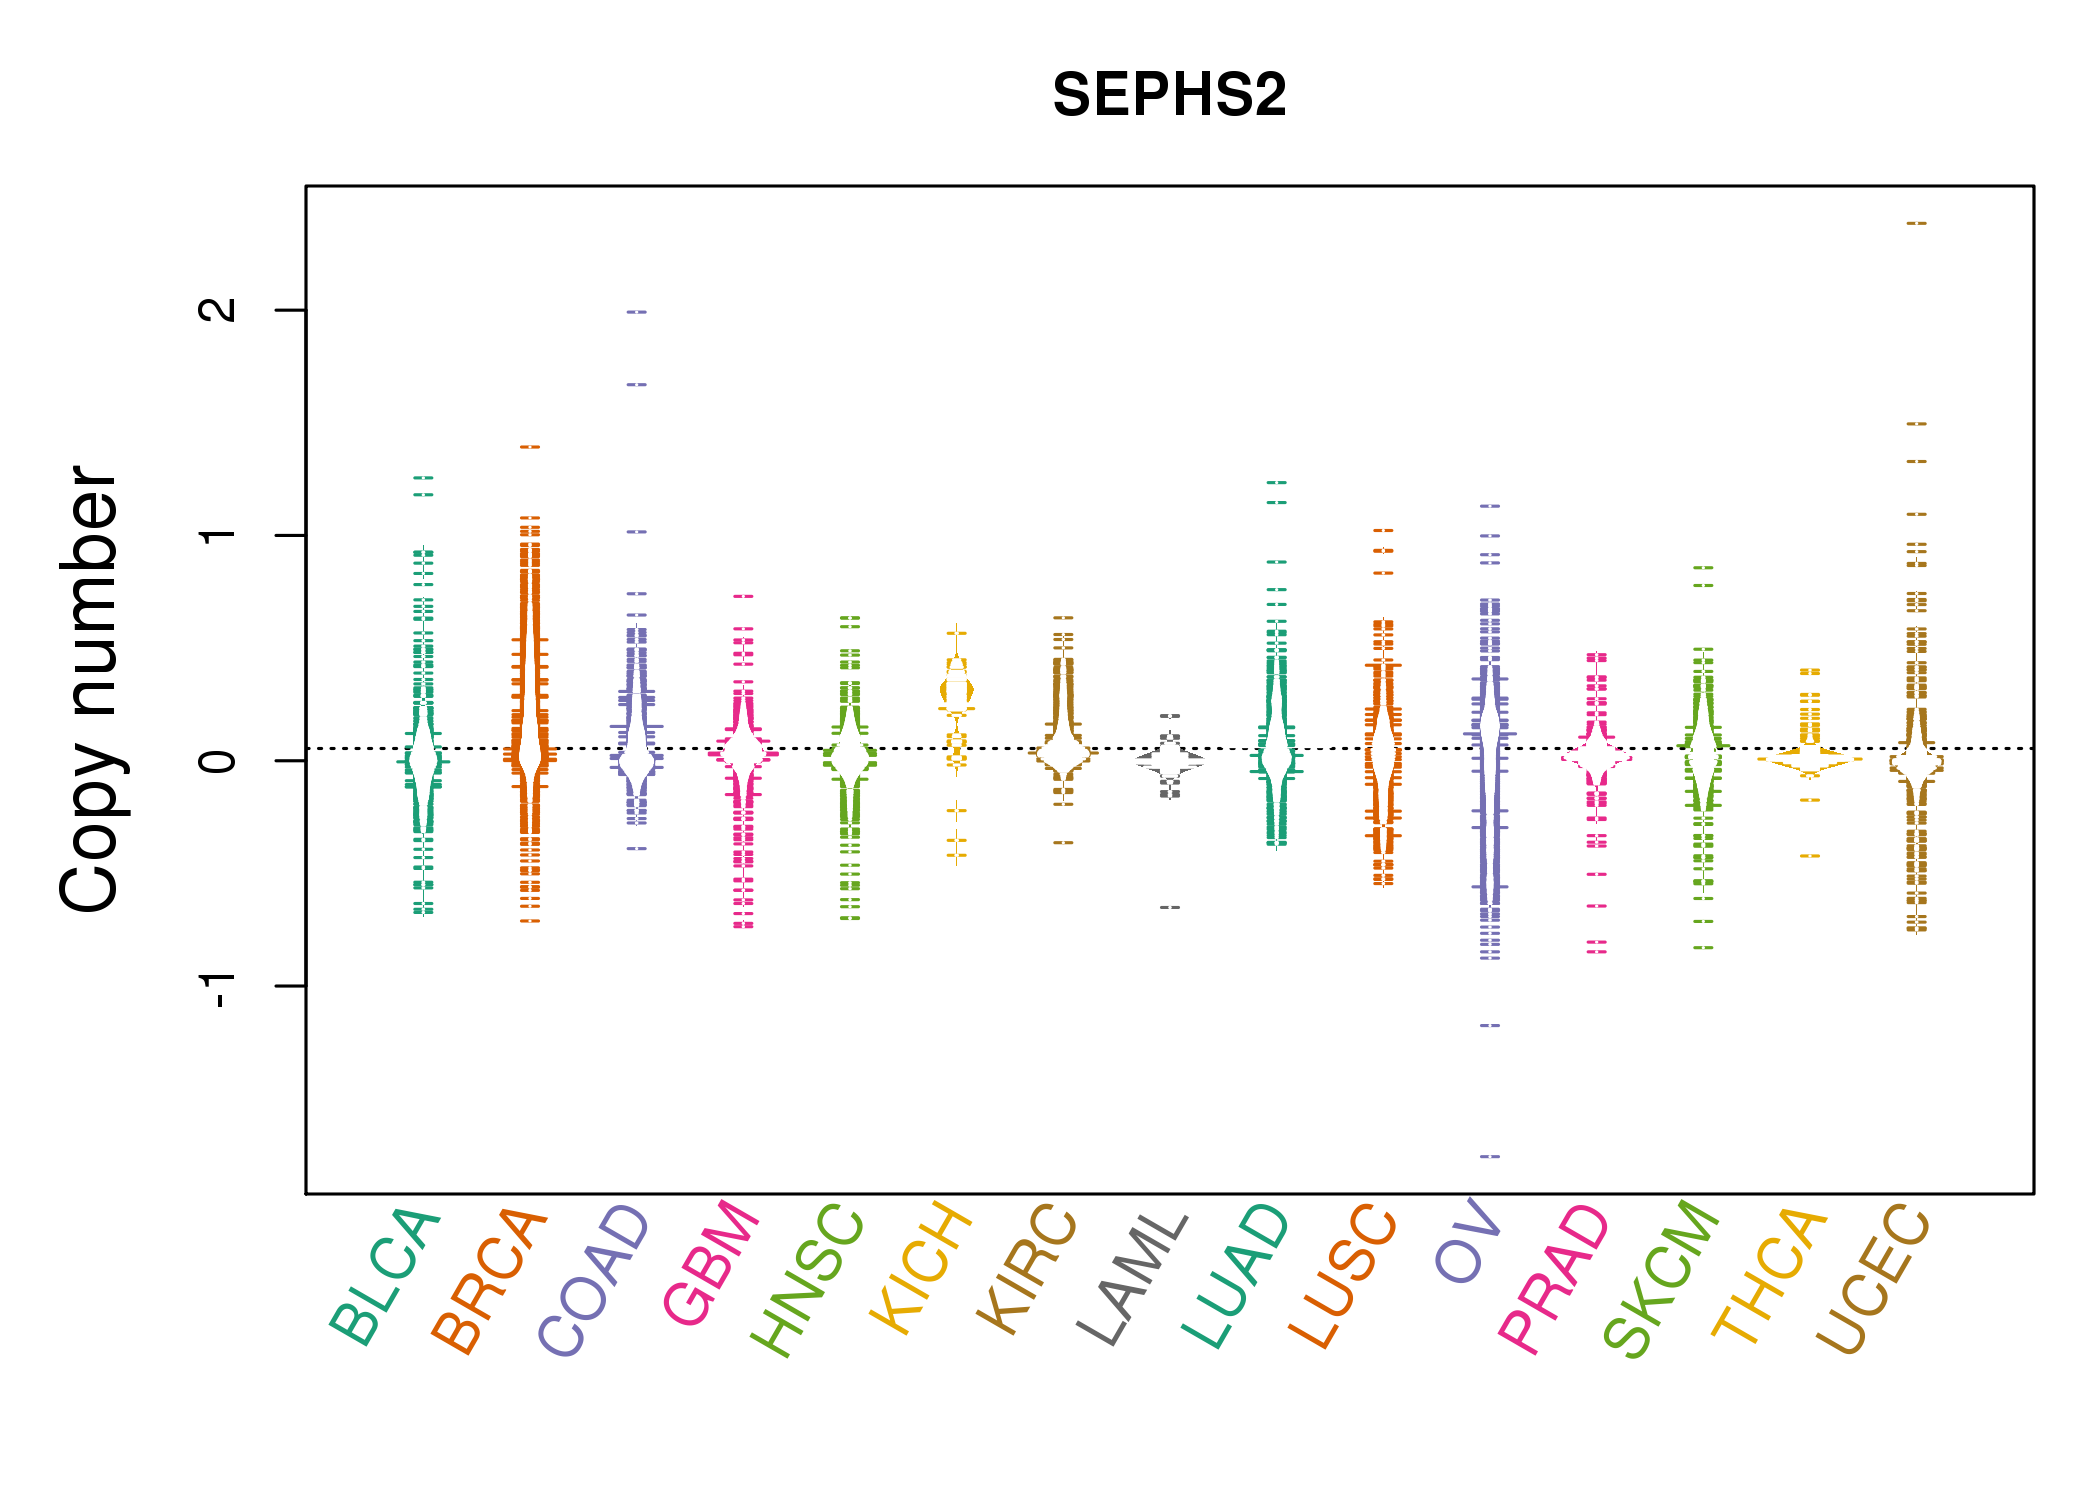 |
| cf) Tissue ID[Tissue type]: BLCA[Bladder Urothelial Carcinoma], BRCA[Breast invasive carcinoma], CESC[Cervical squamous cell carcinoma and endocervical adenocarcinoma], COAD[Colon adenocarcinoma], GBM[Glioblastoma multiforme], Glioma Low Grade, HNSC[Head and Neck squamous cell carcinoma], KICH[Kidney Chromophobe], KIRC[Kidney renal clear cell carcinoma], KIRP[Kidney renal papillary cell carcinoma], LAML[Acute Myeloid Leukemia], LUAD[Lung adenocarcinoma], LUSC[Lung squamous cell carcinoma], OV[Ovarian serous cystadenocarcinoma ], PAAD[Pancreatic adenocarcinoma], PRAD[Prostate adenocarcinoma], SKCM[Skin Cutaneous Melanoma], STAD[Stomach adenocarcinoma], THCA[Thyroid carcinoma], UCEC[Uterine Corpus Endometrial Carcinoma] |
| Top |
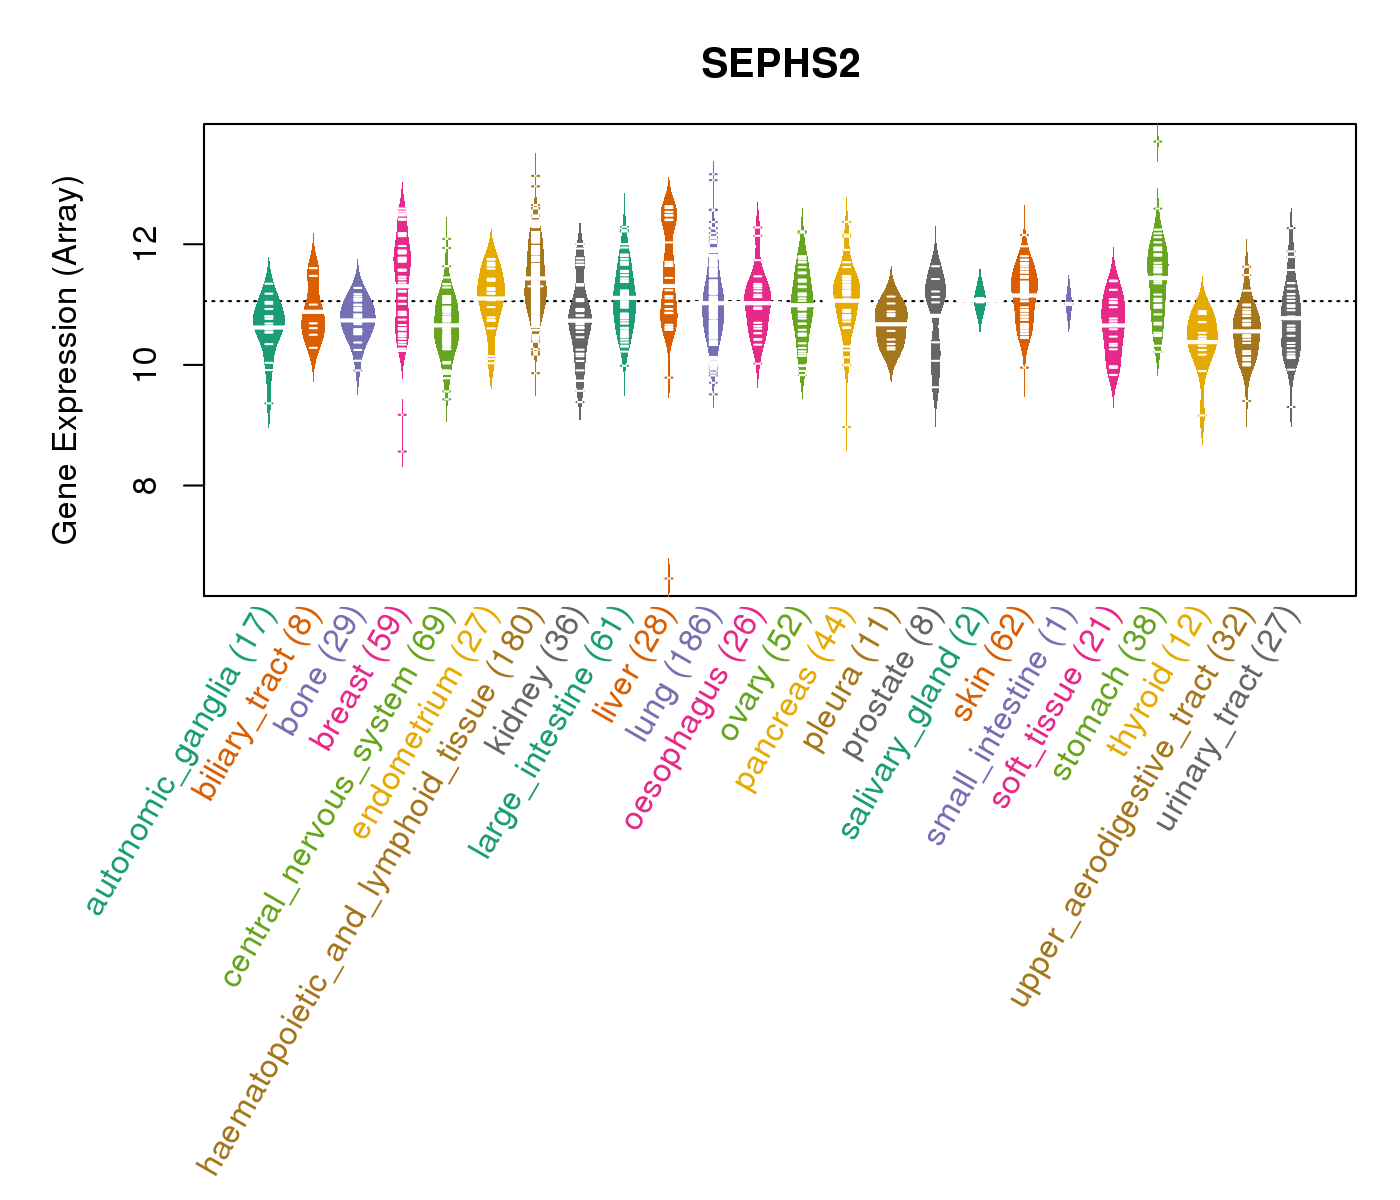
| Gene Expression for SEPHS2 |
| * CCLE gene expression data were extracted from CCLE_Expression_Entrez_2012-10-18.res: Gene-centric RMA-normalized mRNA expression data. |
 |
| * Normalized gene expression data of RNASeqV2 was extracted from TCGA using R package TCGA-Assembler. The URLs of all public data files on TCGA DCC data server were gathered at Jan-05-2015. Only eight cancer types have enough normal control samples for differential expression analysis. (t test, adjusted p<0.05 (using Benjamini-Hochberg FDR)) |
 |
| Top |
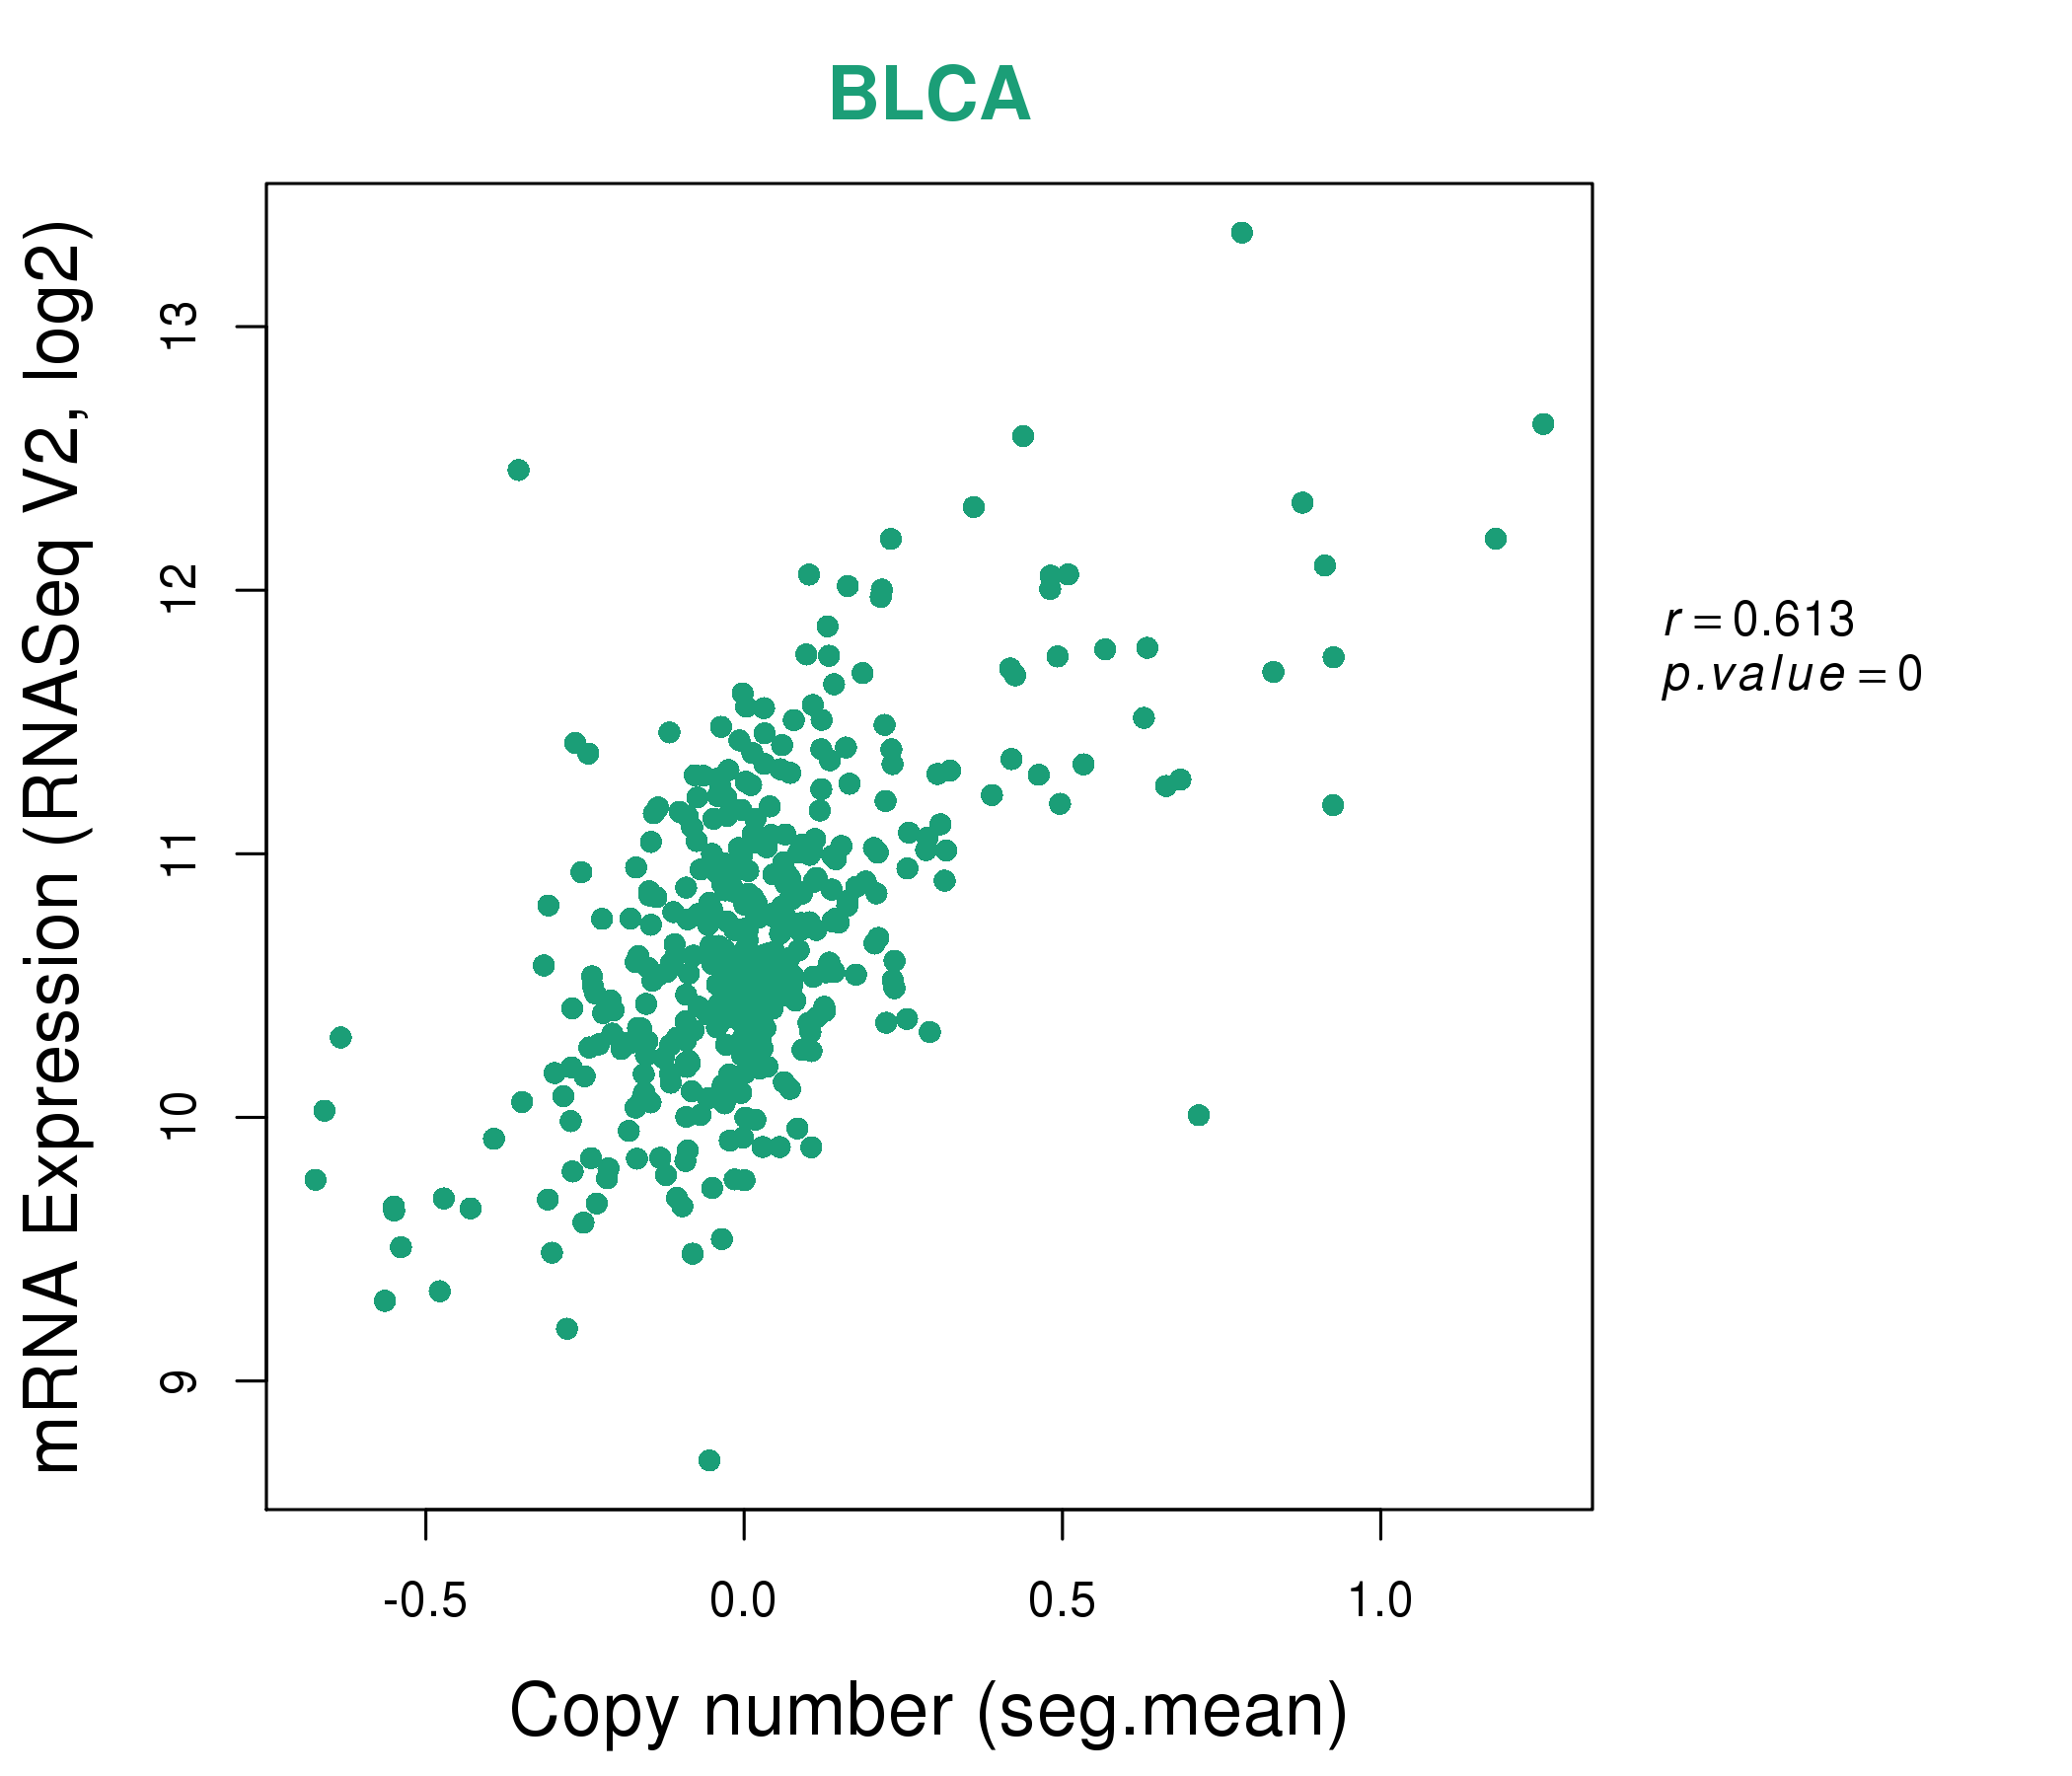
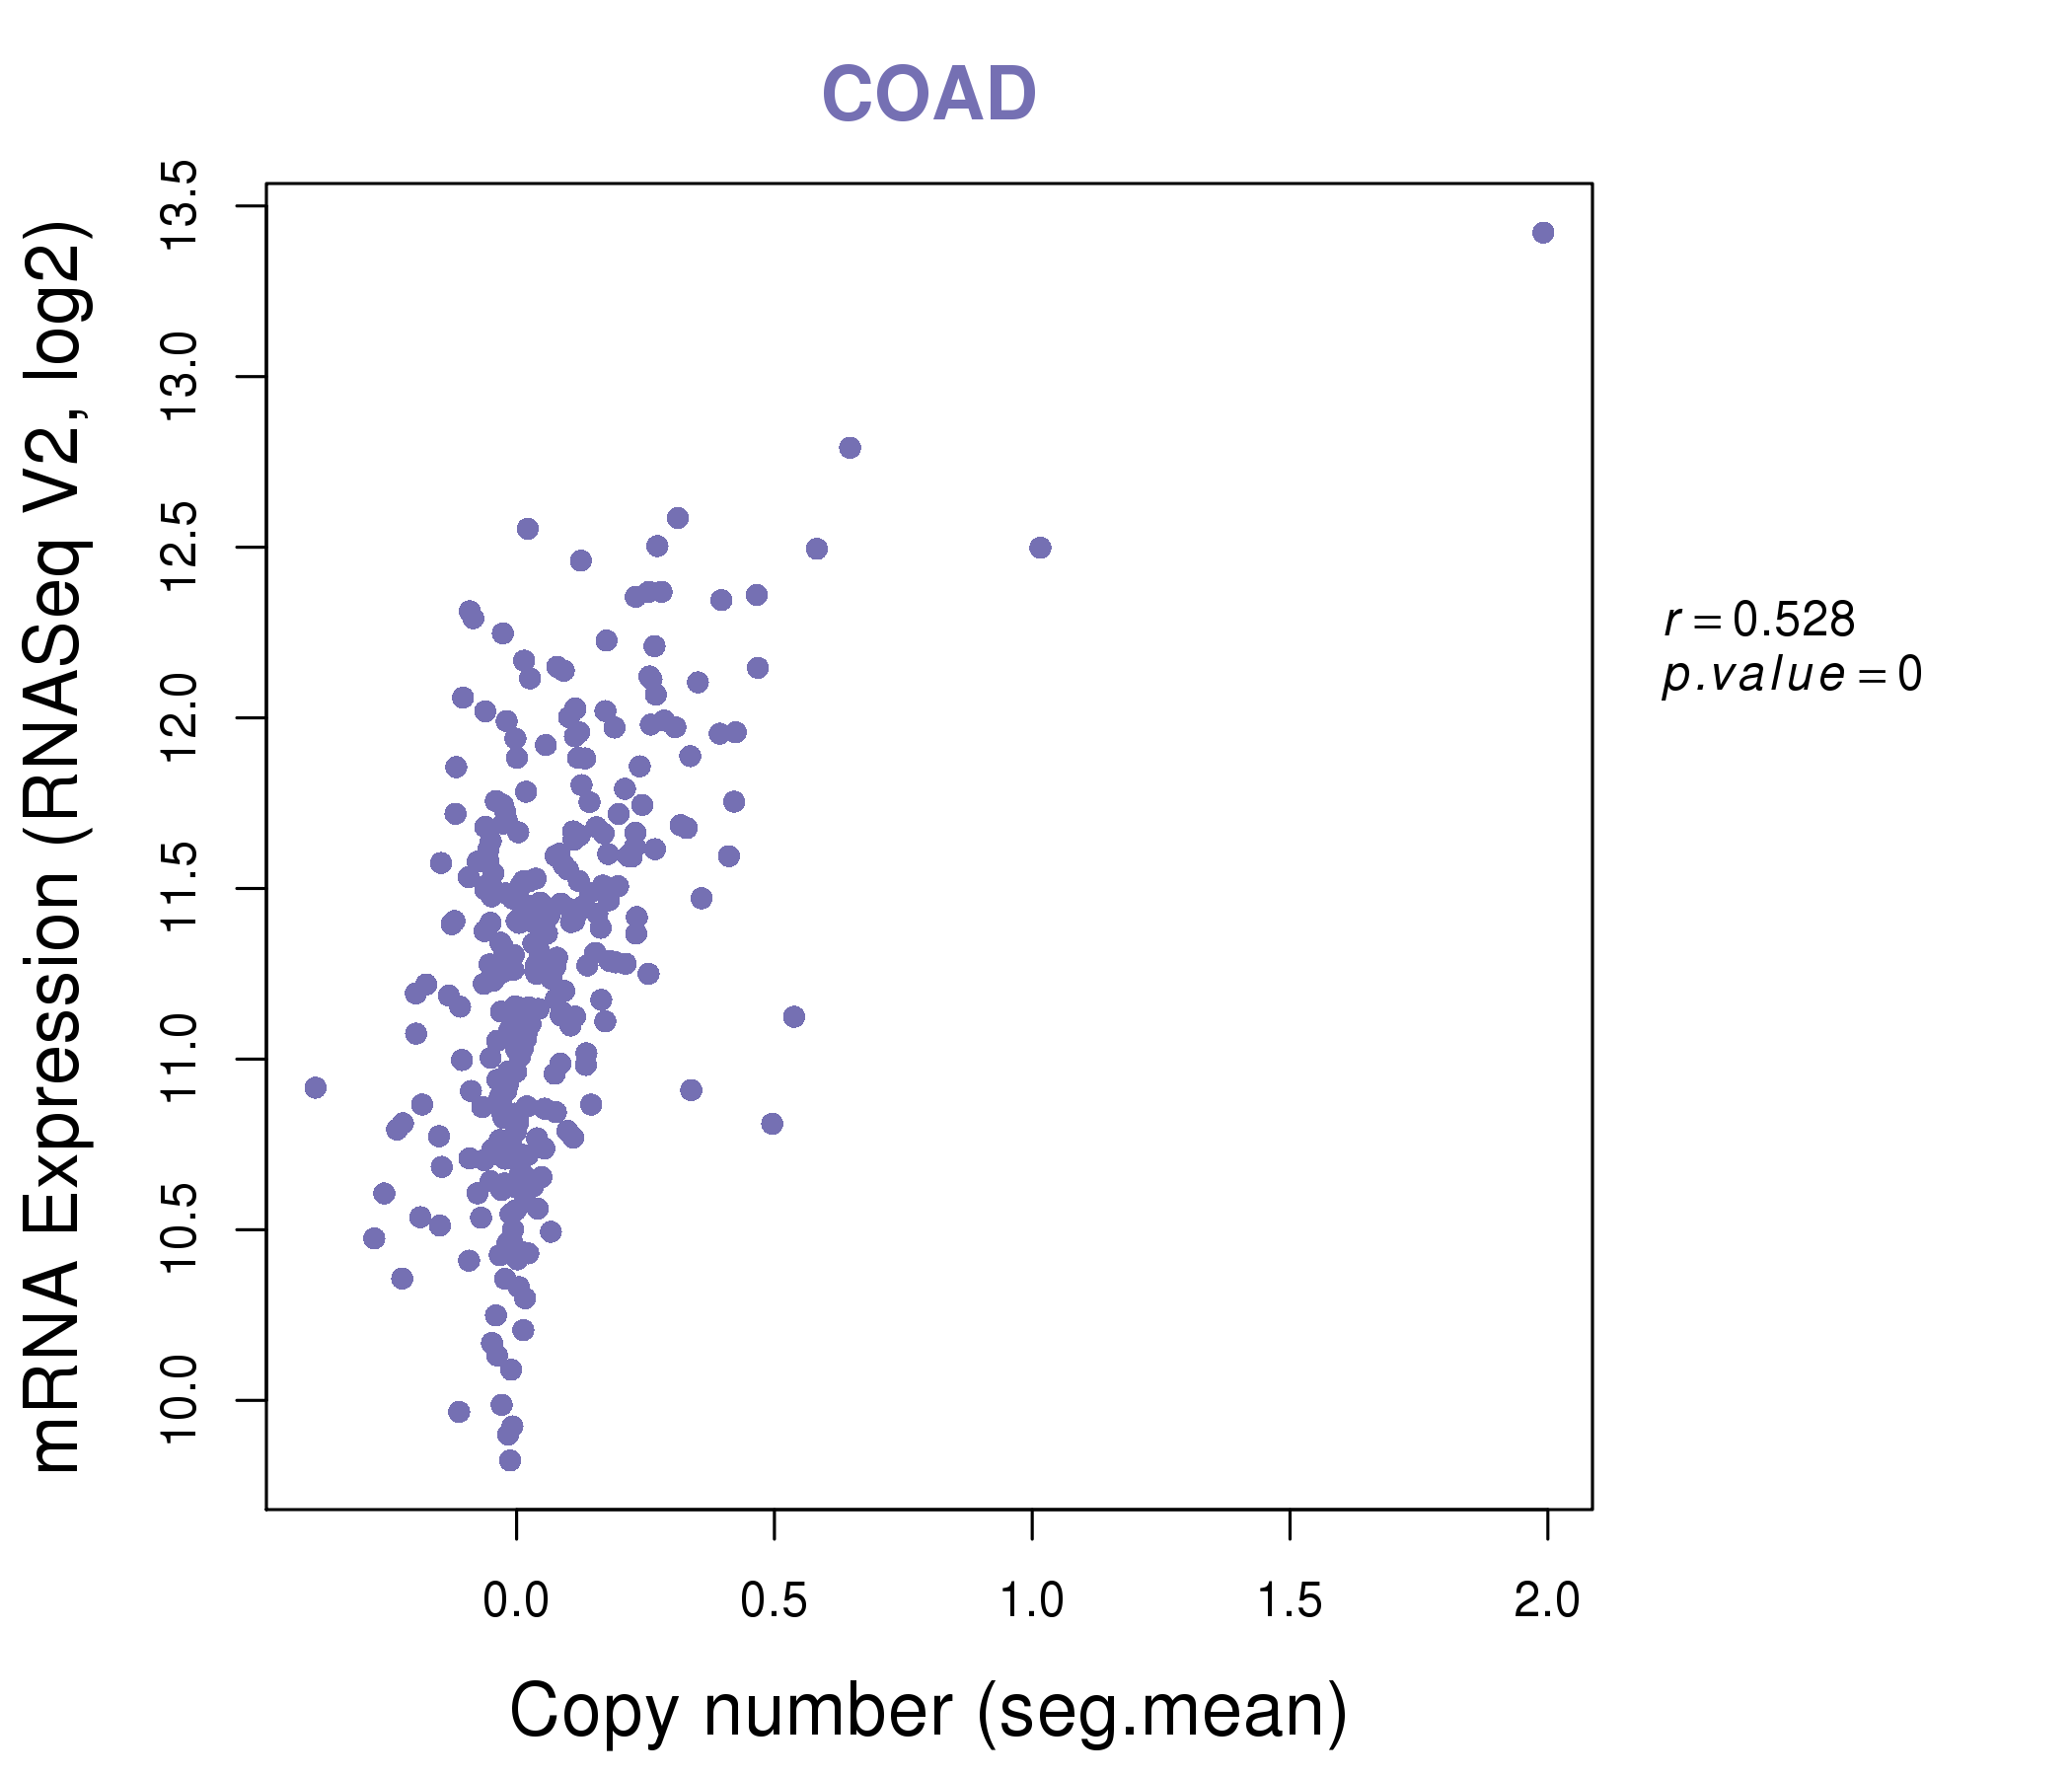
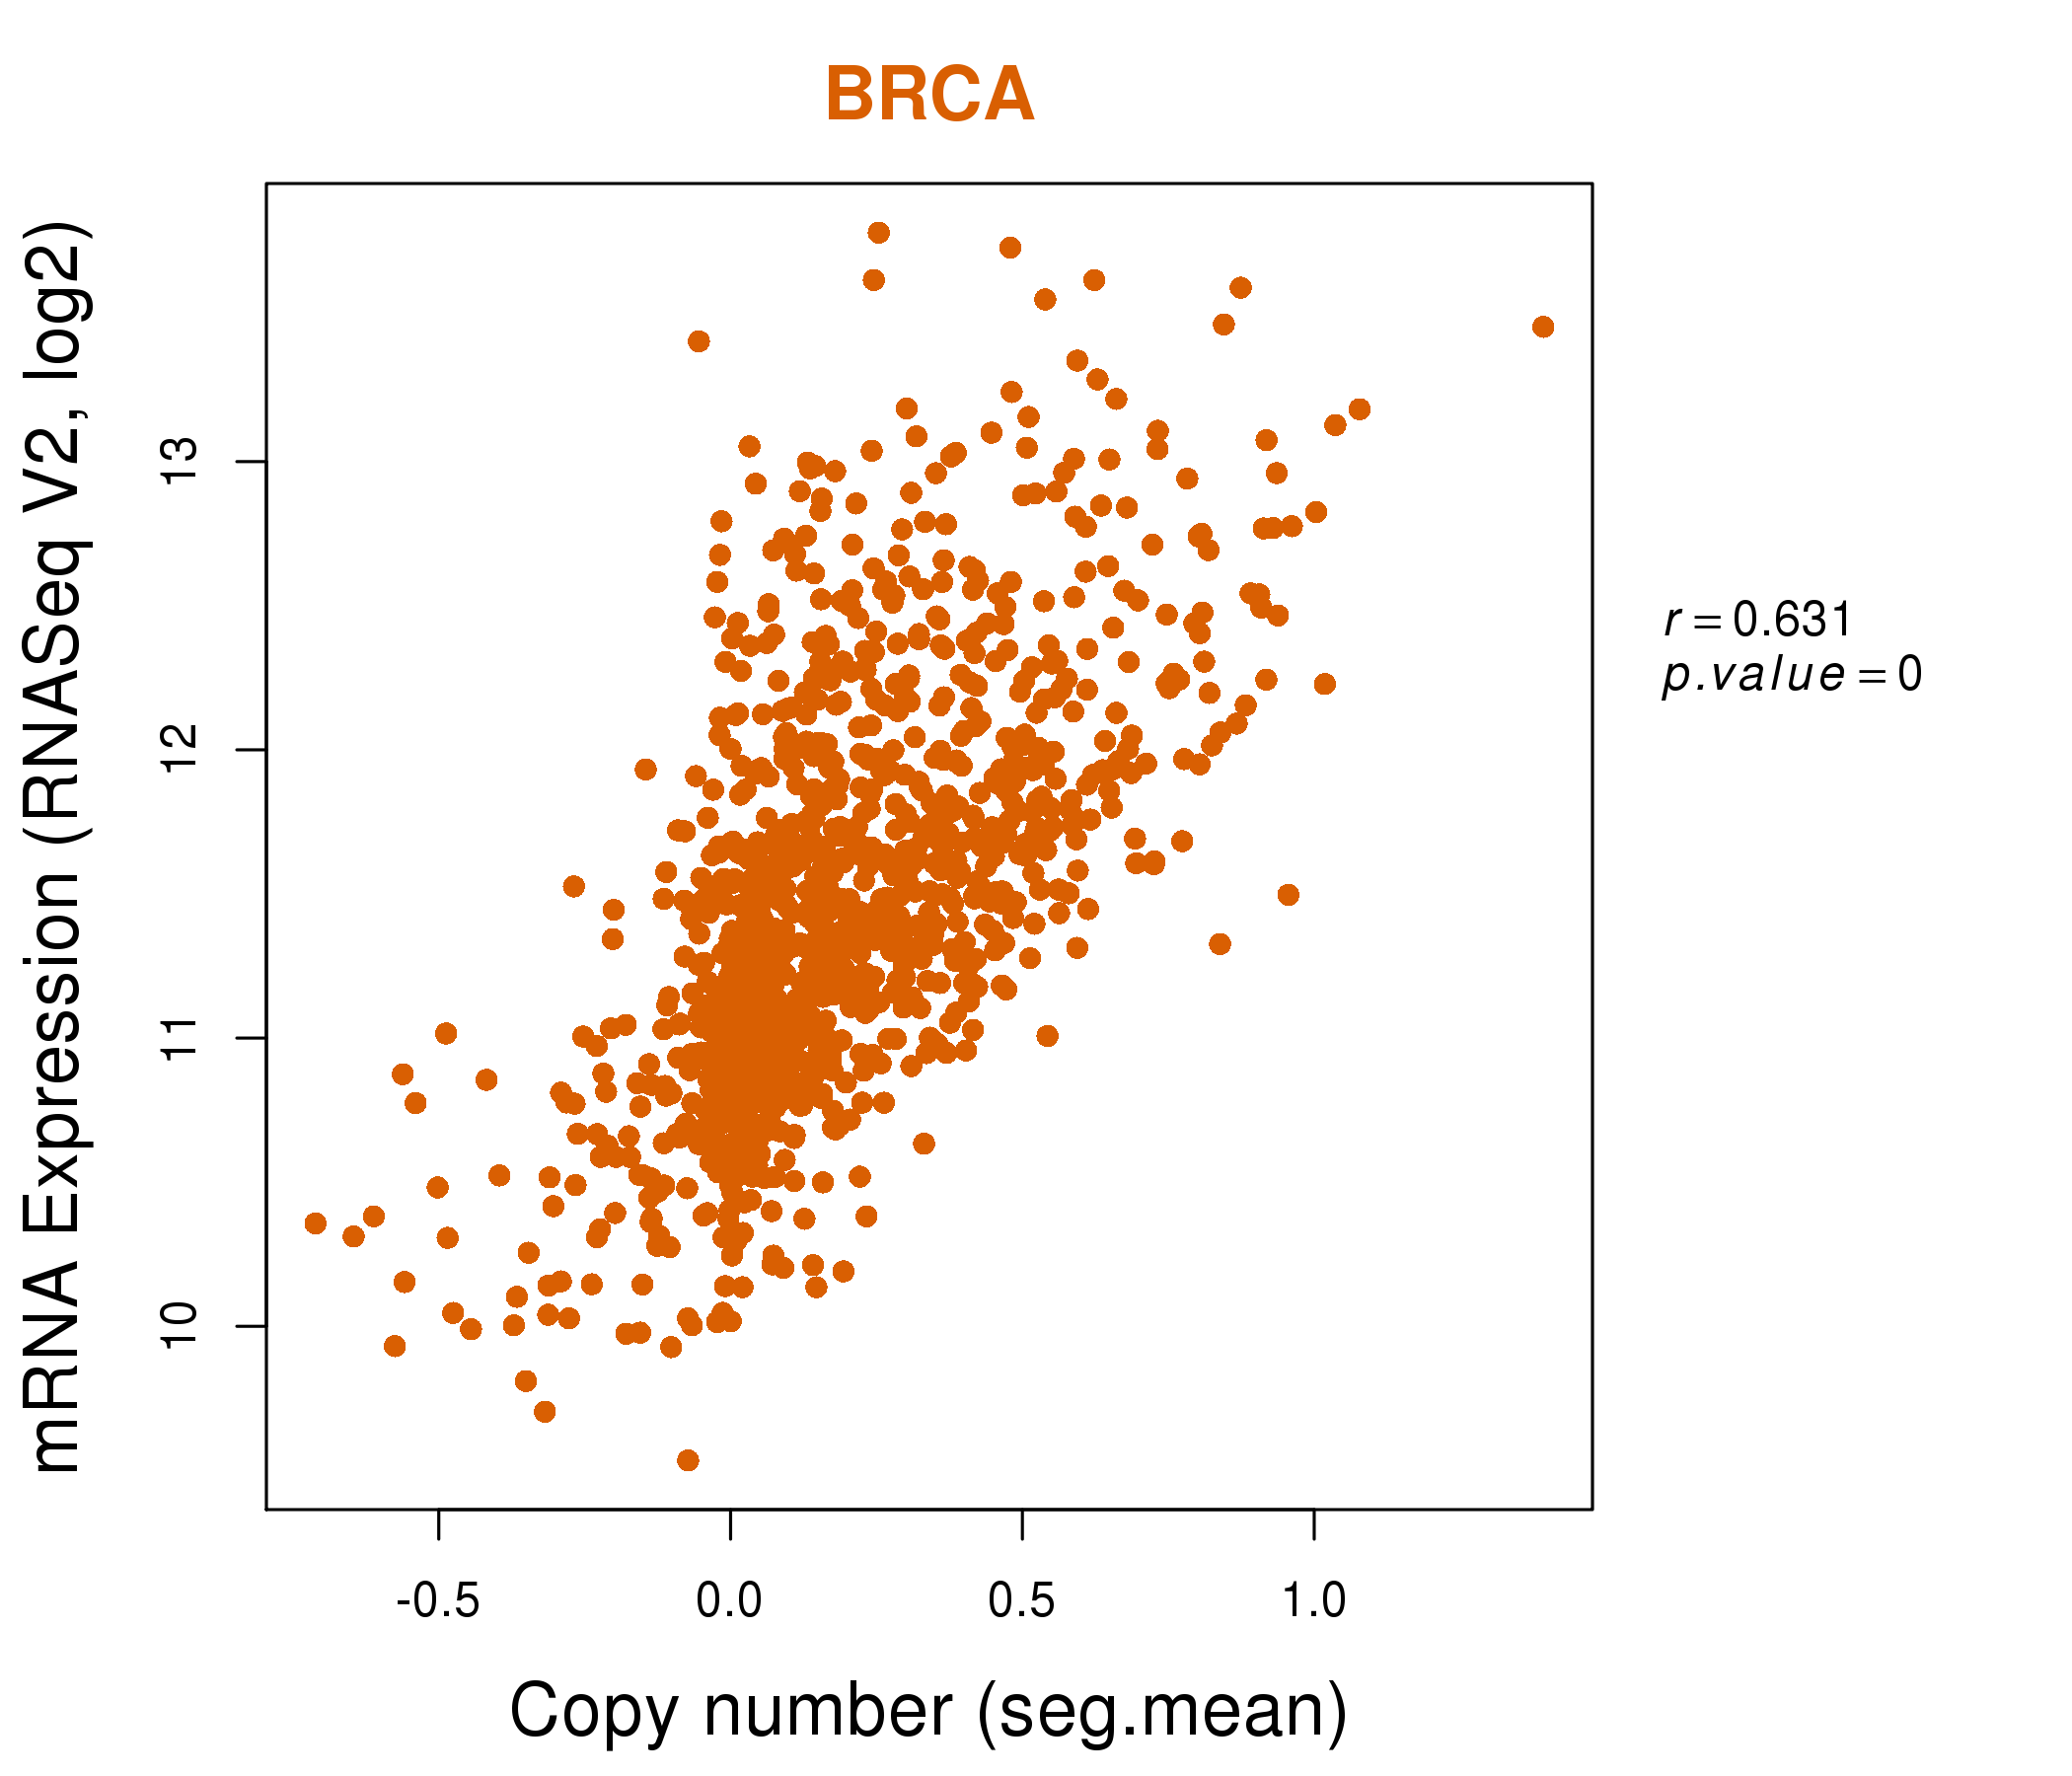
| * This plots show the correlation between CNV and gene expression. |
: Open all plots for all cancer types
 |
|
 |
|

| Top |
| Gene-Gene Network Information |
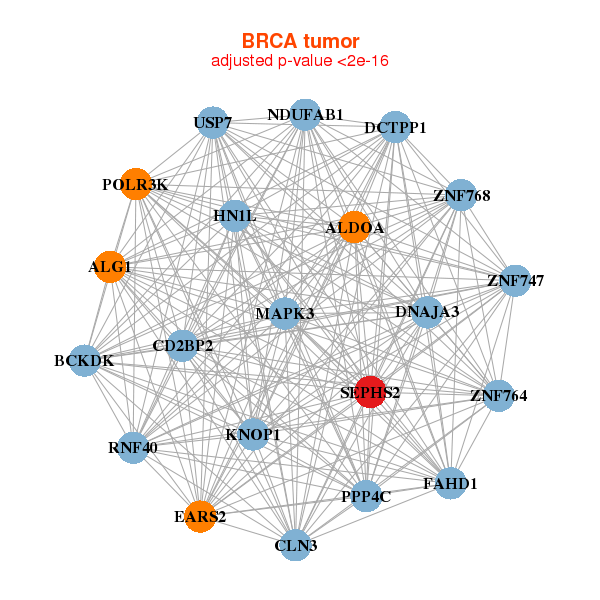
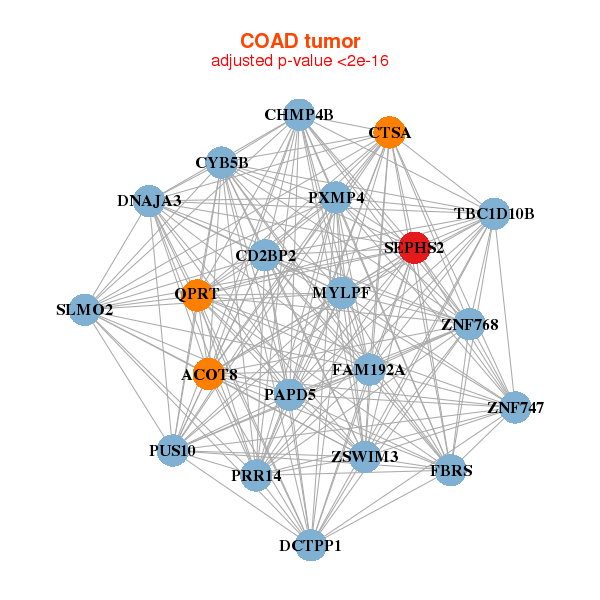
| * Co-Expression network figures were drawn using R package igraph. Only the top 20 genes with the highest correlations were shown. Red circle: input gene, orange circle: cell metabolism gene, sky circle: other gene |
: Open all plots for all cancer types
 |
|
| ALDOA,ALG1,BCKDK,KNOP1,CD2BP2,CLN3,DCTPP1, DNAJA3,EARS2,FAHD1,HN1L,MAPK3,NDUFAB1,POLR3K, PPP4C,RNF40,SEPHS2,USP7,ZNF747,ZNF764,ZNF768 | ACSS1,APOF,ASCL2,ATP6AP1,ATP6V1H,C2orf54,RHPN1-AS1, CALML5,CYP4F2,FAM110A,GALNTL6,HMX2,KLHL35,CERS4, MAPK8IP2,PDCL3,PYY,SLC50A1,SEPHS2,SLC7A13,SQLE |
 |
|
| ACOT8,CD2BP2,CHMP4B,CTSA,CYB5B,DCTPP1,DNAJA3, FAM192A,FBRS,MYLPF,PAPD5,PRR14,PUS10,PXMP4, QPRT,SEPHS2,SLMO2,TBC1D10B,ZNF747,ZNF768,ZSWIM3 | ABHD12,ACSL5,ANKS4B,LINC00483,LRRC75A,C1orf115,CLRN3, DCAF11,DHRS11,ESPN,FMO4,GDPD2,LOC151534,NGEF, RAB17,SEPHS2,SLC9A3R1,SULT1A2,TMBIM6,TOM1,USH1C |
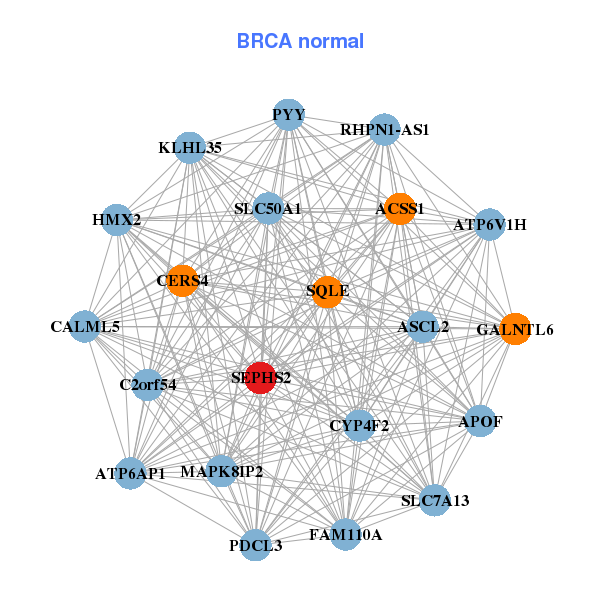
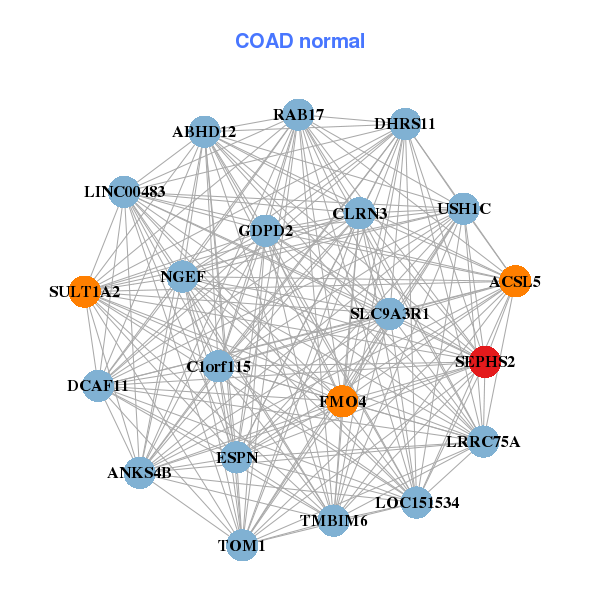
| * Co-Expression network figures were drawn using R package igraph. Only the top 20 genes with the highest correlations were shown. Red circle: input gene, orange circle: cell metabolism gene, sky circle: other gene |
: Open all plots for all cancer types
| Top |
: Open all interacting genes' information including KEGG pathway for all interacting genes from DAVID
| Top |
| Pharmacological Information for SEPHS2 |
| There's no related Drug. |
| Top |
| Cross referenced IDs for SEPHS2 |
| * We obtained these cross-references from Uniprot database. It covers 150 different DBs, 18 categories. http://www.uniprot.org/help/cross_references_section |
: Open all cross reference information
|
Copyright © 2016-Present - The Univsersity of Texas Health Science Center at Houston @ |