|
|||||||||||||||||||||||||||||||||||||||||||||||||||||||||||||||||||||||||||||||||||||||||||||||||||||||||||||||||||||||||||||||||||||||||||||||||||||||||||||||||||||||||||||||||||||||||||||||||||||||||||||||||||||||||||||||||||||||||||||||||||||||||||||||||||||||||||||||||||||||||||||||||||||||||||||||||||||||||||||||||||||||||||||||||||||||||||||||||||||||||||||||||
| |
| Phenotypic Information (metabolism pathway, cancer, disease, phenome) |
| |
| |
| Gene-Gene Network Information: Co-Expression Network, Interacting Genes & KEGG |
| |
|


| Gene Summary for NT5C2 |
| Top |
| Phenotypic Information for NT5C2(metabolism pathway, cancer, disease, phenome) |
| Cancer | CGAP: NT5C2 |
| Familial Cancer Database: NT5C2 | |
| * This gene is included in those cancer gene databases. |
|
|
|
|
|
|
| |||||||||||||||||||||||||||||||||||||||||||||||||||||||||||||||||||||||||||||||||||||||||||||||||||||||||||||||||||||||||||||||||||||||||||||||||||||||||||||||||||||||||||||||||||||||||||||||||||||||||||||||||||||||||||||||||||||||||||||||||||||||||||||||||||||||||||||||||||||||||||||||||||||||||||||||||||||||||||||||||||||||||||||||||||||||||||||||||||||||||||
Oncogene 1 | Significant driver gene in | ||||||||||||||||||||||||||||||||||||||||||||||||||||||||||||||||||||||||||||||||||||||||||||||||||||||||||||||||||||||||||||||||||||||||||||||||||||||||||||||||||||||||||||||||||||||||||||||||||||||||||||||||||||||||||||||||||||||||||||||||||||||||||||||||||||||||||||||||||||||||||||||||||||||||||||||||||||||||||||||||||||||||||||||||||||||||||||||||||||||||||||||||
| cf) number; DB name 1 Oncogene; http://nar.oxfordjournals.org/content/35/suppl_1/D721.long, 2 Tumor Suppressor gene; https://bioinfo.uth.edu/TSGene/, 3 Cancer Gene Census; http://www.nature.com/nrc/journal/v4/n3/abs/nrc1299.html, 4 CancerGenes; http://nar.oxfordjournals.org/content/35/suppl_1/D721.long, 5 Network of Cancer Gene; http://ncg.kcl.ac.uk/index.php, 1Therapeutic Vulnerabilities in Cancer; http://cbio.mskcc.org/cancergenomics/statius/ |
| KEGG_PURINE_METABOLISM KEGG_PYRIMIDINE_METABOLISM KEGG_NICOTINATE_AND_NICOTINAMIDE_METABOLISM REACTOME_ABACAVIR_TRANSPORT_AND_METABOLISM REACTOME_METABOLISM_OF_NUCLEOTIDES REACTOME_PURINE_METABOLISM | |
| OMIM | |
| Orphanet | |
| Disease | KEGG Disease: NT5C2 |
| MedGen: NT5C2 (Human Medical Genetics with Condition) | |
| ClinVar: NT5C2 | |
| Phenotype | MGI: NT5C2 (International Mouse Phenotyping Consortium) |
| PhenomicDB: NT5C2 | |
| Mutations for NT5C2 |
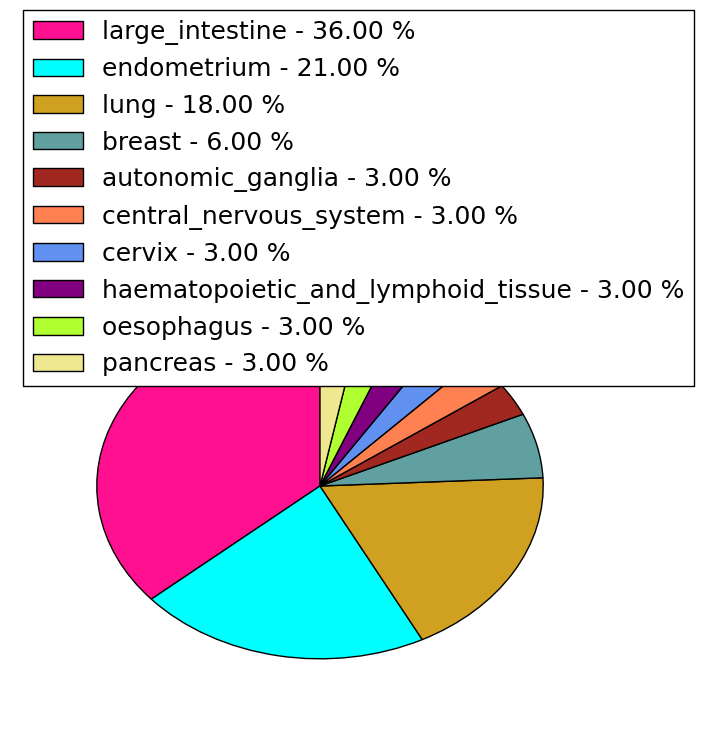
| * Under tables are showing count per each tissue to give us broad intuition about tissue specific mutation patterns.You can go to the detailed page for each mutation database's web site. |
| There's no structural variation information in COSMIC data for this gene. |
| * From mRNA Sanger sequences, Chitars2.0 arranged chimeric transcripts. This table shows NT5C2 related fusion information. |
| ID | Head Gene | Tail Gene | Accession | Gene_a | qStart_a | qEnd_a | Chromosome_a | tStart_a | tEnd_a | Gene_a | qStart_a | qEnd_a | Chromosome_a | tStart_a | tEnd_a |
| BE936930 | NT5C2 | 12 | 139 | 10 | 104879475 | 104879603 | NT5C2 | 136 | 303 | 10 | 104878417 | 104878583 | |
| BE936897 | NT5C2 | 1 | 169 | 10 | 104879430 | 104879603 | NT5C2 | 157 | 368 | 10 | 104878404 | 104878617 | |
| AW008648 | NT5C2 | 1 | 135 | 10 | 104952890 | 104953024 | NT5C2 | 126 | 505 | 10 | 104952285 | 104952664 | |
| BE178418 | NT5C2 | 1 | 305 | 10 | 104879460 | 104879765 | NT5C2 | 301 | 615 | 10 | 104878246 | 104878560 | |
| DA677984 | NT5C2 | 1 | 285 | 10 | 104934614 | 104953029 | SHOC2 | 284 | 579 | 10 | 112723882 | 112724177 | |
| BE178183 | NT5C2 | 16 | 319 | 10 | 104878246 | 104878557 | NT5C2 | 315 | 631 | 10 | 104879448 | 104879765 | |
| Top |
| Mutation type/ Tissue ID | brca | cns | cerv | endome | haematopo | kidn | Lintest | liver | lung | ns | ovary | pancre | prost | skin | stoma | thyro | urina | |||
| Total # sample | 1 | 1 | ||||||||||||||||||
| GAIN (# sample) | ||||||||||||||||||||
| LOSS (# sample) | 1 | 1 |
| cf) Tissue ID; Tissue type (1; Breast, 2; Central_nervous_system, 3; Cervix, 4; Endometrium, 5; Haematopoietic_and_lymphoid_tissue, 6; Kidney, 7; Large_intestine, 8; Liver, 9; Lung, 10; NS, 11; Ovary, 12; Pancreas, 13; Prostate, 14; Skin, 15; Stomach, 16; Thyroid, 17; Urinary_tract) |
| Top |
|
 |
| Top |
| Stat. for Non-Synonymous SNVs (# total SNVs=33) | (# total SNVs=9) |
 |  |
(# total SNVs=0) | (# total SNVs=0) |
| Top |
| * When you move the cursor on each content, you can see more deailed mutation information on the Tooltip. Those are primary_site,primary_histology,mutation(aa),pubmedID. |
| GRCh37 position | Mutation(aa) | Unique sampleID count |
| chr10:104852955-104852955 | p.R367Q | 3 |
| chr10:104934693-104934693 | p.R8Q | 3 |
| chr10:104859732-104859732 | p.R195Q | 2 |
| chr10:104866378-104866378 | p.L87L | 2 |
| chr10:104851364-104851364 | p.E390K | 2 |
| chr10:104866428-104866428 | p.E71K | 2 |
| chr10:104854184-104854184 | p.S281F | 2 |
| chr10:104850451-104850451 | p.R456C | 1 |
| chr10:104865481-104865481 | p.G124A | 1 |
| chr10:104852930-104852930 | p.L375L | 1 |
| Top |
|
 |
| Point Mutation/ Tissue ID | 1 | 2 | 3 | 4 | 5 | 6 | 7 | 8 | 9 | 10 | 11 | 12 | 13 | 14 | 15 | 16 | 17 | 18 | 19 | 20 |
| # sample | 2 | 1 | 12 | 1 | 1 | 4 | 1 | 3 | 6 | 8 | ||||||||||
| # mutation | 2 | 1 | 13 | 1 | 1 | 4 | 1 | 3 | 7 | 10 | ||||||||||
| nonsynonymous SNV | 2 | 1 | 8 | 1 | 4 | 1 | 3 | 7 | 7 | |||||||||||
| synonymous SNV | 5 | 1 | 3 |
| cf) Tissue ID; Tissue type (1; BLCA[Bladder Urothelial Carcinoma], 2; BRCA[Breast invasive carcinoma], 3; CESC[Cervical squamous cell carcinoma and endocervical adenocarcinoma], 4; COAD[Colon adenocarcinoma], 5; GBM[Glioblastoma multiforme], 6; Glioma Low Grade, 7; HNSC[Head and Neck squamous cell carcinoma], 8; KICH[Kidney Chromophobe], 9; KIRC[Kidney renal clear cell carcinoma], 10; KIRP[Kidney renal papillary cell carcinoma], 11; LAML[Acute Myeloid Leukemia], 12; LUAD[Lung adenocarcinoma], 13; LUSC[Lung squamous cell carcinoma], 14; OV[Ovarian serous cystadenocarcinoma ], 15; PAAD[Pancreatic adenocarcinoma], 16; PRAD[Prostate adenocarcinoma], 17; SKCM[Skin Cutaneous Melanoma], 18:STAD[Stomach adenocarcinoma], 19:THCA[Thyroid carcinoma], 20:UCEC[Uterine Corpus Endometrial Carcinoma]) |
| Top |
| * We represented just top 10 SNVs. When you move the cursor on each content, you can see more deailed mutation information on the Tooltip. Those are primary_site, primary_histology, mutation(aa), pubmedID. |
| Genomic Position | Mutation(aa) | Unique sampleID count |
| chr10:104852955 | p.R367Q,NT5C2 | 3 |
| chr10:104859732 | p.R8Q,NT5C2 | 2 |
| chr10:104851364 | p.R195Q,NT5C2 | 2 |
| chr10:104934693 | p.E390K,NT5C2 | 2 |
| chr10:104850701 | p.L375L,NT5C2 | 1 |
| chr10:104857052 | p.K111Q,NT5C2 | 1 |
| chr10:104849467 | p.T104T,NT5C2 | 1 |
| chr10:104866349 | p.E550K,NT5C2 | 1 |
| chr10:104850727 | p.K361N,NT5C2 | 1 |
| chr10:104858711 | p.T97N,NT5C2 | 1 |
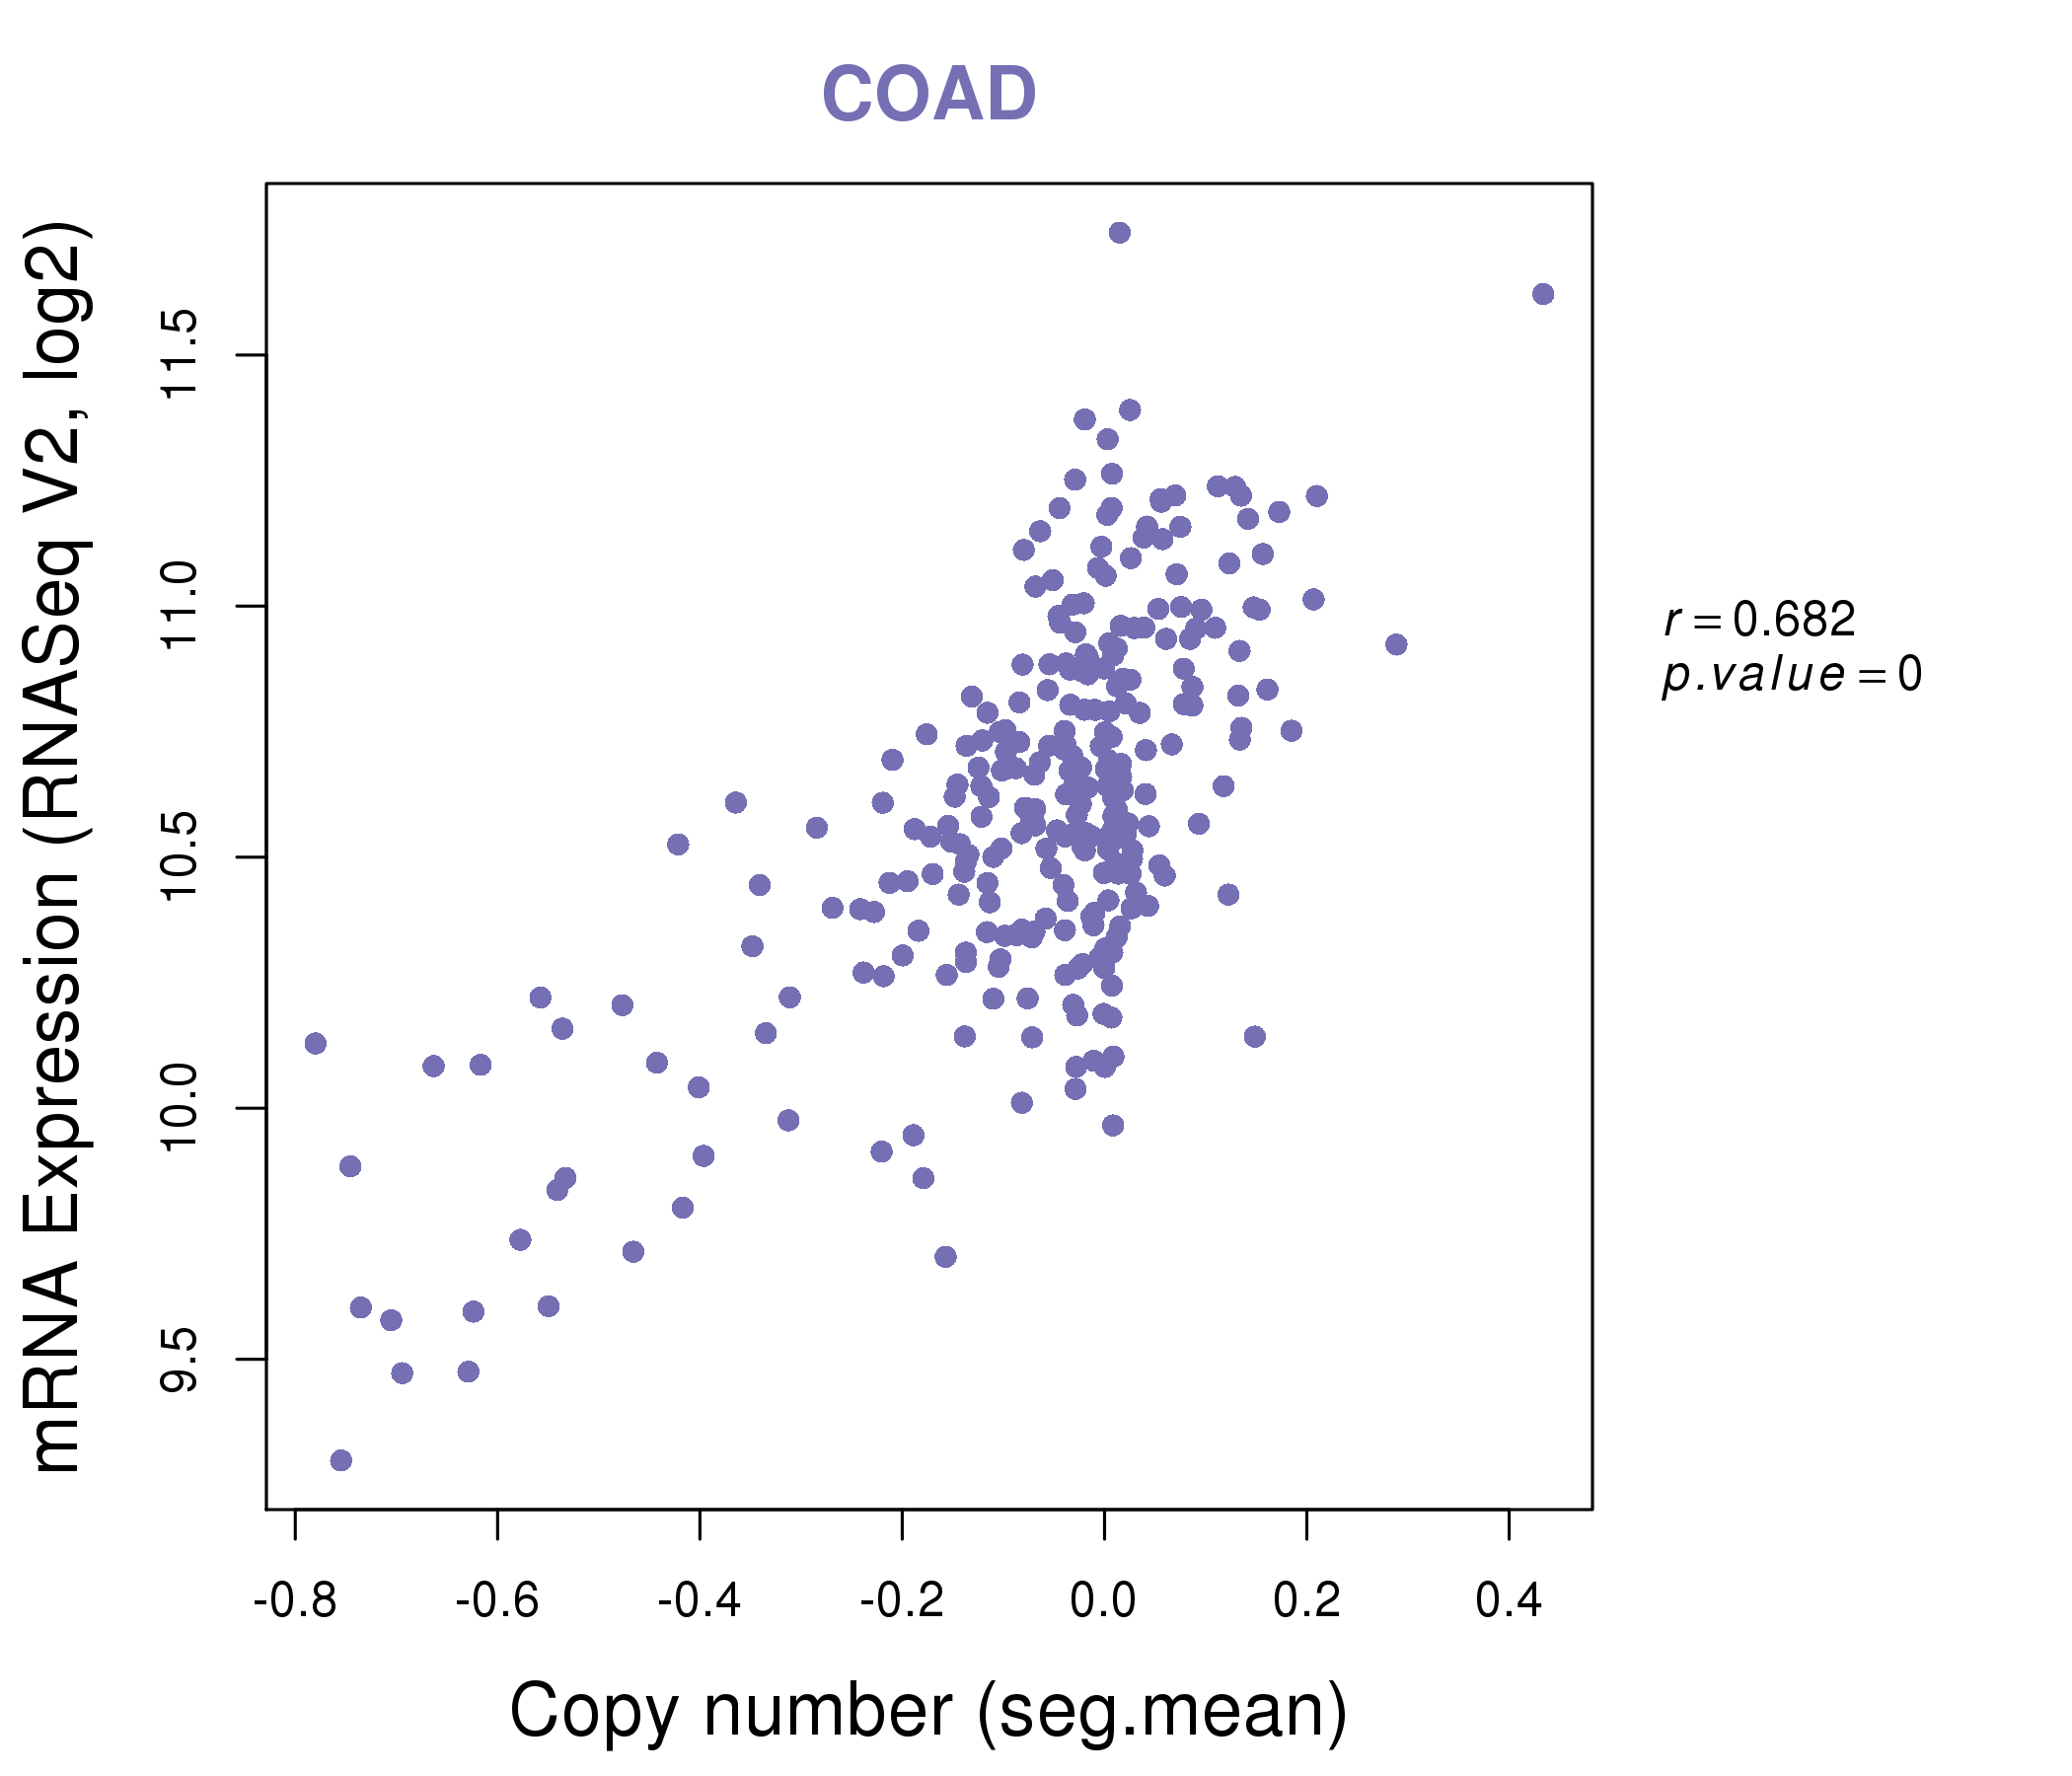
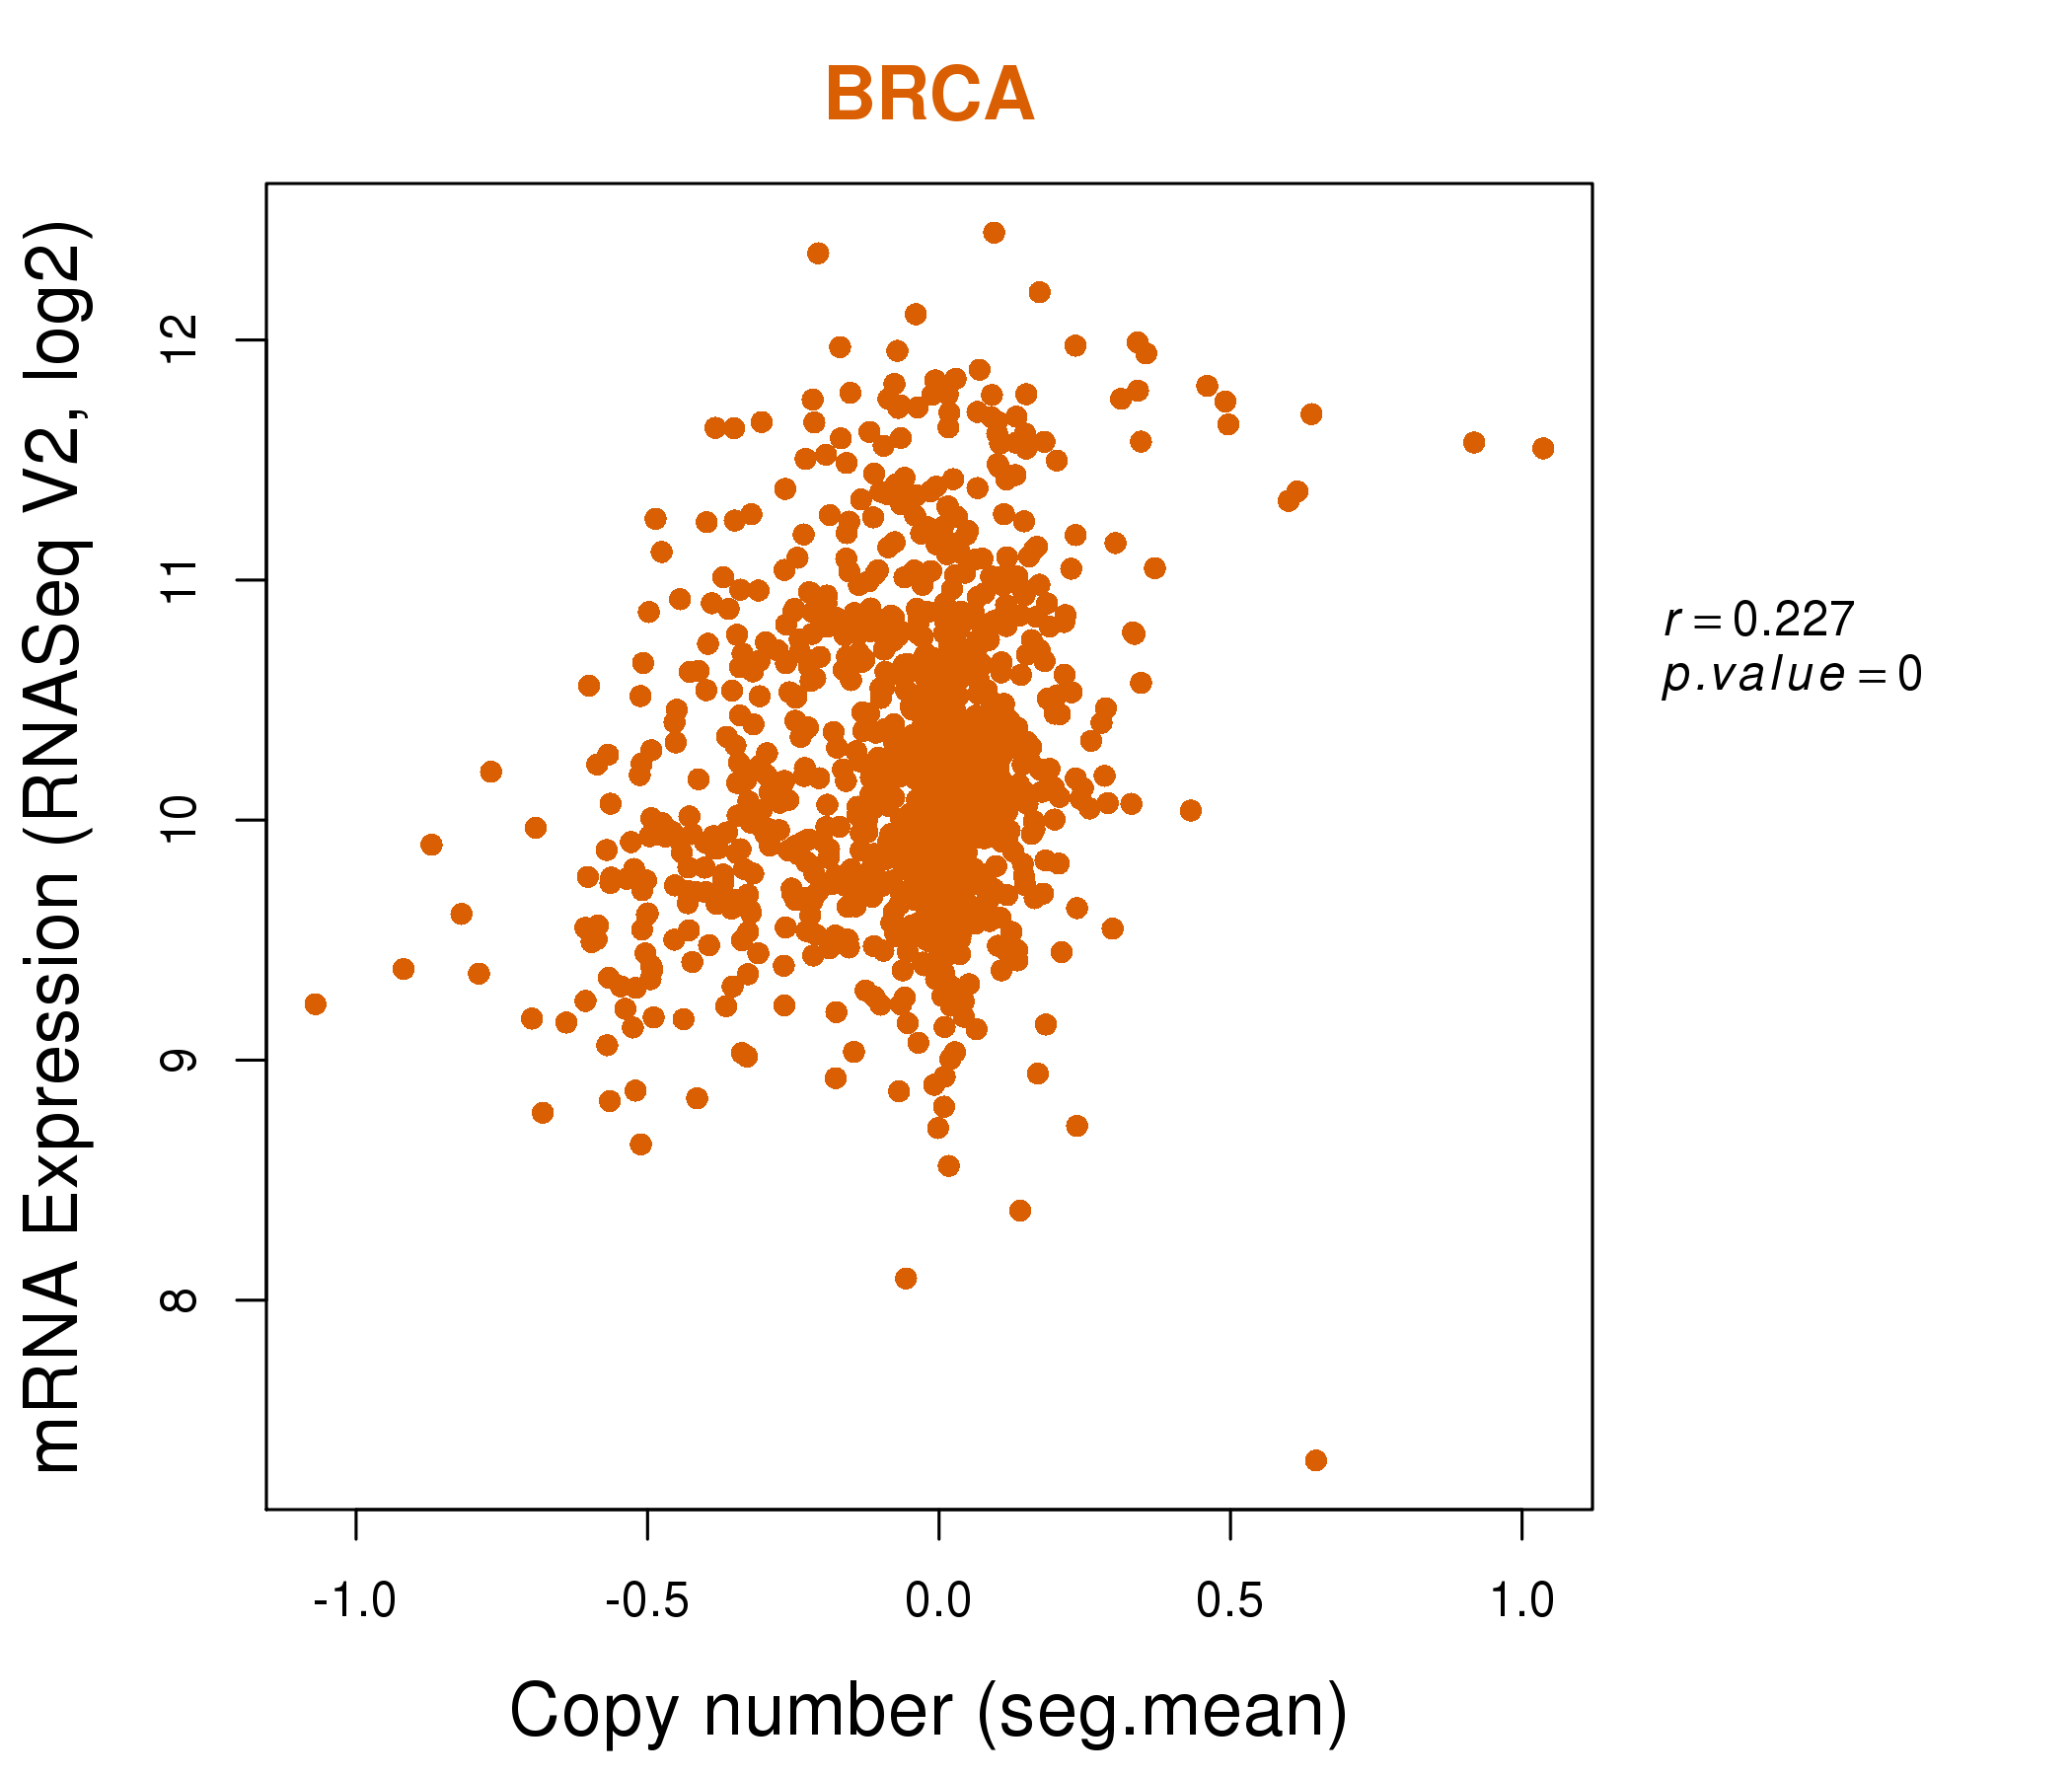
| * Copy number data were extracted from TCGA using R package TCGA-Assembler. The URLs of all public data files on TCGA DCC data server were gathered on Jan-05-2015. Function ProcessCNAData in TCGA-Assembler package was used to obtain gene-level copy number value which is calculated as the average copy number of the genomic region of a gene. |
 |
| cf) Tissue ID[Tissue type]: BLCA[Bladder Urothelial Carcinoma], BRCA[Breast invasive carcinoma], CESC[Cervical squamous cell carcinoma and endocervical adenocarcinoma], COAD[Colon adenocarcinoma], GBM[Glioblastoma multiforme], Glioma Low Grade, HNSC[Head and Neck squamous cell carcinoma], KICH[Kidney Chromophobe], KIRC[Kidney renal clear cell carcinoma], KIRP[Kidney renal papillary cell carcinoma], LAML[Acute Myeloid Leukemia], LUAD[Lung adenocarcinoma], LUSC[Lung squamous cell carcinoma], OV[Ovarian serous cystadenocarcinoma ], PAAD[Pancreatic adenocarcinoma], PRAD[Prostate adenocarcinoma], SKCM[Skin Cutaneous Melanoma], STAD[Stomach adenocarcinoma], THCA[Thyroid carcinoma], UCEC[Uterine Corpus Endometrial Carcinoma] |
| Top |
| Gene Expression for NT5C2 |
| * CCLE gene expression data were extracted from CCLE_Expression_Entrez_2012-10-18.res: Gene-centric RMA-normalized mRNA expression data. |
 |
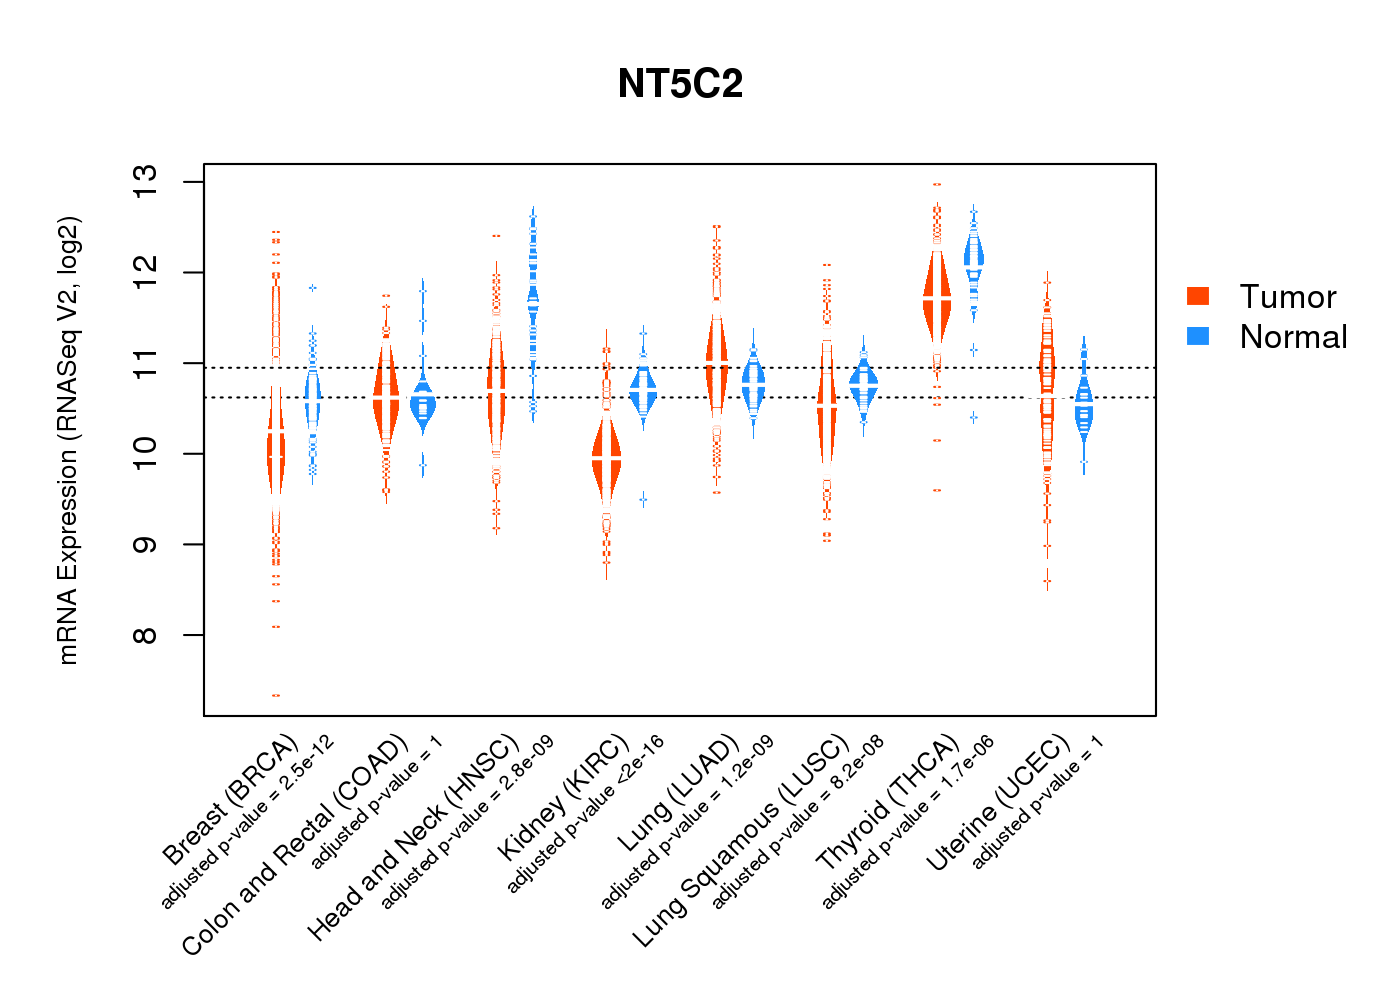
| * Normalized gene expression data of RNASeqV2 was extracted from TCGA using R package TCGA-Assembler. The URLs of all public data files on TCGA DCC data server were gathered at Jan-05-2015. Only eight cancer types have enough normal control samples for differential expression analysis. (t test, adjusted p<0.05 (using Benjamini-Hochberg FDR)) |
 |
| Top |
| * This plots show the correlation between CNV and gene expression. |
: Open all plots for all cancer types
 |
|
 |
|

| Top |
| Gene-Gene Network Information |
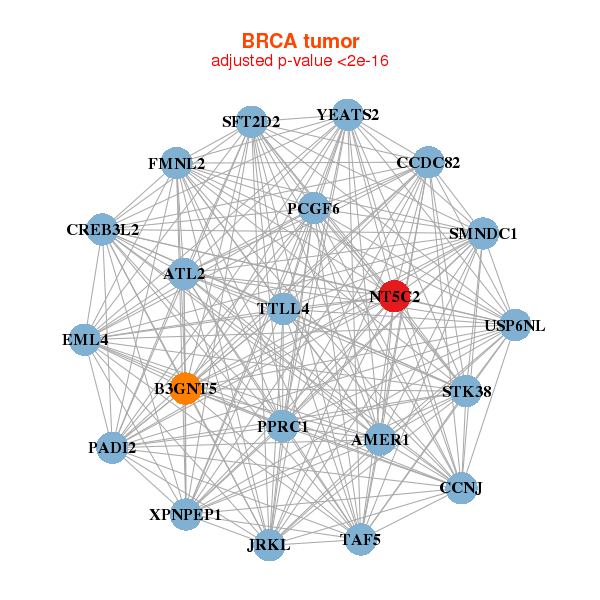
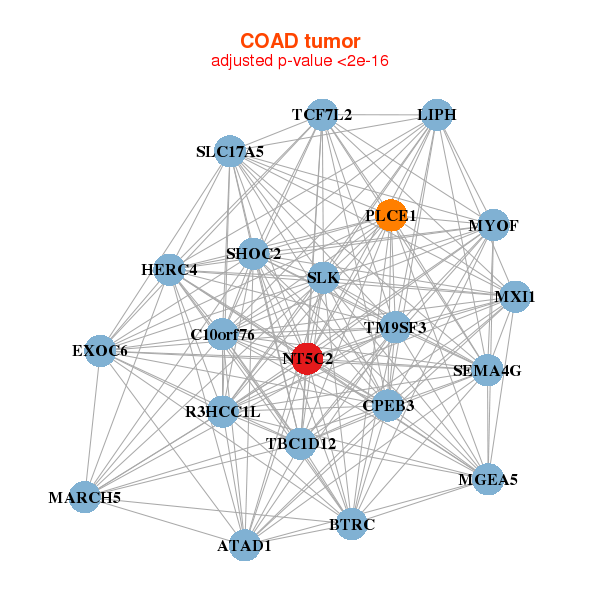
| * Co-Expression network figures were drawn using R package igraph. Only the top 20 genes with the highest correlations were shown. Red circle: input gene, orange circle: cell metabolism gene, sky circle: other gene |
: Open all plots for all cancer types
 |
| ||||
| ATL2,B3GNT5,CCDC82,CCNJ,CREB3L2,EML4,AMER1, FMNL2,JRKL,NT5C2,PADI2,PCGF6,PPRC1,SFT2D2, SMNDC1,STK38,TAF5,TTLL4,USP6NL,XPNPEP1,YEATS2 | ANK3,KANSL2,TRMT13,DYRK1A,FAM160A1,LOC100128640,MTRF1, NAA25,NT5C2,PDE4B,PDE7A,PM20D2,PSTPIP2,RTF1, THAP9,TIAM2,TPP2,USP28,ZBTB43,ZC3H8,ZKSCAN5 | ||||
 |
| ||||
| ATAD1,BTRC,R3HCC1L,C10orf76,CPEB3,EXOC6,HERC4, LIPH,MARCH5,MGEA5,MXI1,MYOF,NT5C2,PLCE1, SEMA4G,SHOC2,SLC17A5,SLK,TBC1D12,TCF7L2,TM9SF3 | ABHD3,ACER3,ACTR2,AHCYL2,B4GALT1,CEACAM1,DHRS9, FAM126B,FEM1C,GPD2,ITCH,MAPRE3,MIER3,NT5C2, RBM47,RNF6,SLC26A3,TMEM65,TMPRSS2,XIAP,YWHAB |
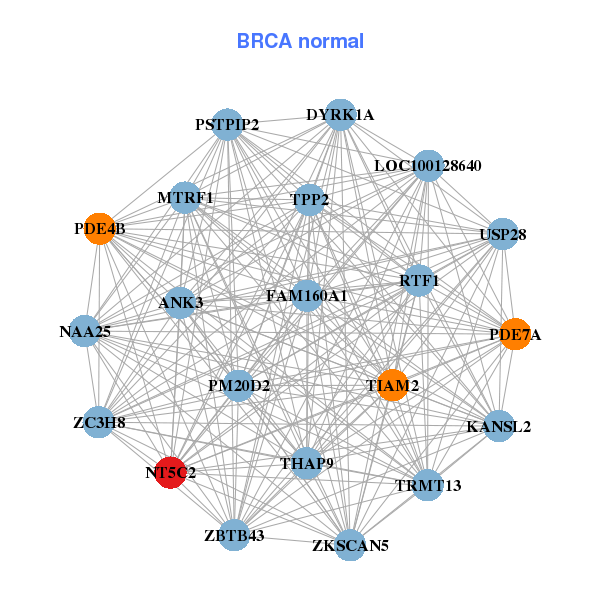
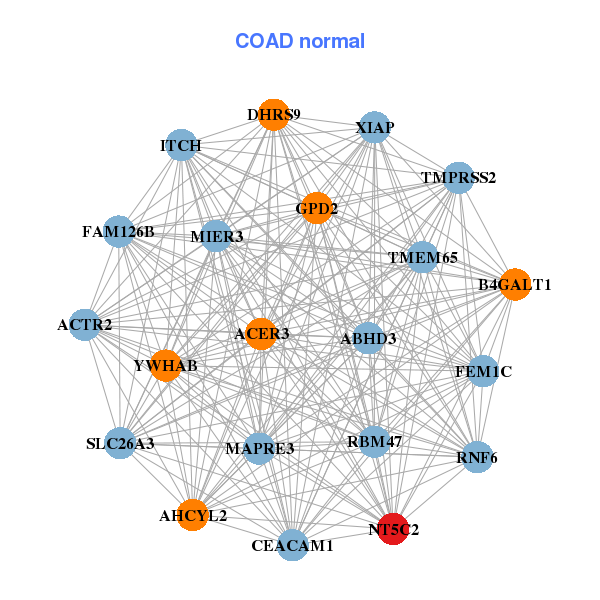
| * Co-Expression network figures were drawn using R package igraph. Only the top 20 genes with the highest correlations were shown. Red circle: input gene, orange circle: cell metabolism gene, sky circle: other gene |
: Open all plots for all cancer types
| Top |
: Open all interacting genes' information including KEGG pathway for all interacting genes from DAVID
| Top |
| Pharmacological Information for NT5C2 |
| DB Category | DB Name | DB's ID and Url link |
| * Gene Centered Interaction Network. |
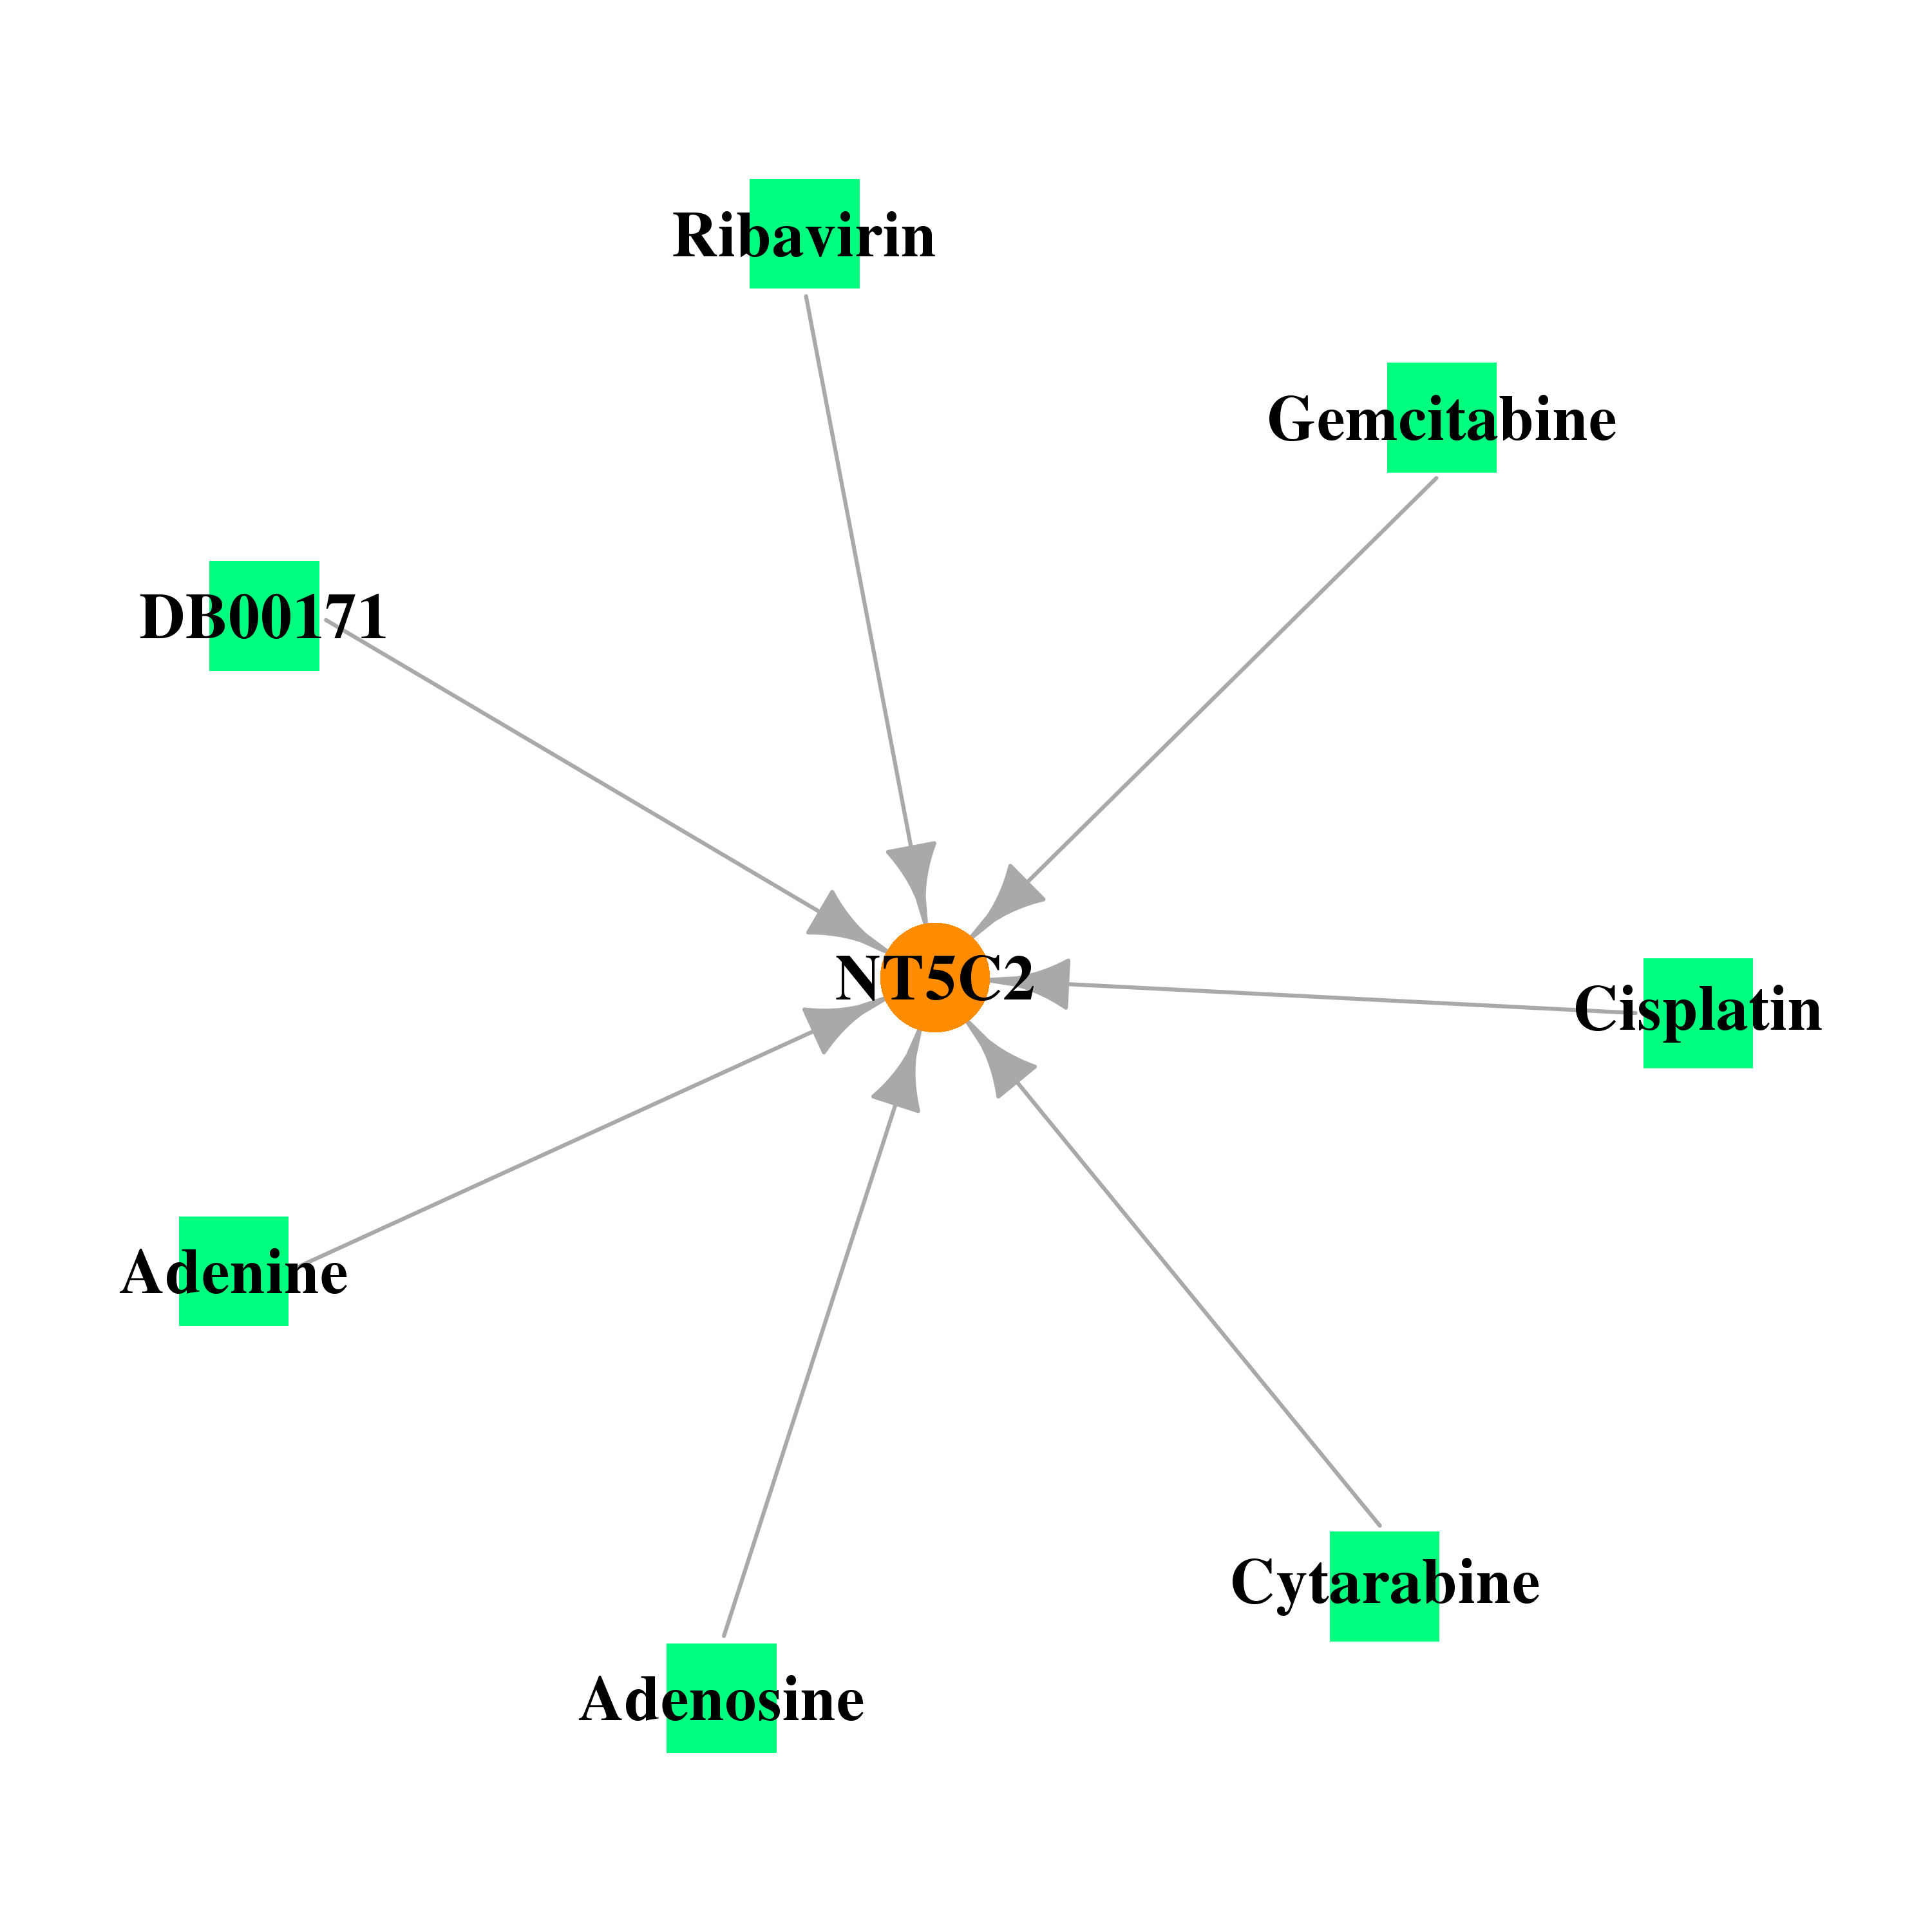 |
| * Drug Centered Interaction Network. |
| DrugBank ID | Target Name | Drug Groups | Generic Name | Drug Centered Network | Drug Structure |
| DB00171 | 5'-nucleotidase, cytosolic II | approved; nutraceutical | Adenosine triphosphate |  |  |
| DB00811 | 5'-nucleotidase, cytosolic II | approved | Ribavirin | 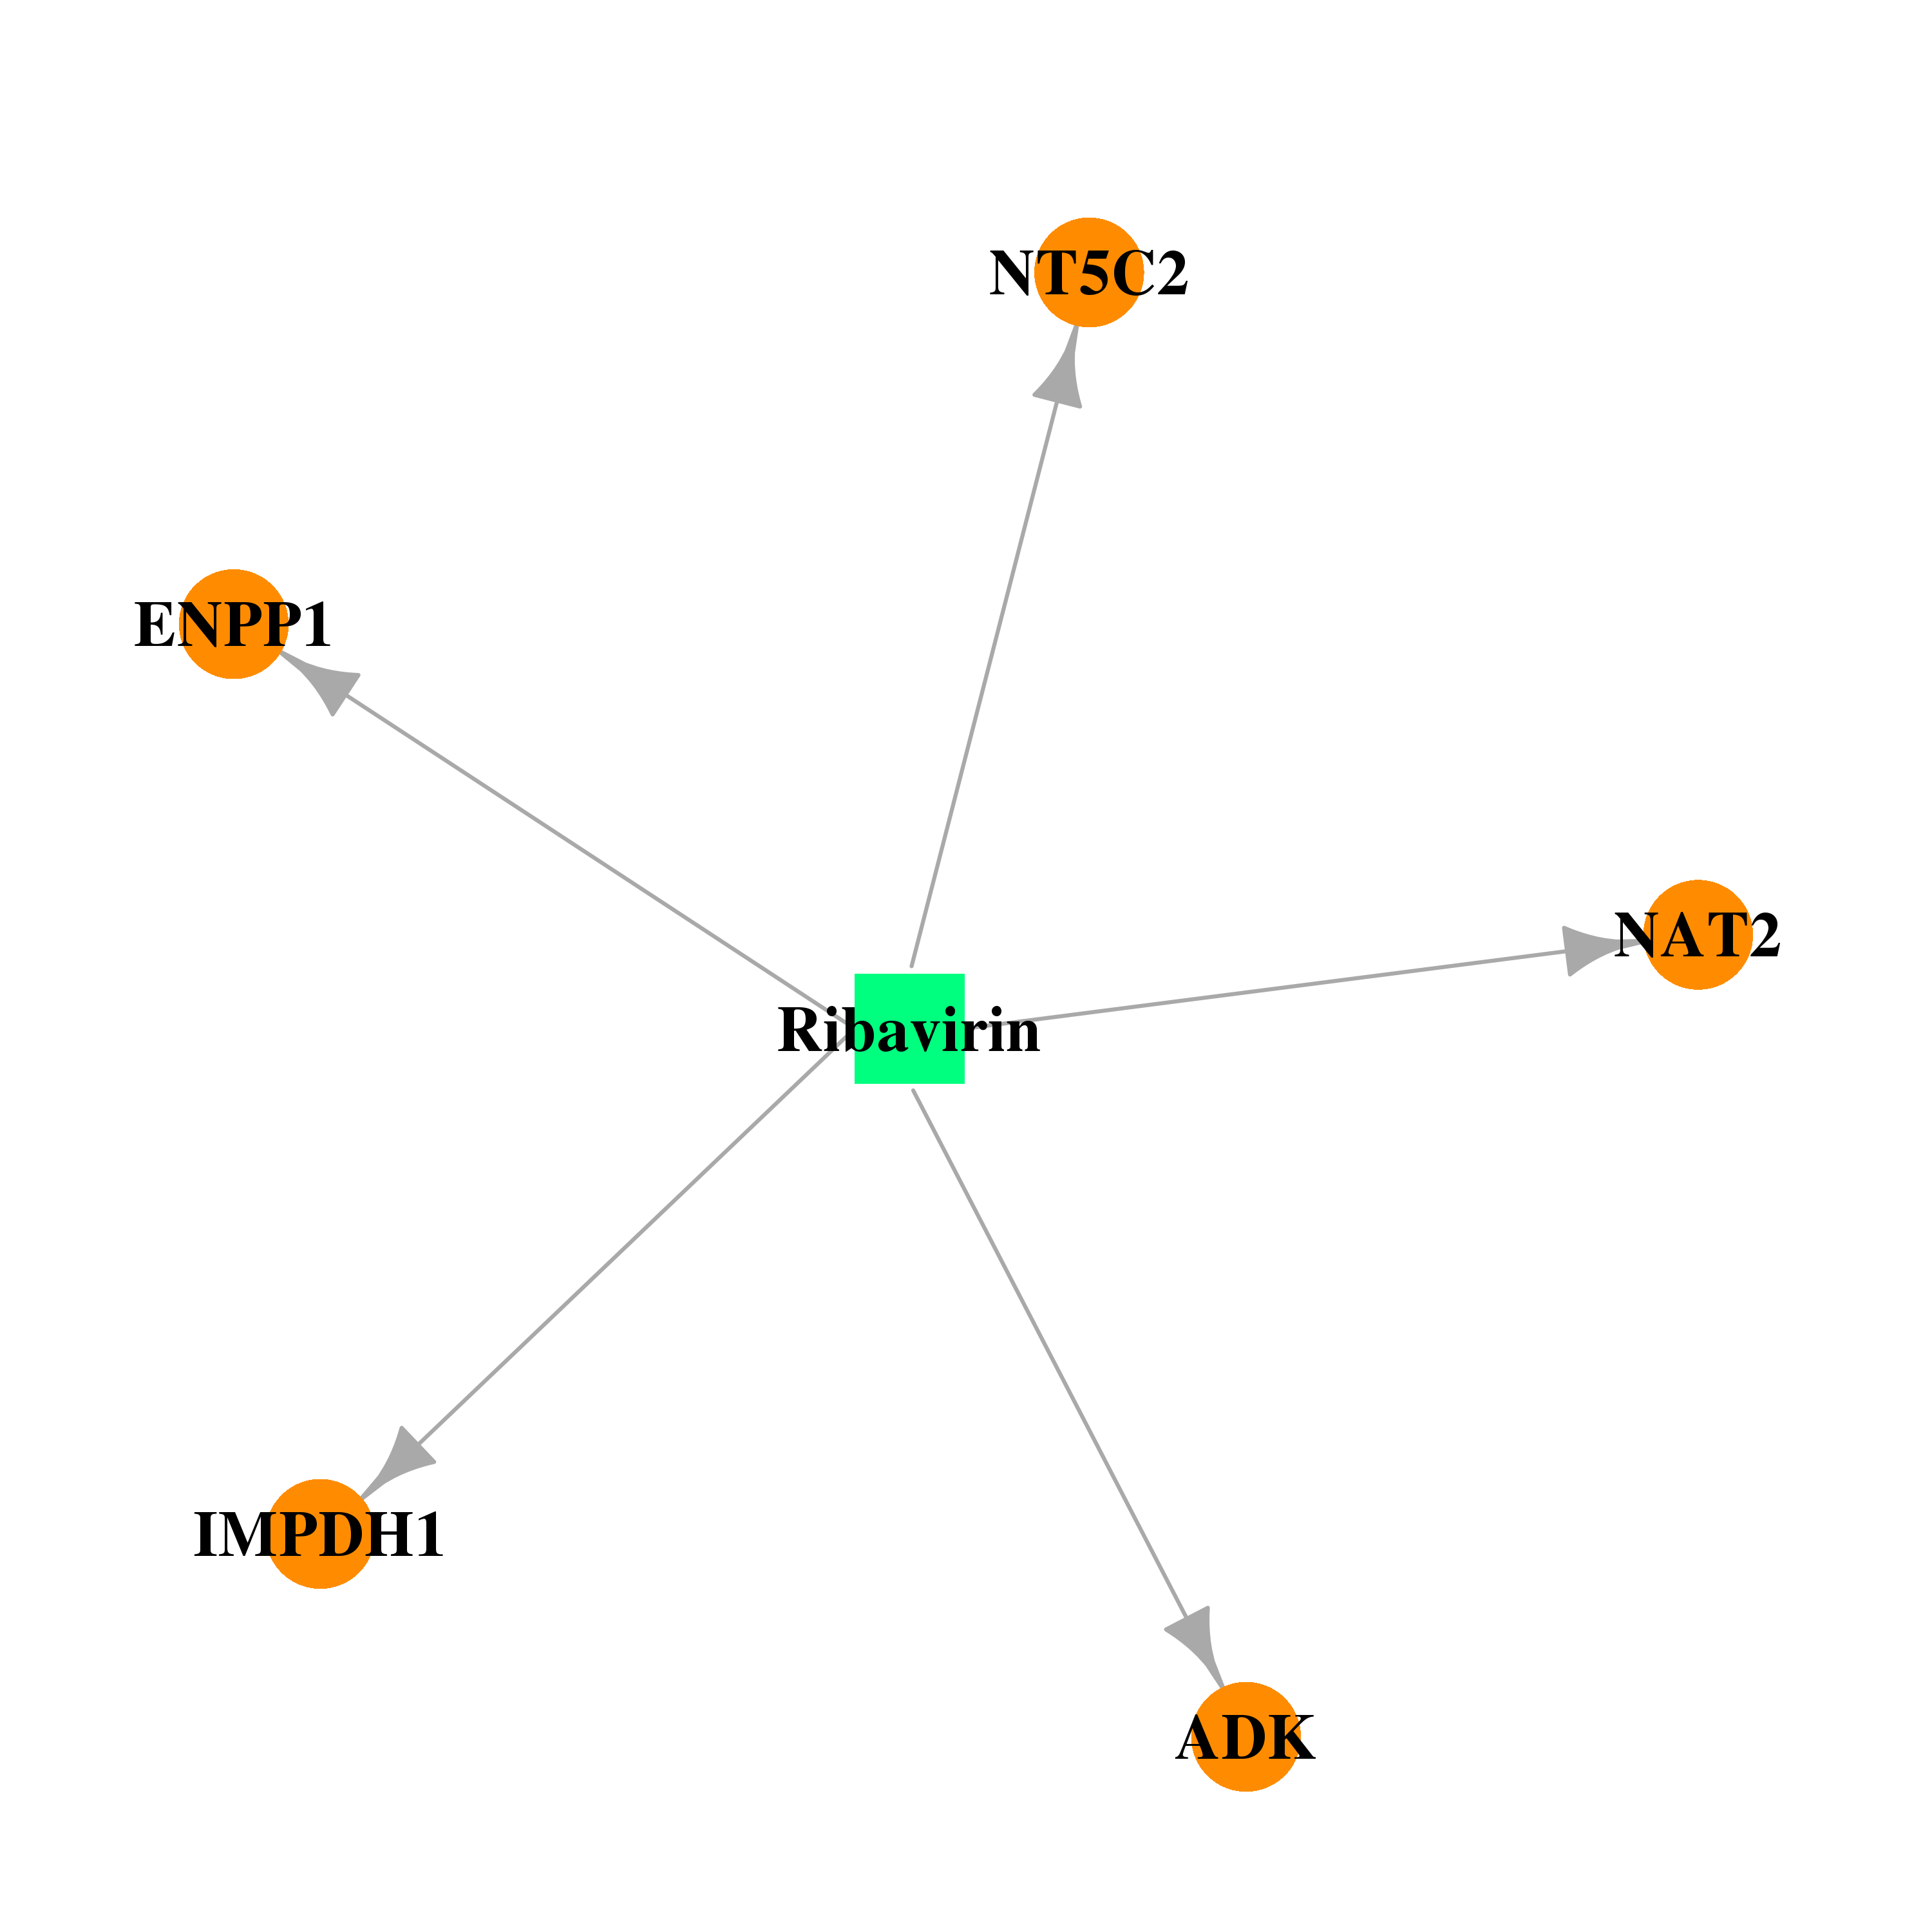 | 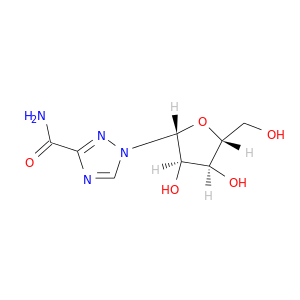 |
| DB00173 | 5'-nucleotidase, cytosolic II | approved; nutraceutical | Adenine | 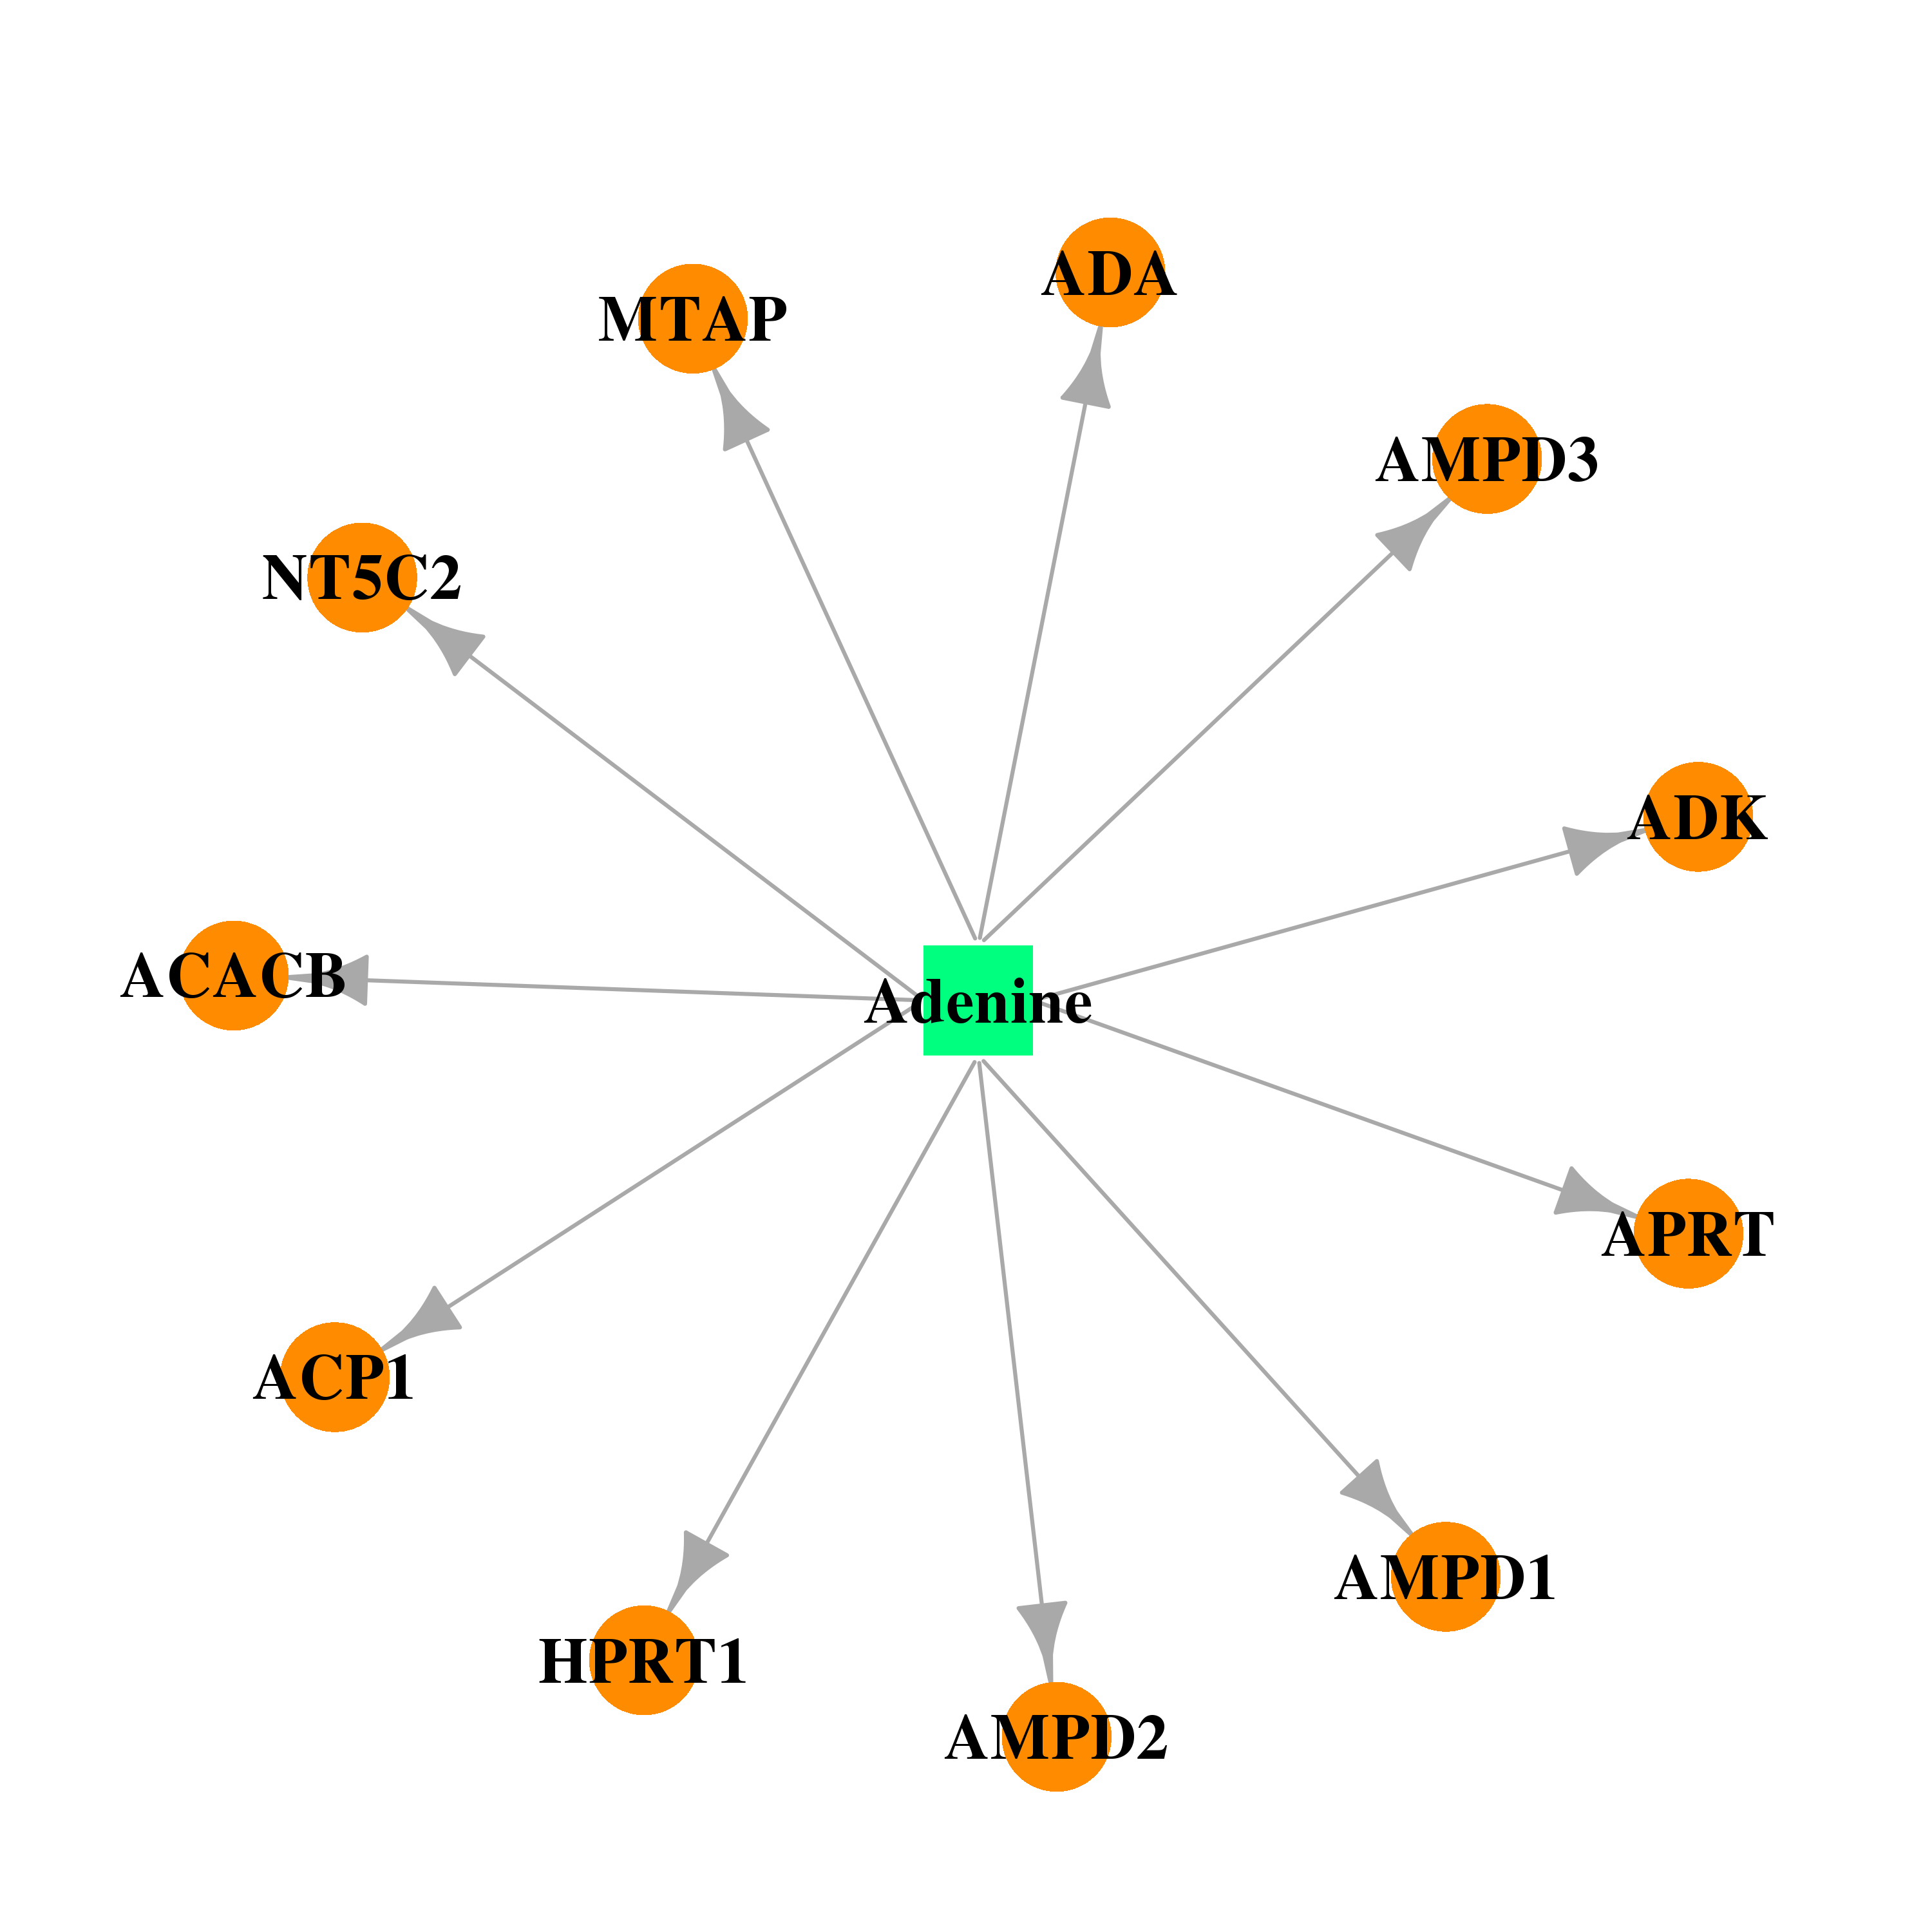 |  |
| DB00515 | 5'-nucleotidase, cytosolic II | approved | Cisplatin |  |  |
| DB00441 | 5'-nucleotidase, cytosolic II | approved | Gemcitabine | 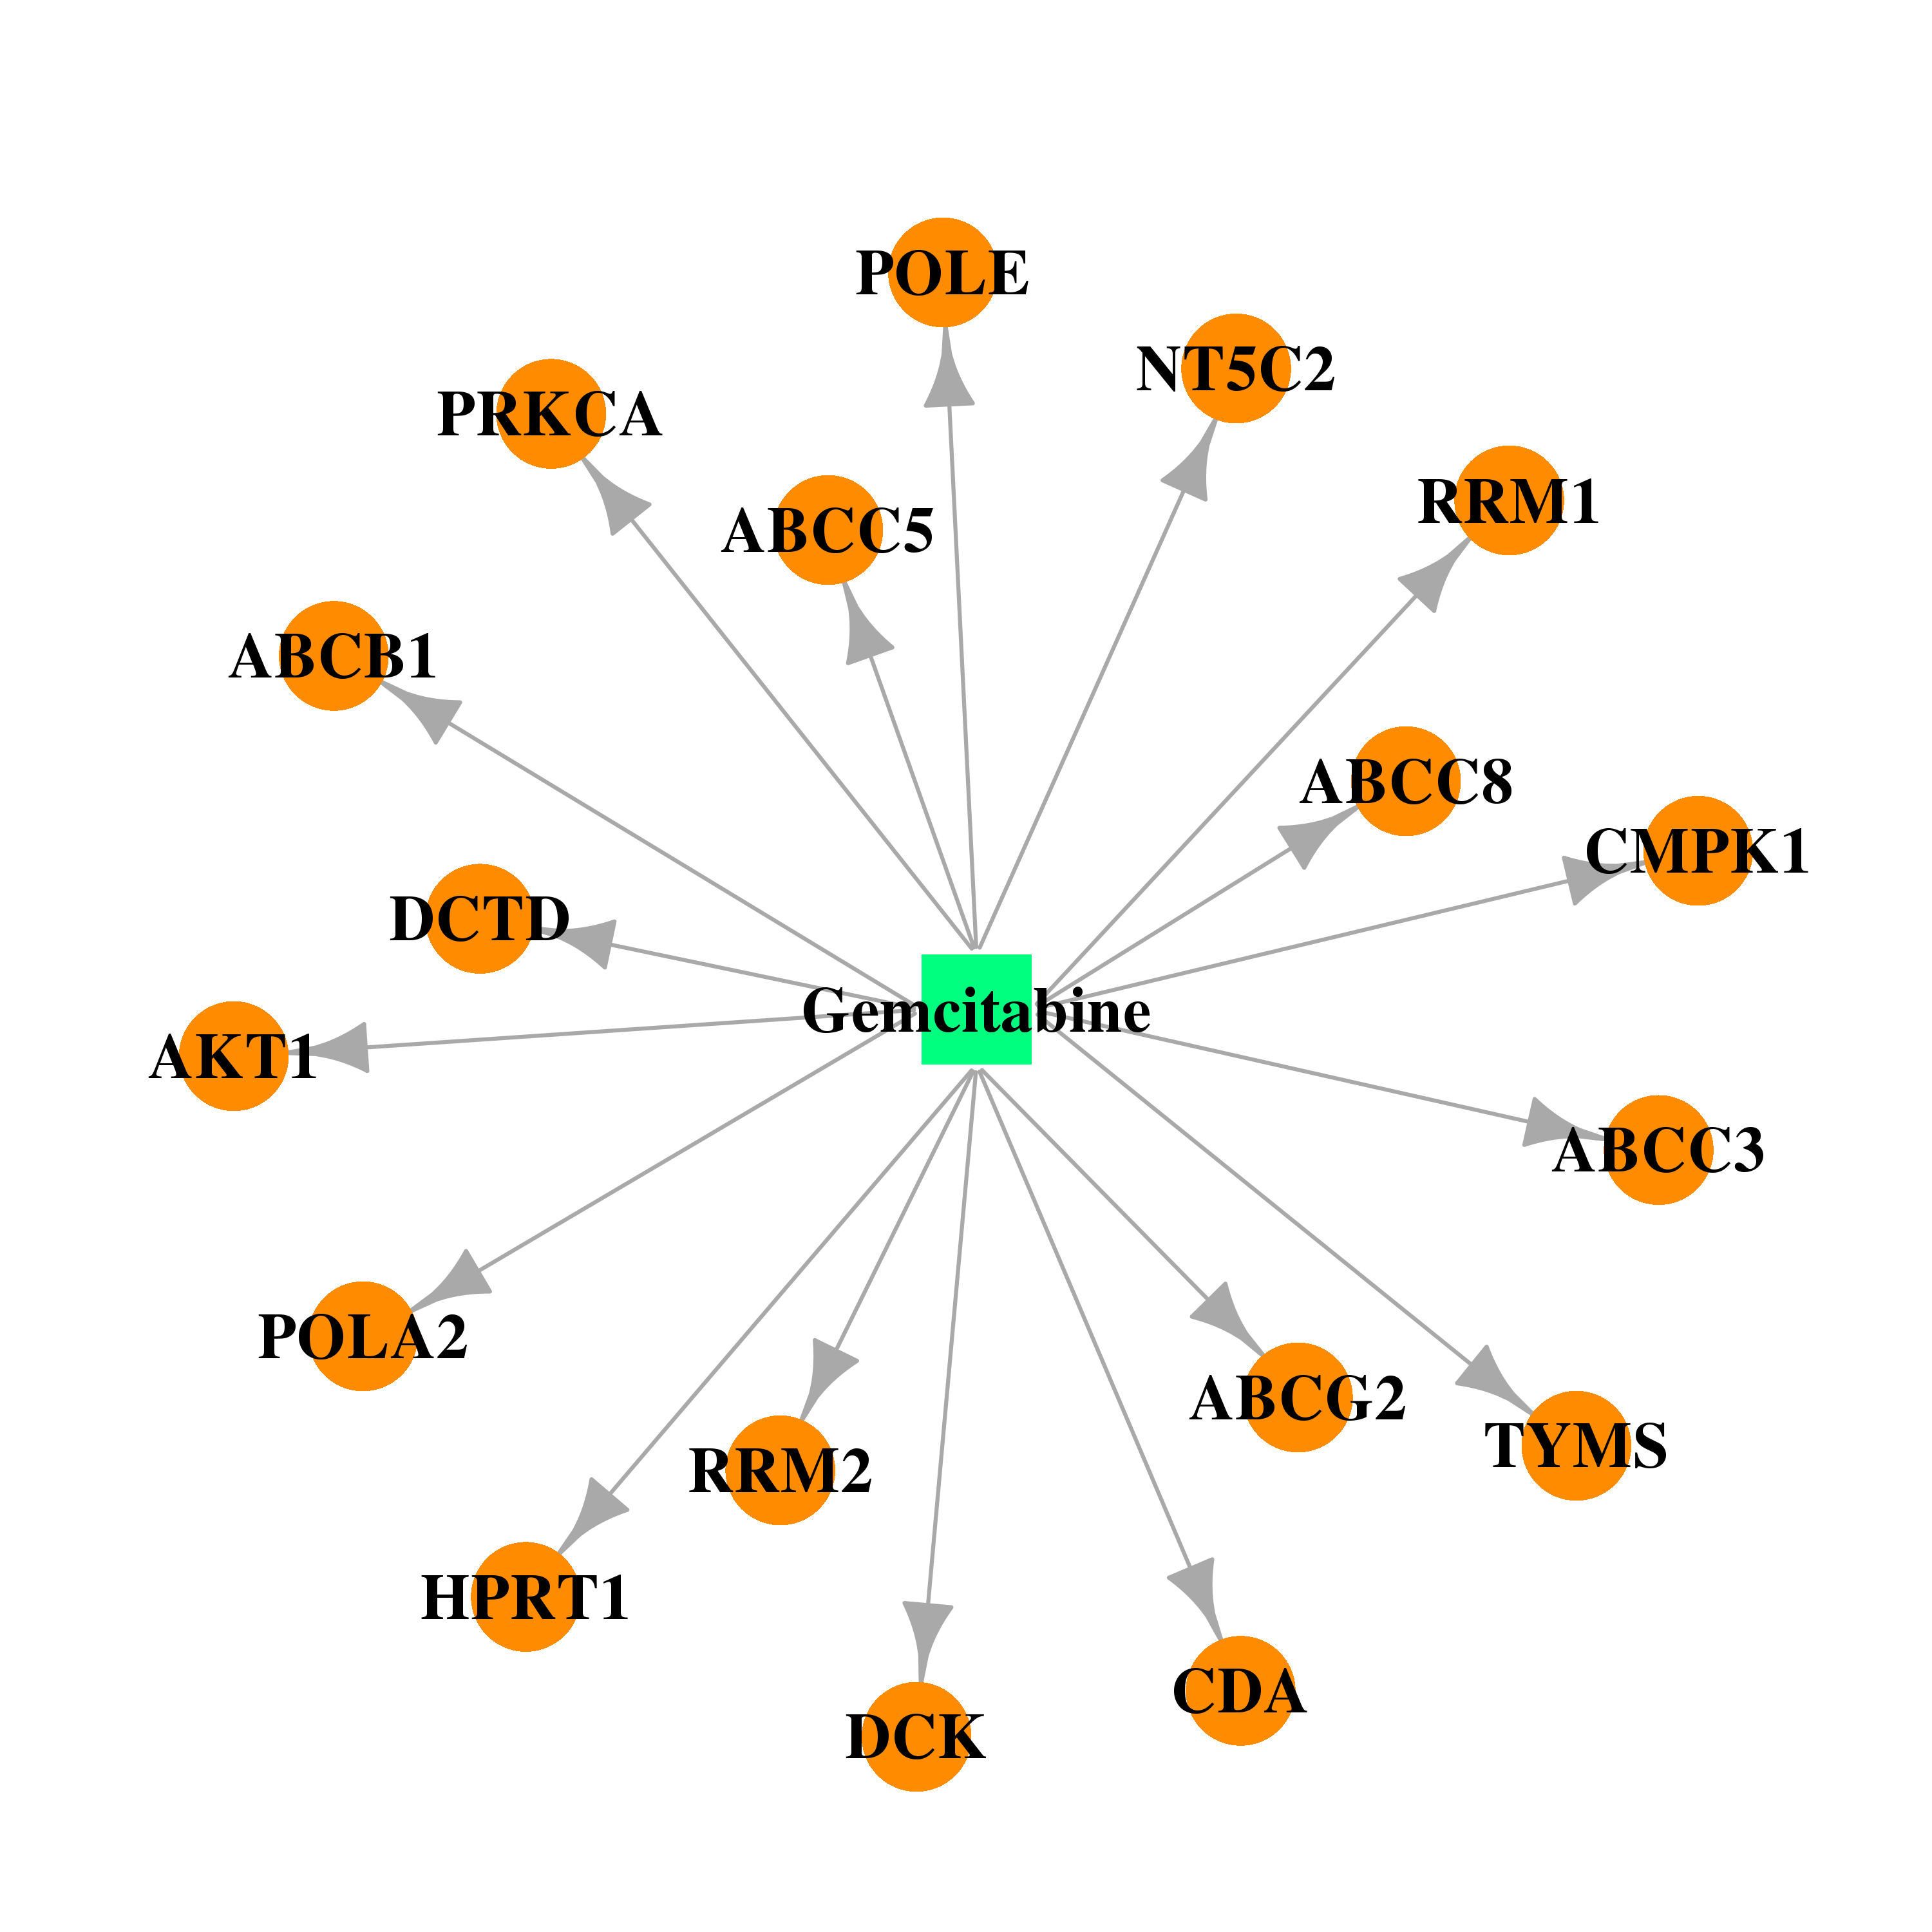 |  |
| DB00987 | 5'-nucleotidase, cytosolic II | approved; investigational | Cytarabine | 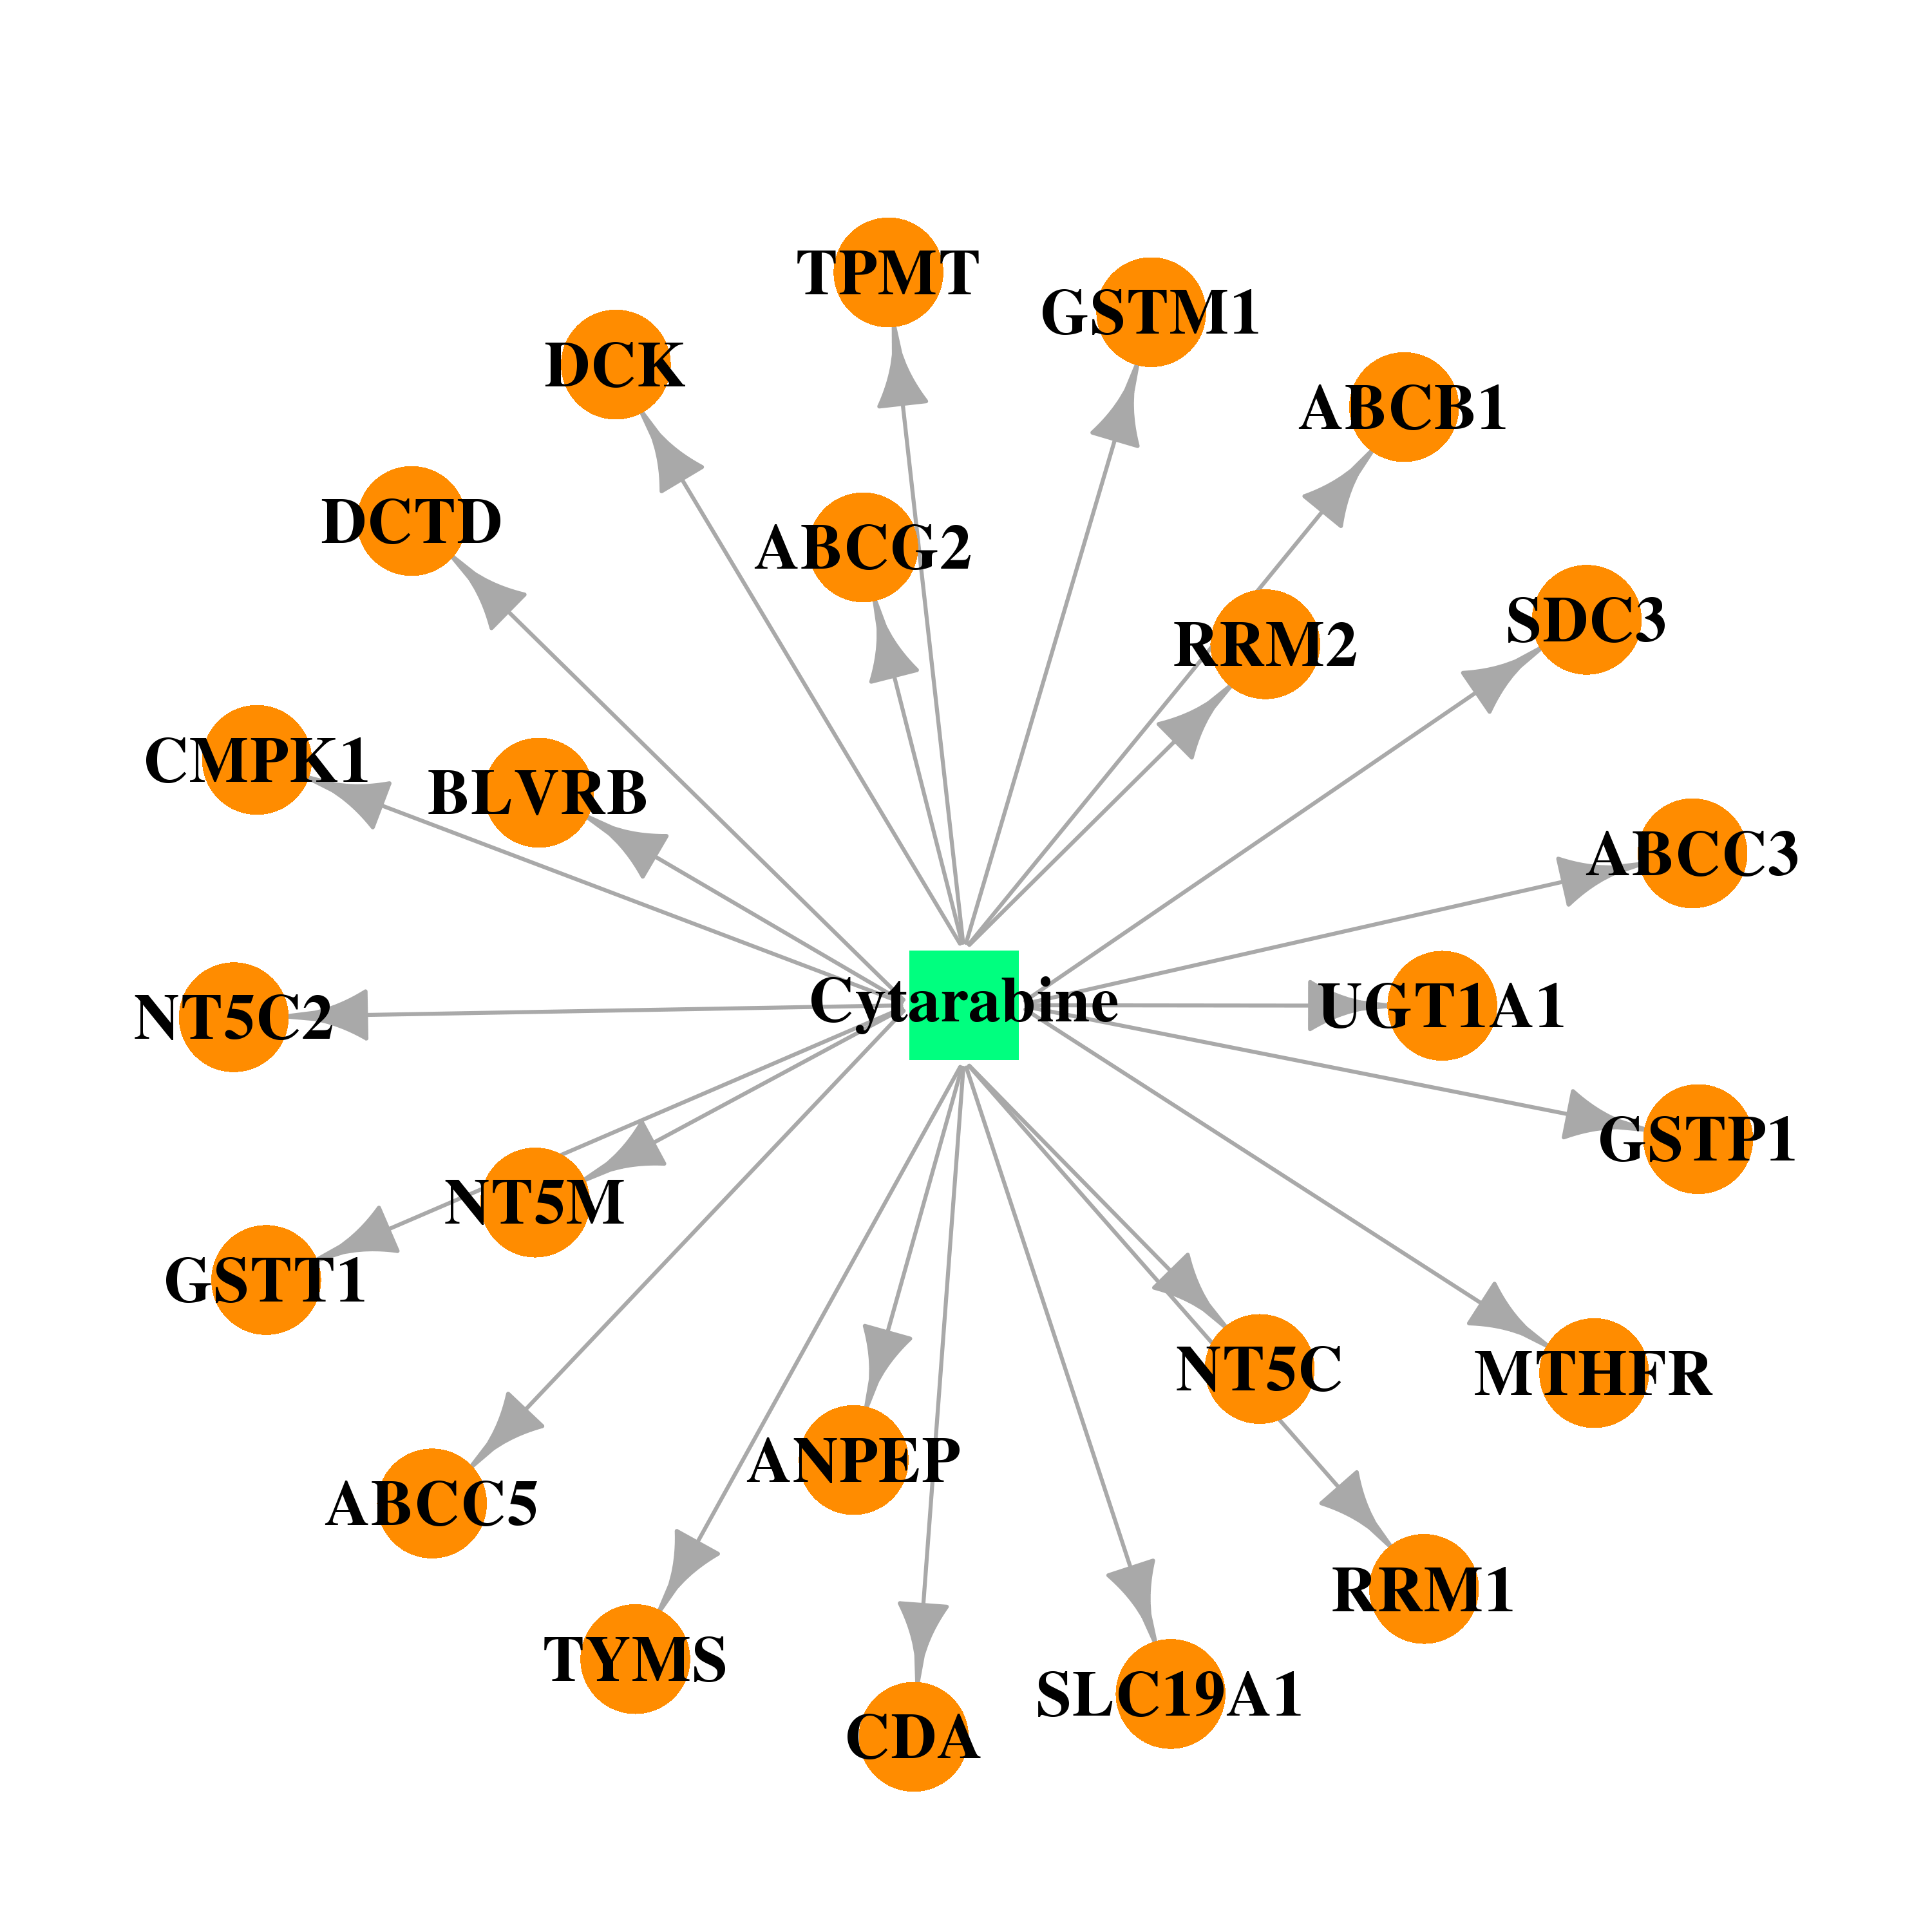 | 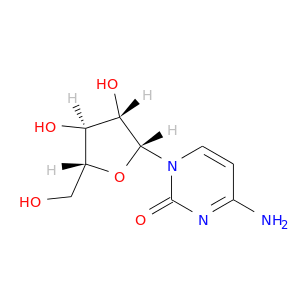 |
| DB00640 | 5'-nucleotidase, cytosolic II | approved; investigational | Adenosine | 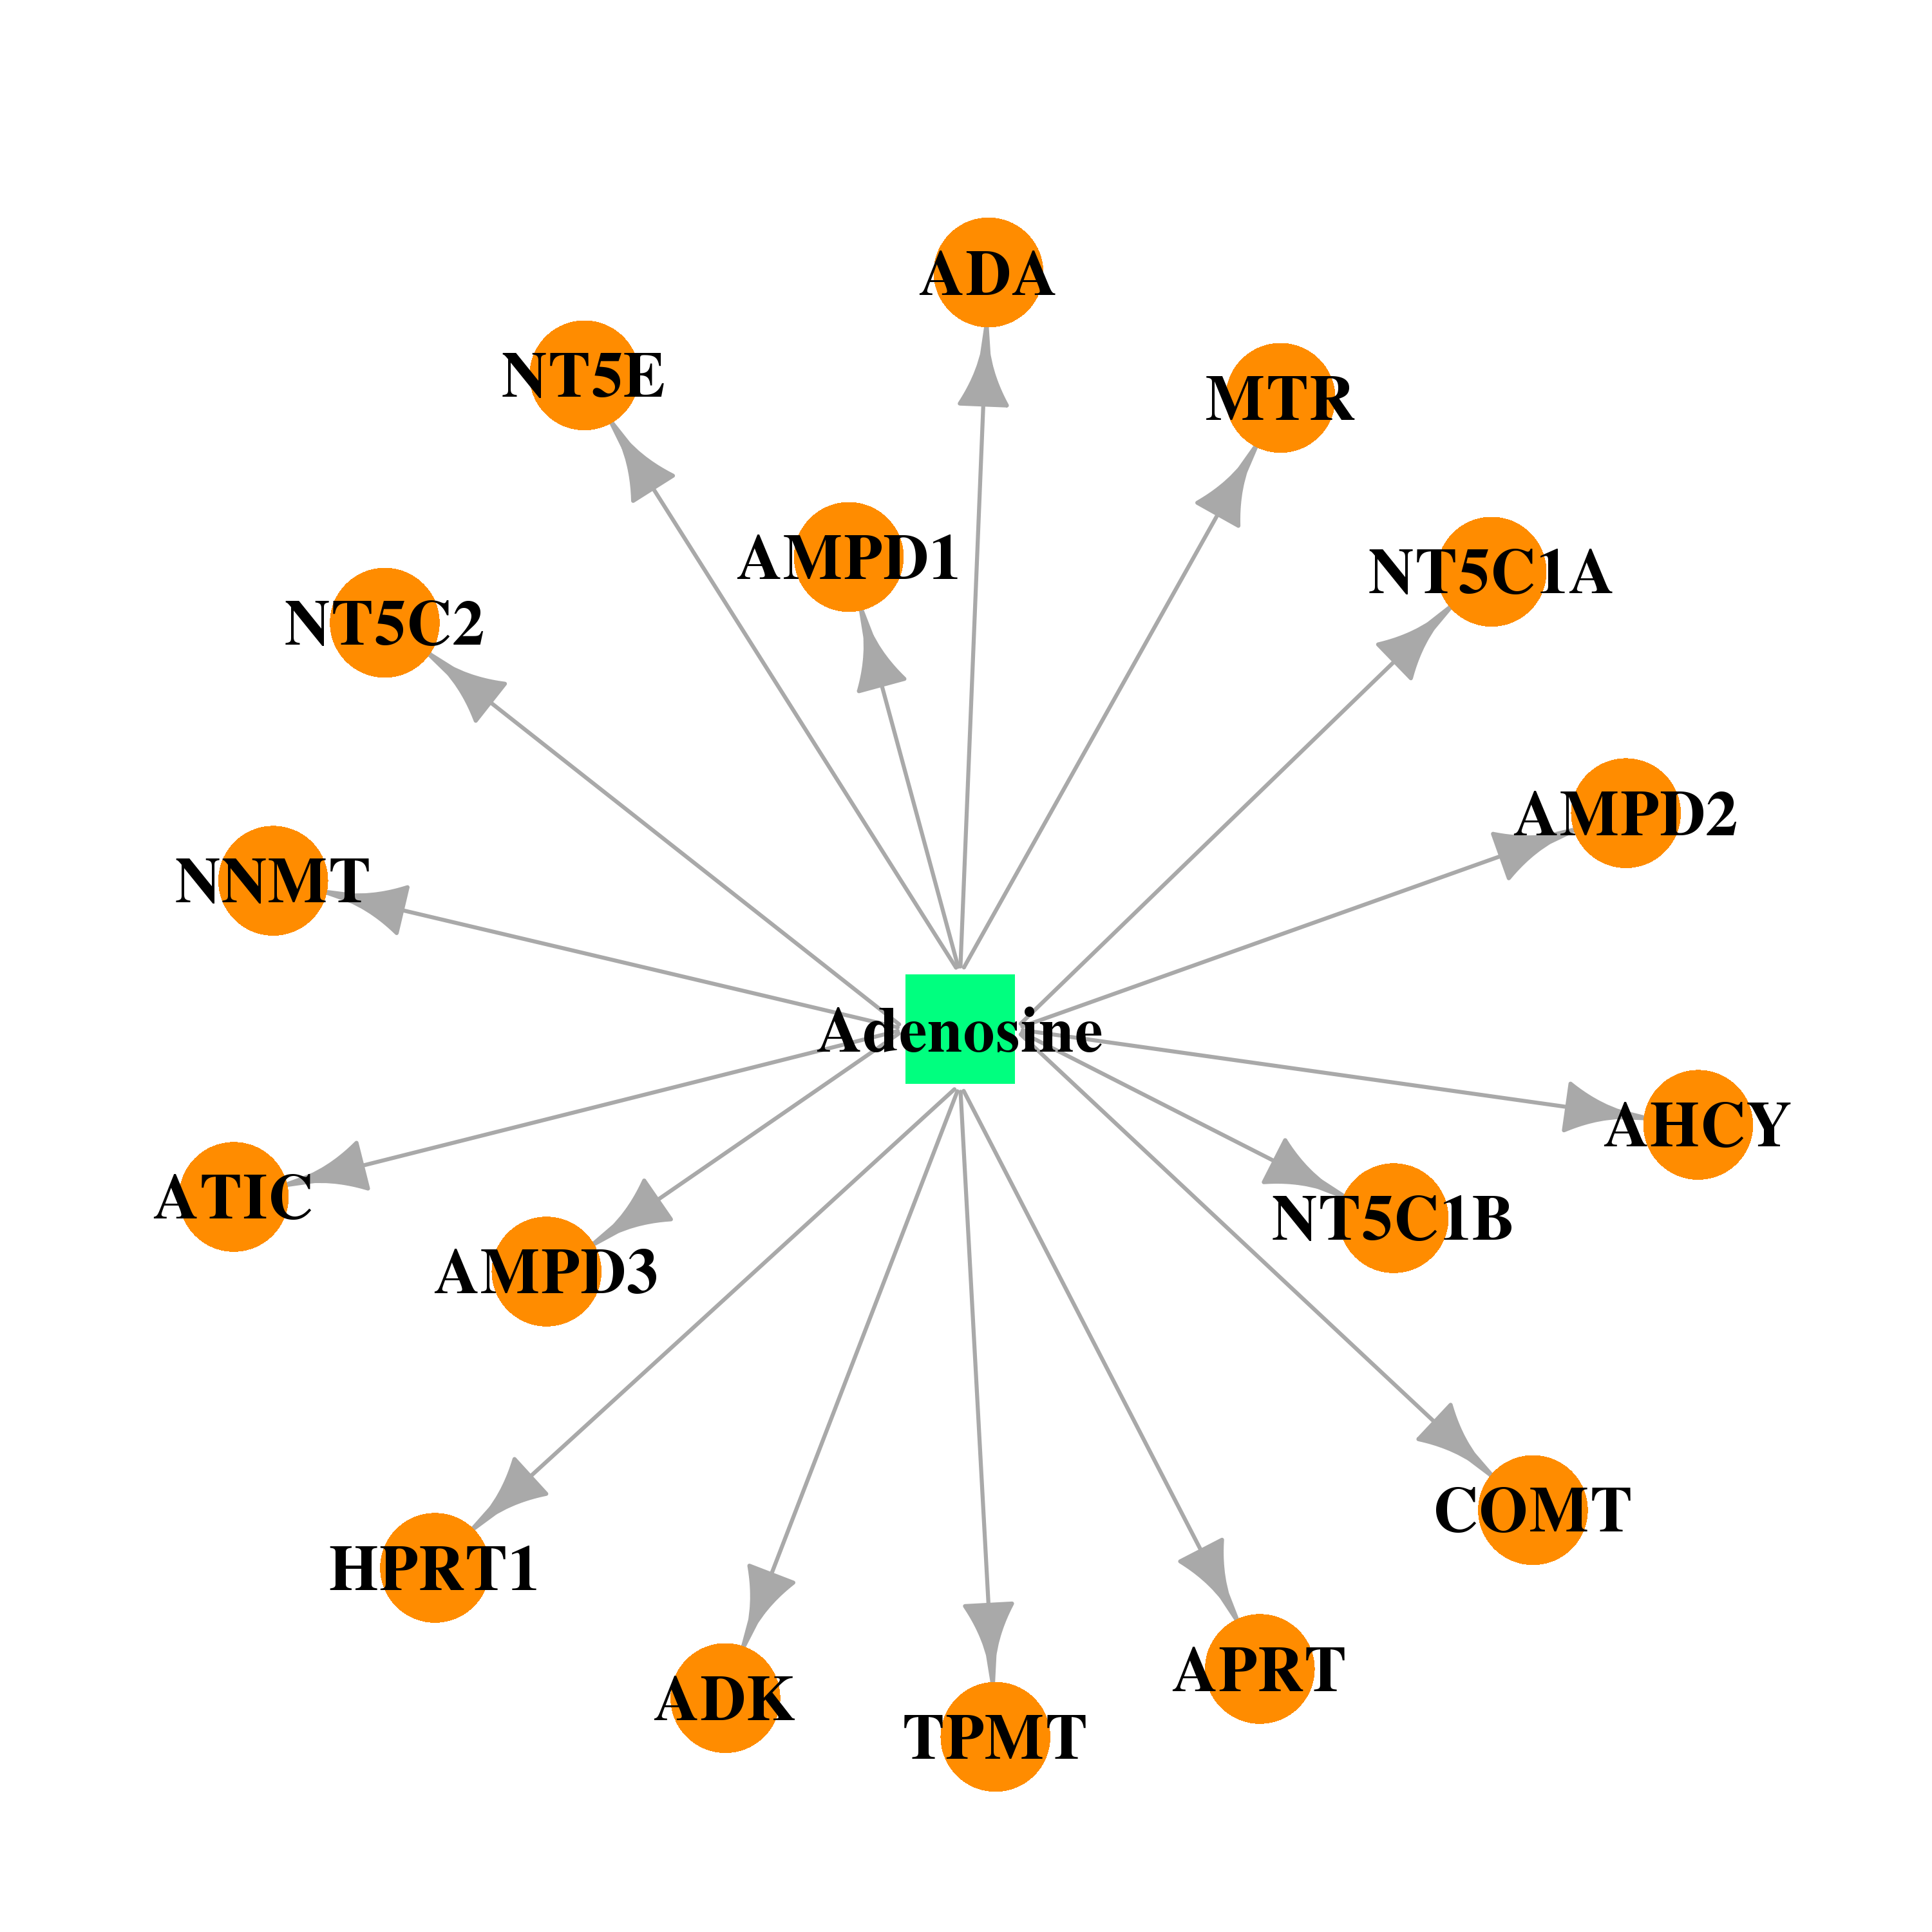 | 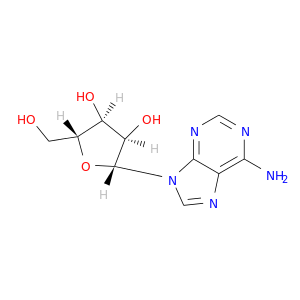 |
| Top |
| Cross referenced IDs for NT5C2 |
| * We obtained these cross-references from Uniprot database. It covers 150 different DBs, 18 categories. http://www.uniprot.org/help/cross_references_section |
: Open all cross reference information
|
Copyright © 2016-Present - The Univsersity of Texas Health Science Center at Houston @ |