|
||||||||||||||||||||
| |
| Phenotypic Information (metabolism pathway, cancer, disease, phenome) |
| |
| |
| Gene-Gene Network Information: Co-Expression Network, Interacting Genes & KEGG |
| |
|


| Gene Summary for EXOSC7 |
| Top |
| Phenotypic Information for EXOSC7(metabolism pathway, cancer, disease, phenome) |
| Cancer | CGAP: EXOSC7 |
| Familial Cancer Database: EXOSC7 | |
| * This gene is included in those cancer gene databases. |
|
|
|
|
|
| . | ||||||||||||||
Oncogene 1 | Significant driver gene in | |||||||||||||||||||
| cf) number; DB name 1 Oncogene; http://nar.oxfordjournals.org/content/35/suppl_1/D721.long, 2 Tumor Suppressor gene; https://bioinfo.uth.edu/TSGene/, 3 Cancer Gene Census; http://www.nature.com/nrc/journal/v4/n3/abs/nrc1299.html, 4 CancerGenes; http://nar.oxfordjournals.org/content/35/suppl_1/D721.long, 5 Network of Cancer Gene; http://ncg.kcl.ac.uk/index.php, 1Therapeutic Vulnerabilities in Cancer; http://cbio.mskcc.org/cancergenomics/statius/ |
| REACTOME_METABOLISM_OF_MRNA REACTOME_METABOLISM_OF_RNA | |
| OMIM | |
| Orphanet | |
| Disease | KEGG Disease: EXOSC7 |
| MedGen: EXOSC7 (Human Medical Genetics with Condition) | |
| ClinVar: EXOSC7 | |
| Phenotype | MGI: EXOSC7 (International Mouse Phenotyping Consortium) |
| PhenomicDB: EXOSC7 | |
| Mutations for EXOSC7 |
| * Under tables are showing count per each tissue to give us broad intuition about tissue specific mutation patterns.You can go to the detailed page for each mutation database's web site. |
| - Statistics for Tissue and Mutation type | Top |
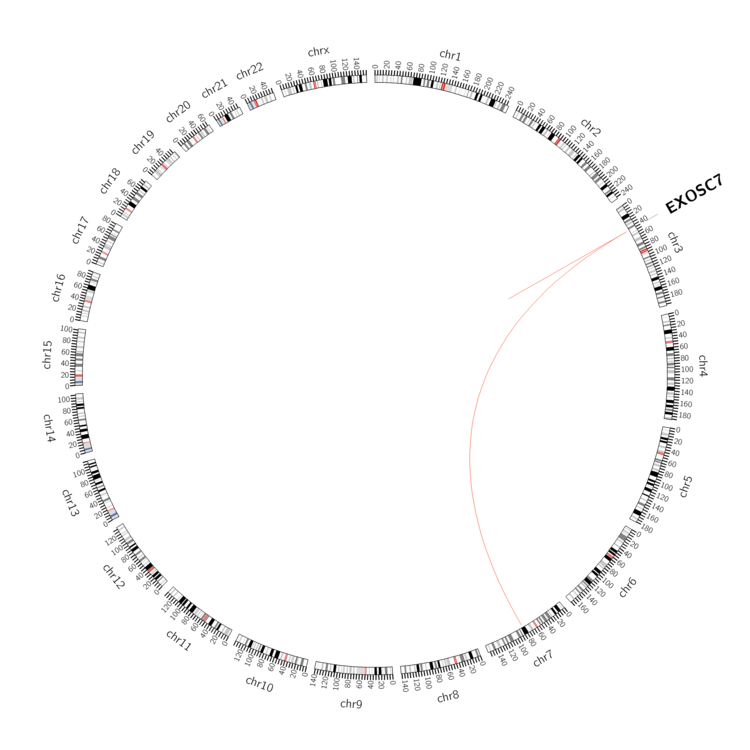 |
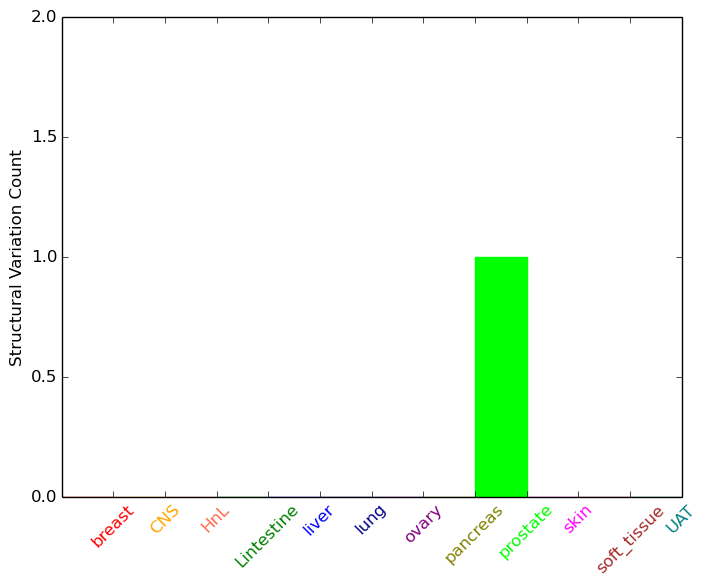
| - For Inter-chromosomal Variations |
| * Inter-chromosomal variantions includes 'interchromosomal amplicon to amplicon', 'interchromosomal amplicon to non-amplified dna', 'interchromosomal insertion', 'Interchromosomal unknown type'. |
 |
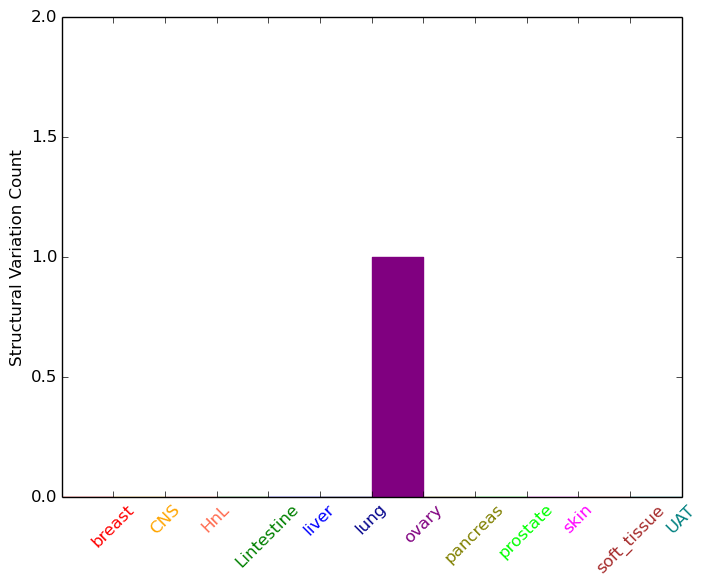
| - For Intra-chromosomal Variations |
| * Intra-chromosomal variantions includes 'intrachromosomal amplicon to amplicon', 'intrachromosomal amplicon to non-amplified dna', 'intrachromosomal deletion', 'intrachromosomal fold-back inversion', 'intrachromosomal inversion', 'intrachromosomal tandem duplication', 'Intrachromosomal unknown type', 'intrachromosomal with inverted orientation', 'intrachromosomal with non-inverted orientation'. |
 |
| Sample | Symbol_a | Chr_a | Start_a | End_a | Symbol_b | Chr_b | Start_b | End_b |
| ovary | EXOSC7 | chr3 | 45027336 | 45027356 | EXOSC7 | chr3 | 45027980 | 45028000 |
| prostate | EXOSC7 | chr3 | 45029192 | 45029192 | chr7 | 82233414 | 82233414 |
| cf) Tissue number; Tissue name (1;Breast, 2;Central_nervous_system, 3;Haematopoietic_and_lymphoid_tissue, 4;Large_intestine, 5;Liver, 6;Lung, 7;Ovary, 8;Pancreas, 9;Prostate, 10;Skin, 11;Soft_tissue, 12;Upper_aerodigestive_tract) |
| * From mRNA Sanger sequences, Chitars2.0 arranged chimeric transcripts. This table shows EXOSC7 related fusion information. |
| ID | Head Gene | Tail Gene | Accession | Gene_a | qStart_a | qEnd_a | Chromosome_a | tStart_a | tEnd_a | Gene_a | qStart_a | qEnd_a | Chromosome_a | tStart_a | tEnd_a |
| CK430478 | EXOSC7 | 1 | 501 | 3 | 45017761 | 45043101 | PRR4 | 498 | 633 | 12 | 10999777 | 10999912 | |
| CB241820 | EXOSC7 | 18 | 240 | 3 | 45053938 | 45054160 | EXOSC7 | 240 | 321 | 3 | 45052836 | 45053706 | |
| Top |
| There's no copy number variation information in COSMIC data for this gene. |
| Top |
|
 |
| Top |
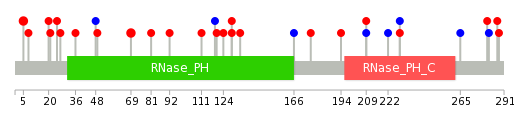
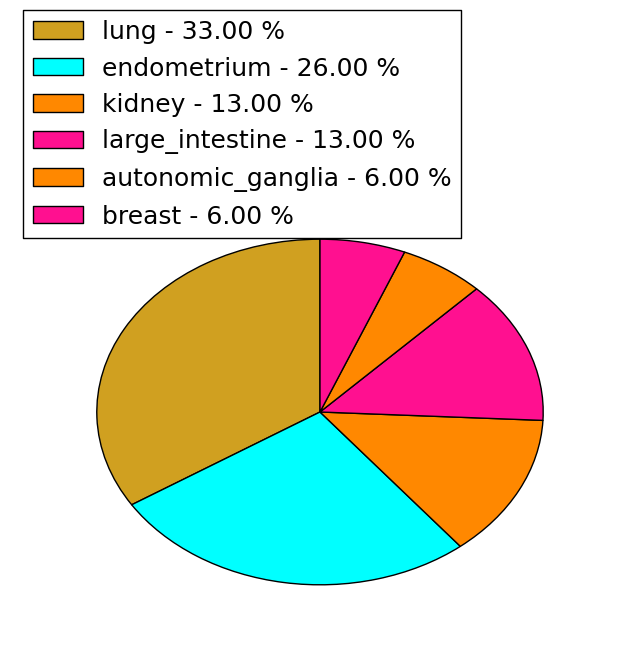
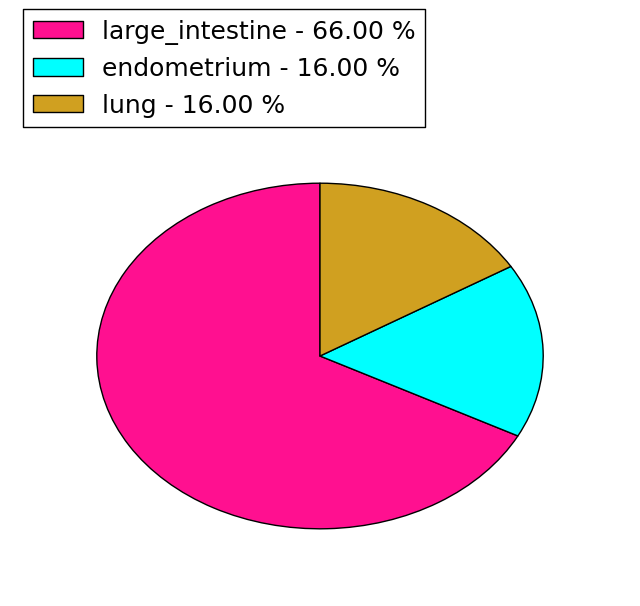
| Stat. for Non-Synonymous SNVs (# total SNVs=15) | (# total SNVs=6) |
 |  |
(# total SNVs=0) | (# total SNVs=0) |
| Top |
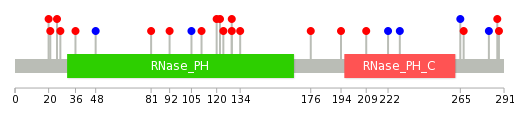
| * When you move the cursor on each content, you can see more deailed mutation information on the Tooltip. Those are primary_site,primary_histology,mutation(aa),pubmedID. |
| GRCh37 position | Mutation(aa) | Unique sampleID count |
| chr3:45030671-45030671 | p.R33* | 2 |
| chr3:45031088-45031088 | p.P69L | 2 |
| chr3:45017782-45017782 | p.T5A | 2 |
| chr3:45048962-45048962 | p.S222S | 1 |
| chr3:45030653-45030653 | p.R27C | 1 |
| chr3:45038695-45038695 | p.L124R | 1 |
| chr3:45048982-45048982 | p.S229L | 1 |
| chr3:45038709-45038709 | p.R129W | 1 |
| chr3:45048983-45048983 | p.S229S | 1 |
| chr3:45030680-45030680 | p.E36K | 1 |
| Top |
|
 |
| Point Mutation/ Tissue ID | 1 | 2 | 3 | 4 | 5 | 6 | 7 | 8 | 9 | 10 | 11 | 12 | 13 | 14 | 15 | 16 | 17 | 18 | 19 | 20 |
| # sample | 1 | 4 | 1 | 2 | 4 | 5 | 4 | 4 | ||||||||||||
| # mutation | 1 | 4 | 1 | 2 | 5 | 5 | 4 | 4 | ||||||||||||
| nonsynonymous SNV | 1 | 1 | 1 | 2 | 5 | 3 | 4 | 3 | ||||||||||||
| synonymous SNV | 3 | 2 | 1 |
| cf) Tissue ID; Tissue type (1; BLCA[Bladder Urothelial Carcinoma], 2; BRCA[Breast invasive carcinoma], 3; CESC[Cervical squamous cell carcinoma and endocervical adenocarcinoma], 4; COAD[Colon adenocarcinoma], 5; GBM[Glioblastoma multiforme], 6; Glioma Low Grade, 7; HNSC[Head and Neck squamous cell carcinoma], 8; KICH[Kidney Chromophobe], 9; KIRC[Kidney renal clear cell carcinoma], 10; KIRP[Kidney renal papillary cell carcinoma], 11; LAML[Acute Myeloid Leukemia], 12; LUAD[Lung adenocarcinoma], 13; LUSC[Lung squamous cell carcinoma], 14; OV[Ovarian serous cystadenocarcinoma ], 15; PAAD[Pancreatic adenocarcinoma], 16; PRAD[Prostate adenocarcinoma], 17; SKCM[Skin Cutaneous Melanoma], 18:STAD[Stomach adenocarcinoma], 19:THCA[Thyroid carcinoma], 20:UCEC[Uterine Corpus Endometrial Carcinoma]) |
| Top |
| * We represented just top 10 SNVs. When you move the cursor on each content, you can see more deailed mutation information on the Tooltip. Those are primary_site, primary_histology, mutation(aa), pubmedID. |
| Genomic Position | Mutation(aa) | Unique sampleID count |
| chr3:45030718 | p.V134L | 1 |
| chr3:45046817 | p.E20K | 1 |
| chr3:45031125 | p.G176R | 1 |
| chr3:45046872 | p.D21N | 1 |
| chr3:45038599 | p.V194A | 1 |
| chr3:45048921 | p.D25G | 1 |
| chr3:45038639 | p.R209W | 1 |
| chr3:45048962 | p.R27C | 1 |
| chr3:45038655 | p.S222S | 1 |
| chr3:45048983 | p.E36K | 1 |
| * Copy number data were extracted from TCGA using R package TCGA-Assembler. The URLs of all public data files on TCGA DCC data server were gathered on Jan-05-2015. Function ProcessCNAData in TCGA-Assembler package was used to obtain gene-level copy number value which is calculated as the average copy number of the genomic region of a gene. |
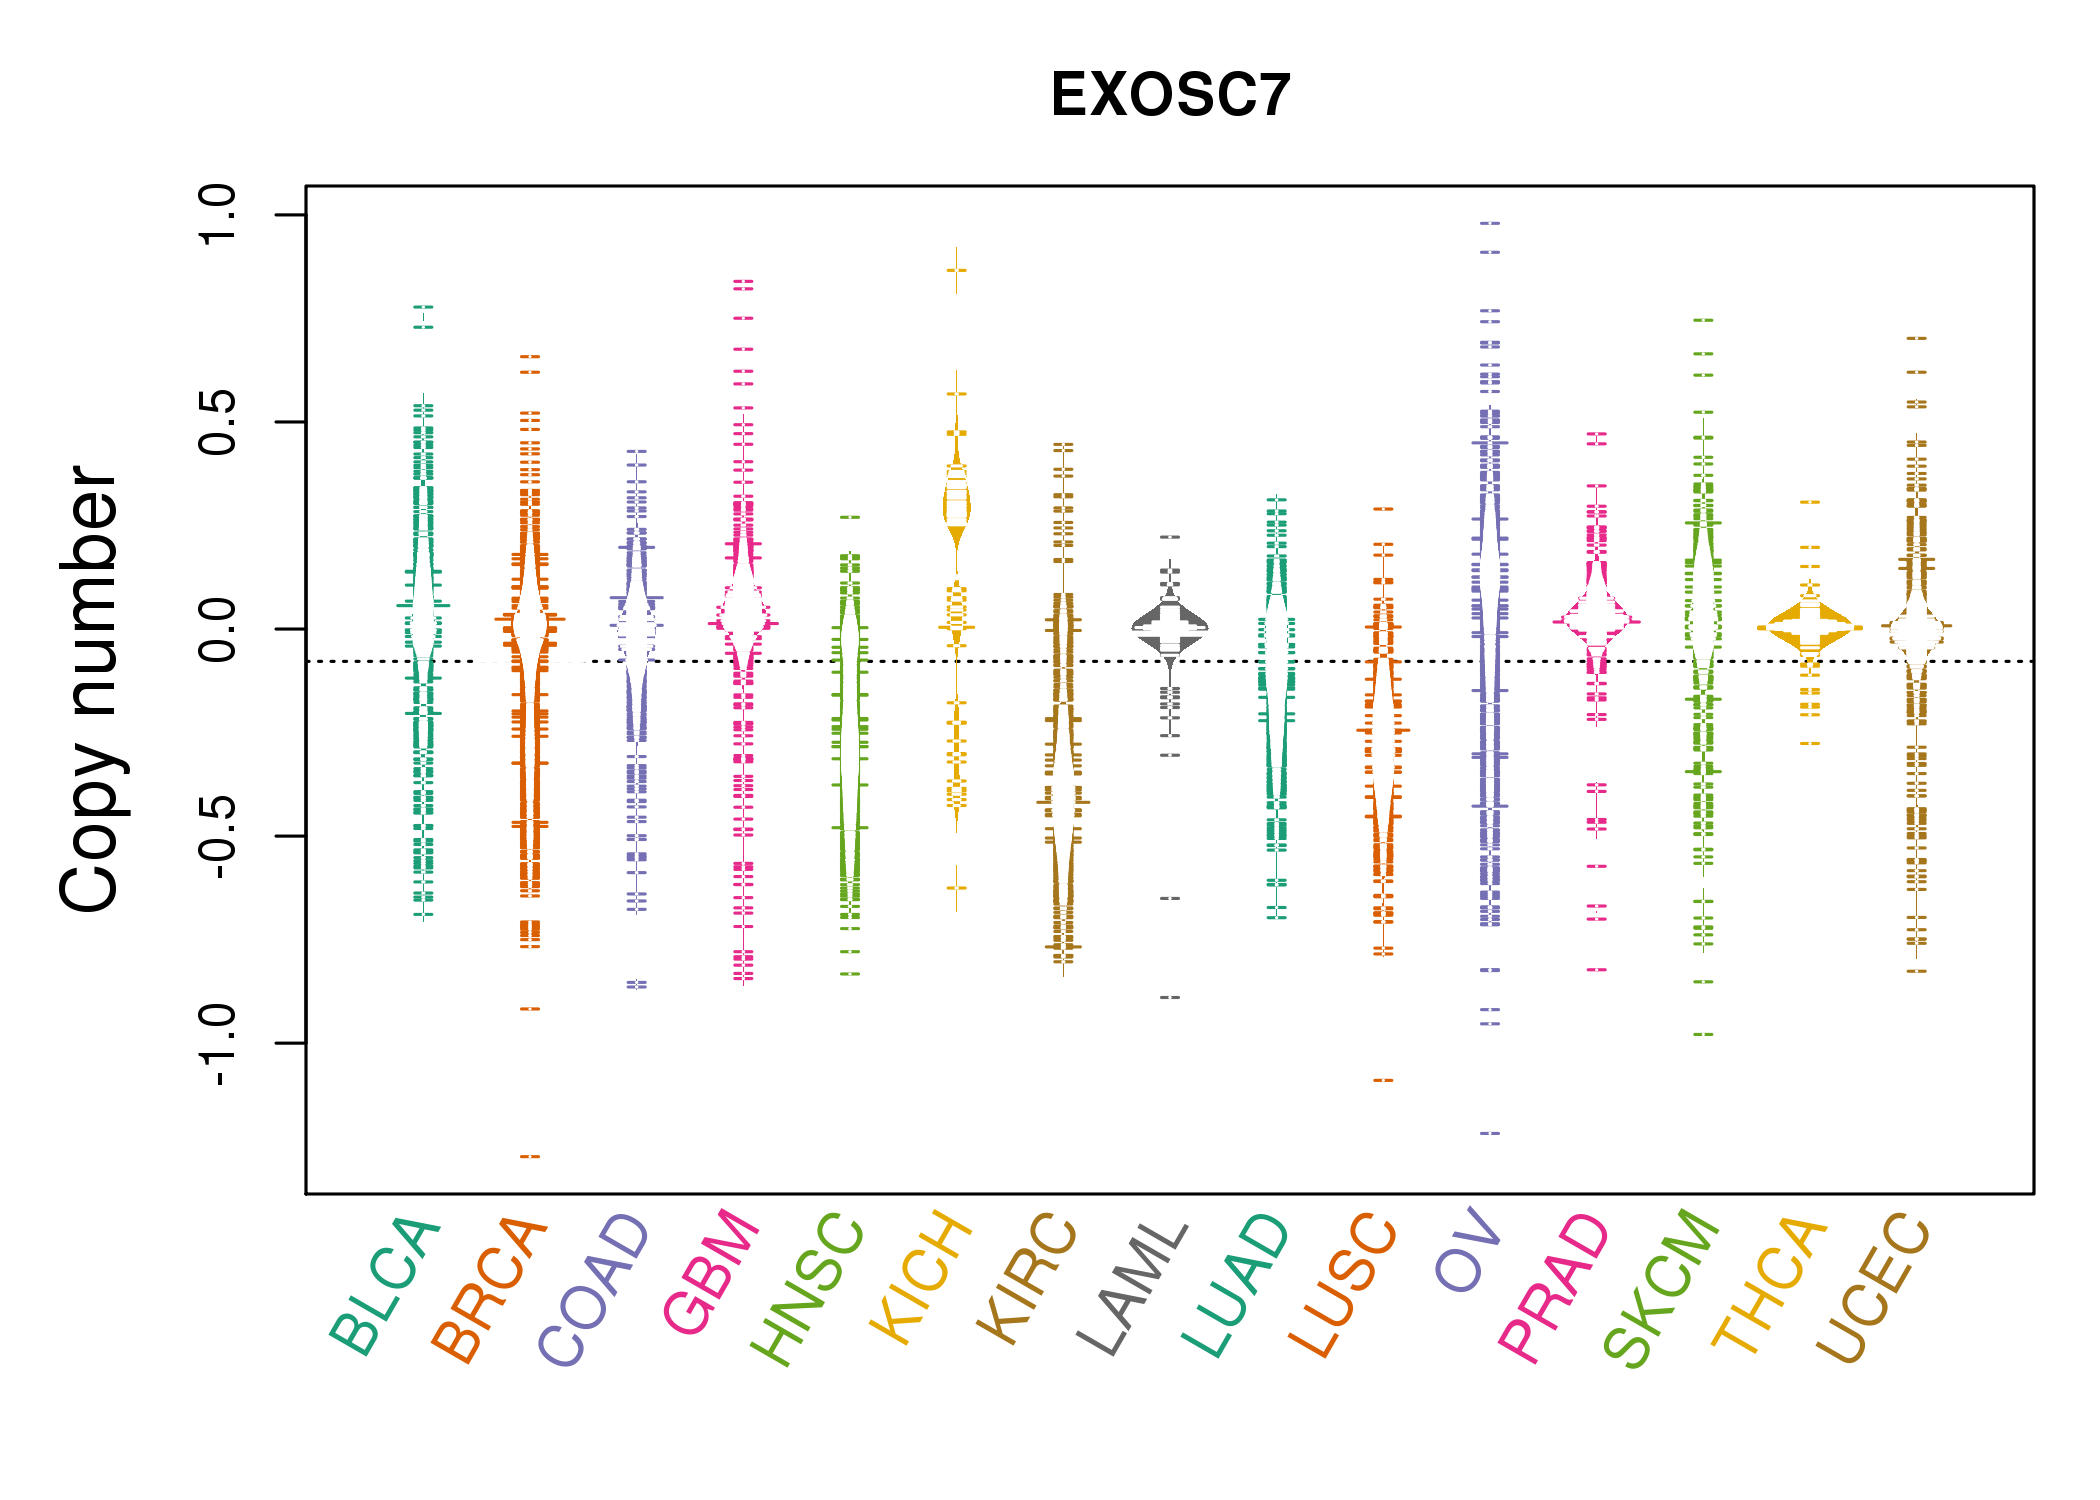 |
| cf) Tissue ID[Tissue type]: BLCA[Bladder Urothelial Carcinoma], BRCA[Breast invasive carcinoma], CESC[Cervical squamous cell carcinoma and endocervical adenocarcinoma], COAD[Colon adenocarcinoma], GBM[Glioblastoma multiforme], Glioma Low Grade, HNSC[Head and Neck squamous cell carcinoma], KICH[Kidney Chromophobe], KIRC[Kidney renal clear cell carcinoma], KIRP[Kidney renal papillary cell carcinoma], LAML[Acute Myeloid Leukemia], LUAD[Lung adenocarcinoma], LUSC[Lung squamous cell carcinoma], OV[Ovarian serous cystadenocarcinoma ], PAAD[Pancreatic adenocarcinoma], PRAD[Prostate adenocarcinoma], SKCM[Skin Cutaneous Melanoma], STAD[Stomach adenocarcinoma], THCA[Thyroid carcinoma], UCEC[Uterine Corpus Endometrial Carcinoma] |
| Top |
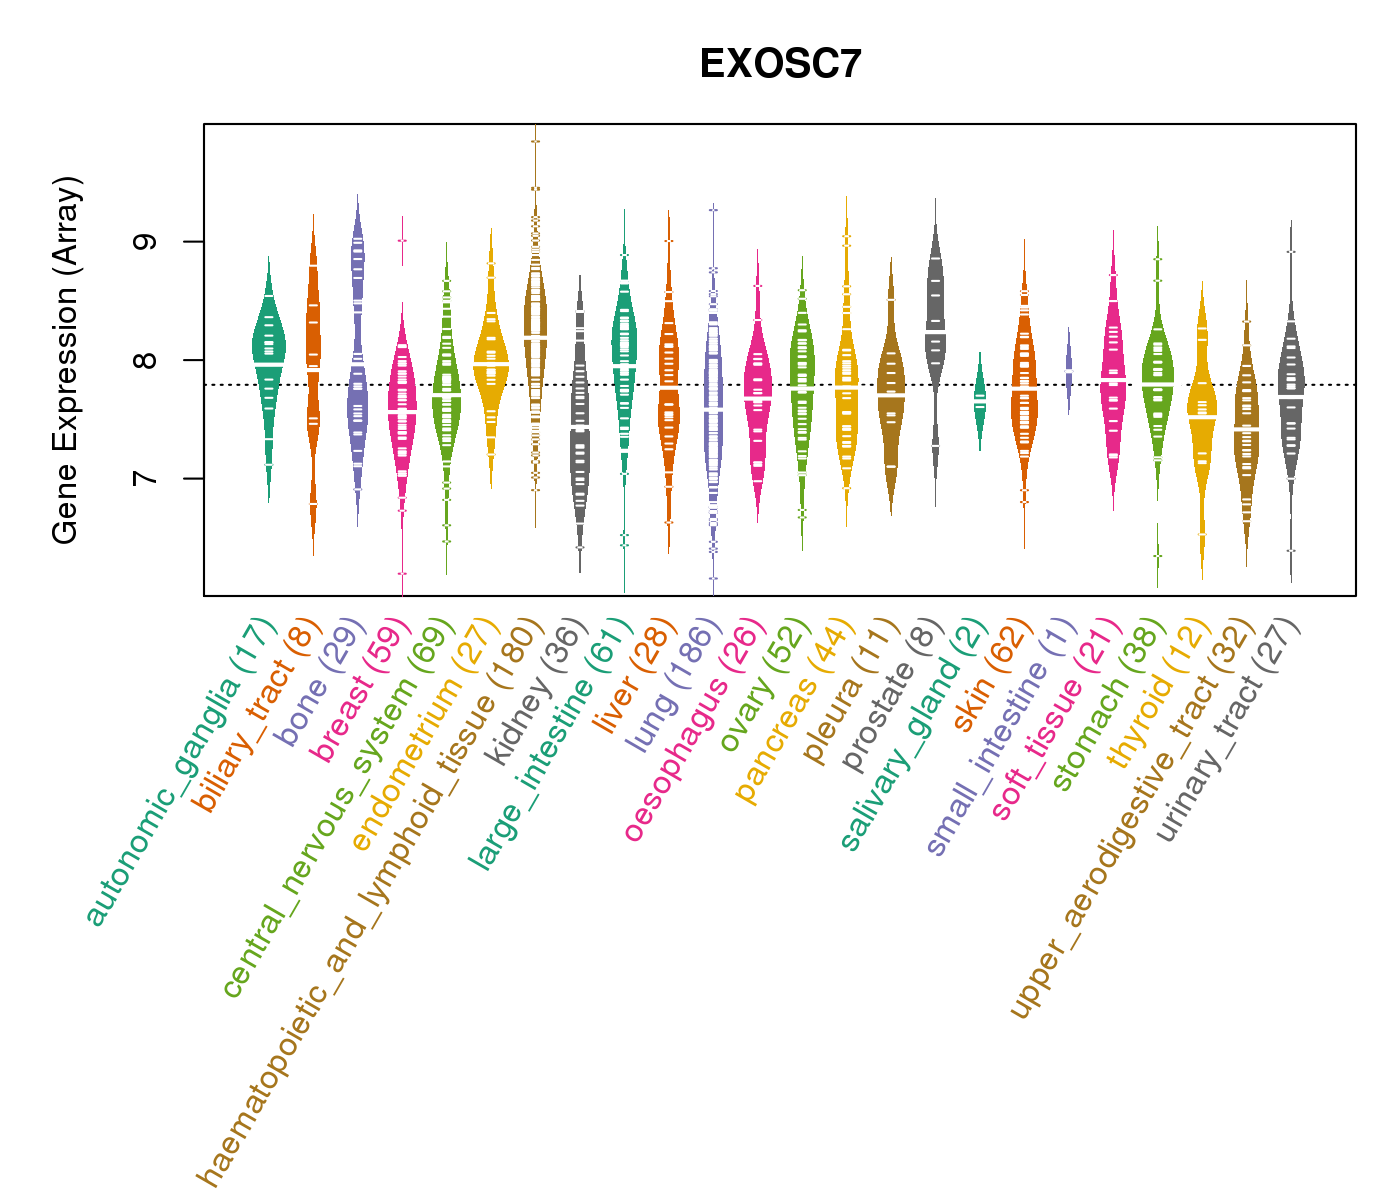
| Gene Expression for EXOSC7 |
| * CCLE gene expression data were extracted from CCLE_Expression_Entrez_2012-10-18.res: Gene-centric RMA-normalized mRNA expression data. |
 |
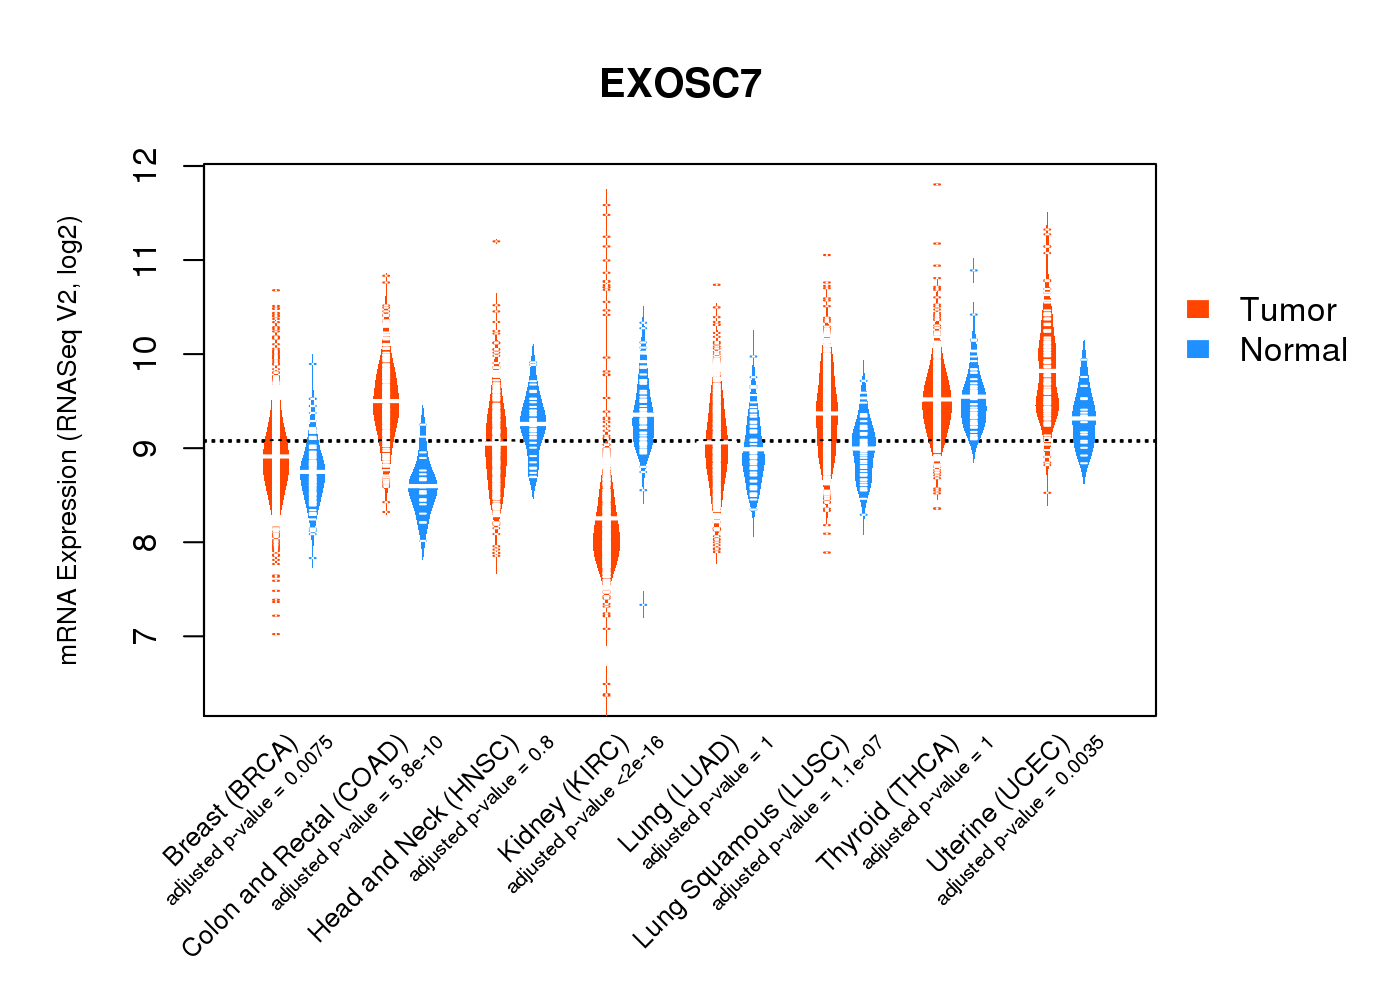
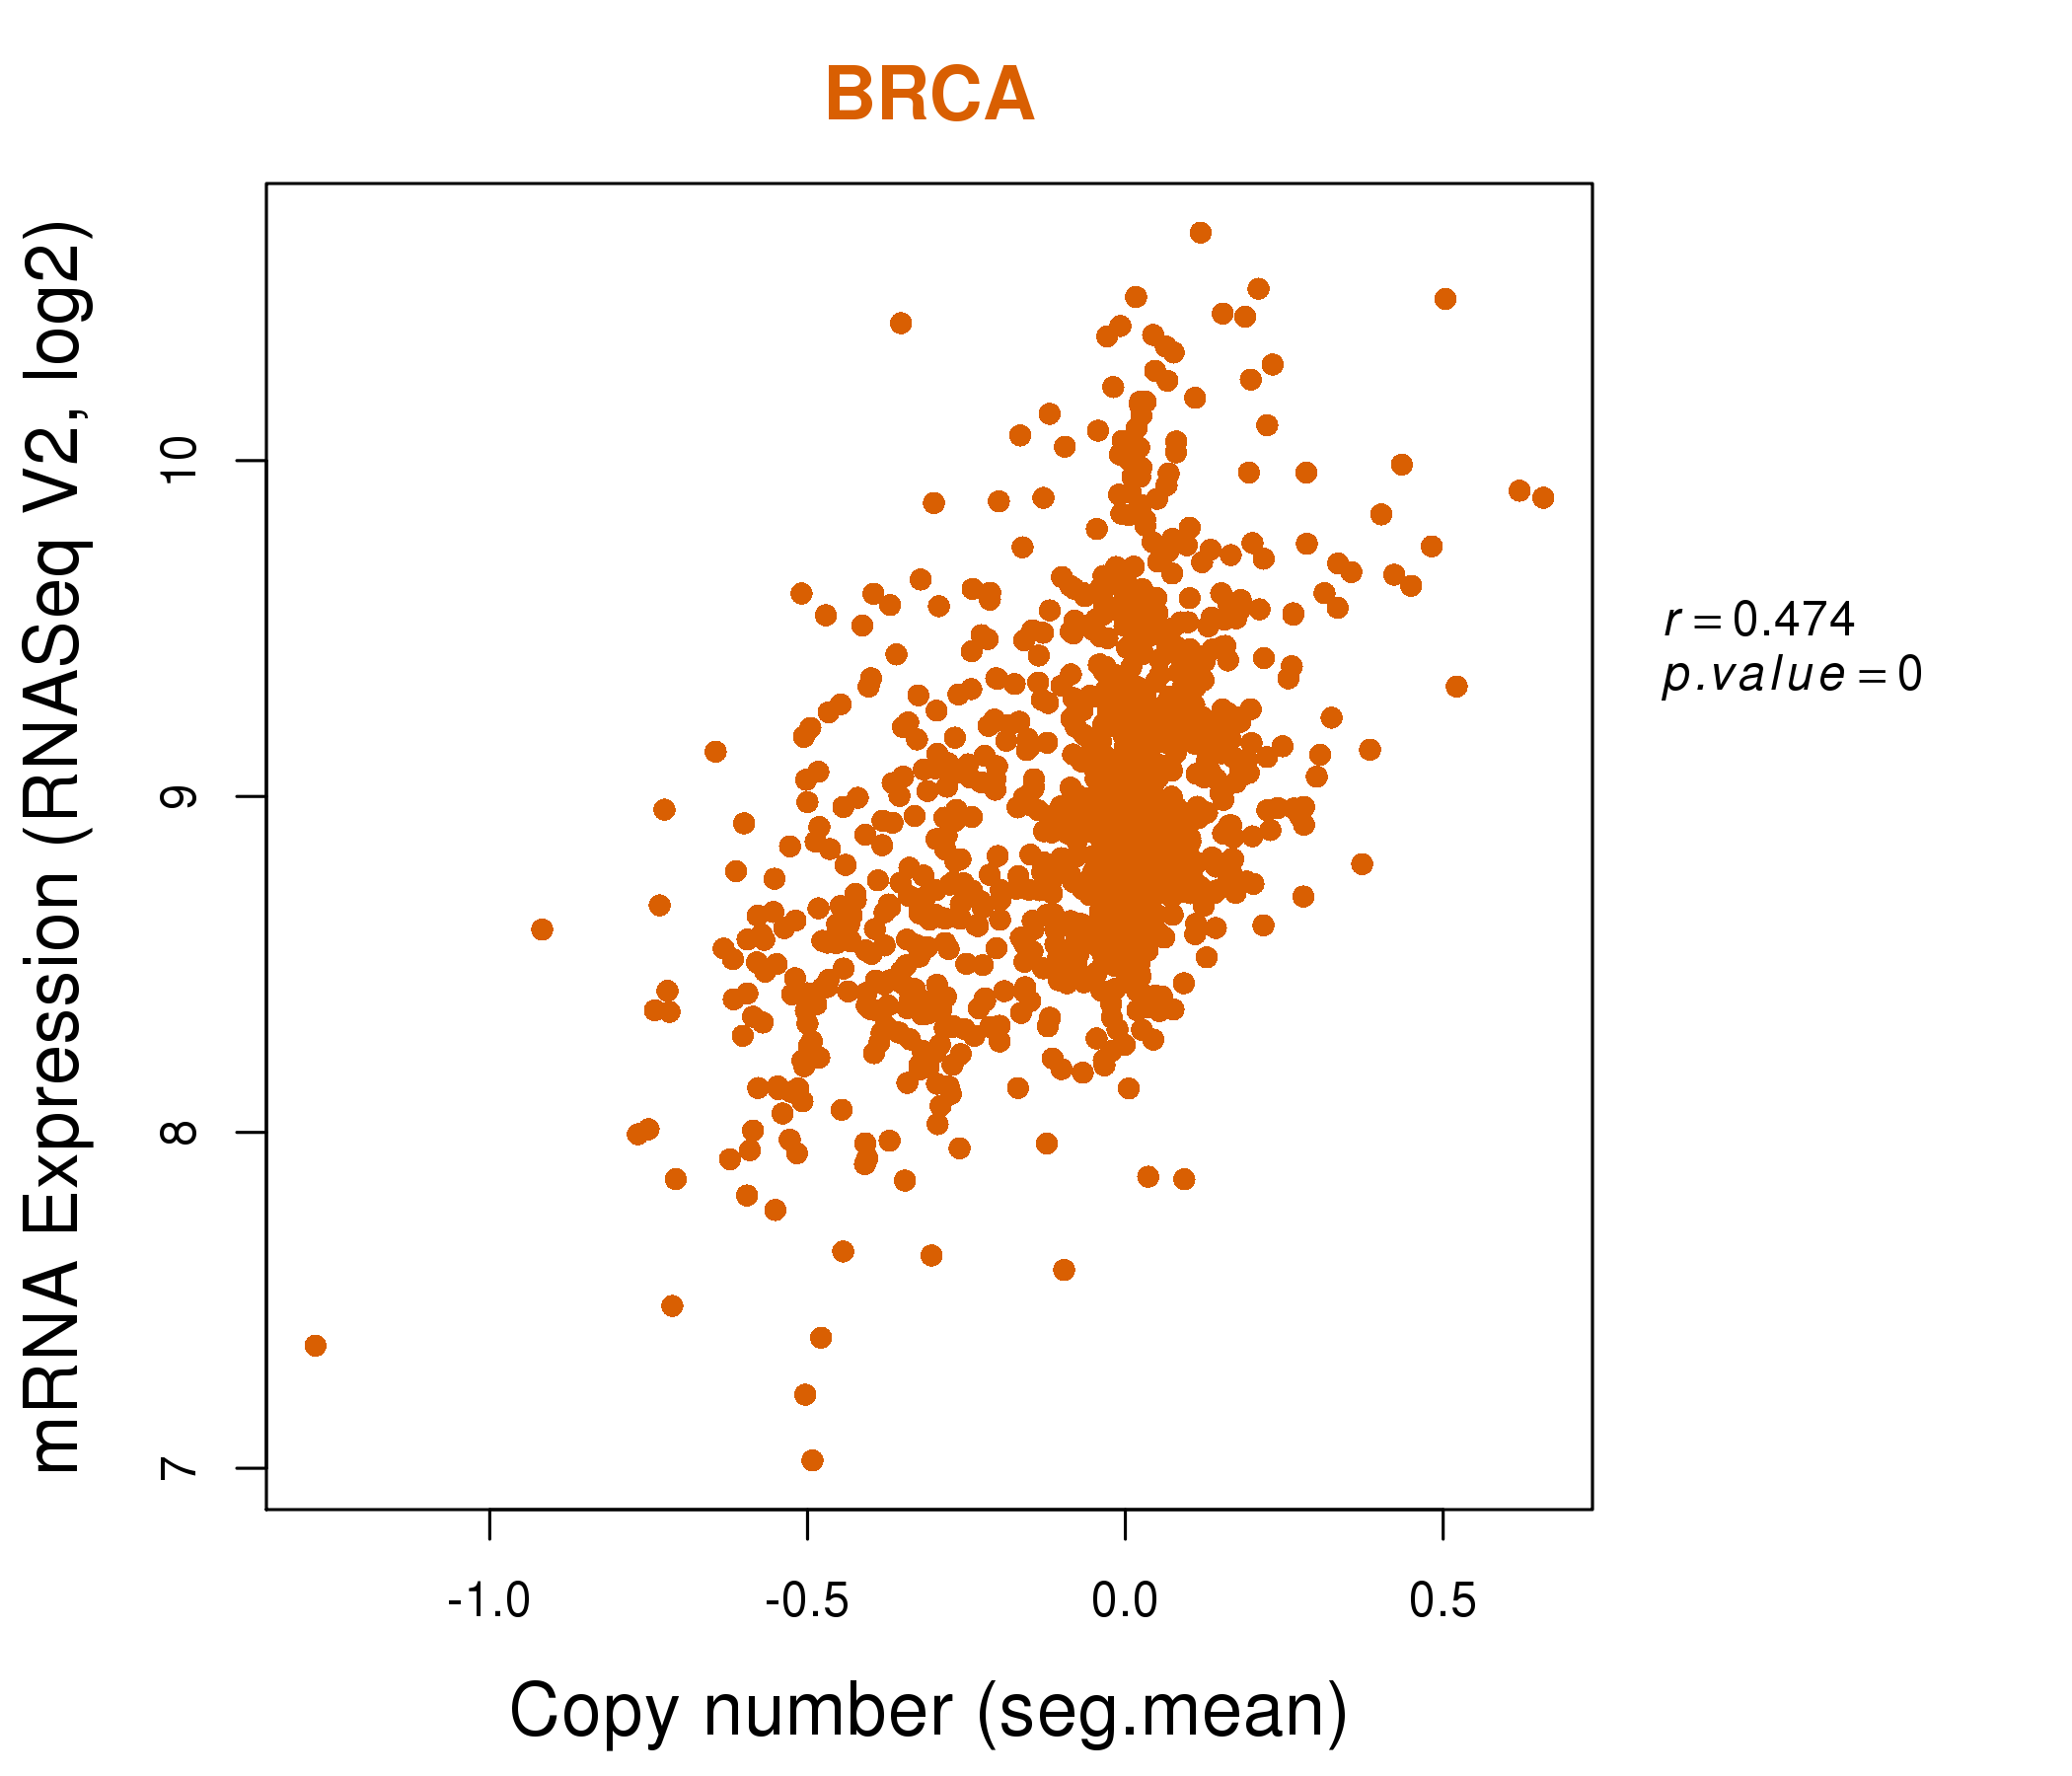
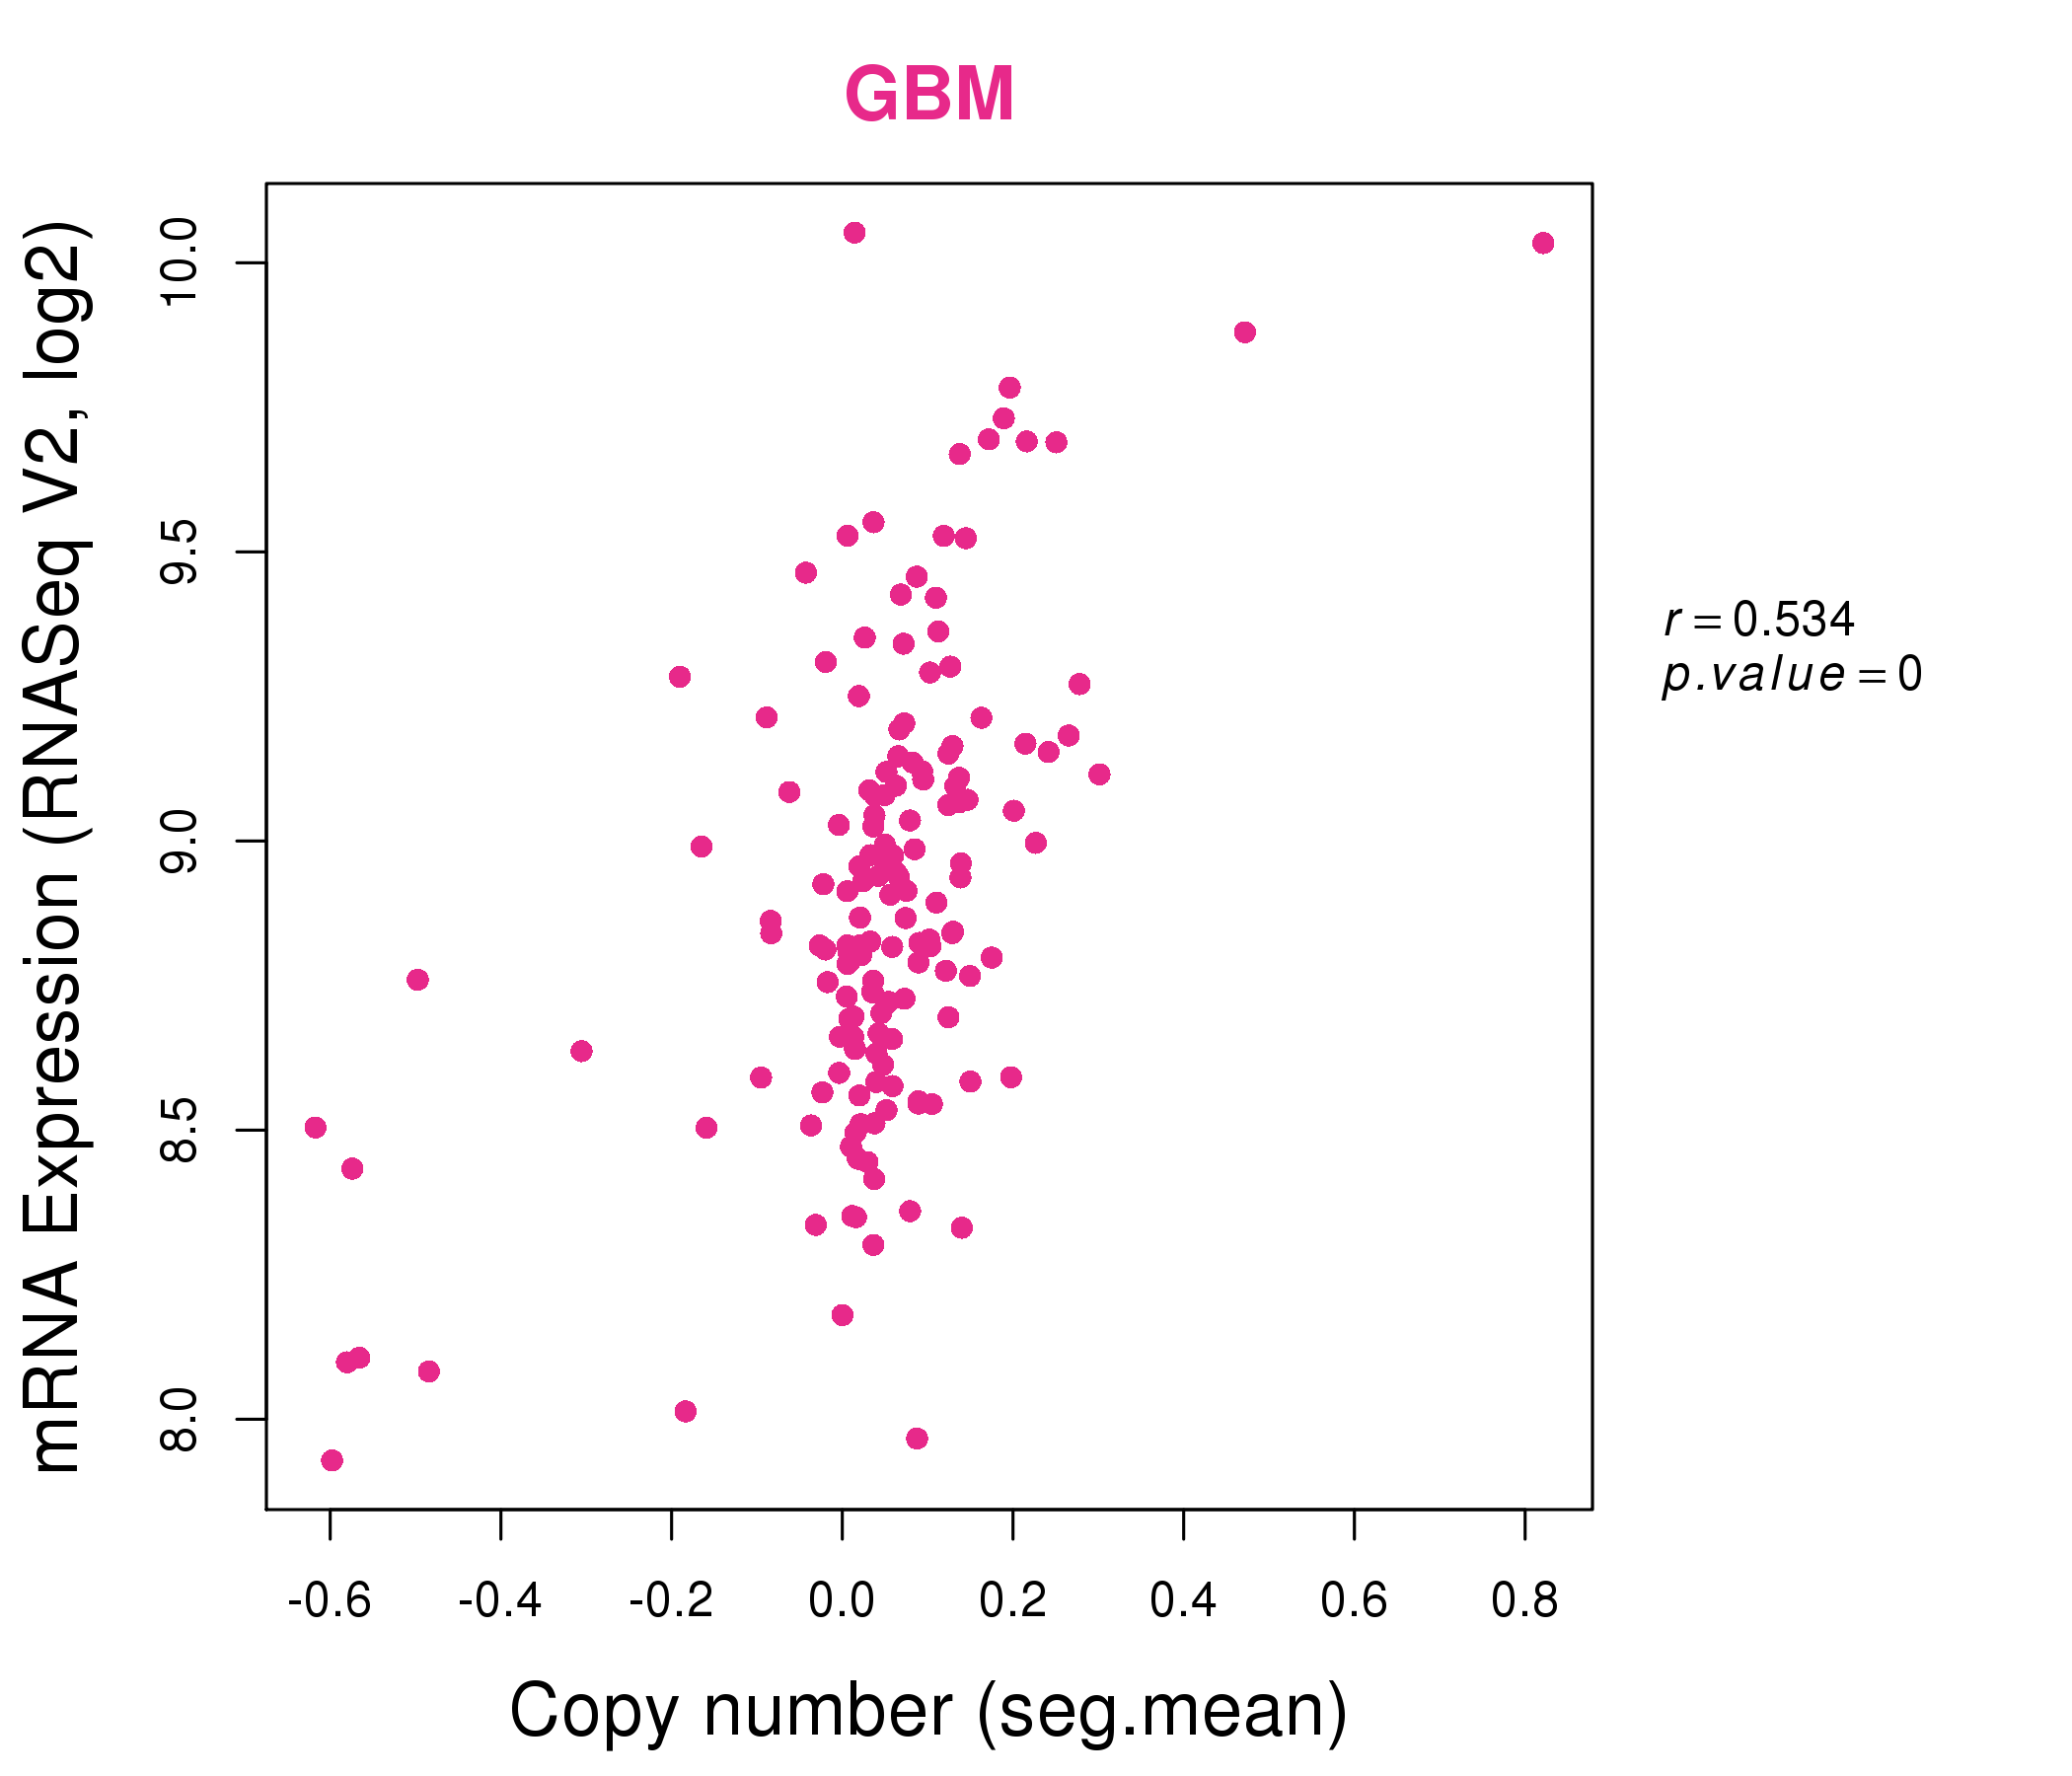
| * Normalized gene expression data of RNASeqV2 was extracted from TCGA using R package TCGA-Assembler. The URLs of all public data files on TCGA DCC data server were gathered at Jan-05-2015. Only eight cancer types have enough normal control samples for differential expression analysis. (t test, adjusted p<0.05 (using Benjamini-Hochberg FDR)) |
 |
| Top |
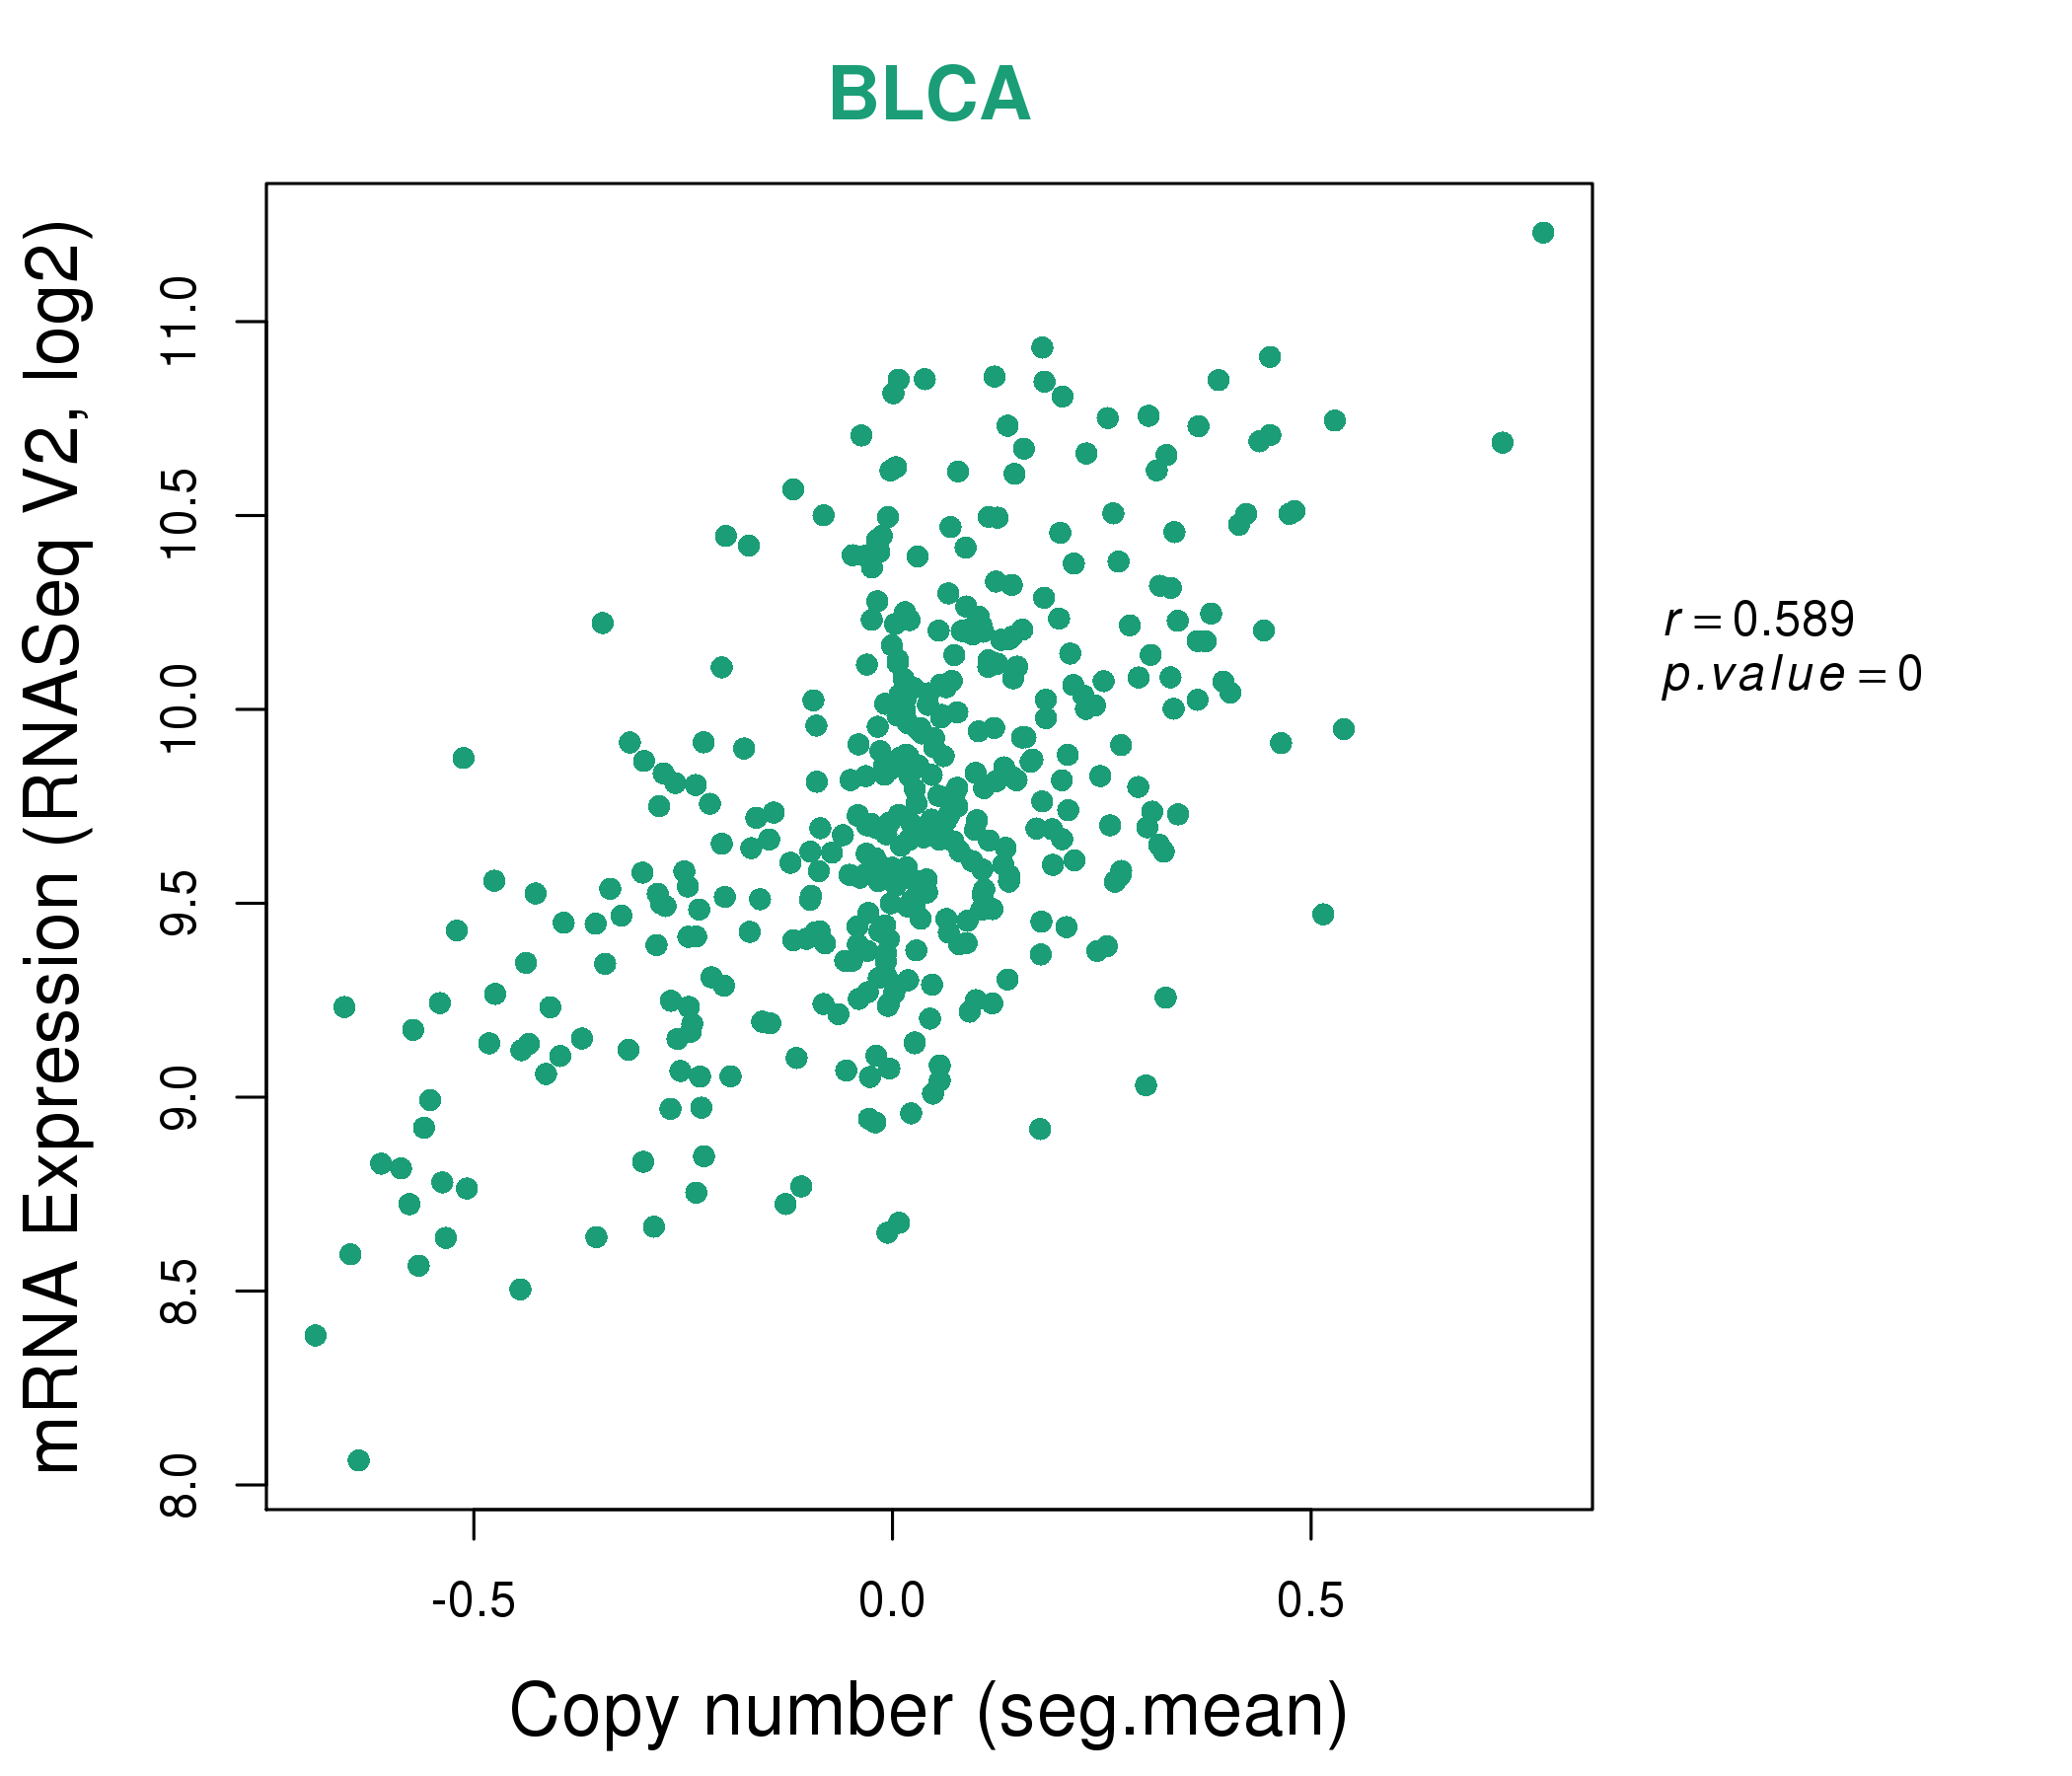
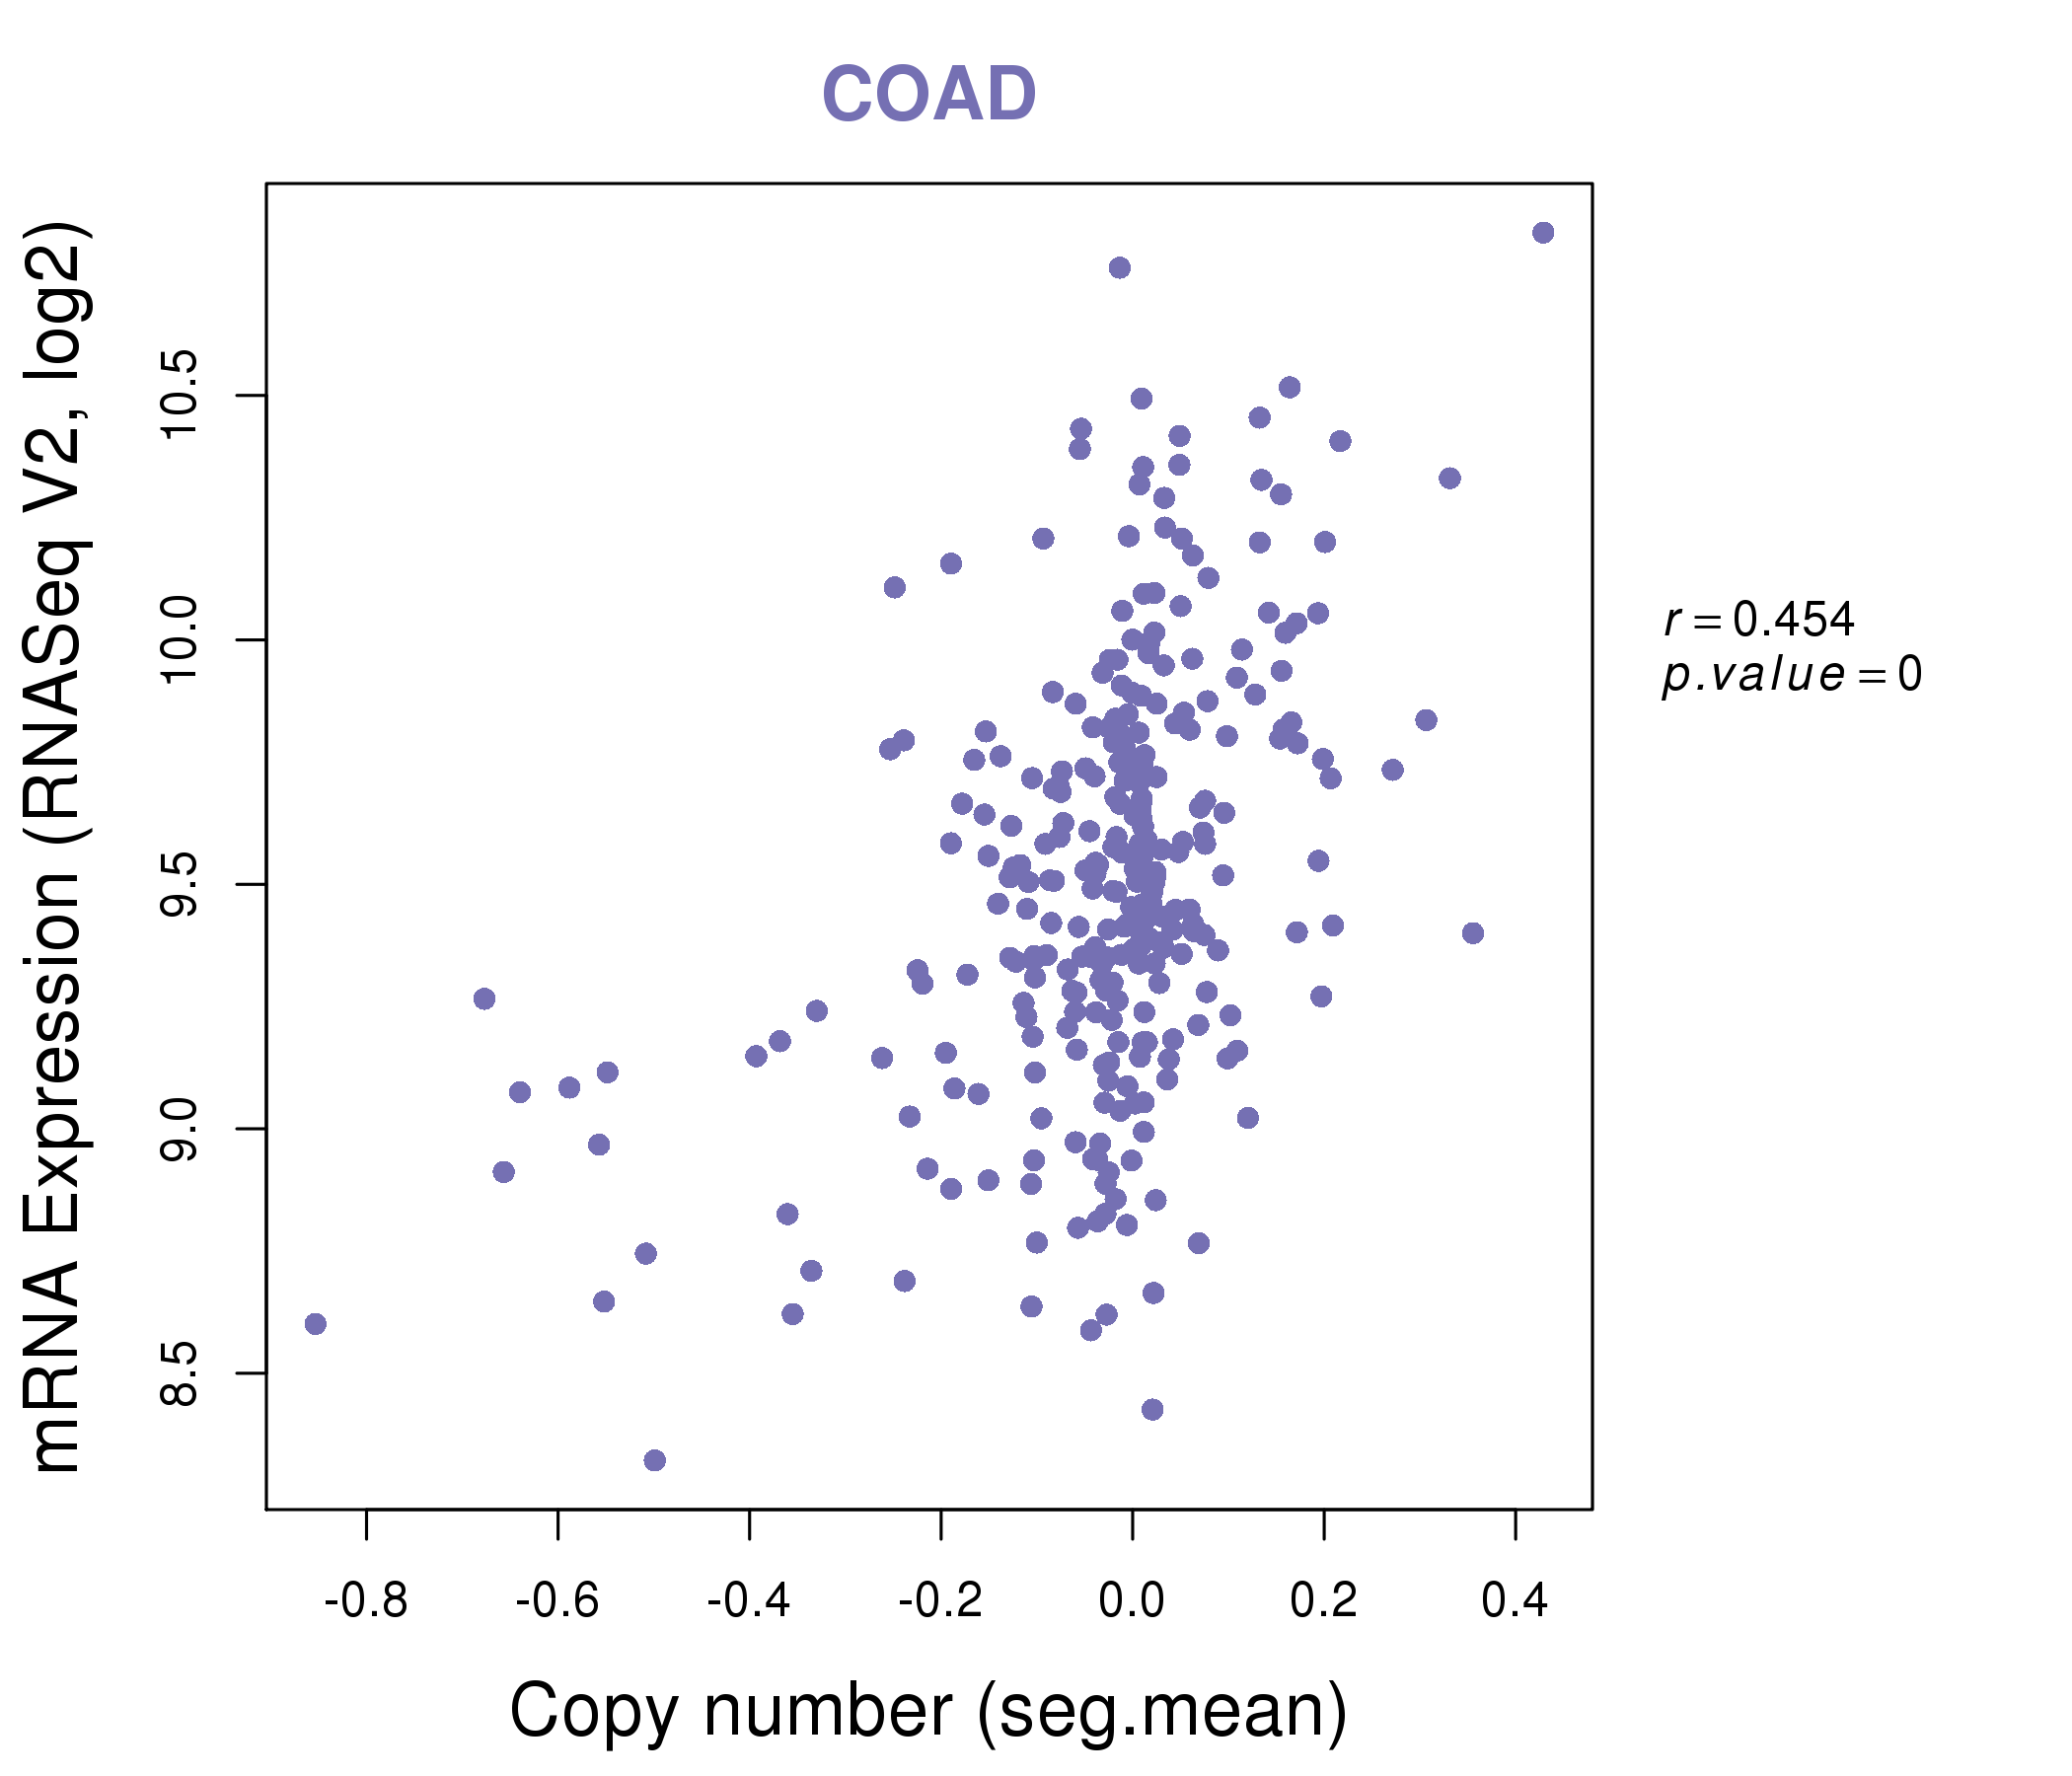
| * This plots show the correlation between CNV and gene expression. |
: Open all plots for all cancer types
 |
|
 |
|
| Top |
| Gene-Gene Network Information |
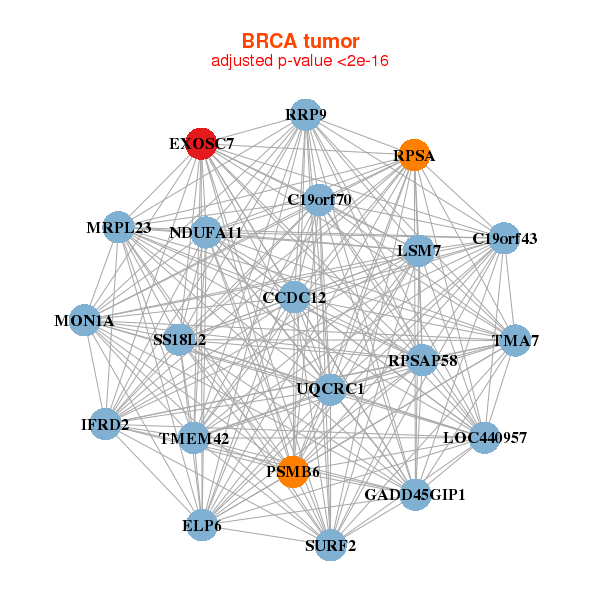
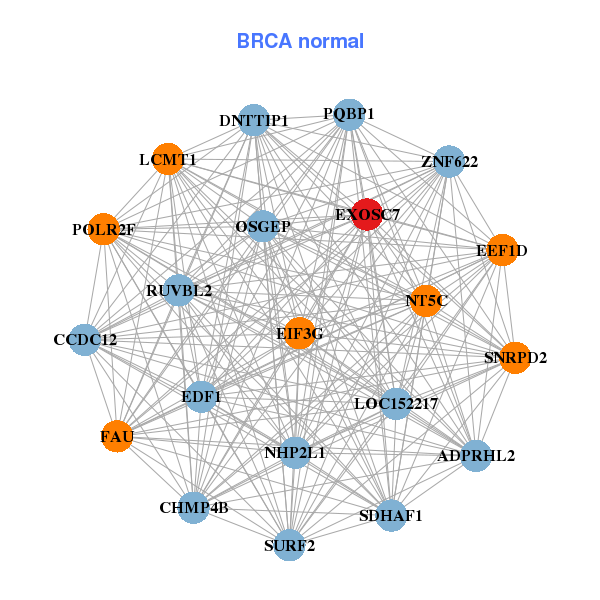
| * Co-Expression network figures were drawn using R package igraph. Only the top 20 genes with the highest correlations were shown. Red circle: input gene, orange circle: cell metabolism gene, sky circle: other gene |
: Open all plots for all cancer types
 |
|
| C19orf43,C19orf70,ELP6,CCDC12,TMA7,EXOSC7,GADD45GIP1, IFRD2,LOC440957,LSM7,MON1A,MRPL23,NDUFA11,PSMB6, RPSA,RPSAP58,RRP9,SS18L2,SURF2,TMEM42,UQCRC1 | ADPRHL2,CCDC12,CHMP4B,DNTTIP1,EDF1,EEF1D,EIF3G, EXOSC7,FAU,LCMT1,LOC152217,NHP2L1,NT5C,OSGEP, POLR2F,PQBP1,RUVBL2,SDHAF1,SNRPD2,SURF2,ZNF622 |
 |
|
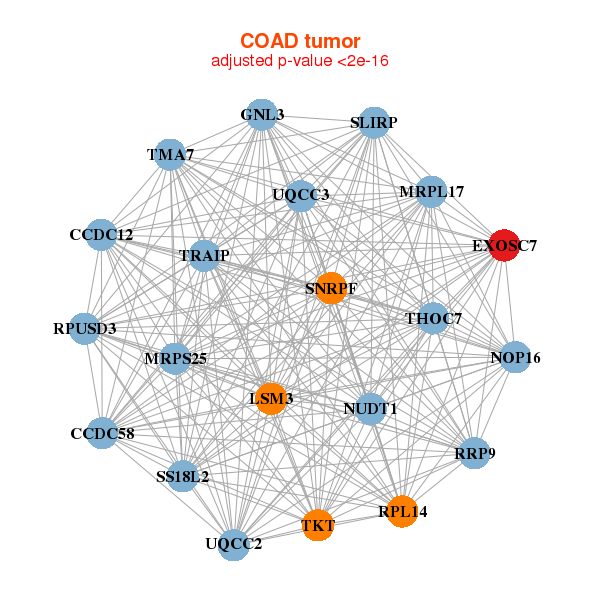
| UQCC3,SLIRP,UQCC2,CCDC12,CCDC58,TMA7,EXOSC7, GNL3,LSM3,MRPL17,MRPS25,NOP16,NUDT1,RPL14, RPUSD3,RRP9,SNRPF,SS18L2,THOC7,TKT,TRAIP | B9D1,HYPK,DCUN1D5,EBNA1BP2,EIF2B3,EIF3I,EXOSC7, EXOSC8,HAUS1,HNRNPC,MAGOHB,MORF4L2,NME1,NPM1, NPM3,PARK7,PPIL1,PRDX4,PRMT1,RAN,SNRPE |
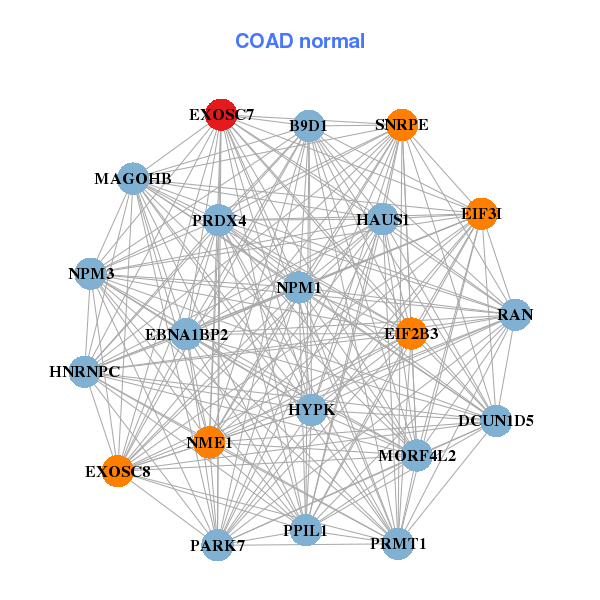
| * Co-Expression network figures were drawn using R package igraph. Only the top 20 genes with the highest correlations were shown. Red circle: input gene, orange circle: cell metabolism gene, sky circle: other gene |
: Open all plots for all cancer types
| Top |
: Open all interacting genes' information including KEGG pathway for all interacting genes from DAVID
| Top |
| Pharmacological Information for EXOSC7 |
| There's no related Drug. |
| Top |
| Cross referenced IDs for EXOSC7 |
| * We obtained these cross-references from Uniprot database. It covers 150 different DBs, 18 categories. http://www.uniprot.org/help/cross_references_section |
: Open all cross reference information
|
Copyright © 2016-Present - The Univsersity of Texas Health Science Center at Houston @ |