|
||||||||||||||||||||
| |
| Phenotypic Information (metabolism pathway, cancer, disease, phenome) |
| |
| |
| Gene-Gene Network Information: Co-Expression Network, Interacting Genes & KEGG |
| |
|


| Gene Summary for SMG1 |
| Basic gene info. | Gene symbol | SMG1 |
| Gene name | SMG1 phosphatidylinositol 3-kinase-related kinase | |
| Synonyms | 61E3.4|ATX|LIP | |
| Cytomap | UCSC genome browser: 16p12.3 | |
| Genomic location | chr16 :18816174-18937726 | |
| Type of gene | protein-coding | |
| RefGenes | NM_015092.4, | |
| Ensembl id | ENSG00000157106 | |
| Description | PI-3-kinase-related kinase SMG-1lambda-interacting proteinlambda/iota protein kinase C-interacting proteinserine/threonine-protein kinase SMG1smg-1 homolog, phosphatidylinositol 3-kinase-related kinase | |
| Modification date | 20141222 | |
| dbXrefs | MIM : 607032 | |
| HGNC : HGNC | ||
| Ensembl : ENSG00000157106 | ||
| HPRD : 06123 | ||
| Vega : OTTHUMG00000166900 | ||
| Protein | UniProt: Q96Q15 go to UniProt's Cross Reference DB Table | |
| Expression | CleanEX: HS_SMG1 | |
| BioGPS: 23049 | ||
| Gene Expression Atlas: ENSG00000157106 | ||
| The Human Protein Atlas: ENSG00000157106 | ||
| Pathway | NCI Pathway Interaction Database: SMG1 | |
| KEGG: SMG1 | ||
| REACTOME: SMG1 | ||
| ConsensusPathDB | ||
| Pathway Commons: SMG1 | ||
| Metabolism | MetaCyc: SMG1 | |
| HUMANCyc: SMG1 | ||
| Regulation | Ensembl's Regulation: ENSG00000157106 | |
| miRBase: chr16 :18,816,174-18,937,726 | ||
| TargetScan: NM_015092 | ||
| cisRED: ENSG00000157106 | ||
| Context | iHOP: SMG1 | |
| cancer metabolism search in PubMed: SMG1 | ||
| UCL Cancer Institute: SMG1 | ||
| Assigned class in ccmGDB | A - This gene has a literature evidence and it belongs to cancer gene. | |
| References showing role of SMG1 in cancer cell metabolism | 1. Cheung H, St Jean M, Beug S, Lejmi-Mrad R, LaCasse E, et al. (2011) SMG1 and NIK regulate apoptosis induced by Smac mimetic compounds. Cell death & disease 2: e146. go to article | |
| Top |
| Phenotypic Information for SMG1(metabolism pathway, cancer, disease, phenome) |
| Cancer | CGAP: SMG1 |
| Familial Cancer Database: SMG1 | |
| * This gene is included in those cancer gene databases. |
|
|
|
|
|
| . | ||||||||||||||
Oncogene 1 | Significant driver gene in | |||||||||||||||||||
| cf) number; DB name 1 Oncogene; http://nar.oxfordjournals.org/content/35/suppl_1/D721.long, 2 Tumor Suppressor gene; https://bioinfo.uth.edu/TSGene/, 3 Cancer Gene Census; http://www.nature.com/nrc/journal/v4/n3/abs/nrc1299.html, 4 CancerGenes; http://nar.oxfordjournals.org/content/35/suppl_1/D721.long, 5 Network of Cancer Gene; http://ncg.kcl.ac.uk/index.php, 1Therapeutic Vulnerabilities in Cancer; http://cbio.mskcc.org/cancergenomics/statius/ |
| REACTOME_METABOLISM_OF_MRNA REACTOME_METABOLISM_OF_RNA | |
| OMIM | 607032; gene. |
| Orphanet | |
| Disease | KEGG Disease: SMG1 |
| MedGen: SMG1 (Human Medical Genetics with Condition) | |
| ClinVar: SMG1 | |
| Phenotype | MGI: SMG1 (International Mouse Phenotyping Consortium) |
| PhenomicDB: SMG1 | |
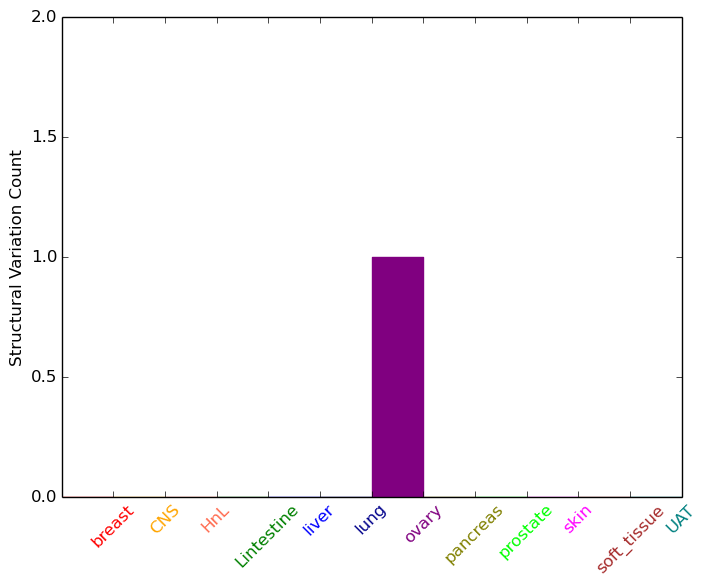
| Mutations for SMG1 |
| * Under tables are showing count per each tissue to give us broad intuition about tissue specific mutation patterns.You can go to the detailed page for each mutation database's web site. |
| - Statistics for Tissue and Mutation type | Top |
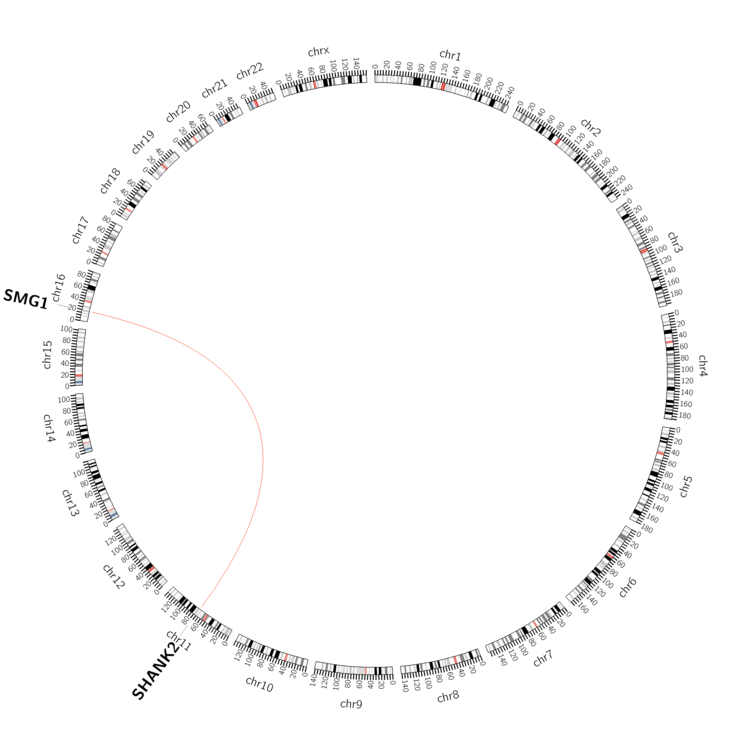 |
| - For Inter-chromosomal Variations |
| * Inter-chromosomal variantions includes 'interchromosomal amplicon to amplicon', 'interchromosomal amplicon to non-amplified dna', 'interchromosomal insertion', 'Interchromosomal unknown type'. |
 |
| - For Intra-chromosomal Variations |
| There's no intra-chromosomal structural variation. |
| Sample | Symbol_a | Chr_a | Start_a | End_a | Symbol_b | Chr_b | Start_b | End_b |
| cf) Tissue number; Tissue name (1;Breast, 2;Central_nervous_system, 3;Haematopoietic_and_lymphoid_tissue, 4;Large_intestine, 5;Liver, 6;Lung, 7;Ovary, 8;Pancreas, 9;Prostate, 10;Skin, 11;Soft_tissue, 12;Upper_aerodigestive_tract) |
| * From mRNA Sanger sequences, Chitars2.0 arranged chimeric transcripts. This table shows SMG1 related fusion information. |
| ID | Head Gene | Tail Gene | Accession | Gene_a | qStart_a | qEnd_a | Chromosome_a | tStart_a | tEnd_a | Gene_a | qStart_a | qEnd_a | Chromosome_a | tStart_a | tEnd_a |
| BE842124 | ACAA2 | 13 | 144 | 18 | 47313702 | 47317942 | SMG1 | 137 | 409 | 16 | 18845615 | 18846340 | |
| AV652799 | SMG1 | 1 | 131 | 16 | 18856751 | 18856881 | CYP2C9 | 127 | 756 | 10 | 96740952 | 96748968 | |
| DA481995 | SMG1 | 243 | 263 | 16 | 18937306 | 18937326 | KPNA3 | 247 | 581 | 13 | 50306748 | 50366697 | |
| DB219627 | BPTF | 1 | 70 | 17 | 65944237 | 65944305 | SMG1 | 62 | 546 | 16 | 18820944 | 18826827 | |
| DA571449 | KCNC3 | 200 | 452 | 19 | 50821889 | 50822141 | SMG1 | 453 | 744 | 16 | 18816846 | 18817139 | |
| BG769973 | SMG1 | 2 | 270 | 16 | 18819376 | 18819646 | COMMD1 | 265 | 294 | 2 | 62357034 | 62357063 | |
| BE771673 | SMG1 | 184 | 367 | 16 | 18839866 | 18840049 | DOCK3 | 353 | 376 | 3 | 50981954 | 50981977 | |
| Top |
| There's no copy number variation information in COSMIC data for this gene. |
| Top |
|
 |
| Top |
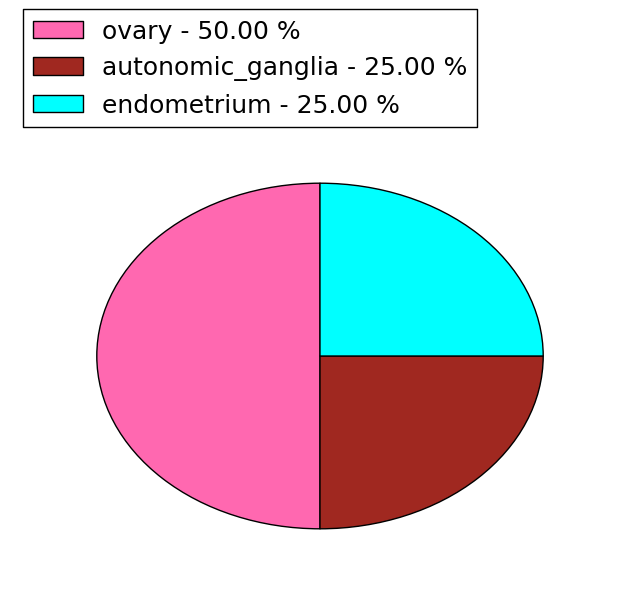
| Stat. for Non-Synonymous SNVs (# total SNVs=186) | (# total SNVs=81) |
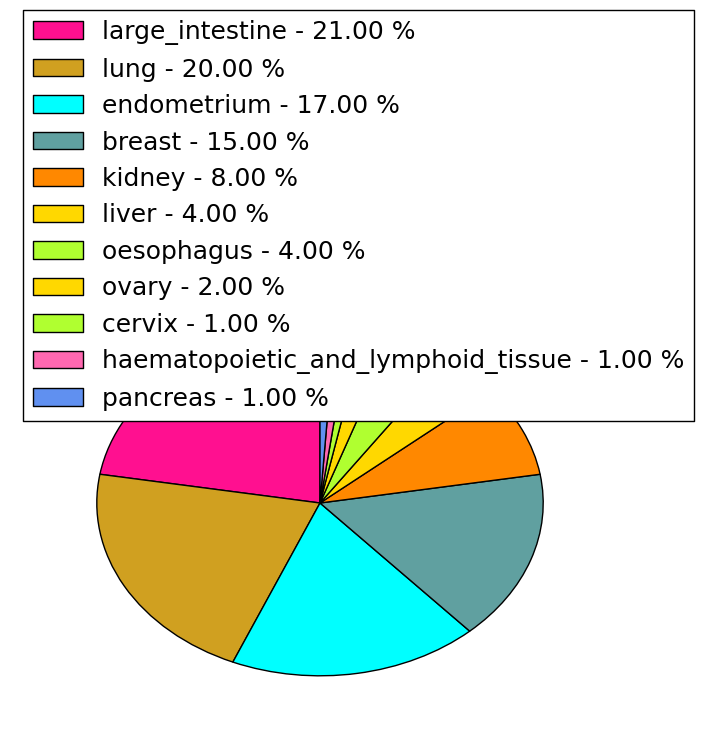 | 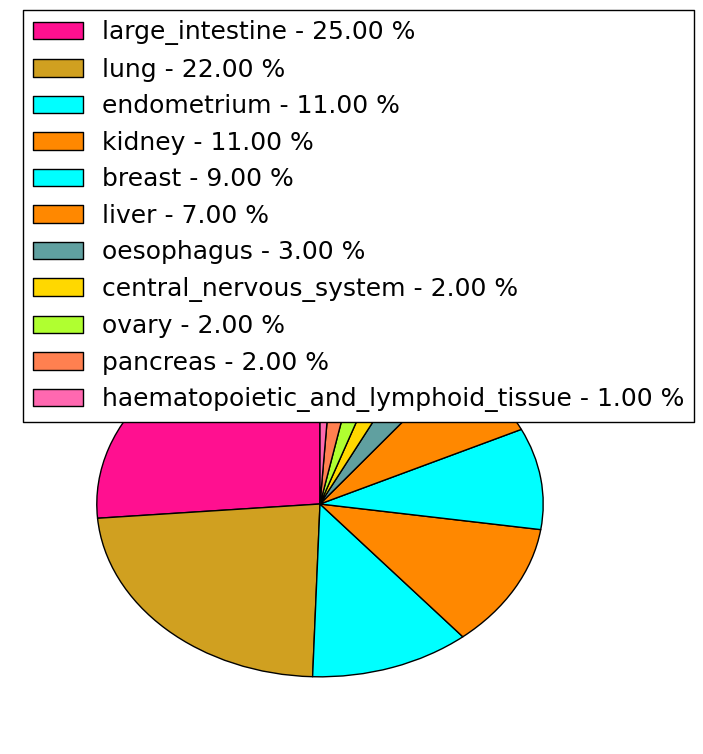 |
(# total SNVs=4) | (# total SNVs=3) |
 | 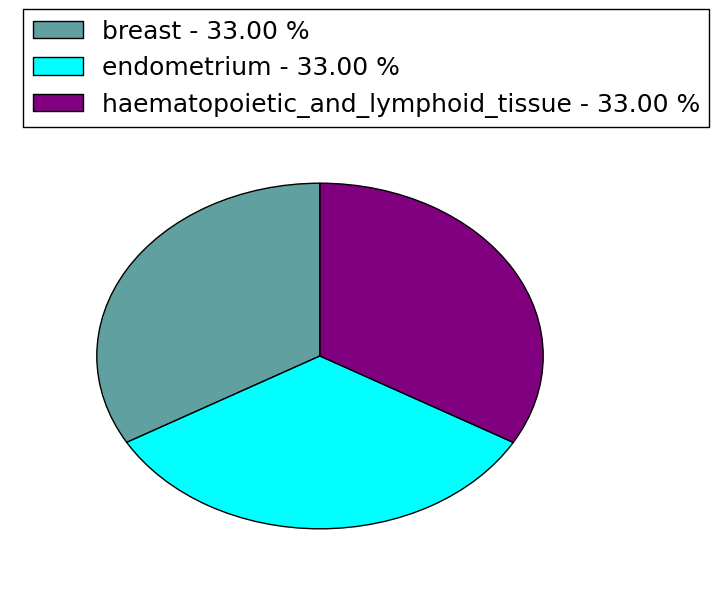 |
| Top |
| * When you move the cursor on each content, you can see more deailed mutation information on the Tooltip. Those are primary_site,primary_histology,mutation(aa),pubmedID. |
| GRCh37 position | Mutation(aa) | Unique sampleID count |
| chr16:18882777-18882777 | p.E733E | 6 |
| chr16:18820900-18820900 | p.A3655A | 4 |
| chr16:18887699-18887699 | p.H542R | 3 |
| chr16:18900862-18900862 | p.L214L | 3 |
| chr16:18853072-18853072 | p.S2167P | 3 |
| chr16:18845568-18845568 | p.S2837S | 3 |
| chr16:18865172-18865172 | p.M1497V | 3 |
| chr16:18908139-18908139 | p.A74T | 2 |
| chr16:18861439-18861439 | p.D1761Y | 2 |
| chr16:18853724-18853724 | p.R2087H | 2 |
| Top |
|
 |
| Point Mutation/ Tissue ID | 1 | 2 | 3 | 4 | 5 | 6 | 7 | 8 | 9 | 10 | 11 | 12 | 13 | 14 | 15 | 16 | 17 | 18 | 19 | 20 |
| # sample | 7 | 8 | 5 | 43 | 2 | 10 | 1 | 5 | 6 | 3 | 28 | 12 | 2 | 15 | 18 | 2 | 27 | |||
| # mutation | 7 | 8 | 5 | 38 | 2 | 10 | 1 | 5 | 6 | 3 | 28 | 14 | 2 | 14 | 23 | 2 | 50 | |||
| nonsynonymous SNV | 5 | 6 | 5 | 26 | 1 | 9 | 1 | 3 | 5 | 3 | 19 | 10 | 2 | 13 | 17 | 1 | 39 | |||
| synonymous SNV | 2 | 2 | 12 | 1 | 1 | 2 | 1 | 10 | 4 | 1 | 6 | 1 | 11 |
| cf) Tissue ID; Tissue type (1; BLCA[Bladder Urothelial Carcinoma], 2; BRCA[Breast invasive carcinoma], 3; CESC[Cervical squamous cell carcinoma and endocervical adenocarcinoma], 4; COAD[Colon adenocarcinoma], 5; GBM[Glioblastoma multiforme], 6; Glioma Low Grade, 7; HNSC[Head and Neck squamous cell carcinoma], 8; KICH[Kidney Chromophobe], 9; KIRC[Kidney renal clear cell carcinoma], 10; KIRP[Kidney renal papillary cell carcinoma], 11; LAML[Acute Myeloid Leukemia], 12; LUAD[Lung adenocarcinoma], 13; LUSC[Lung squamous cell carcinoma], 14; OV[Ovarian serous cystadenocarcinoma ], 15; PAAD[Pancreatic adenocarcinoma], 16; PRAD[Prostate adenocarcinoma], 17; SKCM[Skin Cutaneous Melanoma], 18:STAD[Stomach adenocarcinoma], 19:THCA[Thyroid carcinoma], 20:UCEC[Uterine Corpus Endometrial Carcinoma]) |
| Top |
| * We represented just top 10 SNVs. When you move the cursor on each content, you can see more deailed mutation information on the Tooltip. Those are primary_site, primary_histology, mutation(aa), pubmedID. |
| Genomic Position | Mutation(aa) | Unique sampleID count |
| chr16:18882777 | p.E737E | 6 |
| chr16:18908139 | p.S2171P | 3 |
| chr16:18853072 | p.S12G | 3 |
| chr16:18937330 | p.A78T | 3 |
| chr16:18887699 | p.H546R | 3 |
| chr16:18858832 | p.R3623L | 2 |
| chr16:18882778 | p.C3401Y | 2 |
| chr16:18823123 | p.K3583R | 2 |
| chr16:18823323 | p.R1980Q | 2 |
| chr16:18908161 | p.G3103R | 2 |
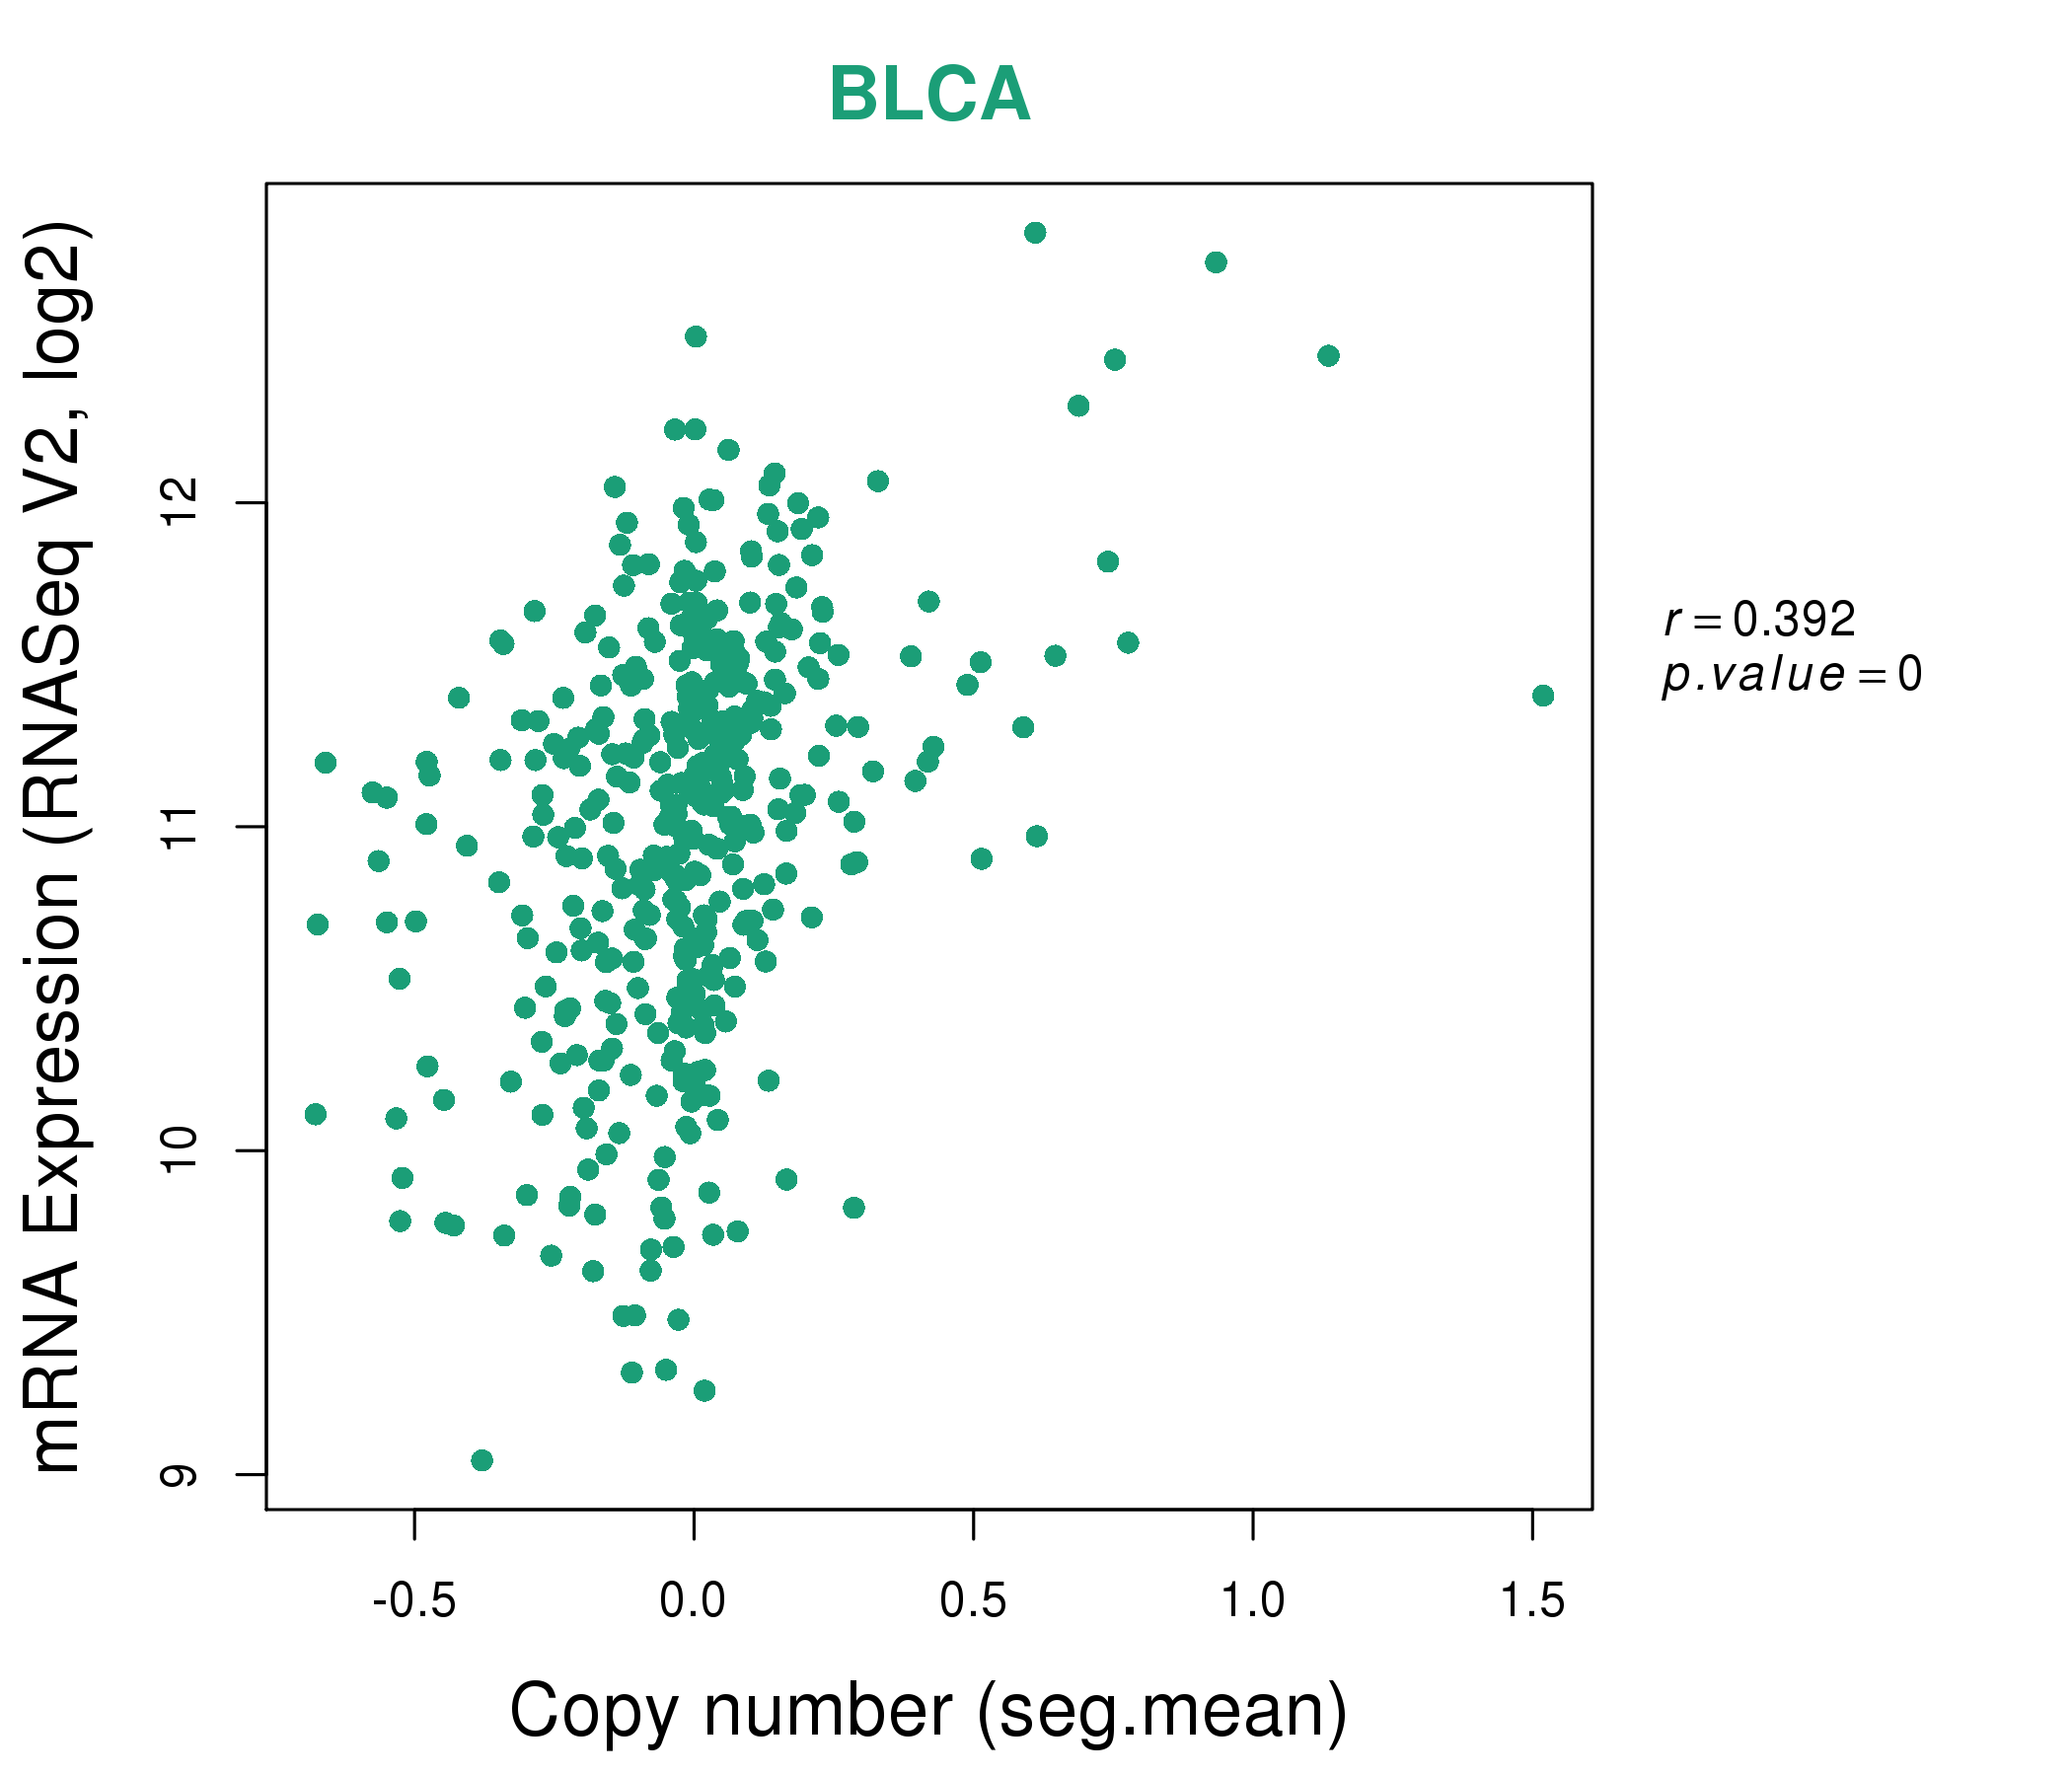
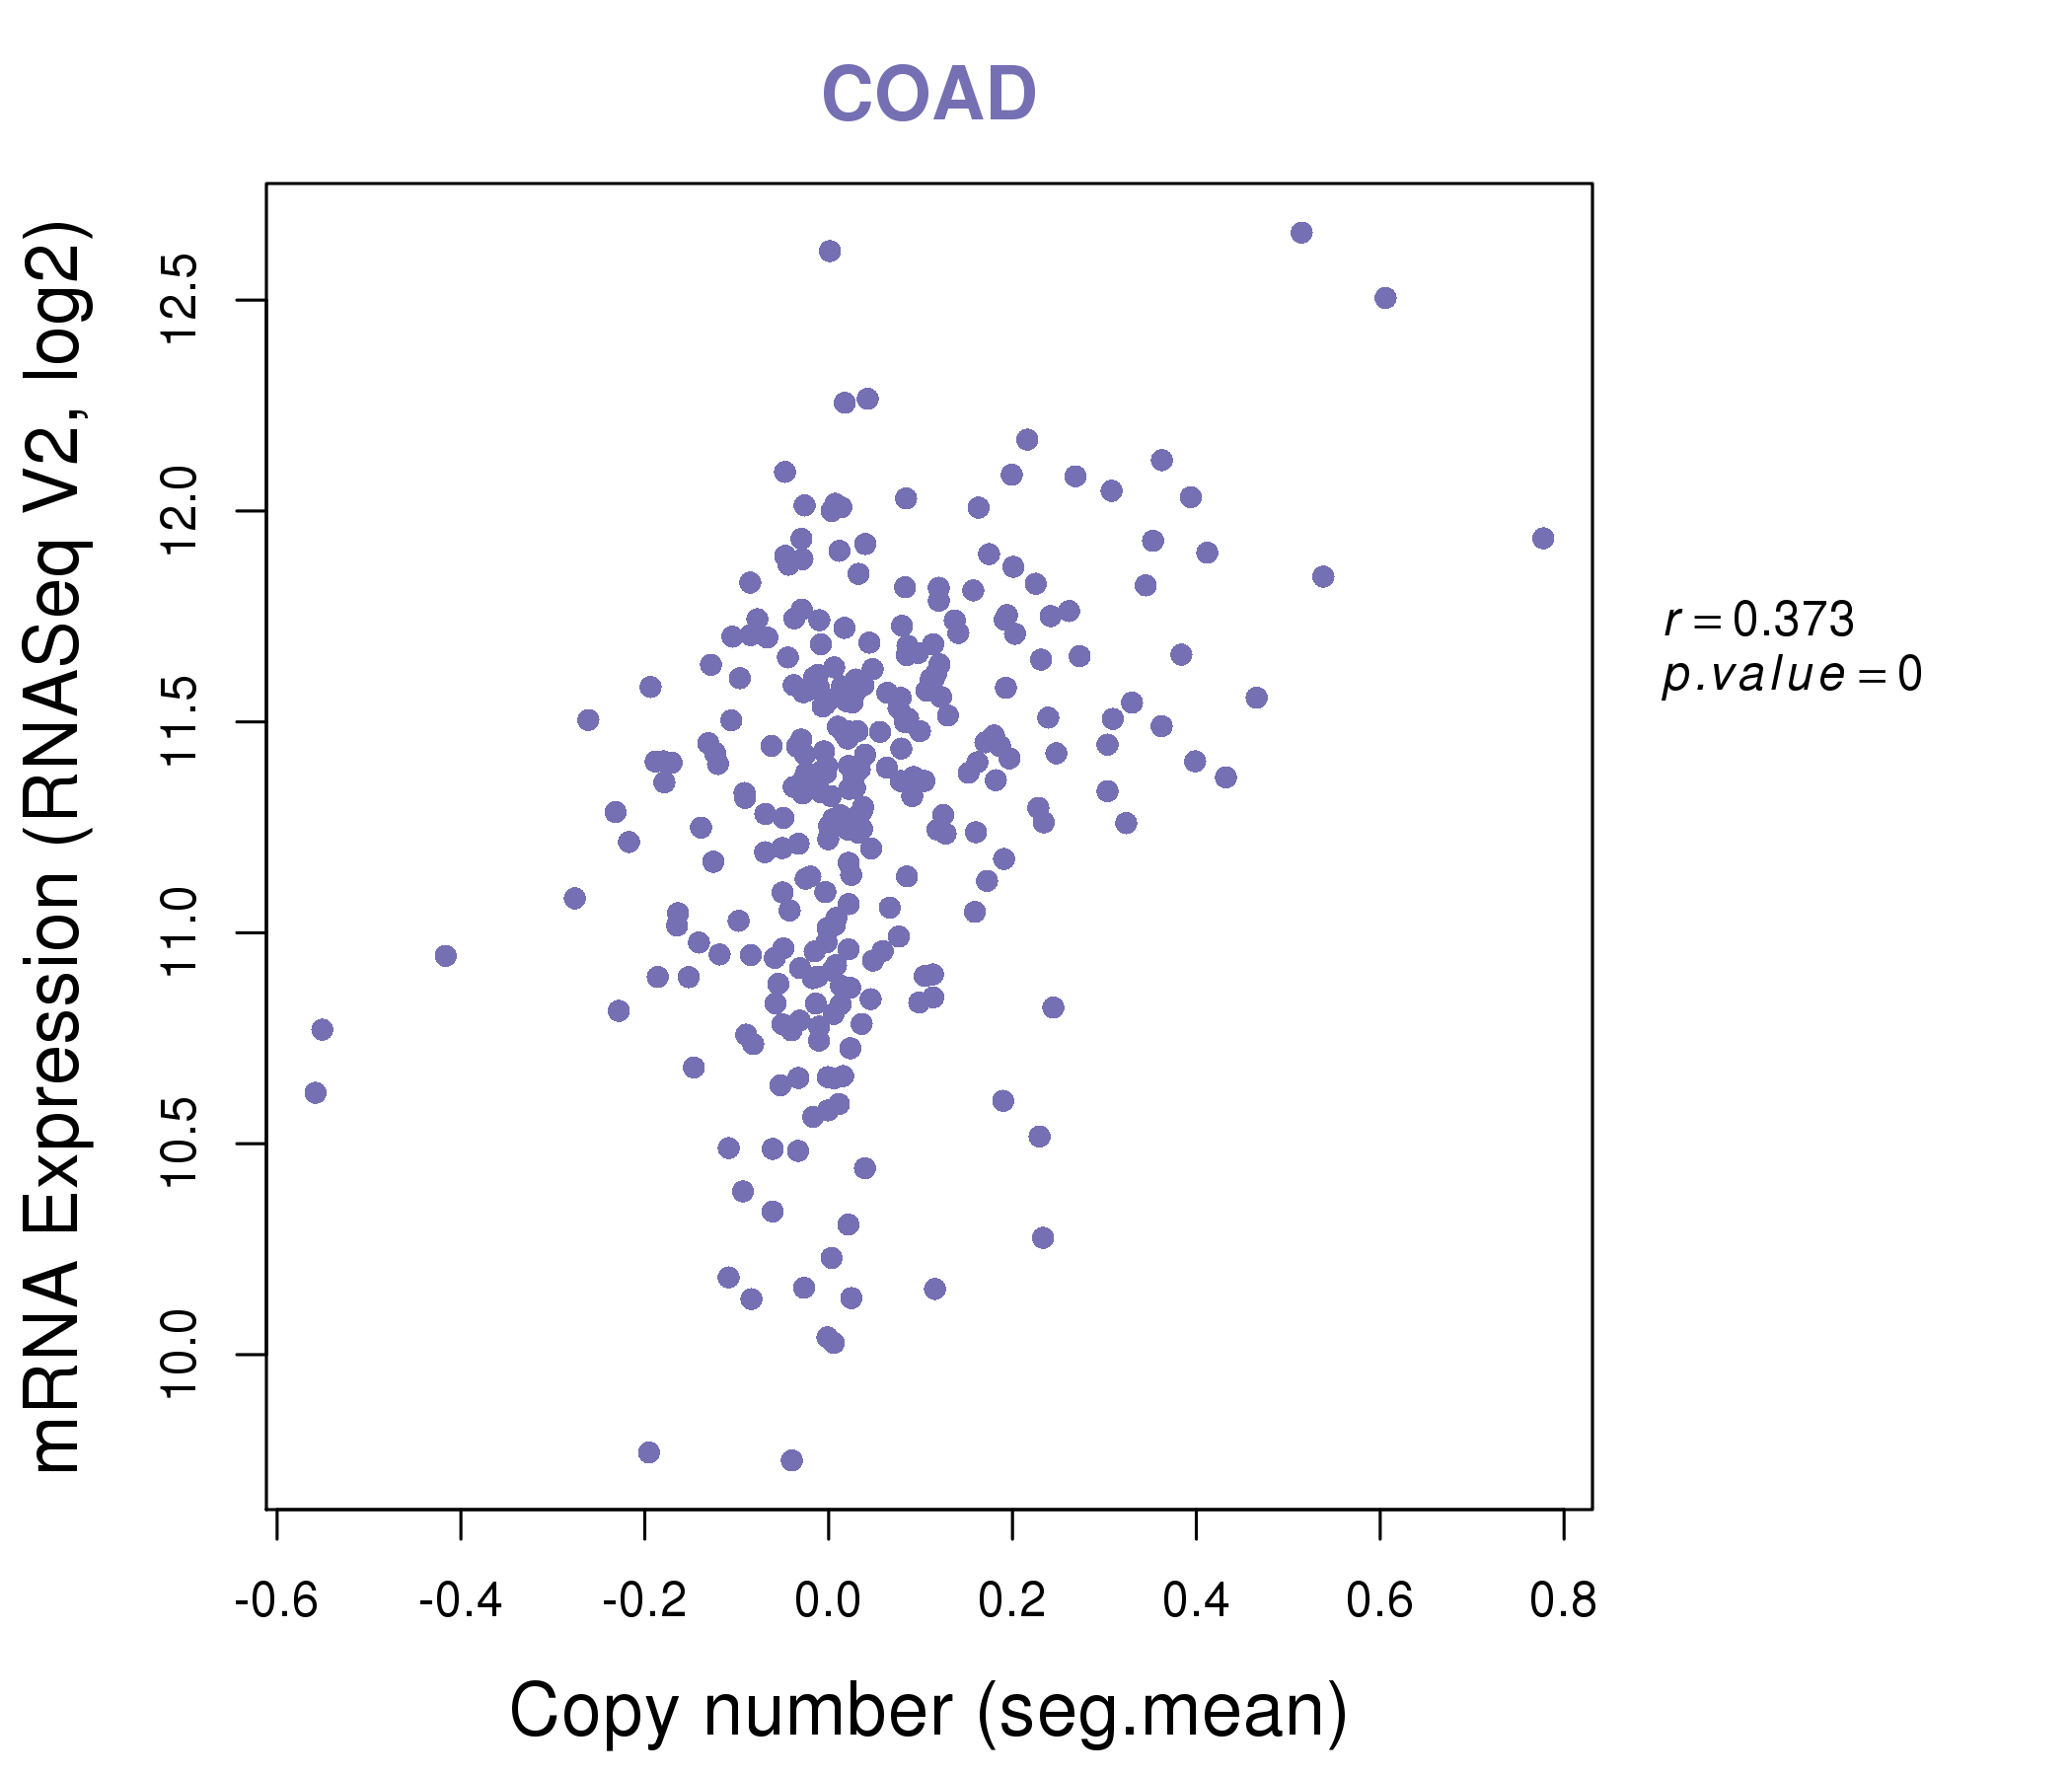
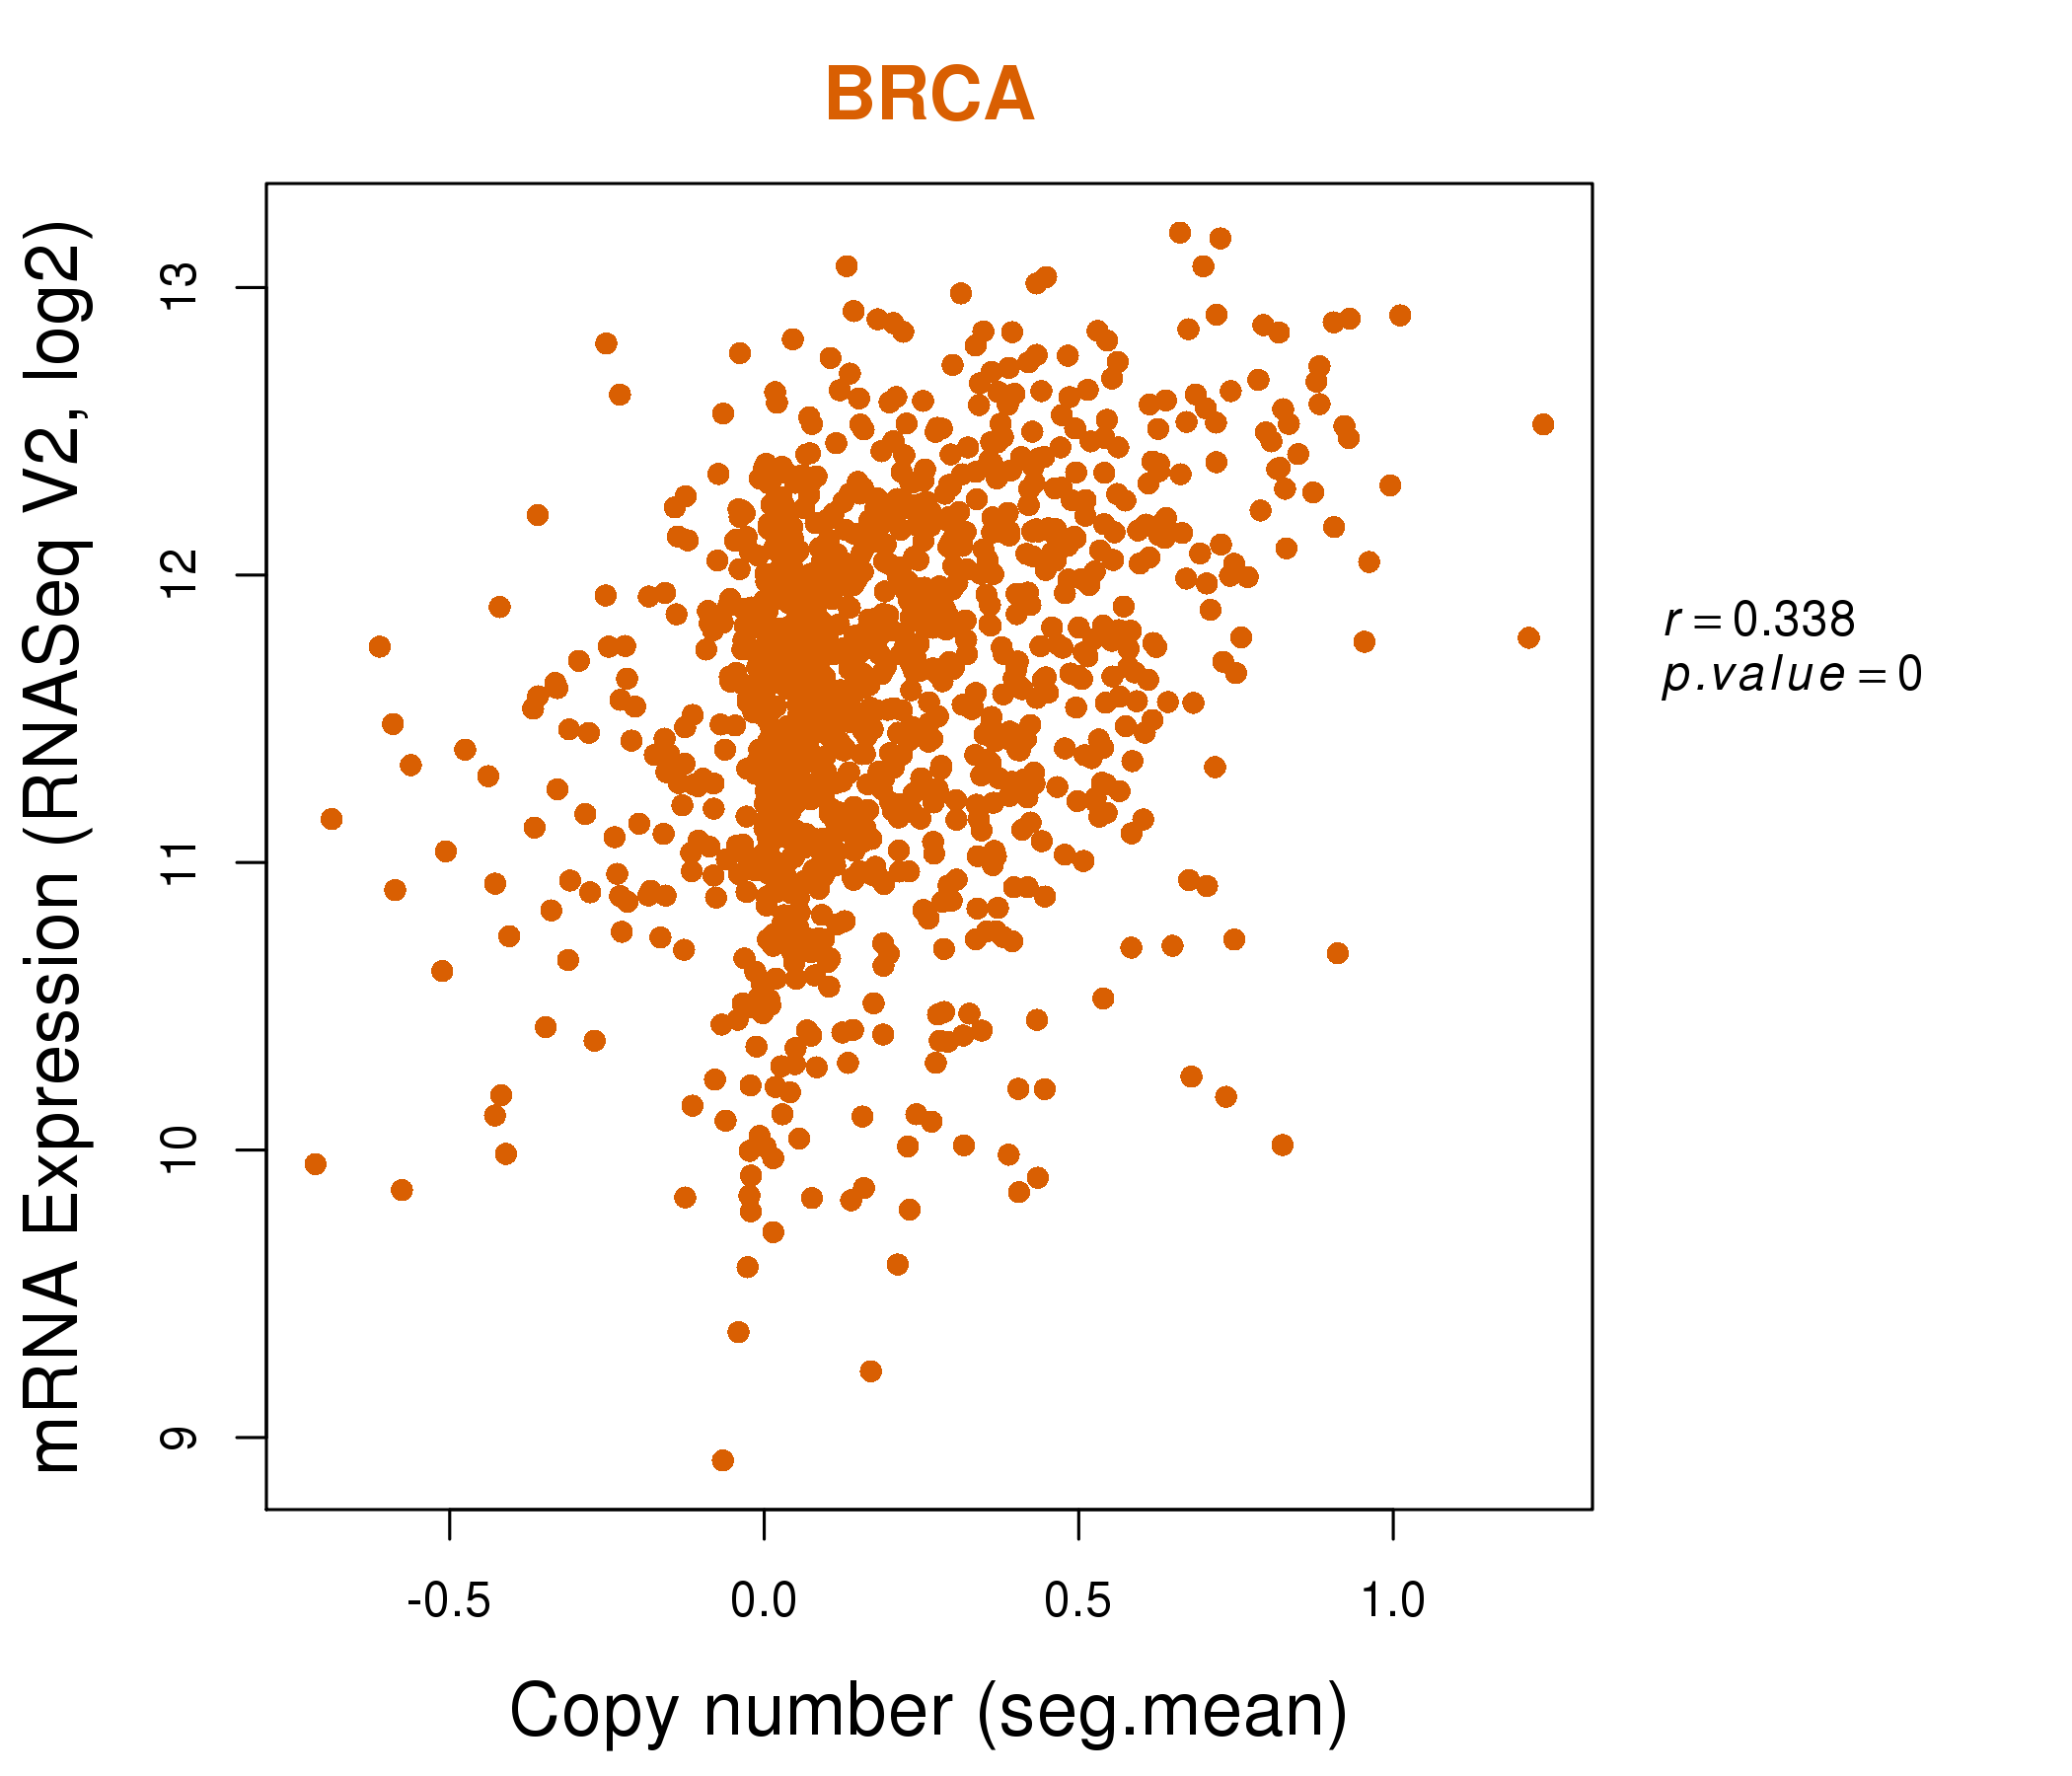
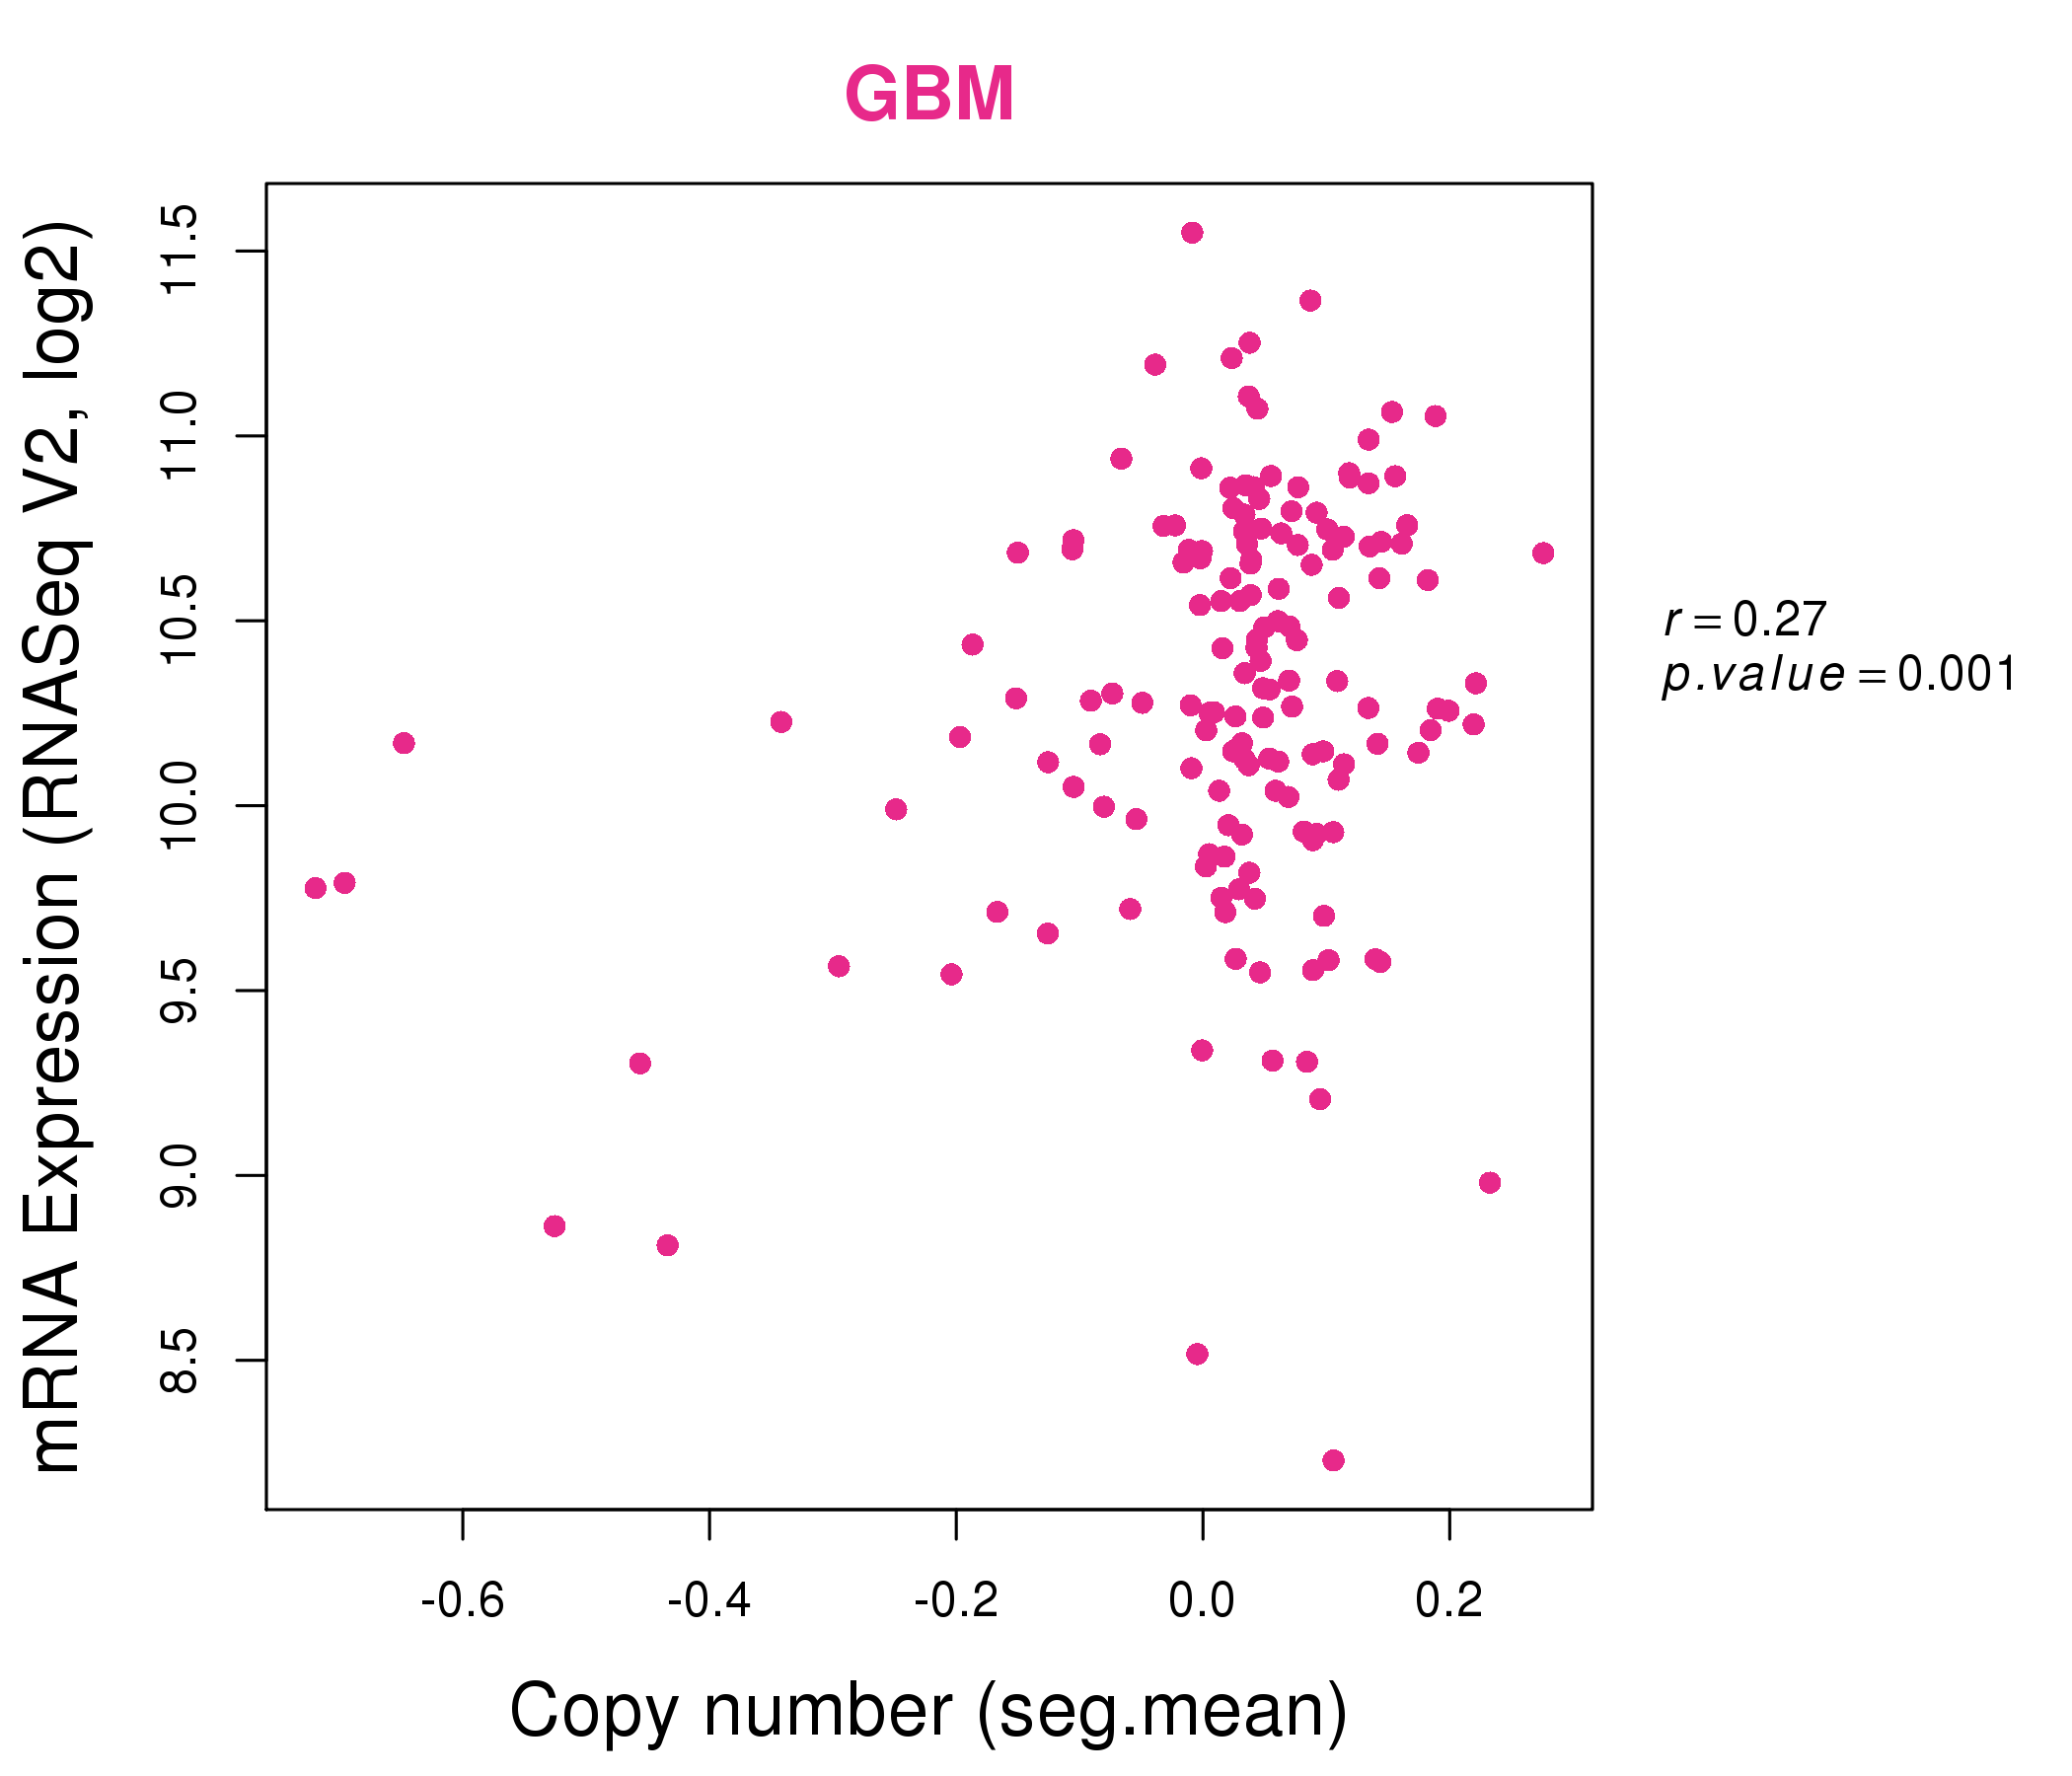
| * Copy number data were extracted from TCGA using R package TCGA-Assembler. The URLs of all public data files on TCGA DCC data server were gathered on Jan-05-2015. Function ProcessCNAData in TCGA-Assembler package was used to obtain gene-level copy number value which is calculated as the average copy number of the genomic region of a gene. |
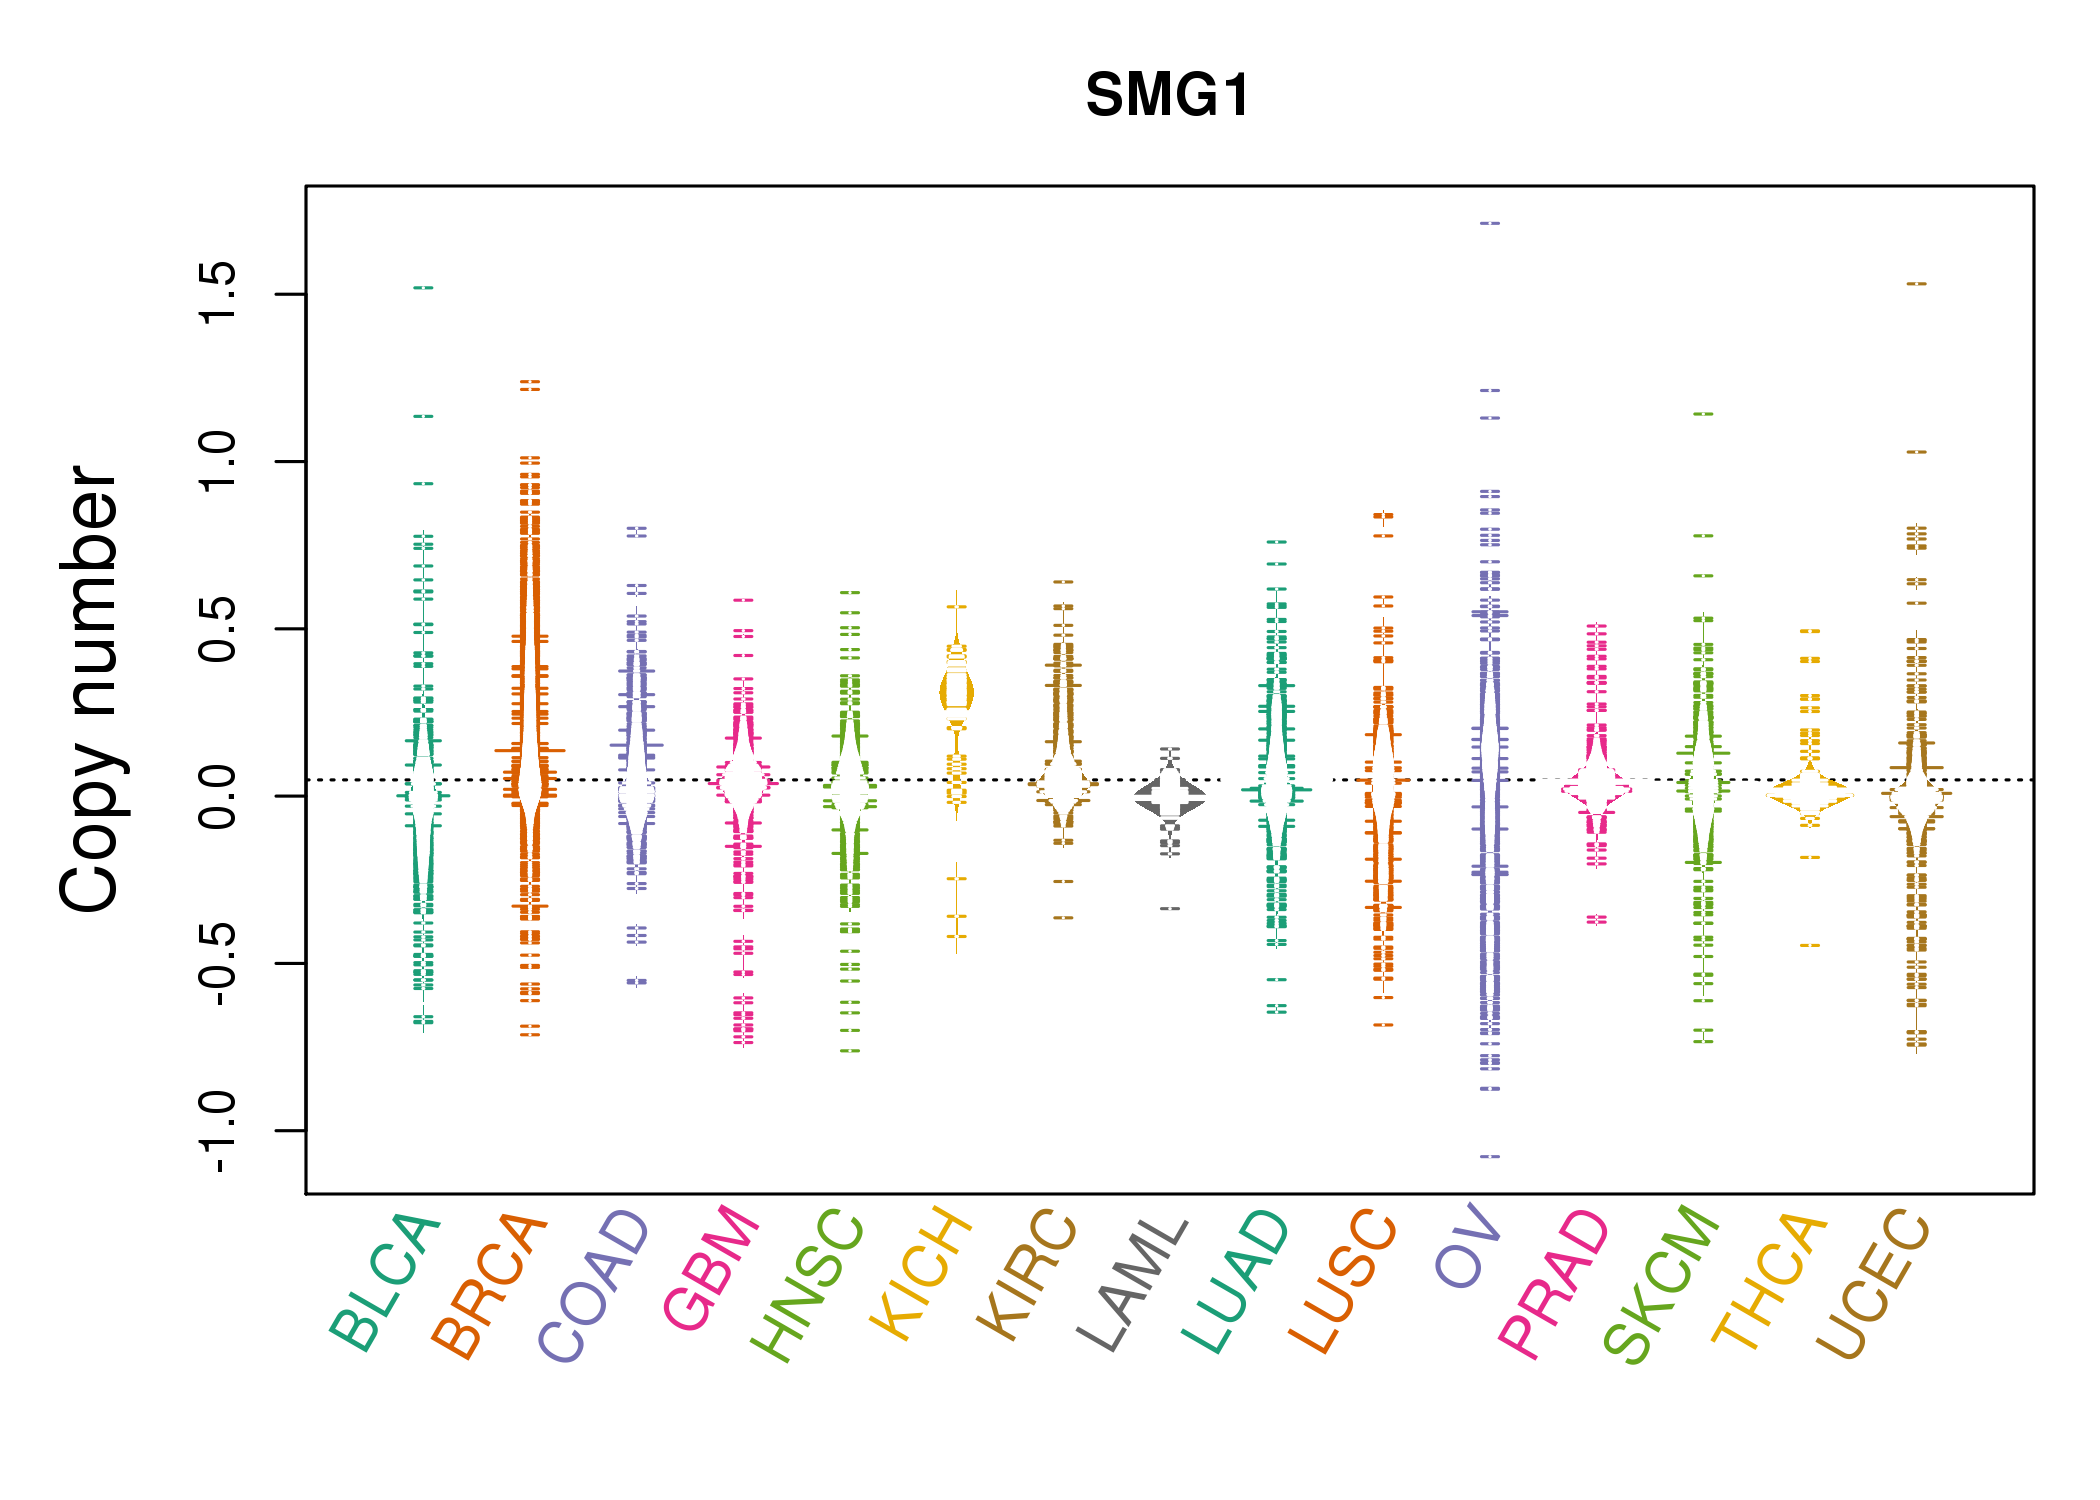 |
| cf) Tissue ID[Tissue type]: BLCA[Bladder Urothelial Carcinoma], BRCA[Breast invasive carcinoma], CESC[Cervical squamous cell carcinoma and endocervical adenocarcinoma], COAD[Colon adenocarcinoma], GBM[Glioblastoma multiforme], Glioma Low Grade, HNSC[Head and Neck squamous cell carcinoma], KICH[Kidney Chromophobe], KIRC[Kidney renal clear cell carcinoma], KIRP[Kidney renal papillary cell carcinoma], LAML[Acute Myeloid Leukemia], LUAD[Lung adenocarcinoma], LUSC[Lung squamous cell carcinoma], OV[Ovarian serous cystadenocarcinoma ], PAAD[Pancreatic adenocarcinoma], PRAD[Prostate adenocarcinoma], SKCM[Skin Cutaneous Melanoma], STAD[Stomach adenocarcinoma], THCA[Thyroid carcinoma], UCEC[Uterine Corpus Endometrial Carcinoma] |
| Top |
| Gene Expression for SMG1 |
| * CCLE gene expression data were extracted from CCLE_Expression_Entrez_2012-10-18.res: Gene-centric RMA-normalized mRNA expression data. |
 |
| * Normalized gene expression data of RNASeqV2 was extracted from TCGA using R package TCGA-Assembler. The URLs of all public data files on TCGA DCC data server were gathered at Jan-05-2015. Only eight cancer types have enough normal control samples for differential expression analysis. (t test, adjusted p<0.05 (using Benjamini-Hochberg FDR)) |
 |
| Top |
| * This plots show the correlation between CNV and gene expression. |
: Open all plots for all cancer types
 |
|
 |
|
| Top |
| Gene-Gene Network Information |
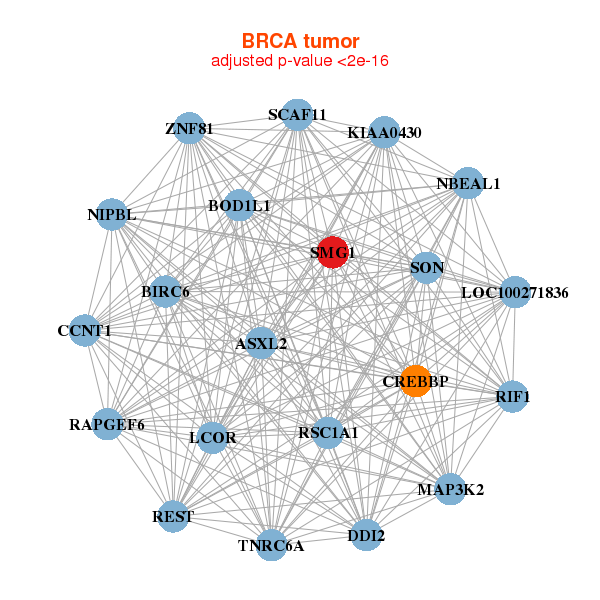
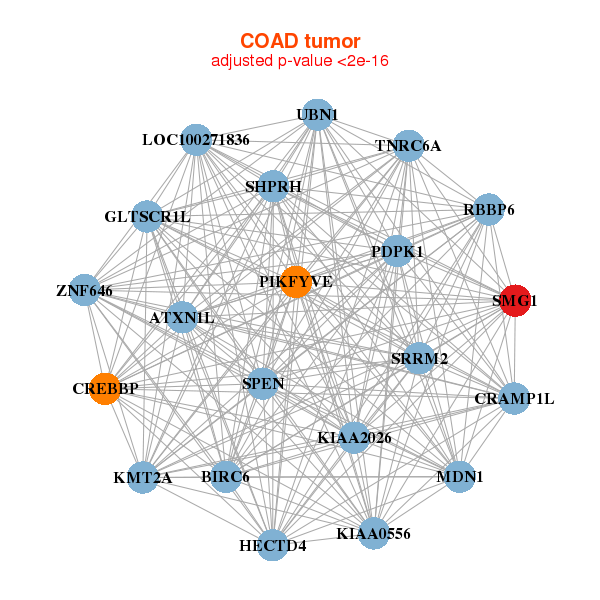
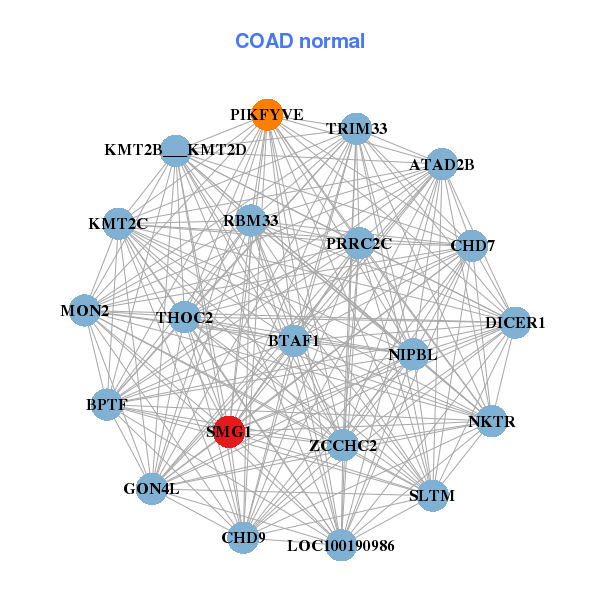
| * Co-Expression network figures were drawn using R package igraph. Only the top 20 genes with the highest correlations were shown. Red circle: input gene, orange circle: cell metabolism gene, sky circle: other gene |
: Open all plots for all cancer types
 |
|
| ASXL2,BIRC6,BOD1L1,CCNT1,CREBBP,DDI2,KIAA0430, LCOR,LOC100271836,MAP3K2,NBEAL1,NIPBL,RAPGEF6,REST, RIF1,RSC1A1,SCAF11,SMG1,SON,TNRC6A,ZNF81 | ASH1L,ATG2B,BIRC6,BRWD1,GPATCH2L,CCNT1,CEP350, CEP97,CHD9,ICE1,EPG5,LCOR,KMT2C,RICTOR, RIF1,LTN1,SMCHD1,SMG1,VPS13A,XRN1,ZKSCAN8 |
 |
|
| ATXN1L,BIRC6,HECTD4,CRAMP1L,CREBBP,GLTSCR1L,KIAA0556, KIAA2026,LOC100271836,MDN1,KMT2A,PDPK1,PIKFYVE,RBBP6, SHPRH,SMG1,SPEN,SRRM2,TNRC6A,UBN1,ZNF646 | ATAD2B,PRRC2C,BPTF,BTAF1,CHD7,CHD9,DICER1, GON4L,LOC100190986,KMT2B___KMT2D,KMT2C,MON2,NIPBL,NKTR, PIKFYVE,RBM33,SLTM,SMG1,THOC2,TRIM33,ZCCHC2 |

| * Co-Expression network figures were drawn using R package igraph. Only the top 20 genes with the highest correlations were shown. Red circle: input gene, orange circle: cell metabolism gene, sky circle: other gene |
: Open all plots for all cancer types
| Top |
: Open all interacting genes' information including KEGG pathway for all interacting genes from DAVID
| Top |
| Pharmacological Information for SMG1 |
| There's no related Drug. |
| Top |
| Cross referenced IDs for SMG1 |
| * We obtained these cross-references from Uniprot database. It covers 150 different DBs, 18 categories. http://www.uniprot.org/help/cross_references_section |
: Open all cross reference information
|
Copyright © 2016-Present - The Univsersity of Texas Health Science Center at Houston @ |