|
||||||||||||||||||||||||||||||||||||||||||||||||||||||||||||||||||||||||||||||||||||||||||||||||||||||||||||||||||||||||||||||||||||||||||||||||||||||||||||||||||||||||||||||||||||||||||||||||||||||||||||||||||||||||||||||||||||||||||||||||||||||||||||||||||||||||||||||||||||||||||||||||||||||||||||||||||||||||||
| |
| Phenotypic Information (metabolism pathway, cancer, disease, phenome) |
| |
| |
| Gene-Gene Network Information: Co-Expression Network, Interacting Genes & KEGG |
| |
|


| Gene Summary for NCOA6 |
| Basic gene info. | Gene symbol | NCOA6 |
| Gene name | nuclear receptor coactivator 6 | |
| Synonyms | AIB3|ASC2|NRC|PRIP|RAP250|TRBP | |
| Cytomap | UCSC genome browser: 20q11 | |
| Genomic location | chr20 :33302577-33413433 | |
| Type of gene | protein-coding | |
| RefGenes | NM_001242539.1, NM_014071.3, | |
| Ensembl id | ENSG00000198646 | |
| Description | NRC RAP250PPAR-interacting proteinactivating signal cointegrator 2activating signal cointegrator-2amplified in breast cancer protein 3amplified in breast cancer-3 proteincancer-amplified transcriptional coactivator ASC-2nuclear receptor coactivator | |
| Modification date | 20141207 | |
| dbXrefs | MIM : 605299 | |
| HGNC : HGNC | ||
| Ensembl : ENSG00000198646 | ||
| HPRD : 05599 | ||
| Vega : OTTHUMG00000032311 | ||
| Protein | UniProt: Q14686 go to UniProt's Cross Reference DB Table | |
| Expression | CleanEX: HS_NCOA6 | |
| BioGPS: 23054 | ||
| Gene Expression Atlas: ENSG00000198646 | ||
| The Human Protein Atlas: ENSG00000198646 | ||
| Pathway | NCI Pathway Interaction Database: NCOA6 | |
| KEGG: NCOA6 | ||
| REACTOME: NCOA6 | ||
| ConsensusPathDB | ||
| Pathway Commons: NCOA6 | ||
| Metabolism | MetaCyc: NCOA6 | |
| HUMANCyc: NCOA6 | ||
| Regulation | Ensembl's Regulation: ENSG00000198646 | |
| miRBase: chr20 :33,302,577-33,413,433 | ||
| TargetScan: NM_001242539 | ||
| cisRED: ENSG00000198646 | ||
| Context | iHOP: NCOA6 | |
| cancer metabolism search in PubMed: NCOA6 | ||
| UCL Cancer Institute: NCOA6 | ||
| Assigned class in ccmGDB | A - This gene has a literature evidence and it belongs to cancer gene. | |
| References showing role of NCOA6 in cancer cell metabolism | 1. Srihari S, Ragan MA (2013) Systematic tracking of dysregulated modules identifies novel genes in cancer. Bioinformatics: btt191. go to article | |
| Top |
| Phenotypic Information for NCOA6(metabolism pathway, cancer, disease, phenome) |
| Cancer | CGAP: NCOA6 |
| Familial Cancer Database: NCOA6 | |
| * This gene is included in those cancer gene databases. |
|
|
|
|
|
| . | ||||||||||||||||||||||||||||||||||||||||||||||||||||||||||||||||||||||||||||||||||||||||||||||||||||||||||||||||||||||||||||||||||||||||||||||||||||||||||||||||||||||||||||||||||||||||||||||||||||||||||||||||||||||||||||||||||||||||||||||||||||||||||||||||||||||||||||||||||||||||||||||||||||||||||||||||||||
Oncogene 1 | Significant driver gene in | |||||||||||||||||||||||||||||||||||||||||||||||||||||||||||||||||||||||||||||||||||||||||||||||||||||||||||||||||||||||||||||||||||||||||||||||||||||||||||||||||||||||||||||||||||||||||||||||||||||||||||||||||||||||||||||||||||||||||||||||||||||||||||||||||||||||||||||||||||||||||||||||||||||||||||||||||||||||||
| cf) number; DB name 1 Oncogene; http://nar.oxfordjournals.org/content/35/suppl_1/D721.long, 2 Tumor Suppressor gene; https://bioinfo.uth.edu/TSGene/, 3 Cancer Gene Census; http://www.nature.com/nrc/journal/v4/n3/abs/nrc1299.html, 4 CancerGenes; http://nar.oxfordjournals.org/content/35/suppl_1/D721.long, 5 Network of Cancer Gene; http://ncg.kcl.ac.uk/index.php, 1Therapeutic Vulnerabilities in Cancer; http://cbio.mskcc.org/cancergenomics/statius/ |
| REACTOME_METABOLISM_OF_LIPIDS_AND_LIPOPROTEINS | |
| OMIM | 605299; gene. |
| Orphanet | |
| Disease | KEGG Disease: NCOA6 |
| MedGen: NCOA6 (Human Medical Genetics with Condition) | |
| ClinVar: NCOA6 | |
| Phenotype | MGI: NCOA6 (International Mouse Phenotyping Consortium) |
| PhenomicDB: NCOA6 | |
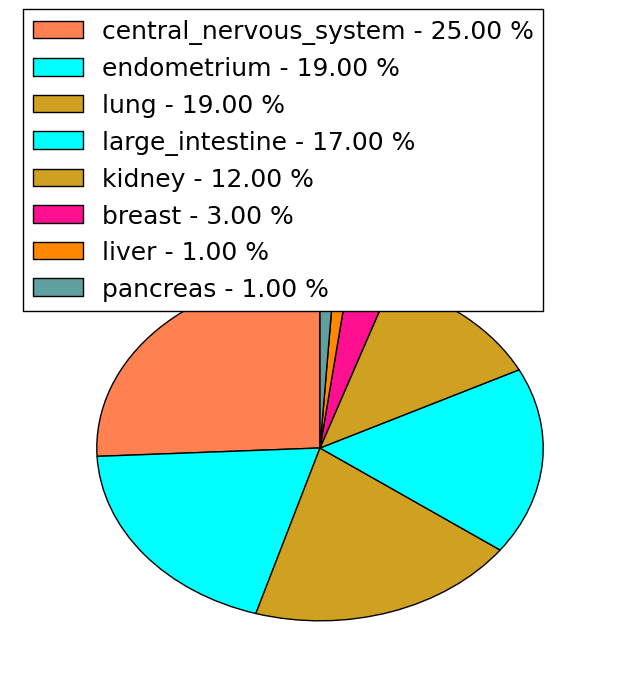
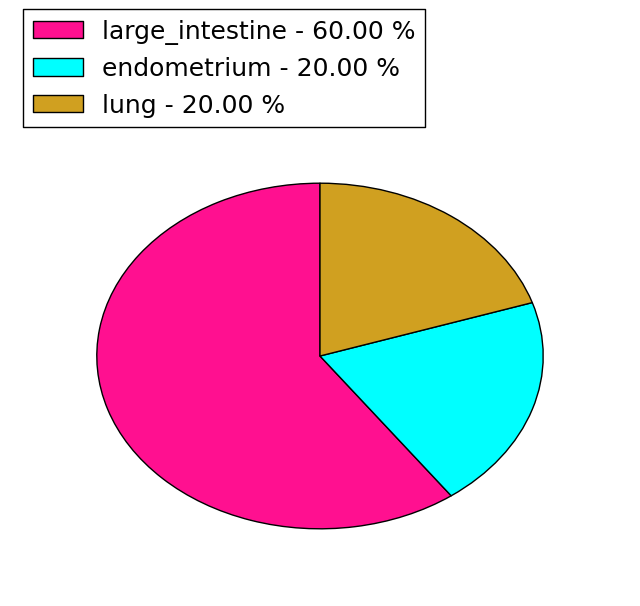
| Mutations for NCOA6 |
| * Under tables are showing count per each tissue to give us broad intuition about tissue specific mutation patterns.You can go to the detailed page for each mutation database's web site. |
| - Statistics for Tissue and Mutation type | Top |
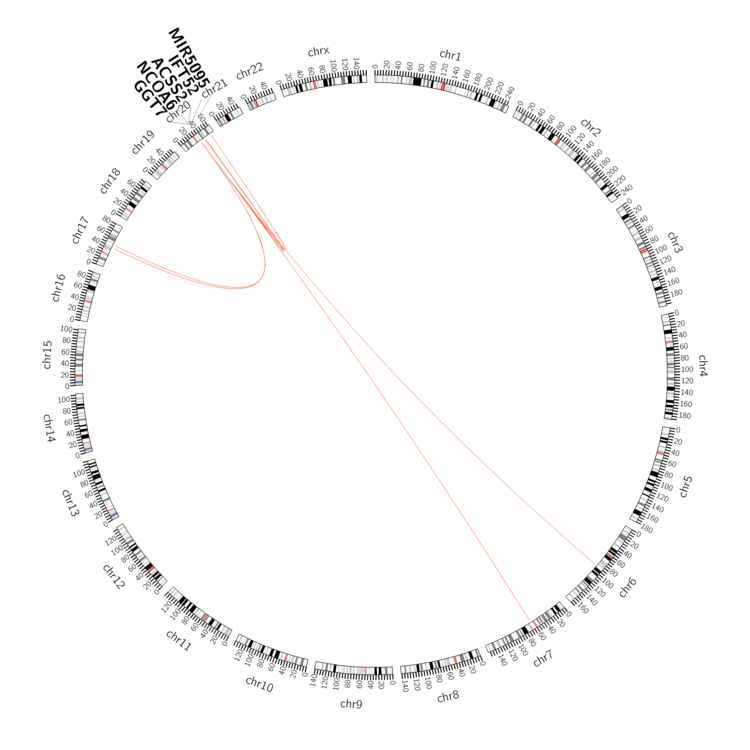 |
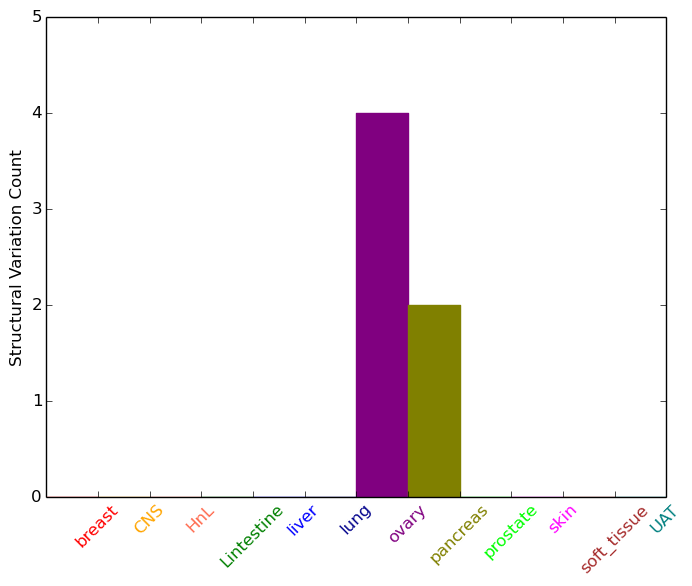
| - For Inter-chromosomal Variations |
| * Inter-chromosomal variantions includes 'interchromosomal amplicon to amplicon', 'interchromosomal amplicon to non-amplified dna', 'interchromosomal insertion', 'Interchromosomal unknown type'. |
 |
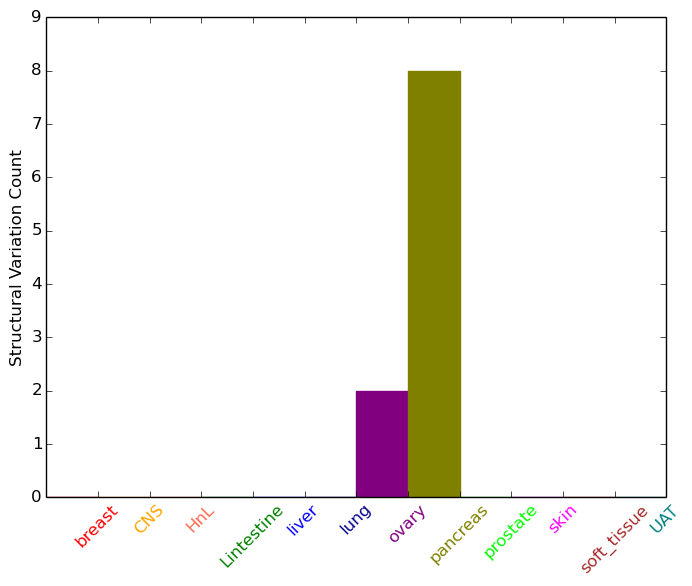
| - For Intra-chromosomal Variations |
| * Intra-chromosomal variantions includes 'intrachromosomal amplicon to amplicon', 'intrachromosomal amplicon to non-amplified dna', 'intrachromosomal deletion', 'intrachromosomal fold-back inversion', 'intrachromosomal inversion', 'intrachromosomal tandem duplication', 'Intrachromosomal unknown type', 'intrachromosomal with inverted orientation', 'intrachromosomal with non-inverted orientation'. |
 |
| Sample | Symbol_a | Chr_a | Start_a | End_a | Symbol_b | Chr_b | Start_b | End_b |
| ovary | NCOA6 | chr20 | 33332011 | 33332031 | chr6 | 90601833 | 90601853 | |
| ovary | NCOA6 | chr20 | 33397868 | 33397888 | NCOA6 | chr20 | 33398463 | 33398483 |
| pancreas | NCOA6 | chr20 | 33314279 | 33314299 | CTCFL | chr20 | 56092786 | 56092806 |
| pancreas | NCOA6 | chr20 | 33319999 | 33320019 | CTCFL | chr20 | 56088931 | 56088951 |
| pancreas | NCOA6 | chr20 | 33361158 | 33361178 | ACSS2 | chr20 | 33512160 | 33512180 |
| pancreas | NCOA6 | chr20 | 33375061 | 33375081 | IFT52 | chr20 | 42266155 | 42266175 |
| pancreas | NCOA6 | chr20 | 33381251 | 33381271 | chr20 | 56101793 | 56101813 | |
| pancreas | NCOA6 | chr20 | 33393519 | 33393539 | MIR5095 | chr20 | 55926472 | 55926492 |
| pancreas | NCOA6 | chr20 | 33402436 | 33402456 | PKIG | chr20 | 43167277 | 43167297 |
| pancreas | NCOA6 | chr20 | 33403104 | 33403124 | GGT7 | chr20 | 33443828 | 33443848 |
| cf) Tissue number; Tissue name (1;Breast, 2;Central_nervous_system, 3;Haematopoietic_and_lymphoid_tissue, 4;Large_intestine, 5;Liver, 6;Lung, 7;Ovary, 8;Pancreas, 9;Prostate, 10;Skin, 11;Soft_tissue, 12;Upper_aerodigestive_tract) |
| * From mRNA Sanger sequences, Chitars2.0 arranged chimeric transcripts. This table shows NCOA6 related fusion information. |
| ID | Head Gene | Tail Gene | Accession | Gene_a | qStart_a | qEnd_a | Chromosome_a | tStart_a | tEnd_a | Gene_a | qStart_a | qEnd_a | Chromosome_a | tStart_a | tEnd_a |
| BF992646 | NCOA6 | 9 | 177 | 20 | 33329280 | 33329448 | NCOA6 | 172 | 271 | 20 | 33328930 | 33329029 | |
| AL706432 | PTTG1IP | 2 | 488 | 21 | 46270424 | 46270910 | NCOA6 | 485 | 602 | 20 | 33345774 | 33345891 | |
| AA535712 | NDE1 | 1 | 212 | 16 | 15796996 | 15797207 | NCOA6 | 210 | 400 | 20 | 33303130 | 33315213 | |
| BF572568 | ZNF343 | 1 | 81 | 20 | 2505069 | 2505149 | NCOA6 | 80 | 642 | 20 | 33302866 | 33324564 | |
| BF985843 | NCOA6 | 1 | 192 | 20 | 33335528 | 33335720 | PPIL4 | 177 | 404 | 6 | 149836664 | 149836893 | |
| Top |
| Mutation type/ Tissue ID | brca | cns | cerv | endome | haematopo | kidn | Lintest | liver | lung | ns | ovary | pancre | prost | skin | stoma | thyro | urina | |||
| Total # sample | 3 | 2 | 1 | 1 | ||||||||||||||||
| GAIN (# sample) | 2 | 2 | 1 | 1 | ||||||||||||||||
| LOSS (# sample) | 1 | 1 |
| cf) Tissue ID; Tissue type (1; Breast, 2; Central_nervous_system, 3; Cervix, 4; Endometrium, 5; Haematopoietic_and_lymphoid_tissue, 6; Kidney, 7; Large_intestine, 8; Liver, 9; Lung, 10; NS, 11; Ovary, 12; Pancreas, 13; Prostate, 14; Skin, 15; Stomach, 16; Thyroid, 17; Urinary_tract) |
| Top |
|
 |
| Top |
| Stat. for Non-Synonymous SNVs (# total SNVs=165) | (# total SNVs=63) |
 |  |
(# total SNVs=5) | (# total SNVs=0) |
 |
| Top |
| * When you move the cursor on each content, you can see more deailed mutation information on the Tooltip. Those are primary_site,primary_histology,mutation(aa),pubmedID. |
| GRCh37 position | Mutation(aa) | Unique sampleID count |
| chr20:33345744-33345744 | p.Q269Q | 45 |
| chr20:33329591-33329591 | p.S1490L | 4 |
| chr20:33328653-33328653 | p.S1803P | 4 |
| chr20:33345756-33345756 | p.Q265Q | 3 |
| chr20:33328934-33328934 | p.S1709Y | 3 |
| chr20:33330093-33330093 | p.R1323W | 3 |
| chr20:33330882-33330882 | p.P1060S | 3 |
| chr20:33356323-33356323 | p.M153R | 3 |
| chr20:33345899-33345899 | p.D218N | 3 |
| chr20:33315155-33315155 | p.R2019Q | 3 |
| Top |
|
 |
| Point Mutation/ Tissue ID | 1 | 2 | 3 | 4 | 5 | 6 | 7 | 8 | 9 | 10 | 11 | 12 | 13 | 14 | 15 | 16 | 17 | 18 | 19 | 20 |
| # sample | 5 | 6 | 31 | 1 | 5 | 7 | 3 | 17 | 10 | 5 | 22 | 14 | 1 | 21 | ||||||
| # mutation | 5 | 6 | 31 | 1 | 6 | 8 | 3 | 21 | 12 | 5 | 25 | 15 | 1 | 32 | ||||||
| nonsynonymous SNV | 3 | 6 | 27 | 1 | 5 | 7 | 1 | 15 | 7 | 5 | 21 | 9 | 25 | |||||||
| synonymous SNV | 2 | 4 | 1 | 1 | 2 | 6 | 5 | 4 | 6 | 1 | 7 |
| cf) Tissue ID; Tissue type (1; BLCA[Bladder Urothelial Carcinoma], 2; BRCA[Breast invasive carcinoma], 3; CESC[Cervical squamous cell carcinoma and endocervical adenocarcinoma], 4; COAD[Colon adenocarcinoma], 5; GBM[Glioblastoma multiforme], 6; Glioma Low Grade, 7; HNSC[Head and Neck squamous cell carcinoma], 8; KICH[Kidney Chromophobe], 9; KIRC[Kidney renal clear cell carcinoma], 10; KIRP[Kidney renal papillary cell carcinoma], 11; LAML[Acute Myeloid Leukemia], 12; LUAD[Lung adenocarcinoma], 13; LUSC[Lung squamous cell carcinoma], 14; OV[Ovarian serous cystadenocarcinoma ], 15; PAAD[Pancreatic adenocarcinoma], 16; PRAD[Prostate adenocarcinoma], 17; SKCM[Skin Cutaneous Melanoma], 18:STAD[Stomach adenocarcinoma], 19:THCA[Thyroid carcinoma], 20:UCEC[Uterine Corpus Endometrial Carcinoma]) |
| Top |
| * We represented just top 10 SNVs. When you move the cursor on each content, you can see more deailed mutation information on the Tooltip. Those are primary_site, primary_histology, mutation(aa), pubmedID. |
| Genomic Position | Mutation(aa) | Unique sampleID count |
| chr20:33328653 | p.S1803P | 4 |
| chr20:33345756 | p.Q265Q,NCOA6 | 3 |
| chr20:33342596 | p.F435F,NCOA6 | 2 |
| chr20:33345727 | p.Q264Q,NCOA6 | 2 |
| chr20:33331098 | p.P1063L | 2 |
| chr20:33328934 | p.G611C,NCOA6 | 2 |
| chr20:33329591 | p.S1709Y | 2 |
| chr20:33315155 | p.R1026Q,NCOA6 | 2 |
| chr20:33345759 | p.S535L,NCOA6 | 2 |
| chr20:33330015 | p.P988T | 2 |
| * Copy number data were extracted from TCGA using R package TCGA-Assembler. The URLs of all public data files on TCGA DCC data server were gathered on Jan-05-2015. Function ProcessCNAData in TCGA-Assembler package was used to obtain gene-level copy number value which is calculated as the average copy number of the genomic region of a gene. |
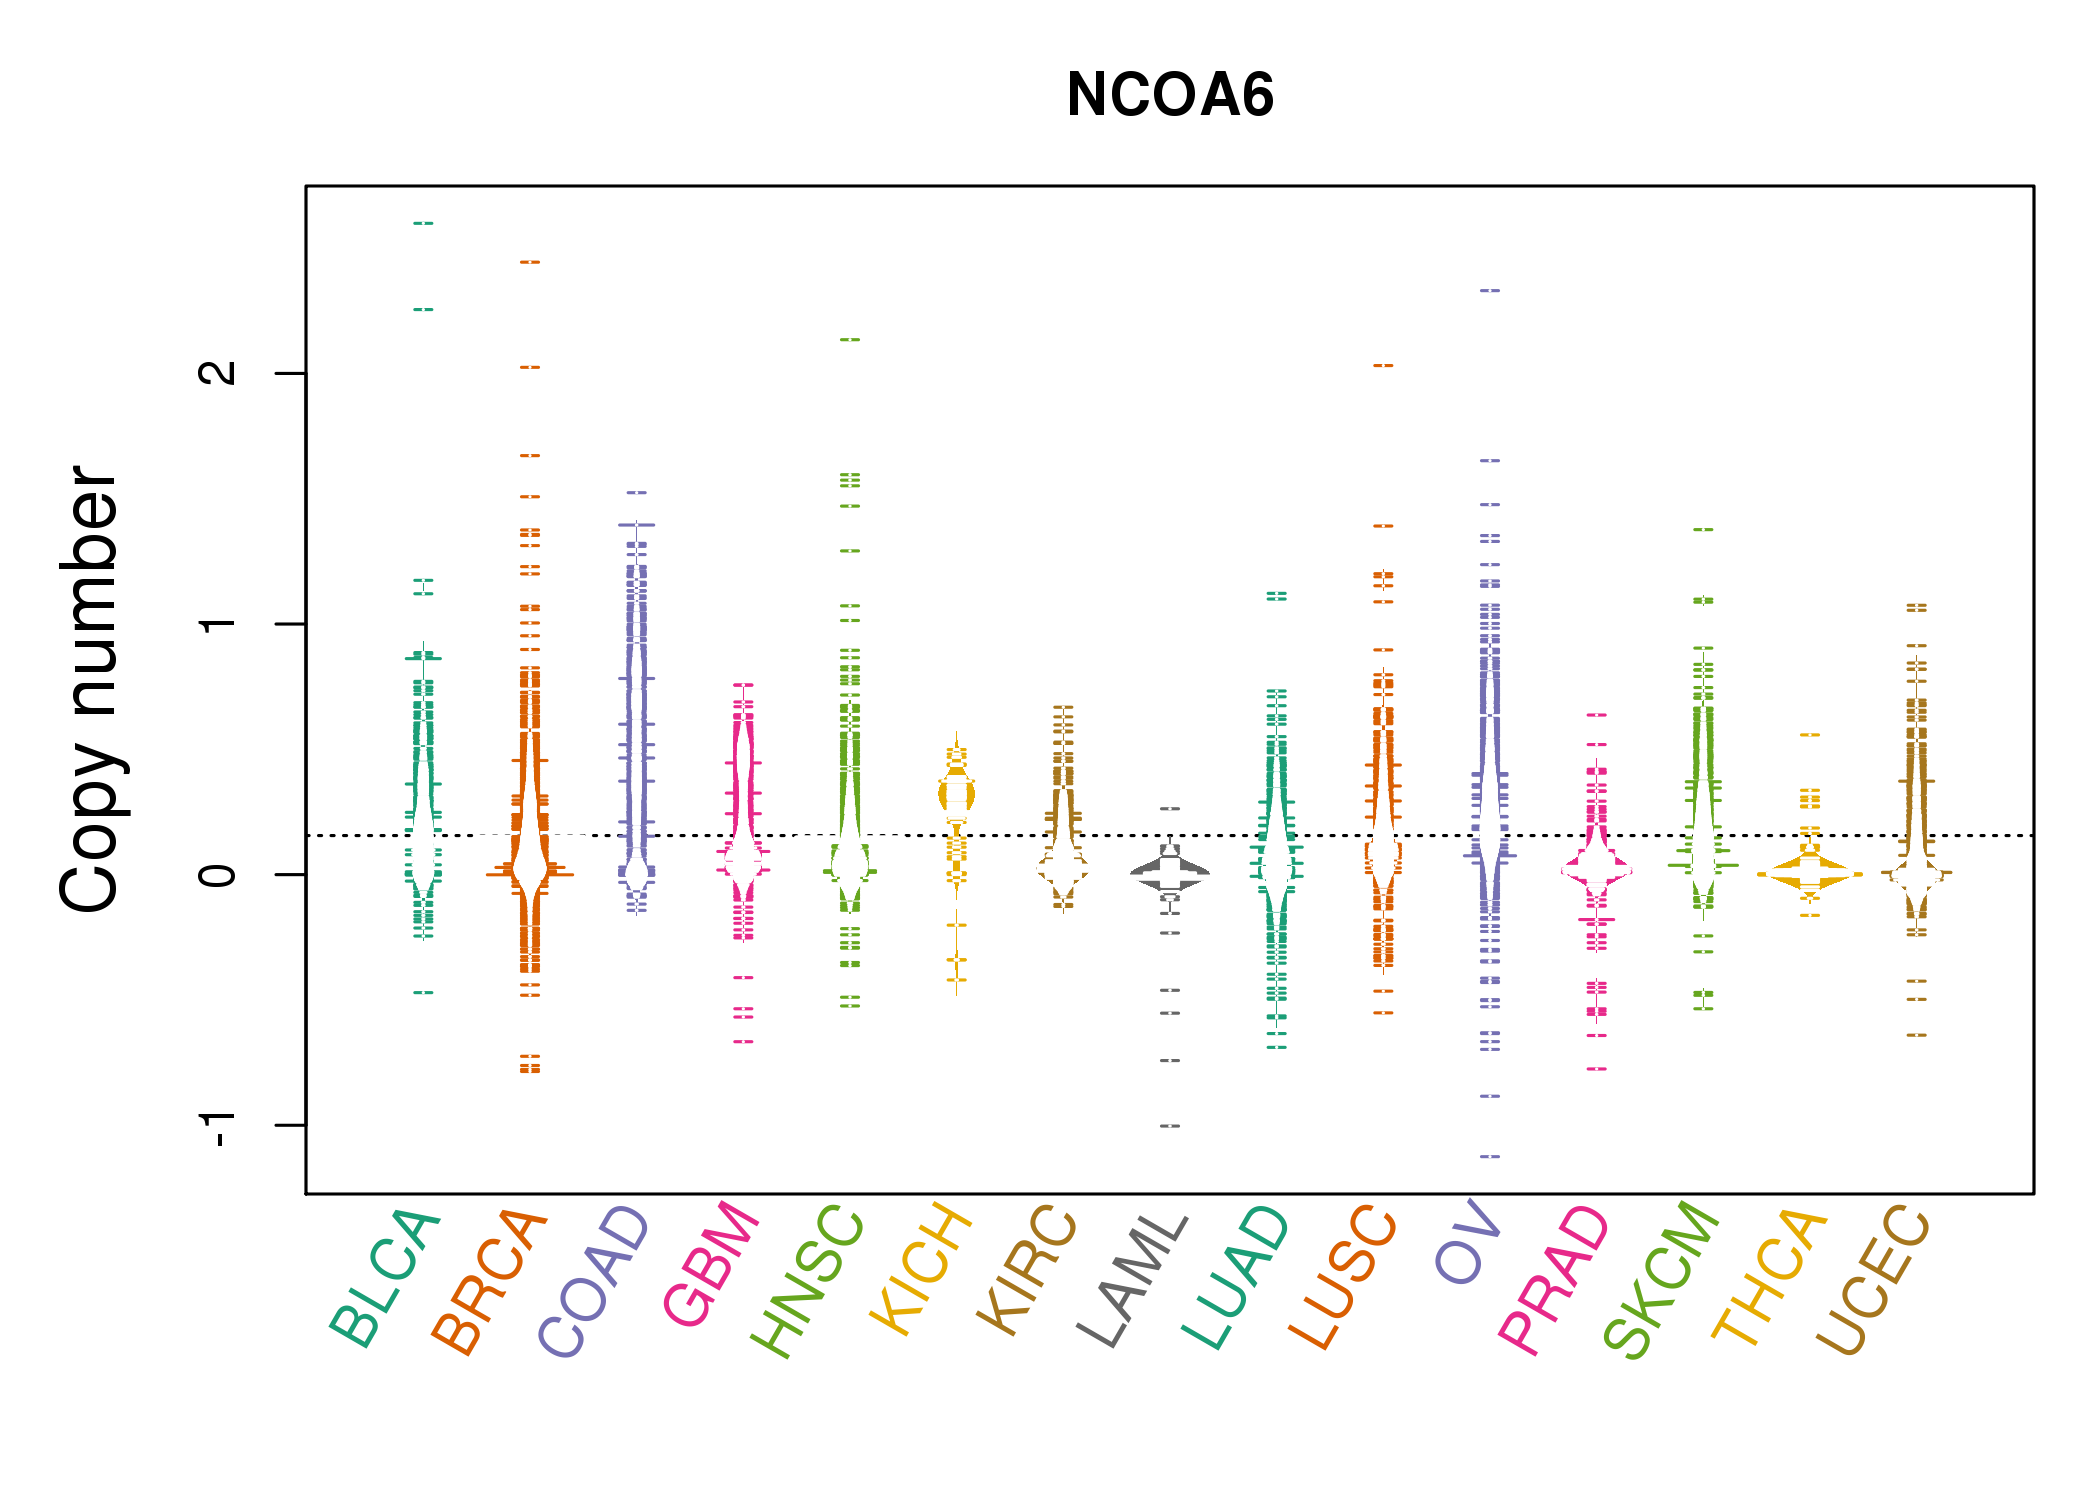 |
| cf) Tissue ID[Tissue type]: BLCA[Bladder Urothelial Carcinoma], BRCA[Breast invasive carcinoma], CESC[Cervical squamous cell carcinoma and endocervical adenocarcinoma], COAD[Colon adenocarcinoma], GBM[Glioblastoma multiforme], Glioma Low Grade, HNSC[Head and Neck squamous cell carcinoma], KICH[Kidney Chromophobe], KIRC[Kidney renal clear cell carcinoma], KIRP[Kidney renal papillary cell carcinoma], LAML[Acute Myeloid Leukemia], LUAD[Lung adenocarcinoma], LUSC[Lung squamous cell carcinoma], OV[Ovarian serous cystadenocarcinoma ], PAAD[Pancreatic adenocarcinoma], PRAD[Prostate adenocarcinoma], SKCM[Skin Cutaneous Melanoma], STAD[Stomach adenocarcinoma], THCA[Thyroid carcinoma], UCEC[Uterine Corpus Endometrial Carcinoma] |
| Top |
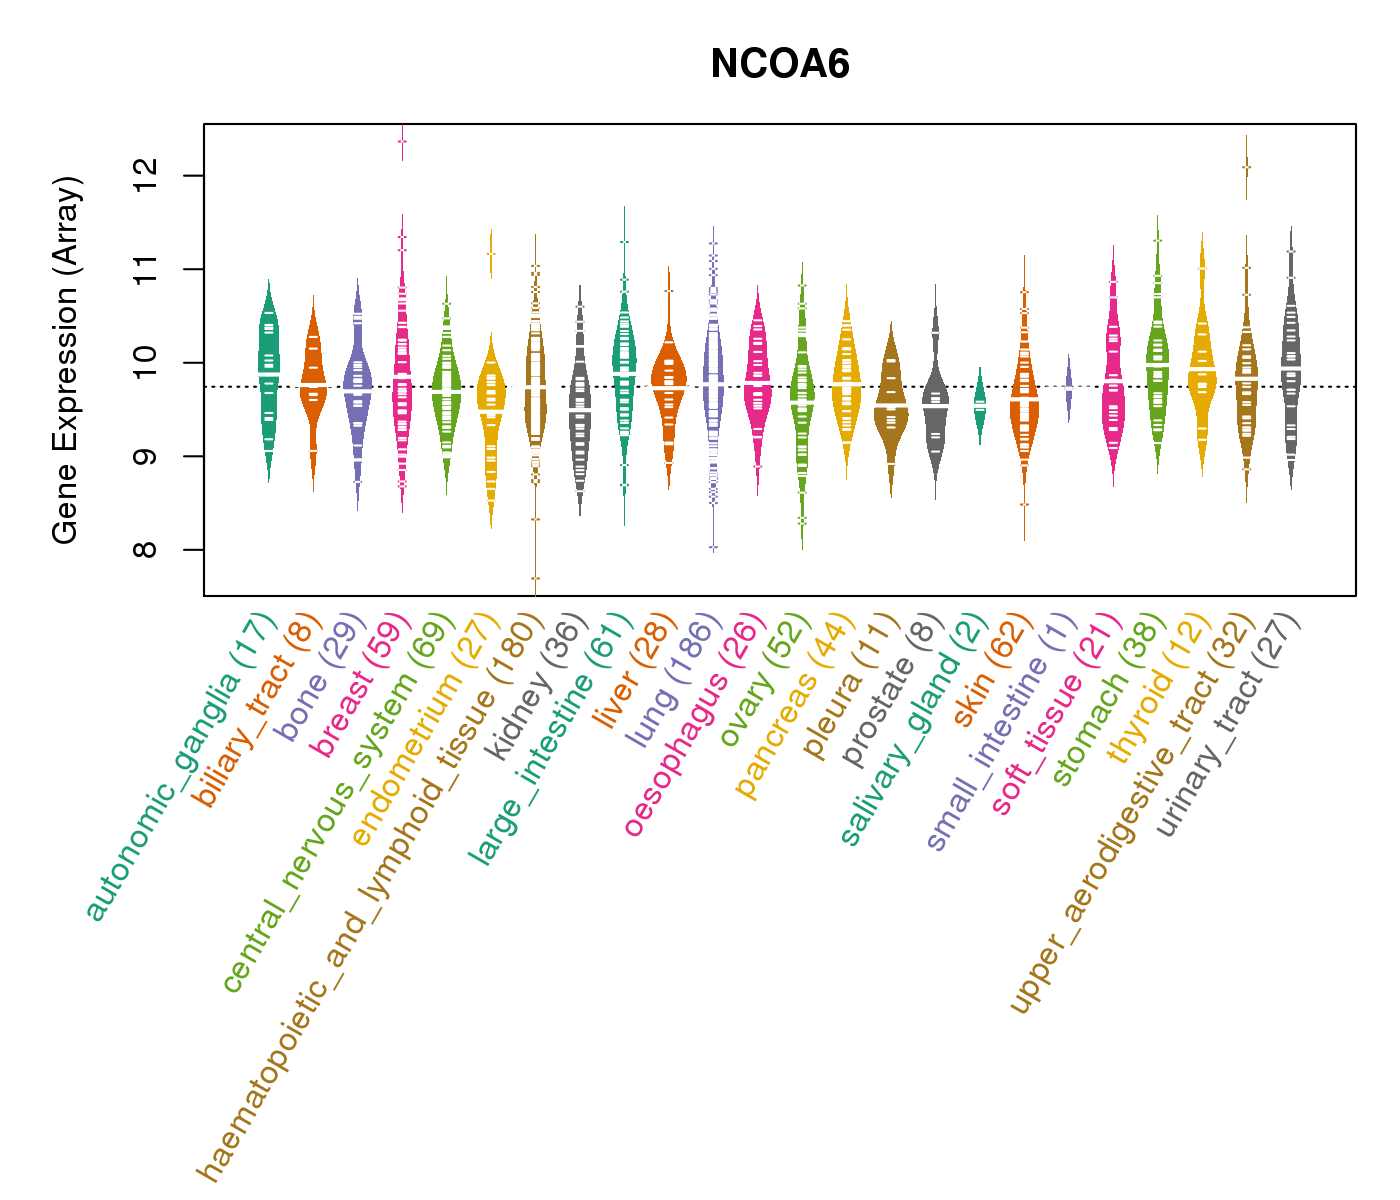
| Gene Expression for NCOA6 |
| * CCLE gene expression data were extracted from CCLE_Expression_Entrez_2012-10-18.res: Gene-centric RMA-normalized mRNA expression data. |
 |
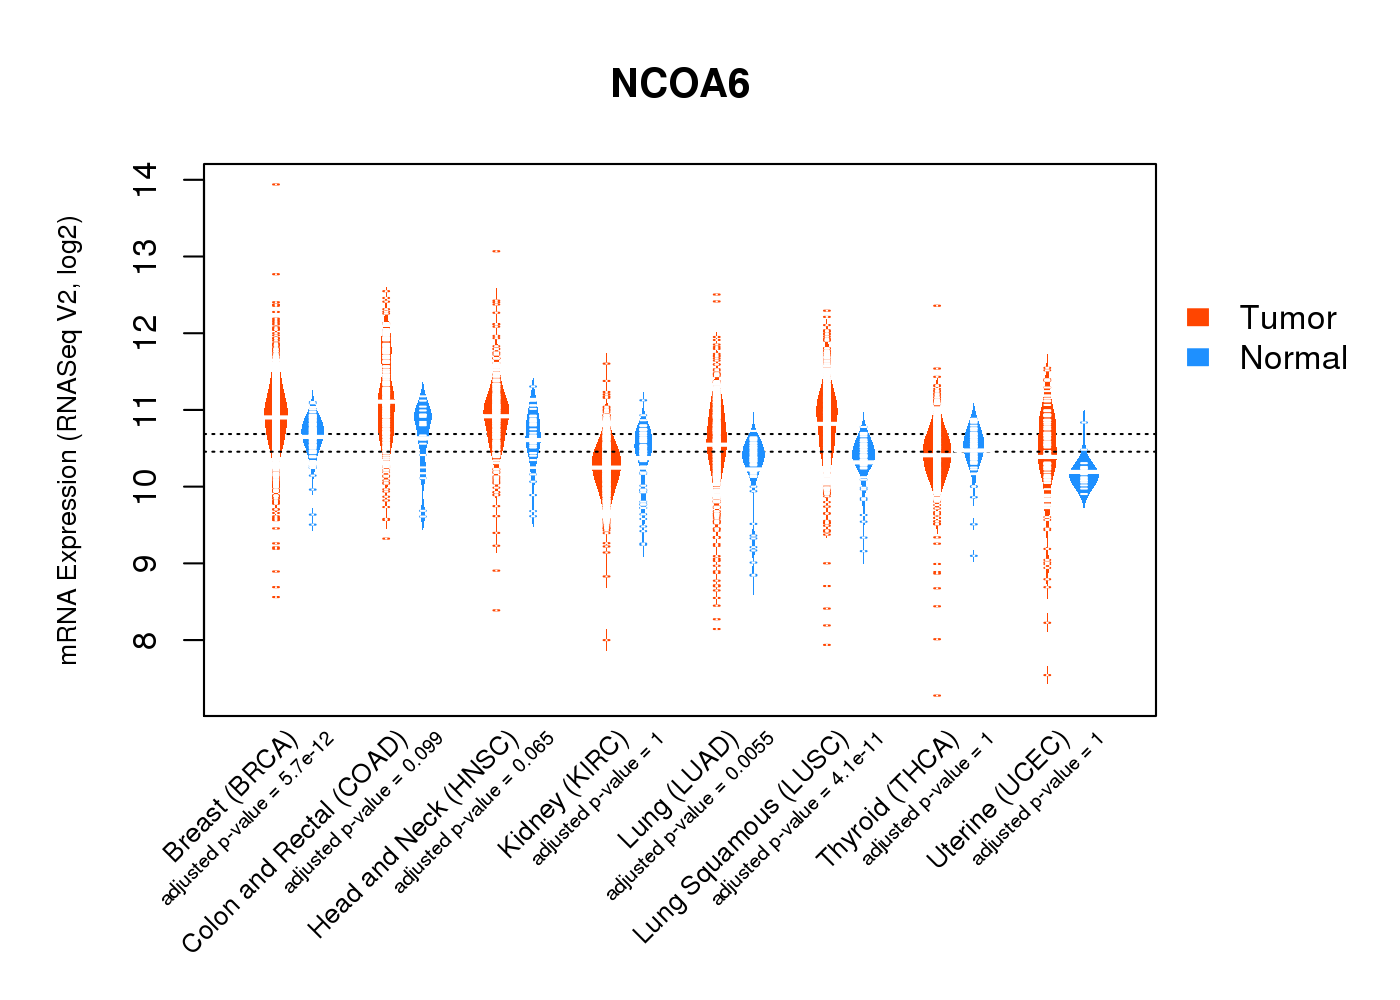
| * Normalized gene expression data of RNASeqV2 was extracted from TCGA using R package TCGA-Assembler. The URLs of all public data files on TCGA DCC data server were gathered at Jan-05-2015. Only eight cancer types have enough normal control samples for differential expression analysis. (t test, adjusted p<0.05 (using Benjamini-Hochberg FDR)) |
 |
| Top |
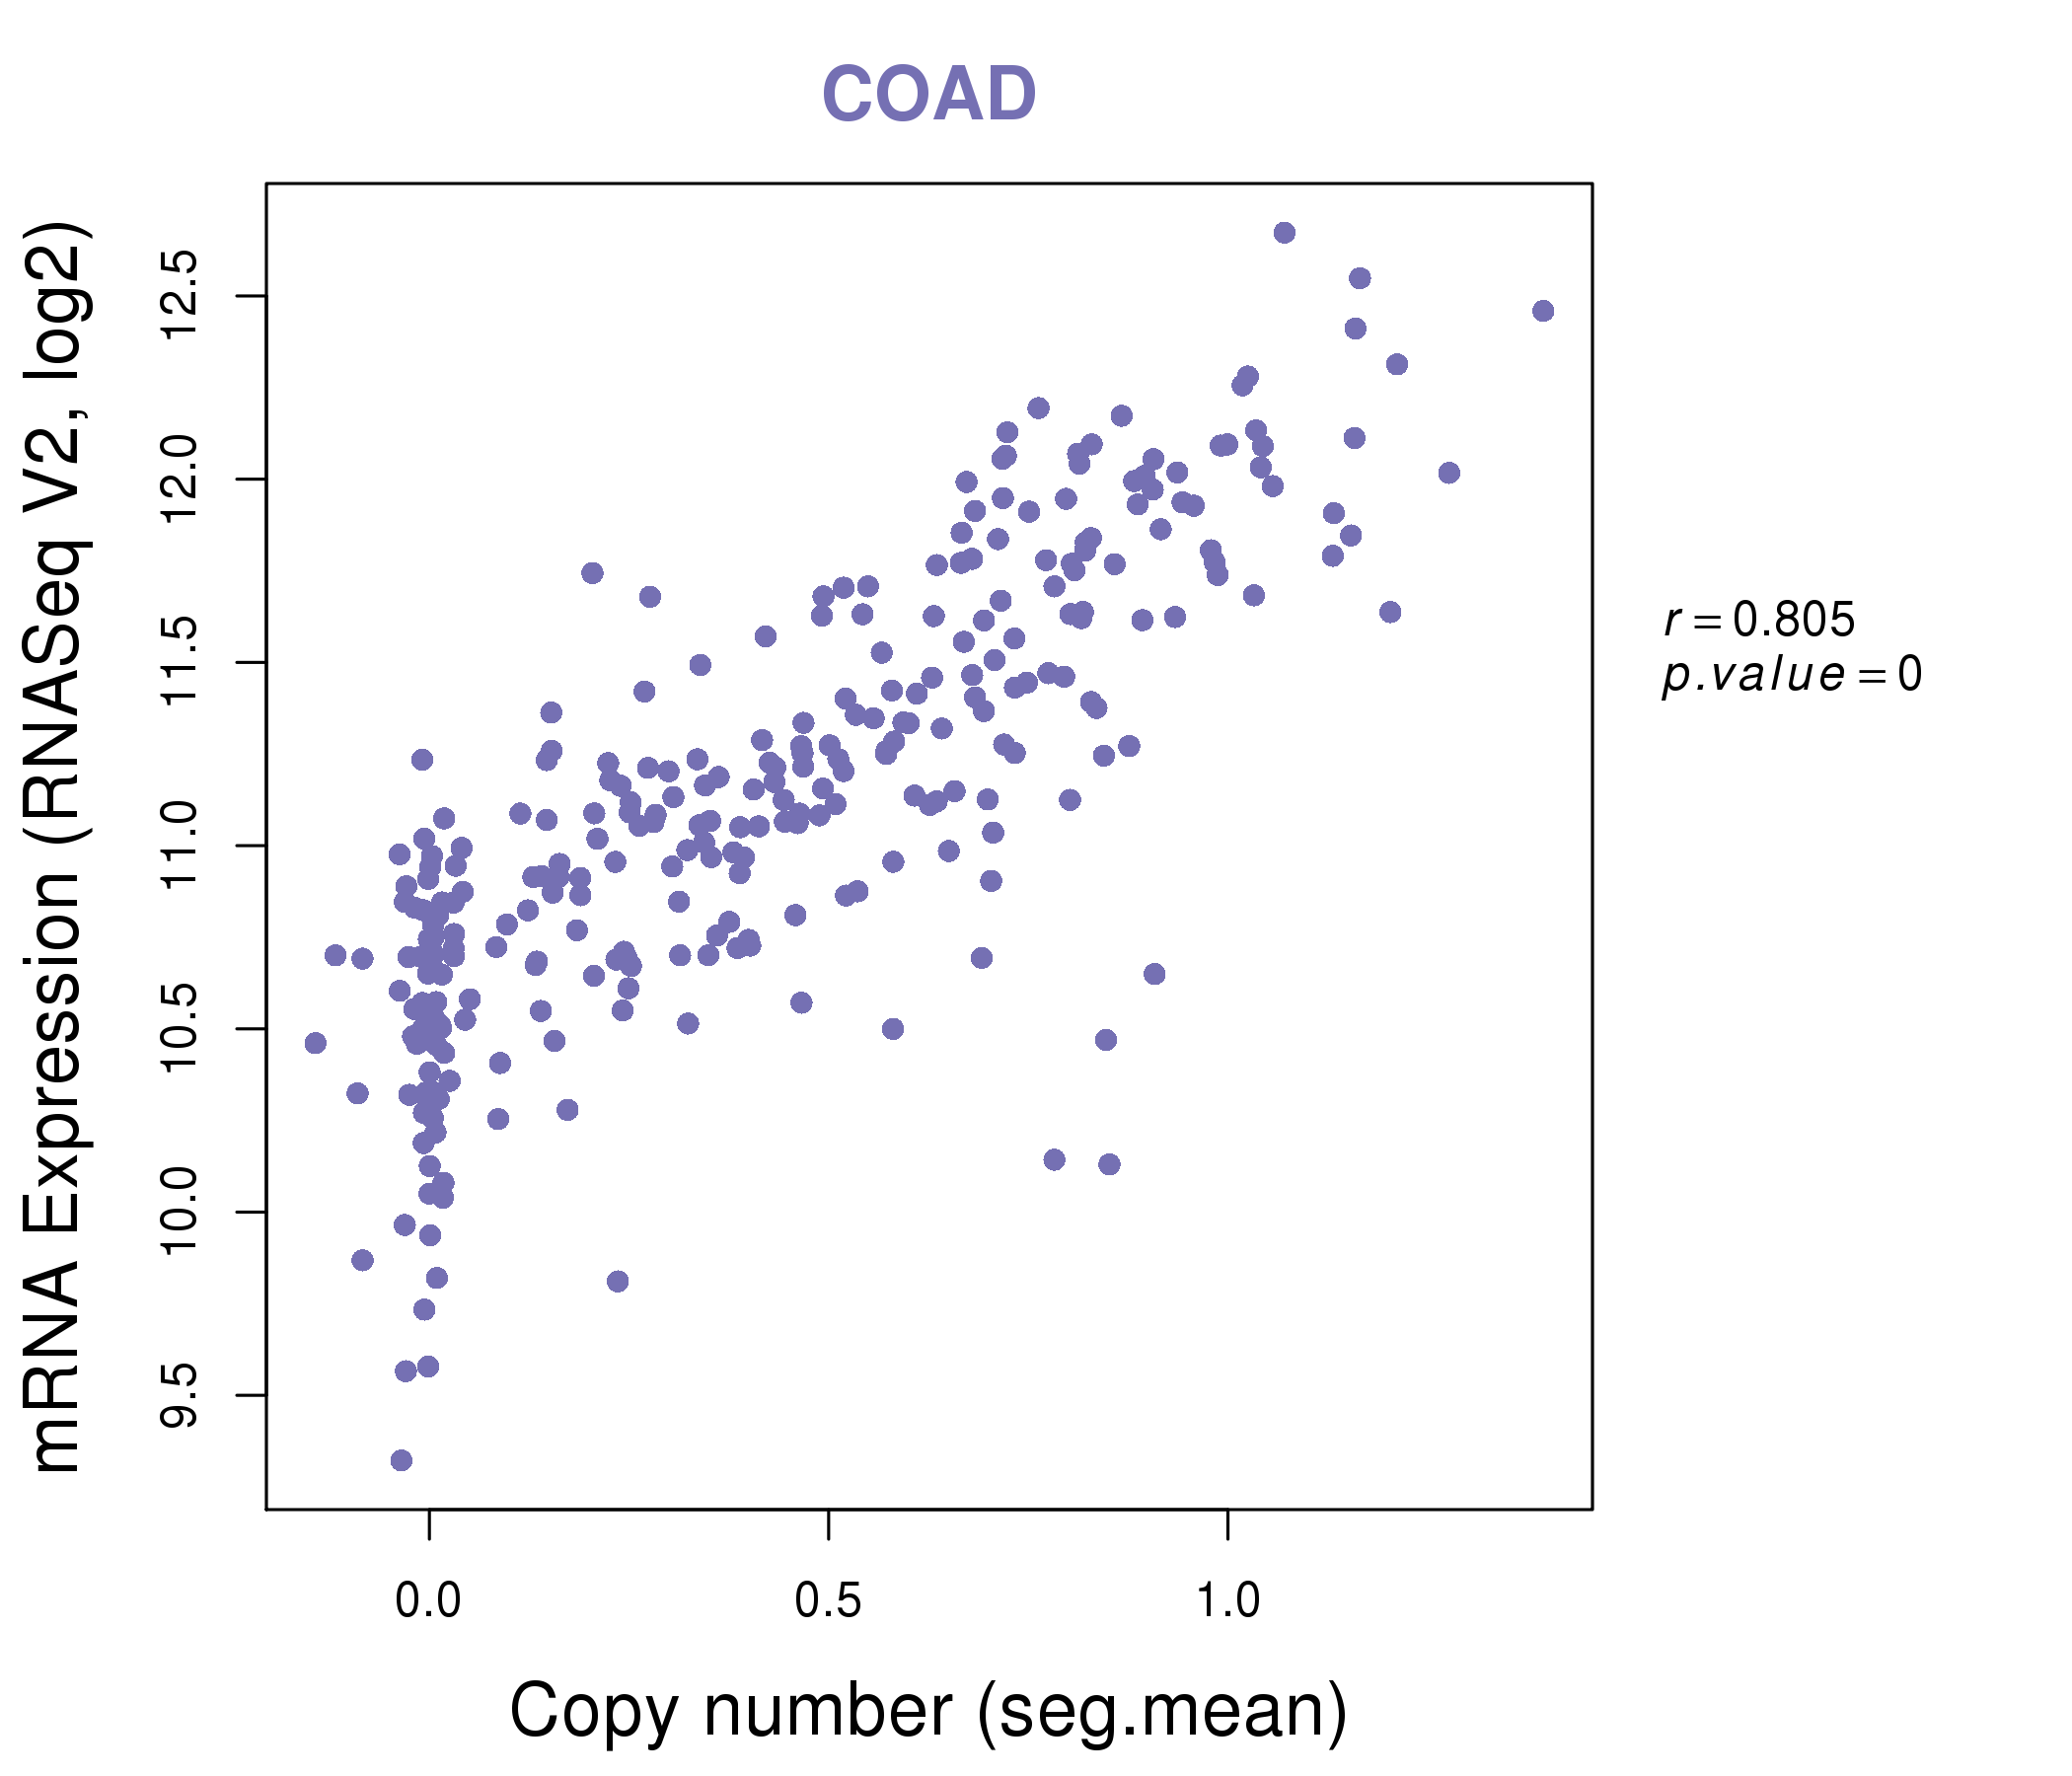
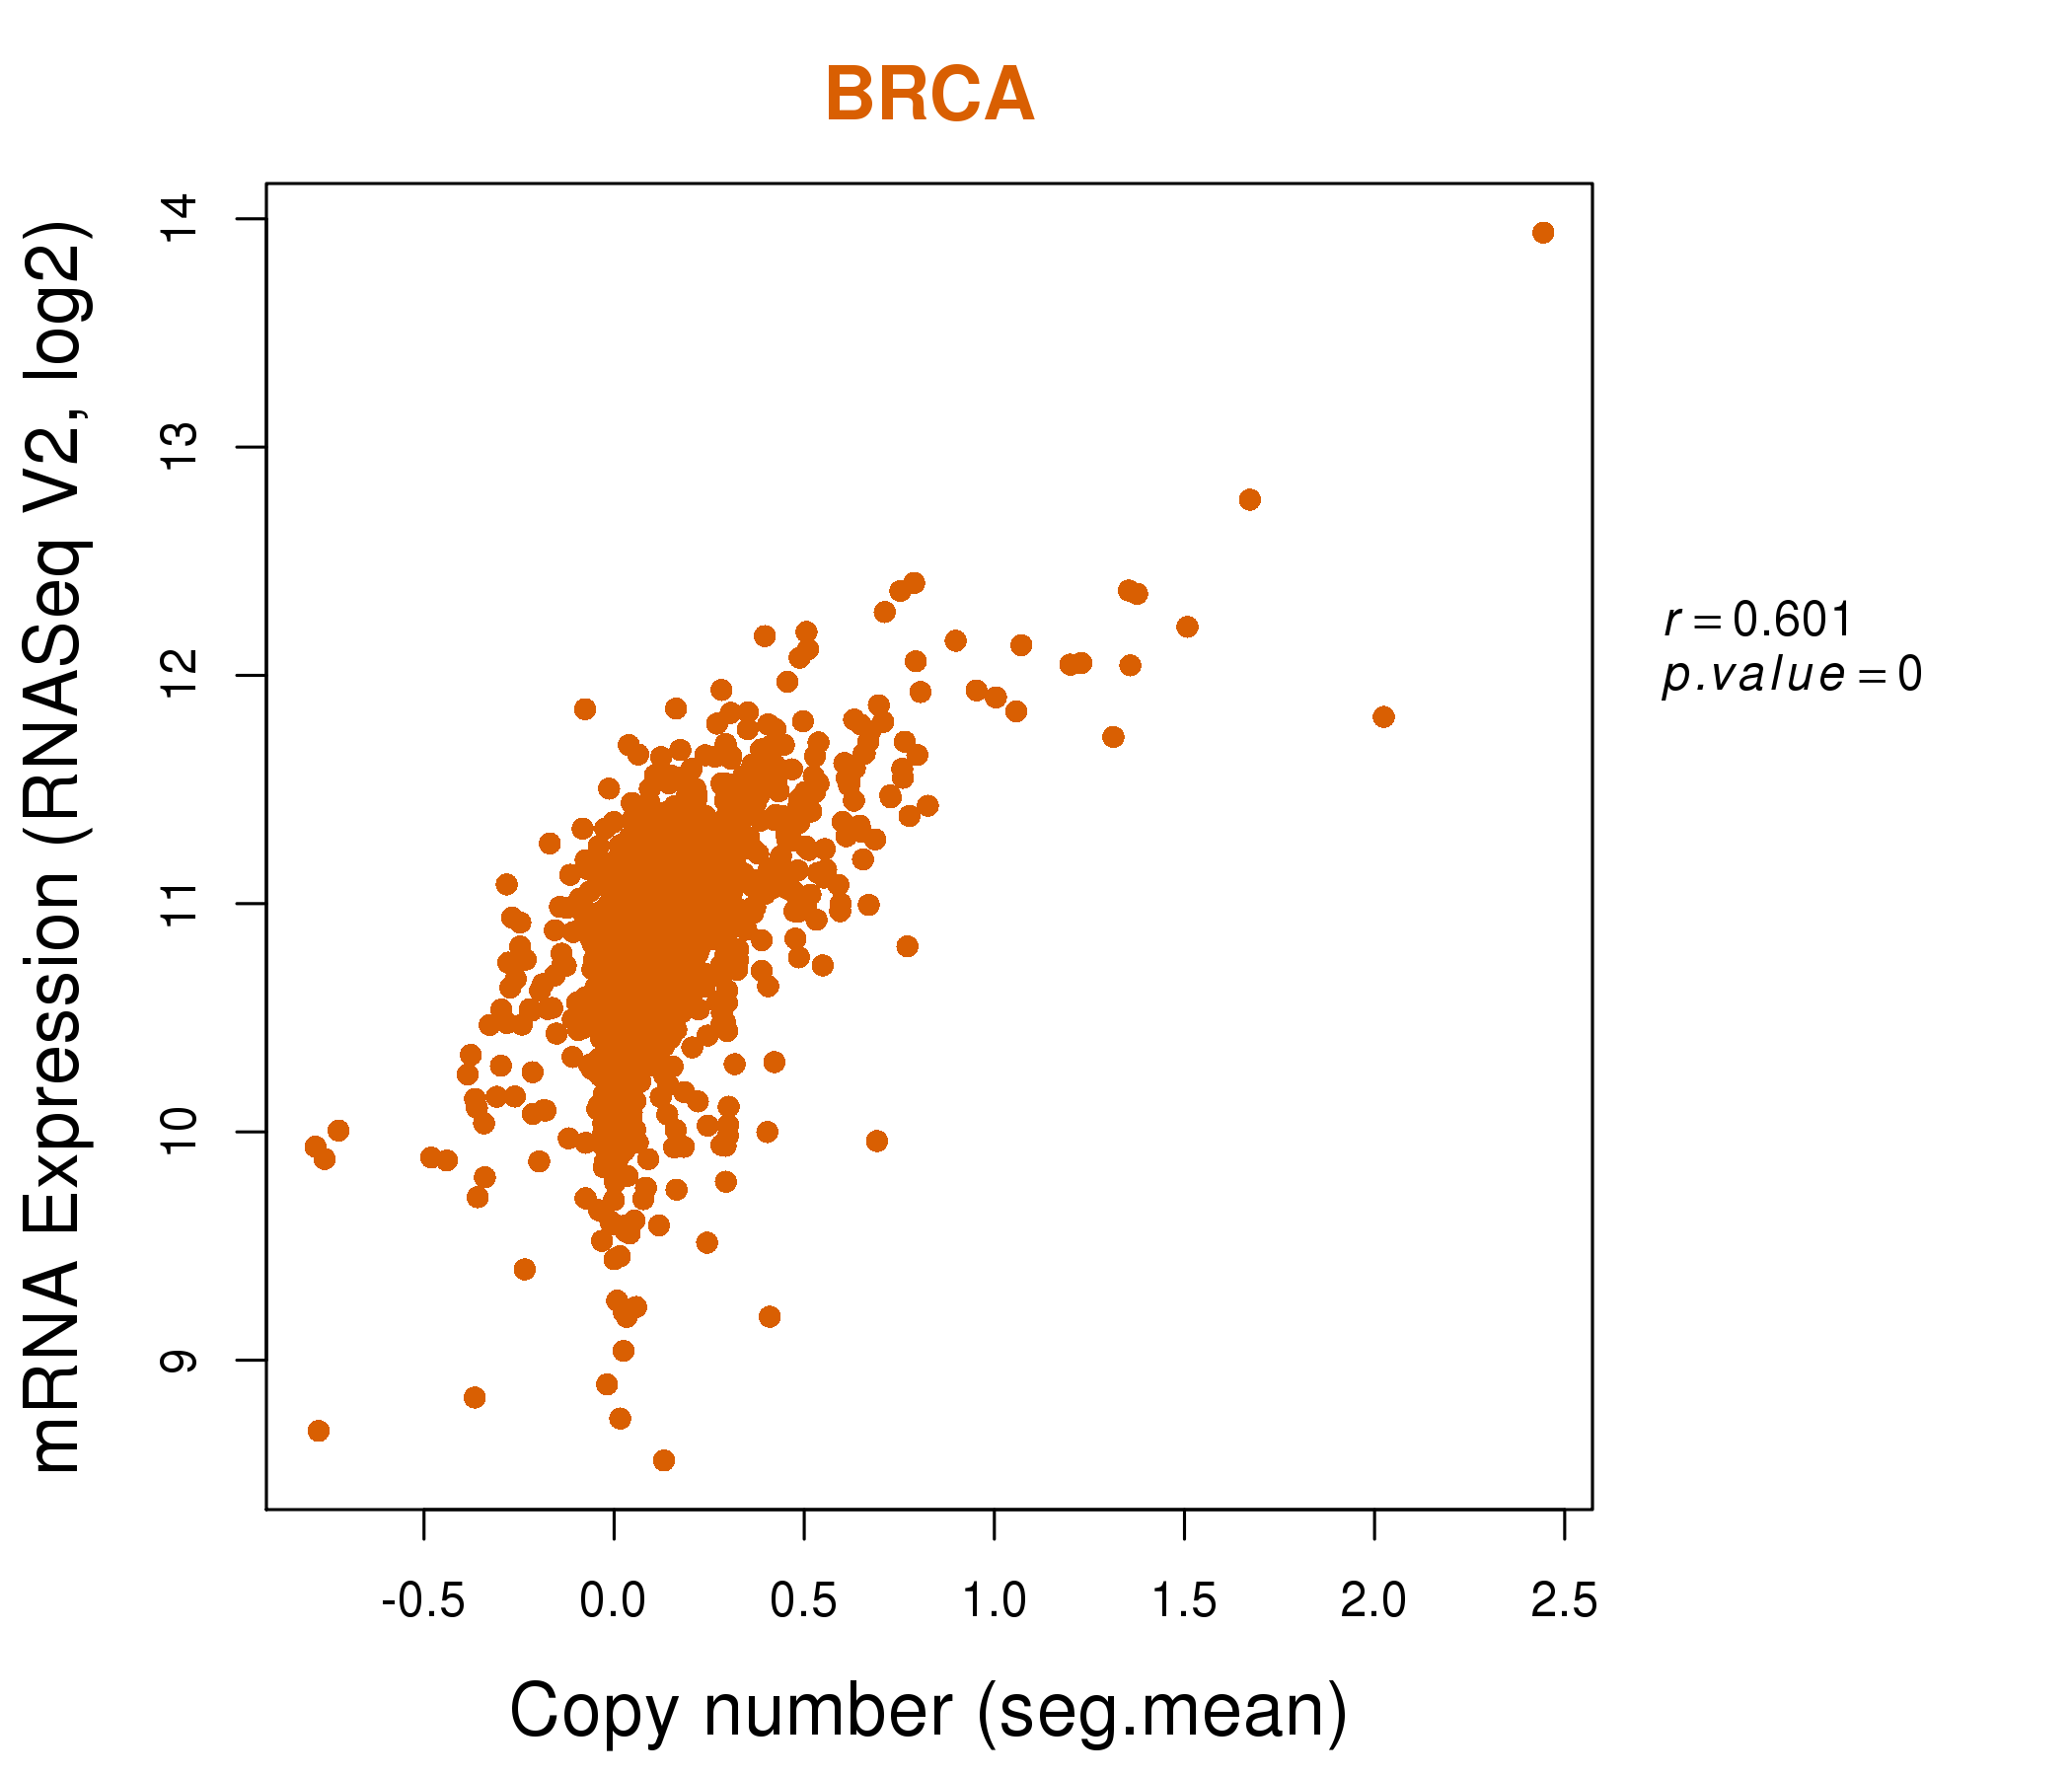
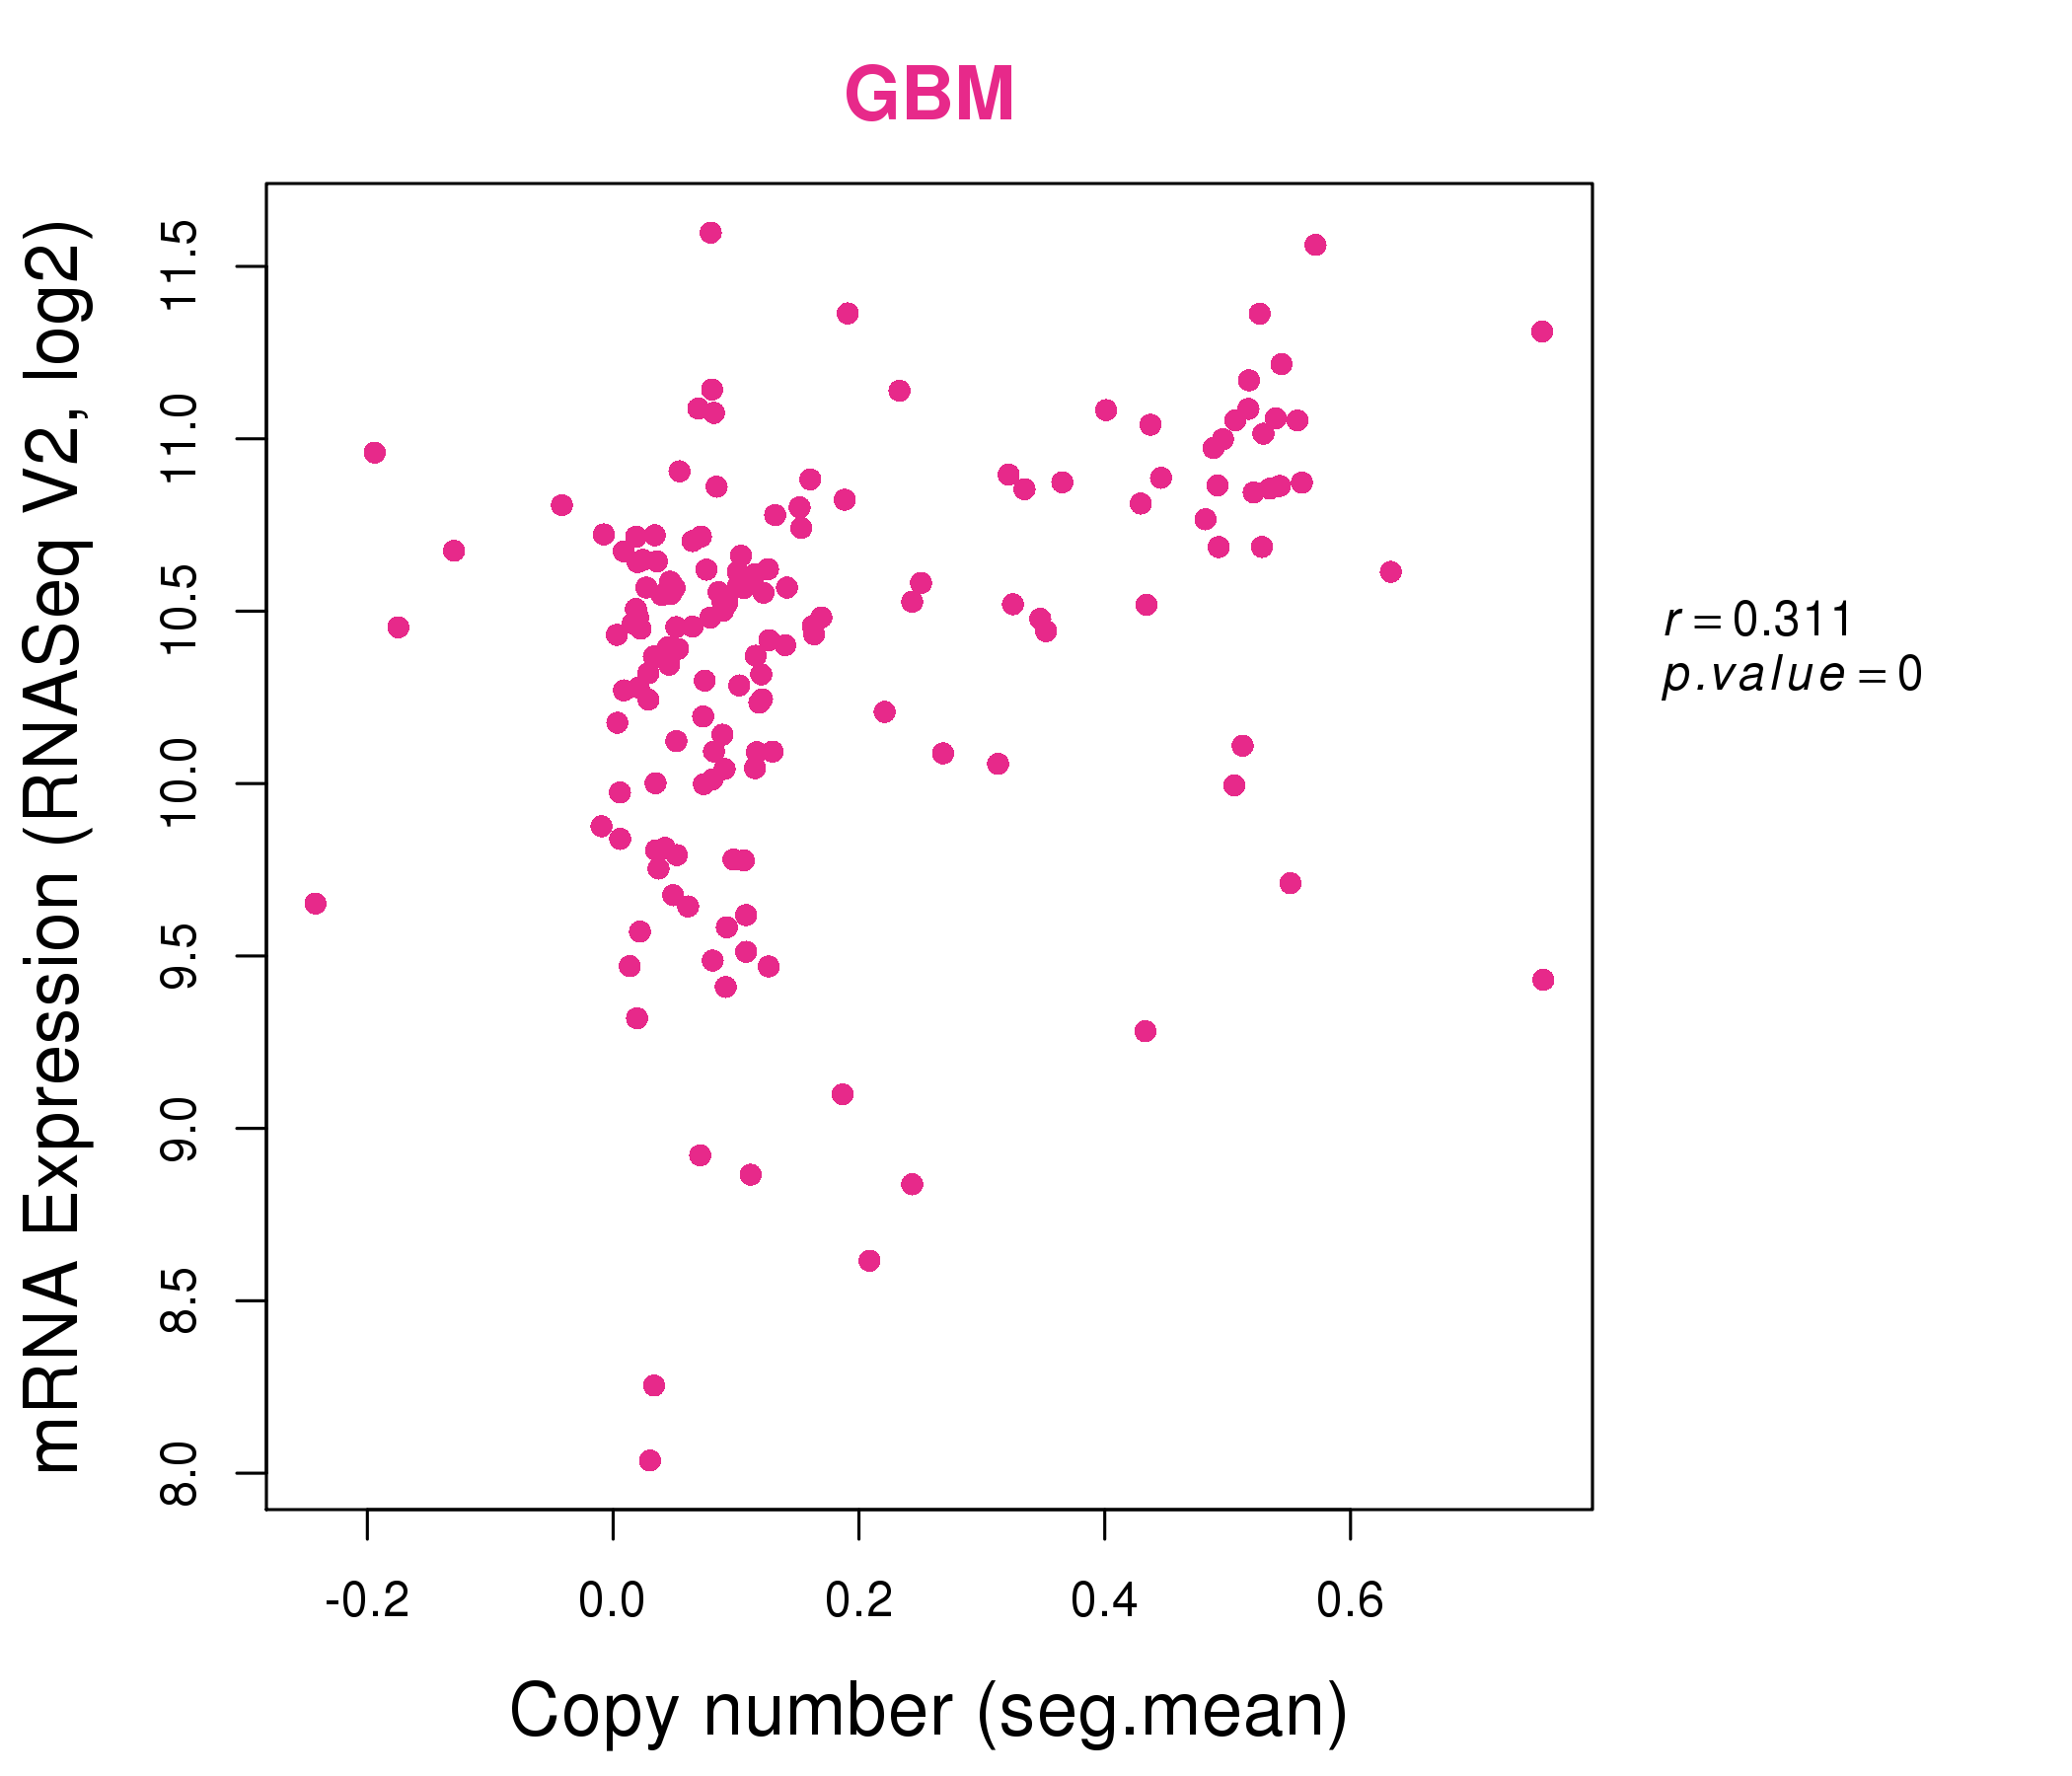
| * This plots show the correlation between CNV and gene expression. |
: Open all plots for all cancer types
 |
|
 |
|
| Top |
| Gene-Gene Network Information |
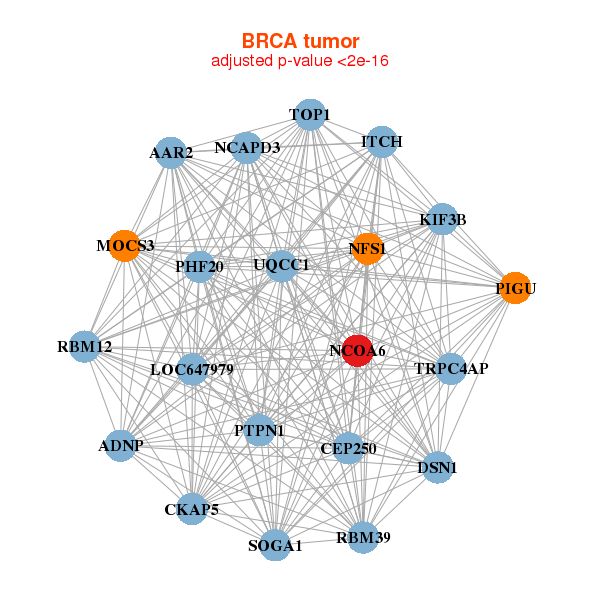
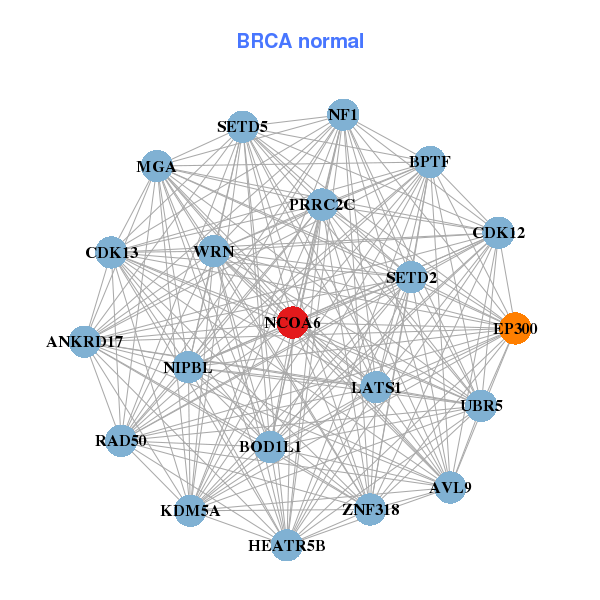
| * Co-Expression network figures were drawn using R package igraph. Only the top 20 genes with the highest correlations were shown. Red circle: input gene, orange circle: cell metabolism gene, sky circle: other gene |
: Open all plots for all cancer types
 |
|
| ADNP,SOGA1,AAR2,CEP250,CKAP5,DSN1,ITCH, KIF3B,LOC647979,MOCS3,NCAPD3,NCOA6,NFS1,PHF20, PIGU,PTPN1,RBM12,RBM39,TOP1,TRPC4AP,UQCC1 | ANKRD17,AVL9,PRRC2C,BOD1L1,BPTF,CDK12,CDK13, EP300,HEATR5B,KDM5A,LATS1,MGA,NCOA6,NF1, NIPBL,RAD50,SETD2,SETD5,UBR5,WRN,ZNF318 |
 |
|
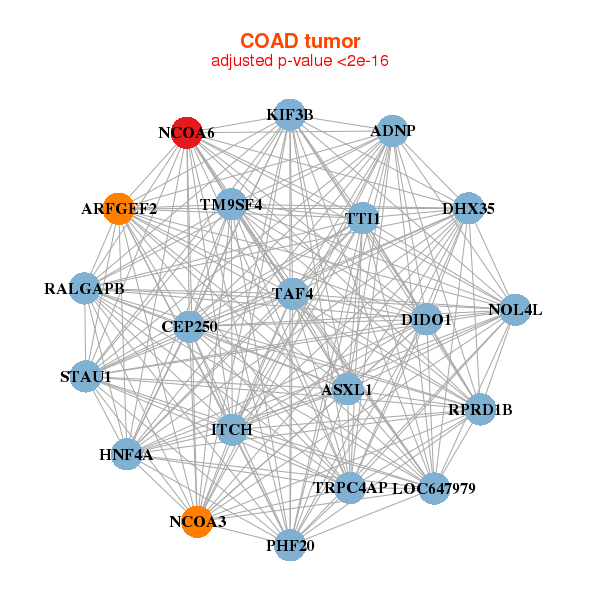
| ADNP,ARFGEF2,ASXL1,NOL4L,CEP250,DHX35,DIDO1, HNF4A,ITCH,TTI1,KIF3B,LOC647979,NCOA3,NCOA6, PHF20,RALGAPB,RPRD1B,STAU1,TAF4,TM9SF4,TRPC4AP | ANKRD52,ARID1A,BAZ2A,BIRC6,FOXO3B,GBF1,GOLGB1, IGF2R,KDM2A,KIAA0368,KIAA2018,MYO18A,NCOA6,NCOR1, PDPK1,PEAK1,TAF4,TCF20,UBN1,UBR4,ZFYVE26 |
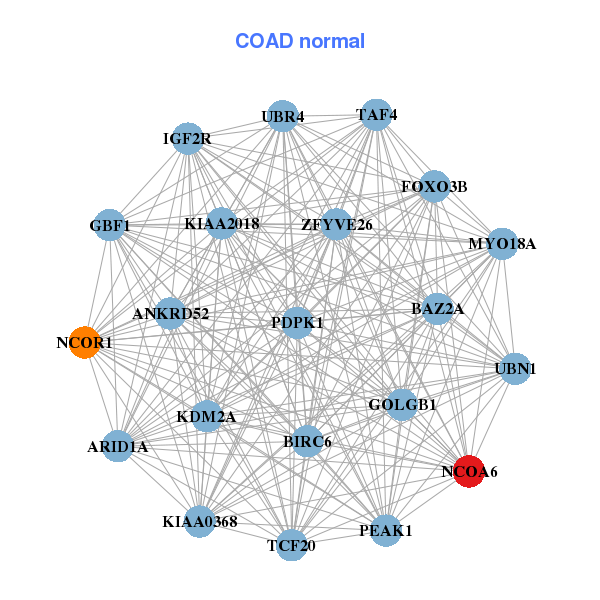
| * Co-Expression network figures were drawn using R package igraph. Only the top 20 genes with the highest correlations were shown. Red circle: input gene, orange circle: cell metabolism gene, sky circle: other gene |
: Open all plots for all cancer types
| Top |
: Open all interacting genes' information including KEGG pathway for all interacting genes from DAVID
| Top |
| Pharmacological Information for NCOA6 |
| There's no related Drug. |
| Top |
| Cross referenced IDs for NCOA6 |
| * We obtained these cross-references from Uniprot database. It covers 150 different DBs, 18 categories. http://www.uniprot.org/help/cross_references_section |
: Open all cross reference information
|
Copyright © 2016-Present - The Univsersity of Texas Health Science Center at Houston @ |