|
||||||||||||||||||||||||||||||||||||||||||||||||||||||||||||||||||||||||||||||||||||||||||||||||||||||||||||||||||||||||||||||||||||||||||||||||||||||||||||||||||||||||||||||||||||||||||||||||||||||||||||||||||||||||||||||||||||||||||||||||||||||||||||||||||||||||||||||||||||||||||||||||||||||||||||||||||||||||||
| |
| Phenotypic Information (metabolism pathway, cancer, disease, phenome) |
| |
| |
| Gene-Gene Network Information: Co-Expression Network, Interacting Genes & KEGG |
| |
|


| Gene Summary for CDK19 |
| Basic gene info. | Gene symbol | CDK19 |
| Gene name | cyclin-dependent kinase 19 | |
| Synonyms | CDC2L6|CDK11|bA346C16.3 | |
| Cytomap | UCSC genome browser: 6q21 | |
| Genomic location | chr6 :110931180-111136412 | |
| Type of gene | protein-coding | |
| RefGenes | NM_001300960.1, NM_001300963.1,NM_001300964.1,NM_015076.4, | |
| Ensembl id | ENSG00000155111 | |
| Description | CDC2-related protein kinase 6CDK8-like cyclin-dependent kinasecell division cycle 2-like 6 (CDK8-like)cell division cycle 2-like protein kinase 6cell division protein kinase 19cyclin dependent kinase 19 variant 2cyclin-dependent kinase (CDC2-like) 1 | |
| Modification date | 20141207 | |
| dbXrefs | MIM : 614720 | |
| HGNC : HGNC | ||
| Ensembl : ENSG00000155111 | ||
| HPRD : 07627 | ||
| Vega : OTTHUMG00000015365 | ||
| Protein | UniProt: Q9BWU1 go to UniProt's Cross Reference DB Table | |
| Expression | CleanEX: HS_CDK19 | |
| BioGPS: 23097 | ||
| Gene Expression Atlas: ENSG00000155111 | ||
| The Human Protein Atlas: ENSG00000155111 | ||
| Pathway | NCI Pathway Interaction Database: CDK19 | |
| KEGG: CDK19 | ||
| REACTOME: CDK19 | ||
| ConsensusPathDB | ||
| Pathway Commons: CDK19 | ||
| Metabolism | MetaCyc: CDK19 | |
| HUMANCyc: CDK19 | ||
| Regulation | Ensembl's Regulation: ENSG00000155111 | |
| miRBase: chr6 :110,931,180-111,136,412 | ||
| TargetScan: NM_001300960 | ||
| cisRED: ENSG00000155111 | ||
| Context | iHOP: CDK19 | |
| cancer metabolism search in PubMed: CDK19 | ||
| UCL Cancer Institute: CDK19 | ||
| Assigned class in ccmGDB | A - This gene has a literature evidence and it belongs to cancer gene. | |
| References showing role of CDK19 in cancer cell metabolism | 1. Porter DC, Farmaki E, Altilia S, Schools GP, West DK, et al. (2012) Cyclin-dependent kinase 8 mediates chemotherapy-induced tumor-promoting paracrine activities. Proc Natl Acad Sci U S A 109: 13799-13804. doi: 10.1073/pnas.1206906109. pmid: 3427077 go to article | |
| Top |
| Phenotypic Information for CDK19(metabolism pathway, cancer, disease, phenome) |
| Cancer | CGAP: CDK19 |
| Familial Cancer Database: CDK19 | |
| * This gene is included in those cancer gene databases. |
|
|
|
|
|
| . | ||||||||||||||||||||||||||||||||||||||||||||||||||||||||||||||||||||||||||||||||||||||||||||||||||||||||||||||||||||||||||||||||||||||||||||||||||||||||||||||||||||||||||||||||||||||||||||||||||||||||||||||||||||||||||||||||||||||||||||||||||||||||||||||||||||||||||||||||||||||||||||||||||||||||||||||||||||
Oncogene 1 | Significant driver gene in | |||||||||||||||||||||||||||||||||||||||||||||||||||||||||||||||||||||||||||||||||||||||||||||||||||||||||||||||||||||||||||||||||||||||||||||||||||||||||||||||||||||||||||||||||||||||||||||||||||||||||||||||||||||||||||||||||||||||||||||||||||||||||||||||||||||||||||||||||||||||||||||||||||||||||||||||||||||||||
| cf) number; DB name 1 Oncogene; http://nar.oxfordjournals.org/content/35/suppl_1/D721.long, 2 Tumor Suppressor gene; https://bioinfo.uth.edu/TSGene/, 3 Cancer Gene Census; http://www.nature.com/nrc/journal/v4/n3/abs/nrc1299.html, 4 CancerGenes; http://nar.oxfordjournals.org/content/35/suppl_1/D721.long, 5 Network of Cancer Gene; http://ncg.kcl.ac.uk/index.php, 1Therapeutic Vulnerabilities in Cancer; http://cbio.mskcc.org/cancergenomics/statius/ |
| REACTOME_METABOLISM_OF_LIPIDS_AND_LIPOPROTEINS | |
| OMIM | 614720; gene. |
| Orphanet | |
| Disease | KEGG Disease: CDK19 |
| MedGen: CDK19 (Human Medical Genetics with Condition) | |
| ClinVar: CDK19 | |
| Phenotype | MGI: CDK19 (International Mouse Phenotyping Consortium) |
| PhenomicDB: CDK19 | |
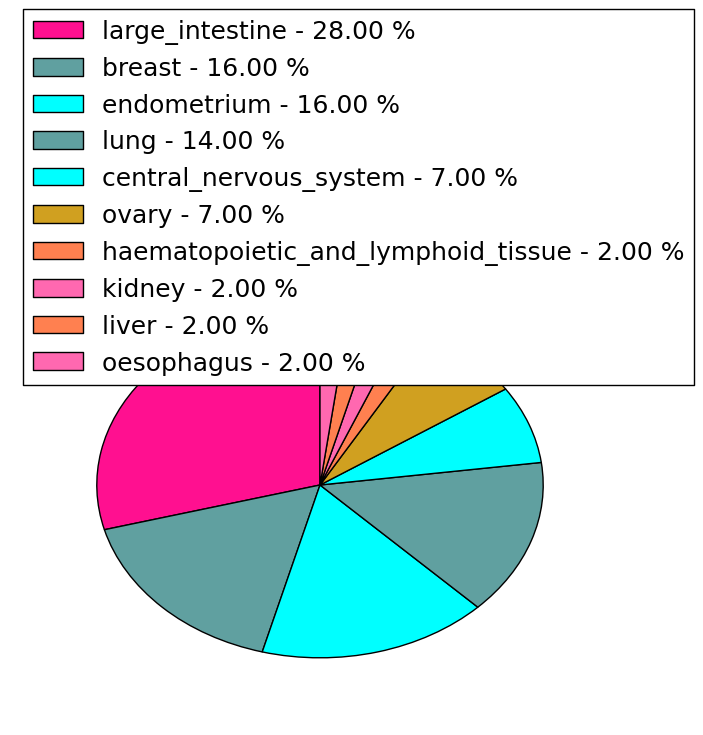
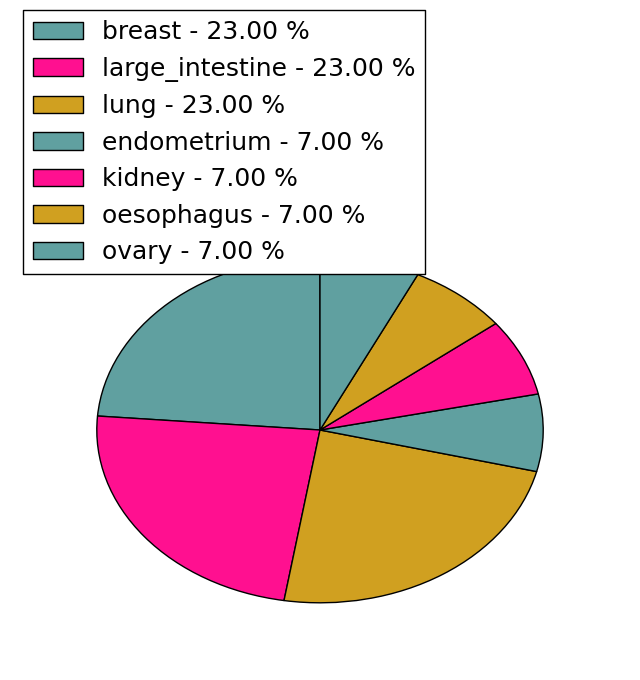
| Mutations for CDK19 |
| * Under tables are showing count per each tissue to give us broad intuition about tissue specific mutation patterns.You can go to the detailed page for each mutation database's web site. |
| - Statistics for Tissue and Mutation type | Top |
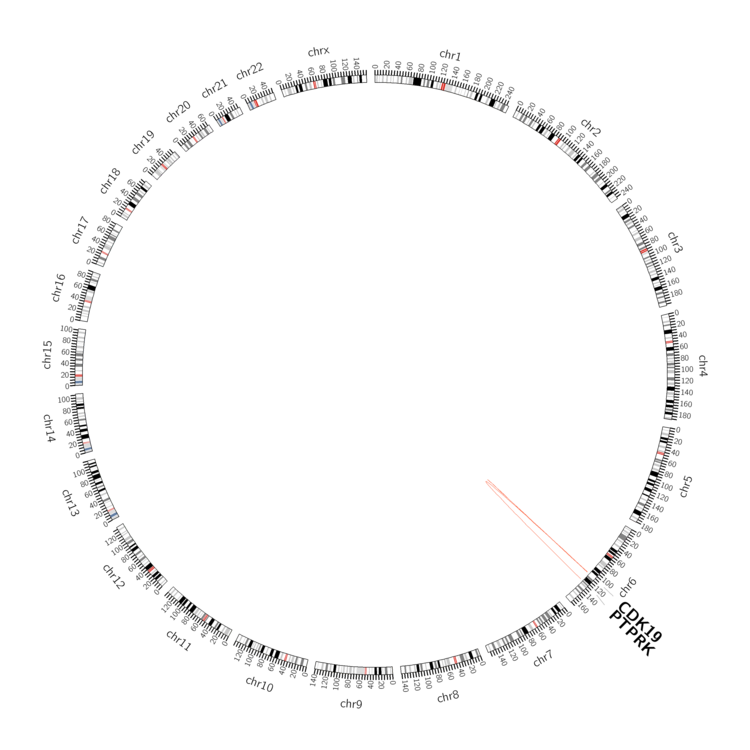 |
| - For Inter-chromosomal Variations |
| There's no inter-chromosomal structural variation. |
| - For Intra-chromosomal Variations |
| * Intra-chromosomal variantions includes 'intrachromosomal amplicon to amplicon', 'intrachromosomal amplicon to non-amplified dna', 'intrachromosomal deletion', 'intrachromosomal fold-back inversion', 'intrachromosomal inversion', 'intrachromosomal tandem duplication', 'Intrachromosomal unknown type', 'intrachromosomal with inverted orientation', 'intrachromosomal with non-inverted orientation'. |
 |
| Sample | Symbol_a | Chr_a | Start_a | End_a | Symbol_b | Chr_b | Start_b | End_b |
| ovary | CDK19 | chr6 | 111114389 | 111114409 | CDK19 | chr6 | 111114456 | 111114476 |
| ovary | CDK19 | chr6 | 111126644 | 111126664 | PTPRK | chr6 | 128828628 | 128828648 |
| pancreas | CDK19 | chr6 | 110963953 | 110963973 | chr6 | 110927596 | 110927616 | |
| pancreas | CDK19 | chr6 | 111071010 | 111071030 | CDK19 | chr6 | 111071560 | 111071580 |
| pancreas | CDK19 | chr6 | 111133847 | 111133867 | chr6 | 111265885 | 111265905 |
| cf) Tissue number; Tissue name (1;Breast, 2;Central_nervous_system, 3;Haematopoietic_and_lymphoid_tissue, 4;Large_intestine, 5;Liver, 6;Lung, 7;Ovary, 8;Pancreas, 9;Prostate, 10;Skin, 11;Soft_tissue, 12;Upper_aerodigestive_tract) |
| * From mRNA Sanger sequences, Chitars2.0 arranged chimeric transcripts. This table shows CDK19 related fusion information. |
| ID | Head Gene | Tail Gene | Accession | Gene_a | qStart_a | qEnd_a | Chromosome_a | tStart_a | tEnd_a | Gene_a | qStart_a | qEnd_a | Chromosome_a | tStart_a | tEnd_a |
| AI244697 | MNT | 79 | 169 | 17 | 2292774 | 2292868 | CDK19 | 169 | 215 | 6 | 111043645 | 111043990 | |
| BQ345738 | OAF | 1 | 283 | 11 | 120097557 | 120099714 | CDK19 | 279 | 356 | 6 | 110942314 | 110942391 | |
| CD654079 | CDK19 | 29 | 449 | 6 | 110975514 | 110975934 | CDK19 | 443 | 638 | 6 | 110972244 | 110972440 | |
| AI207519 | CDK19 | 15 | 244 | 6 | 110973947 | 110974176 | USP14 | 241 | 694 | 18 | 211368 | 211820 | |
| BF591193 | MNT | 79 | 169 | 17 | 2292774 | 2292868 | CDK19 | 169 | 215 | 6 | 111043645 | 111043990 | |
| CN411943 | CDK19 | 1 | 64 | 6 | 110932410 | 110932473 | CDK19 | 62 | 561 | 6 | 110931928 | 110932427 | |
| Top |
| Mutation type/ Tissue ID | brca | cns | cerv | endome | haematopo | kidn | Lintest | liver | lung | ns | ovary | pancre | prost | skin | stoma | thyro | urina | |||
| Total # sample | 2 | 1 | 1 | 3 | ||||||||||||||||
| GAIN (# sample) | 2 | 1 | 2 | |||||||||||||||||
| LOSS (# sample) | 1 | 1 |
| cf) Tissue ID; Tissue type (1; Breast, 2; Central_nervous_system, 3; Cervix, 4; Endometrium, 5; Haematopoietic_and_lymphoid_tissue, 6; Kidney, 7; Large_intestine, 8; Liver, 9; Lung, 10; NS, 11; Ovary, 12; Pancreas, 13; Prostate, 14; Skin, 15; Stomach, 16; Thyroid, 17; Urinary_tract) |
| Top |
|
 |
| Top |
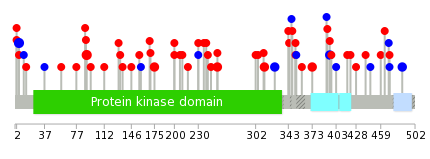
| Stat. for Non-Synonymous SNVs (# total SNVs=42) | (# total SNVs=13) |
 |  |
(# total SNVs=1) | (# total SNVs=0) |
 |
| Top |
| * When you move the cursor on each content, you can see more deailed mutation information on the Tooltip. Those are primary_site,primary_histology,mutation(aa),pubmedID. |
| GRCh37 position | Mutation(aa) | Unique sampleID count |
| chr6:111136325-111136325 | p.F5F | 4 |
| chr6:110991680-110991680 | p.D90G | 3 |
| chr6:110948235-110948235 | p.R254W | 2 |
| chr6:110935789-110935789 | p.S486S | 2 |
| chr6:110935837-110935837 | p.S470R | 2 |
| chr6:110942499-110942499 | p.A395A | 2 |
| chr6:110944071-110944071 | p.S326S | 2 |
| chr6:111136336-111136336 | p.D2N | 2 |
| chr6:110944110-110944110 | p.Q313H | 2 |
| chr6:110942566-110942566 | p.Q373L | 2 |
| Top |
|
 |
| Point Mutation/ Tissue ID | 1 | 2 | 3 | 4 | 5 | 6 | 7 | 8 | 9 | 10 | 11 | 12 | 13 | 14 | 15 | 16 | 17 | 18 | 19 | 20 |
| # sample | 2 | 6 | 11 | 1 | 1 | 2 | 6 | 1 | 2 | 4 | 3 | 7 | ||||||||
| # mutation | 2 | 6 | 9 | 1 | 1 | 3 | 6 | 1 | 2 | 4 | 3 | 8 | ||||||||
| nonsynonymous SNV | 5 | 8 | 1 | 1 | 2 | 4 | 1 | 1 | 3 | 2 | 7 | |||||||||
| synonymous SNV | 2 | 1 | 1 | 1 | 2 | 1 | 1 | 1 | 1 |
| cf) Tissue ID; Tissue type (1; BLCA[Bladder Urothelial Carcinoma], 2; BRCA[Breast invasive carcinoma], 3; CESC[Cervical squamous cell carcinoma and endocervical adenocarcinoma], 4; COAD[Colon adenocarcinoma], 5; GBM[Glioblastoma multiforme], 6; Glioma Low Grade, 7; HNSC[Head and Neck squamous cell carcinoma], 8; KICH[Kidney Chromophobe], 9; KIRC[Kidney renal clear cell carcinoma], 10; KIRP[Kidney renal papillary cell carcinoma], 11; LAML[Acute Myeloid Leukemia], 12; LUAD[Lung adenocarcinoma], 13; LUSC[Lung squamous cell carcinoma], 14; OV[Ovarian serous cystadenocarcinoma ], 15; PAAD[Pancreatic adenocarcinoma], 16; PRAD[Prostate adenocarcinoma], 17; SKCM[Skin Cutaneous Melanoma], 18:STAD[Stomach adenocarcinoma], 19:THCA[Thyroid carcinoma], 20:UCEC[Uterine Corpus Endometrial Carcinoma]) |
| Top |
| * We represented just top 10 SNVs. When you move the cursor on each content, you can see more deailed mutation information on the Tooltip. Those are primary_site, primary_histology, mutation(aa), pubmedID. |
| Genomic Position | Mutation(aa) | Unique sampleID count |
| chr6:110991680 | p.D90G | 3 |
| chr6:110935837 | p.S470R | 2 |
| chr6:110948235 | p.R112C | 2 |
| chr6:110988759 | p.R254W | 2 |
| chr6:110948346 | p.G58A | 1 |
| chr6:110942402 | p.P392T | 1 |
| chr6:110988772 | p.S230S | 1 |
| chr6:110944115 | p.E14G | 1 |
| chr6:110953250 | p.N360D | 1 |
| chr6:110942423 | p.S230L | 1 |
| * Copy number data were extracted from TCGA using R package TCGA-Assembler. The URLs of all public data files on TCGA DCC data server were gathered on Jan-05-2015. Function ProcessCNAData in TCGA-Assembler package was used to obtain gene-level copy number value which is calculated as the average copy number of the genomic region of a gene. |
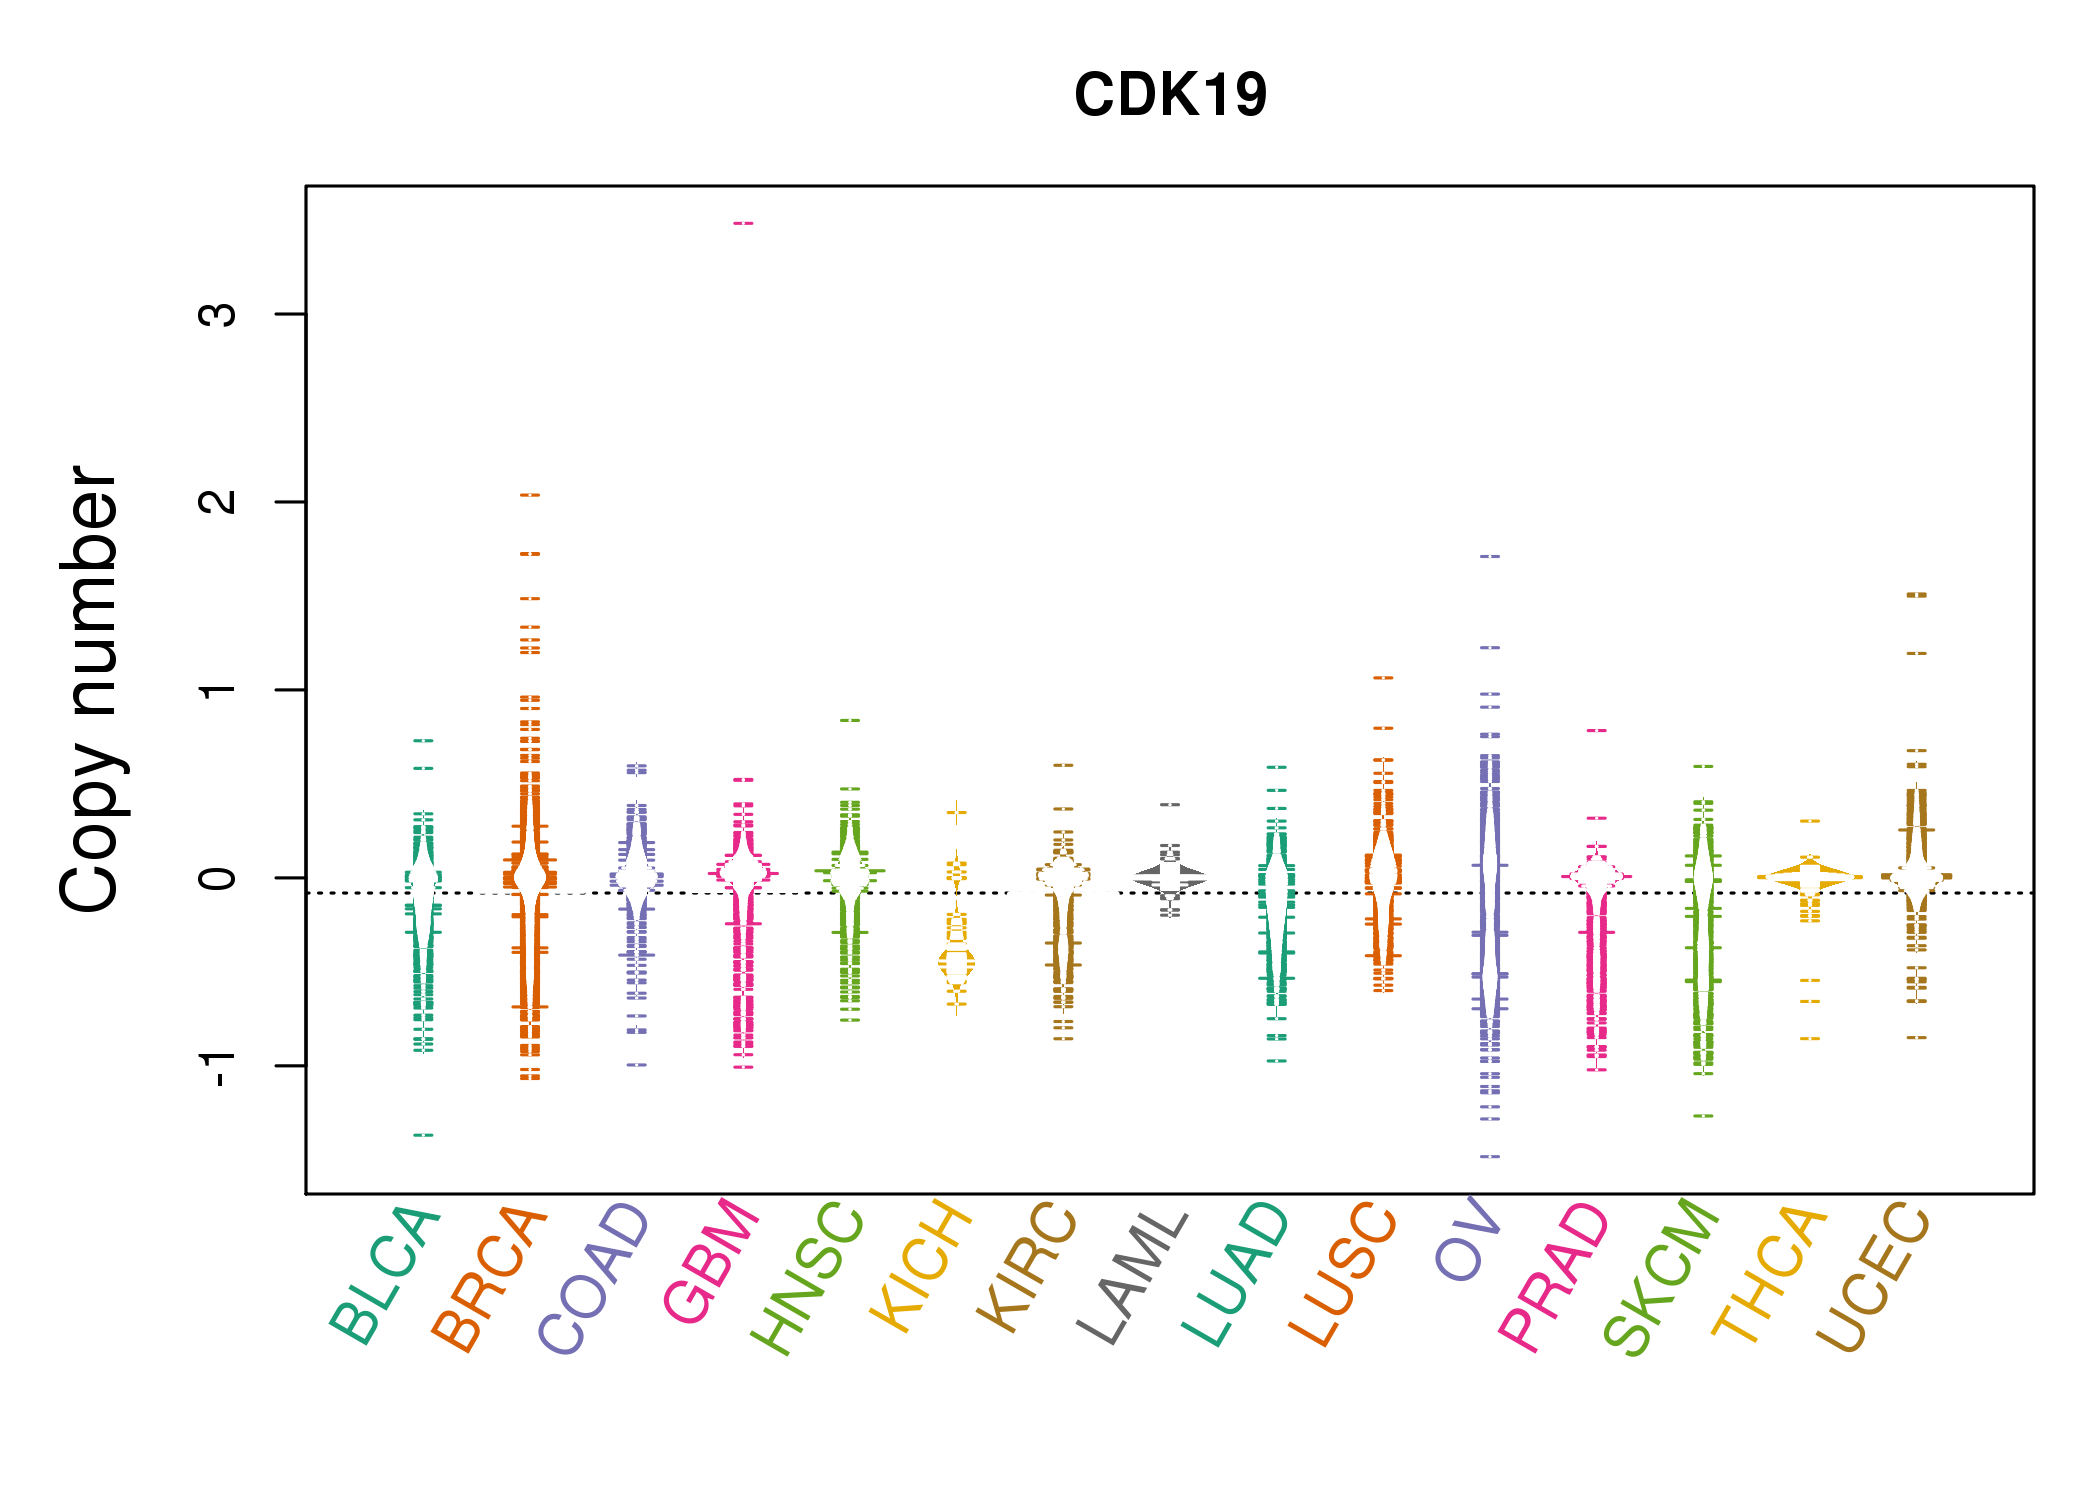 |
| cf) Tissue ID[Tissue type]: BLCA[Bladder Urothelial Carcinoma], BRCA[Breast invasive carcinoma], CESC[Cervical squamous cell carcinoma and endocervical adenocarcinoma], COAD[Colon adenocarcinoma], GBM[Glioblastoma multiforme], Glioma Low Grade, HNSC[Head and Neck squamous cell carcinoma], KICH[Kidney Chromophobe], KIRC[Kidney renal clear cell carcinoma], KIRP[Kidney renal papillary cell carcinoma], LAML[Acute Myeloid Leukemia], LUAD[Lung adenocarcinoma], LUSC[Lung squamous cell carcinoma], OV[Ovarian serous cystadenocarcinoma ], PAAD[Pancreatic adenocarcinoma], PRAD[Prostate adenocarcinoma], SKCM[Skin Cutaneous Melanoma], STAD[Stomach adenocarcinoma], THCA[Thyroid carcinoma], UCEC[Uterine Corpus Endometrial Carcinoma] |
| Top |
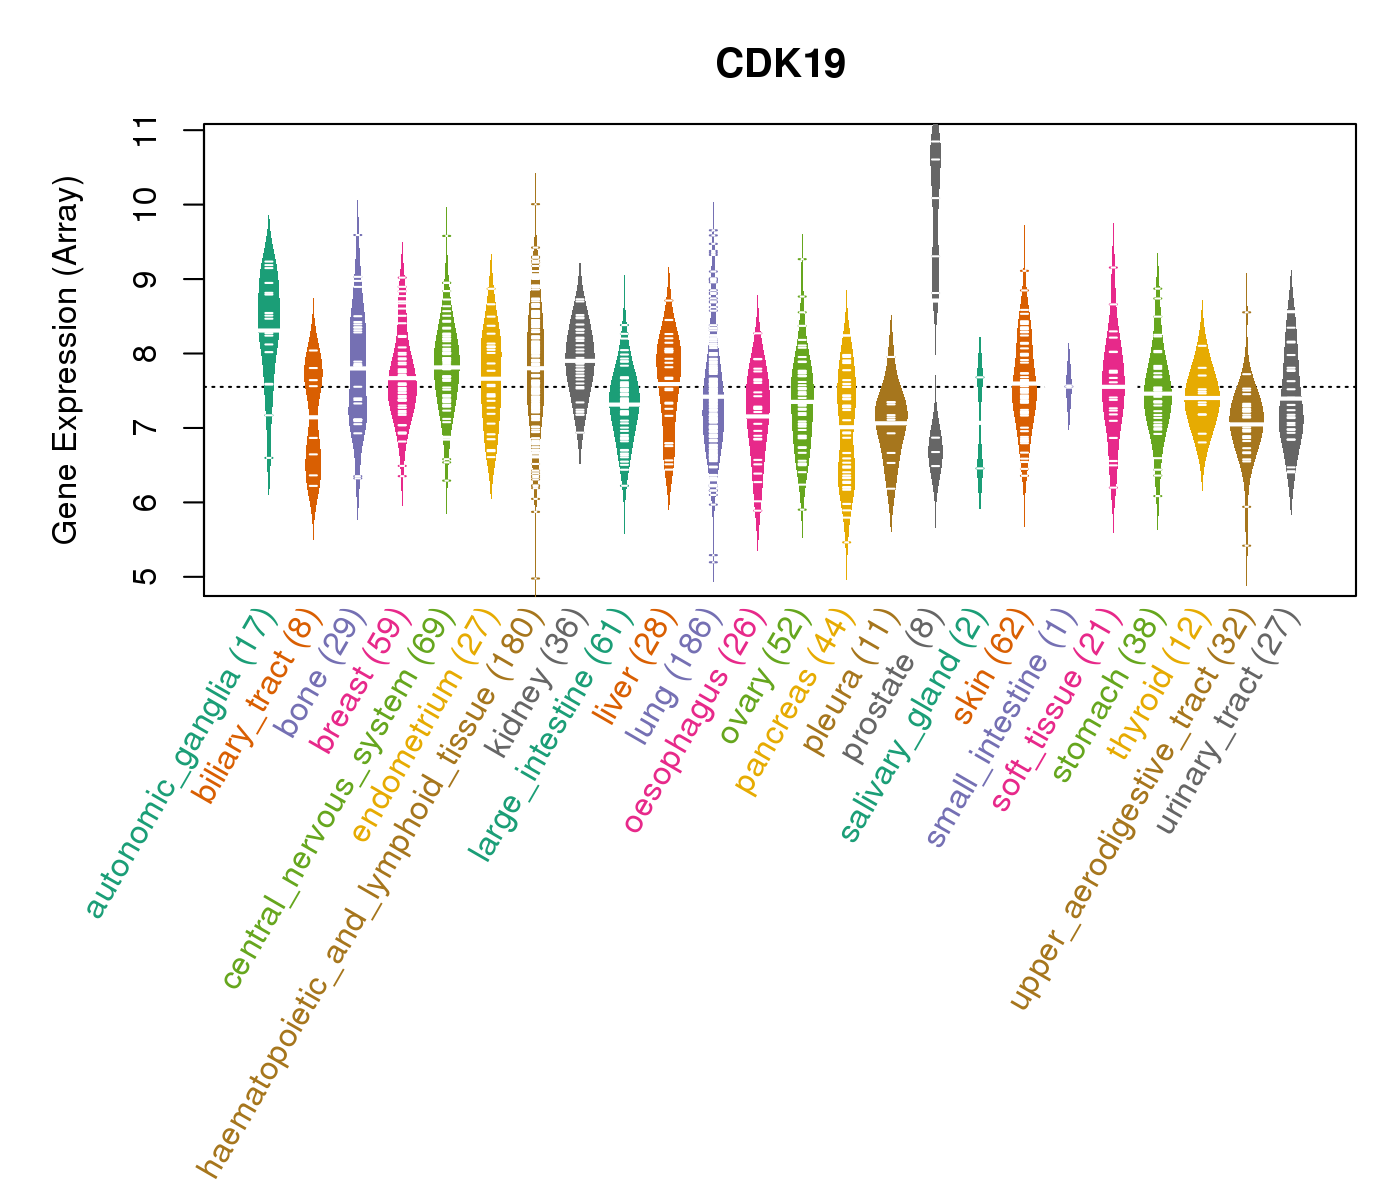
| Gene Expression for CDK19 |
| * CCLE gene expression data were extracted from CCLE_Expression_Entrez_2012-10-18.res: Gene-centric RMA-normalized mRNA expression data. |
 |
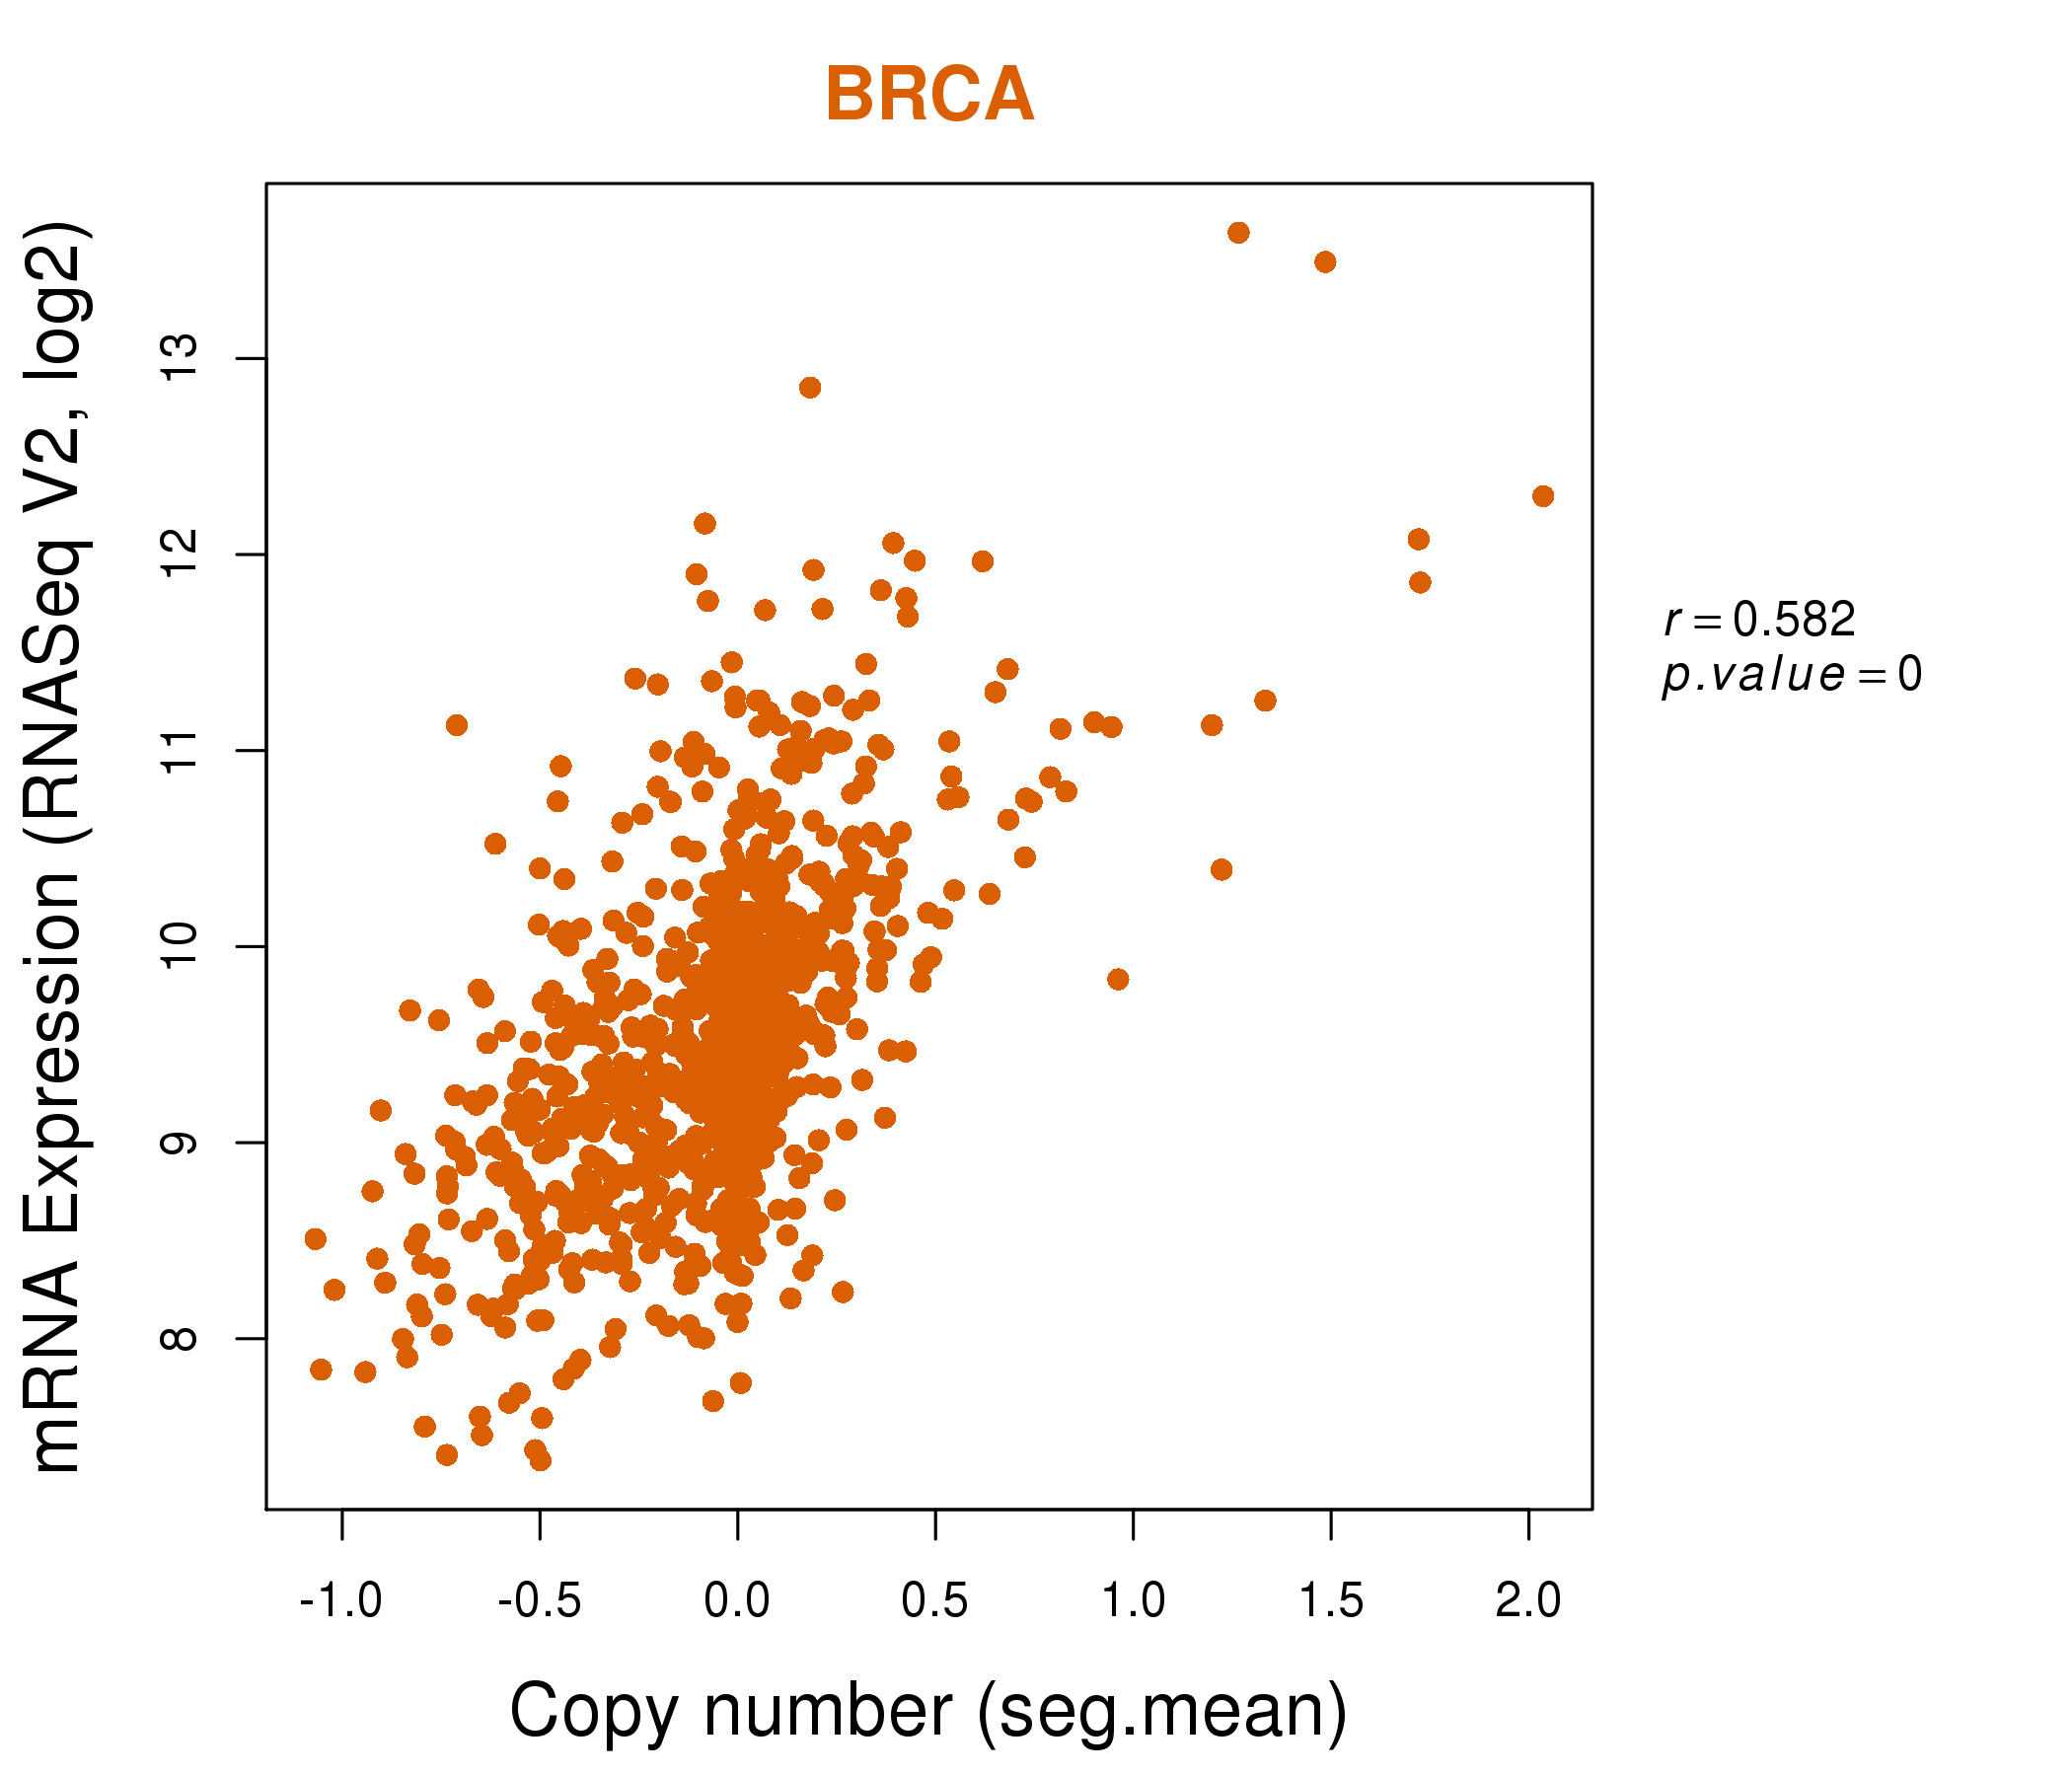
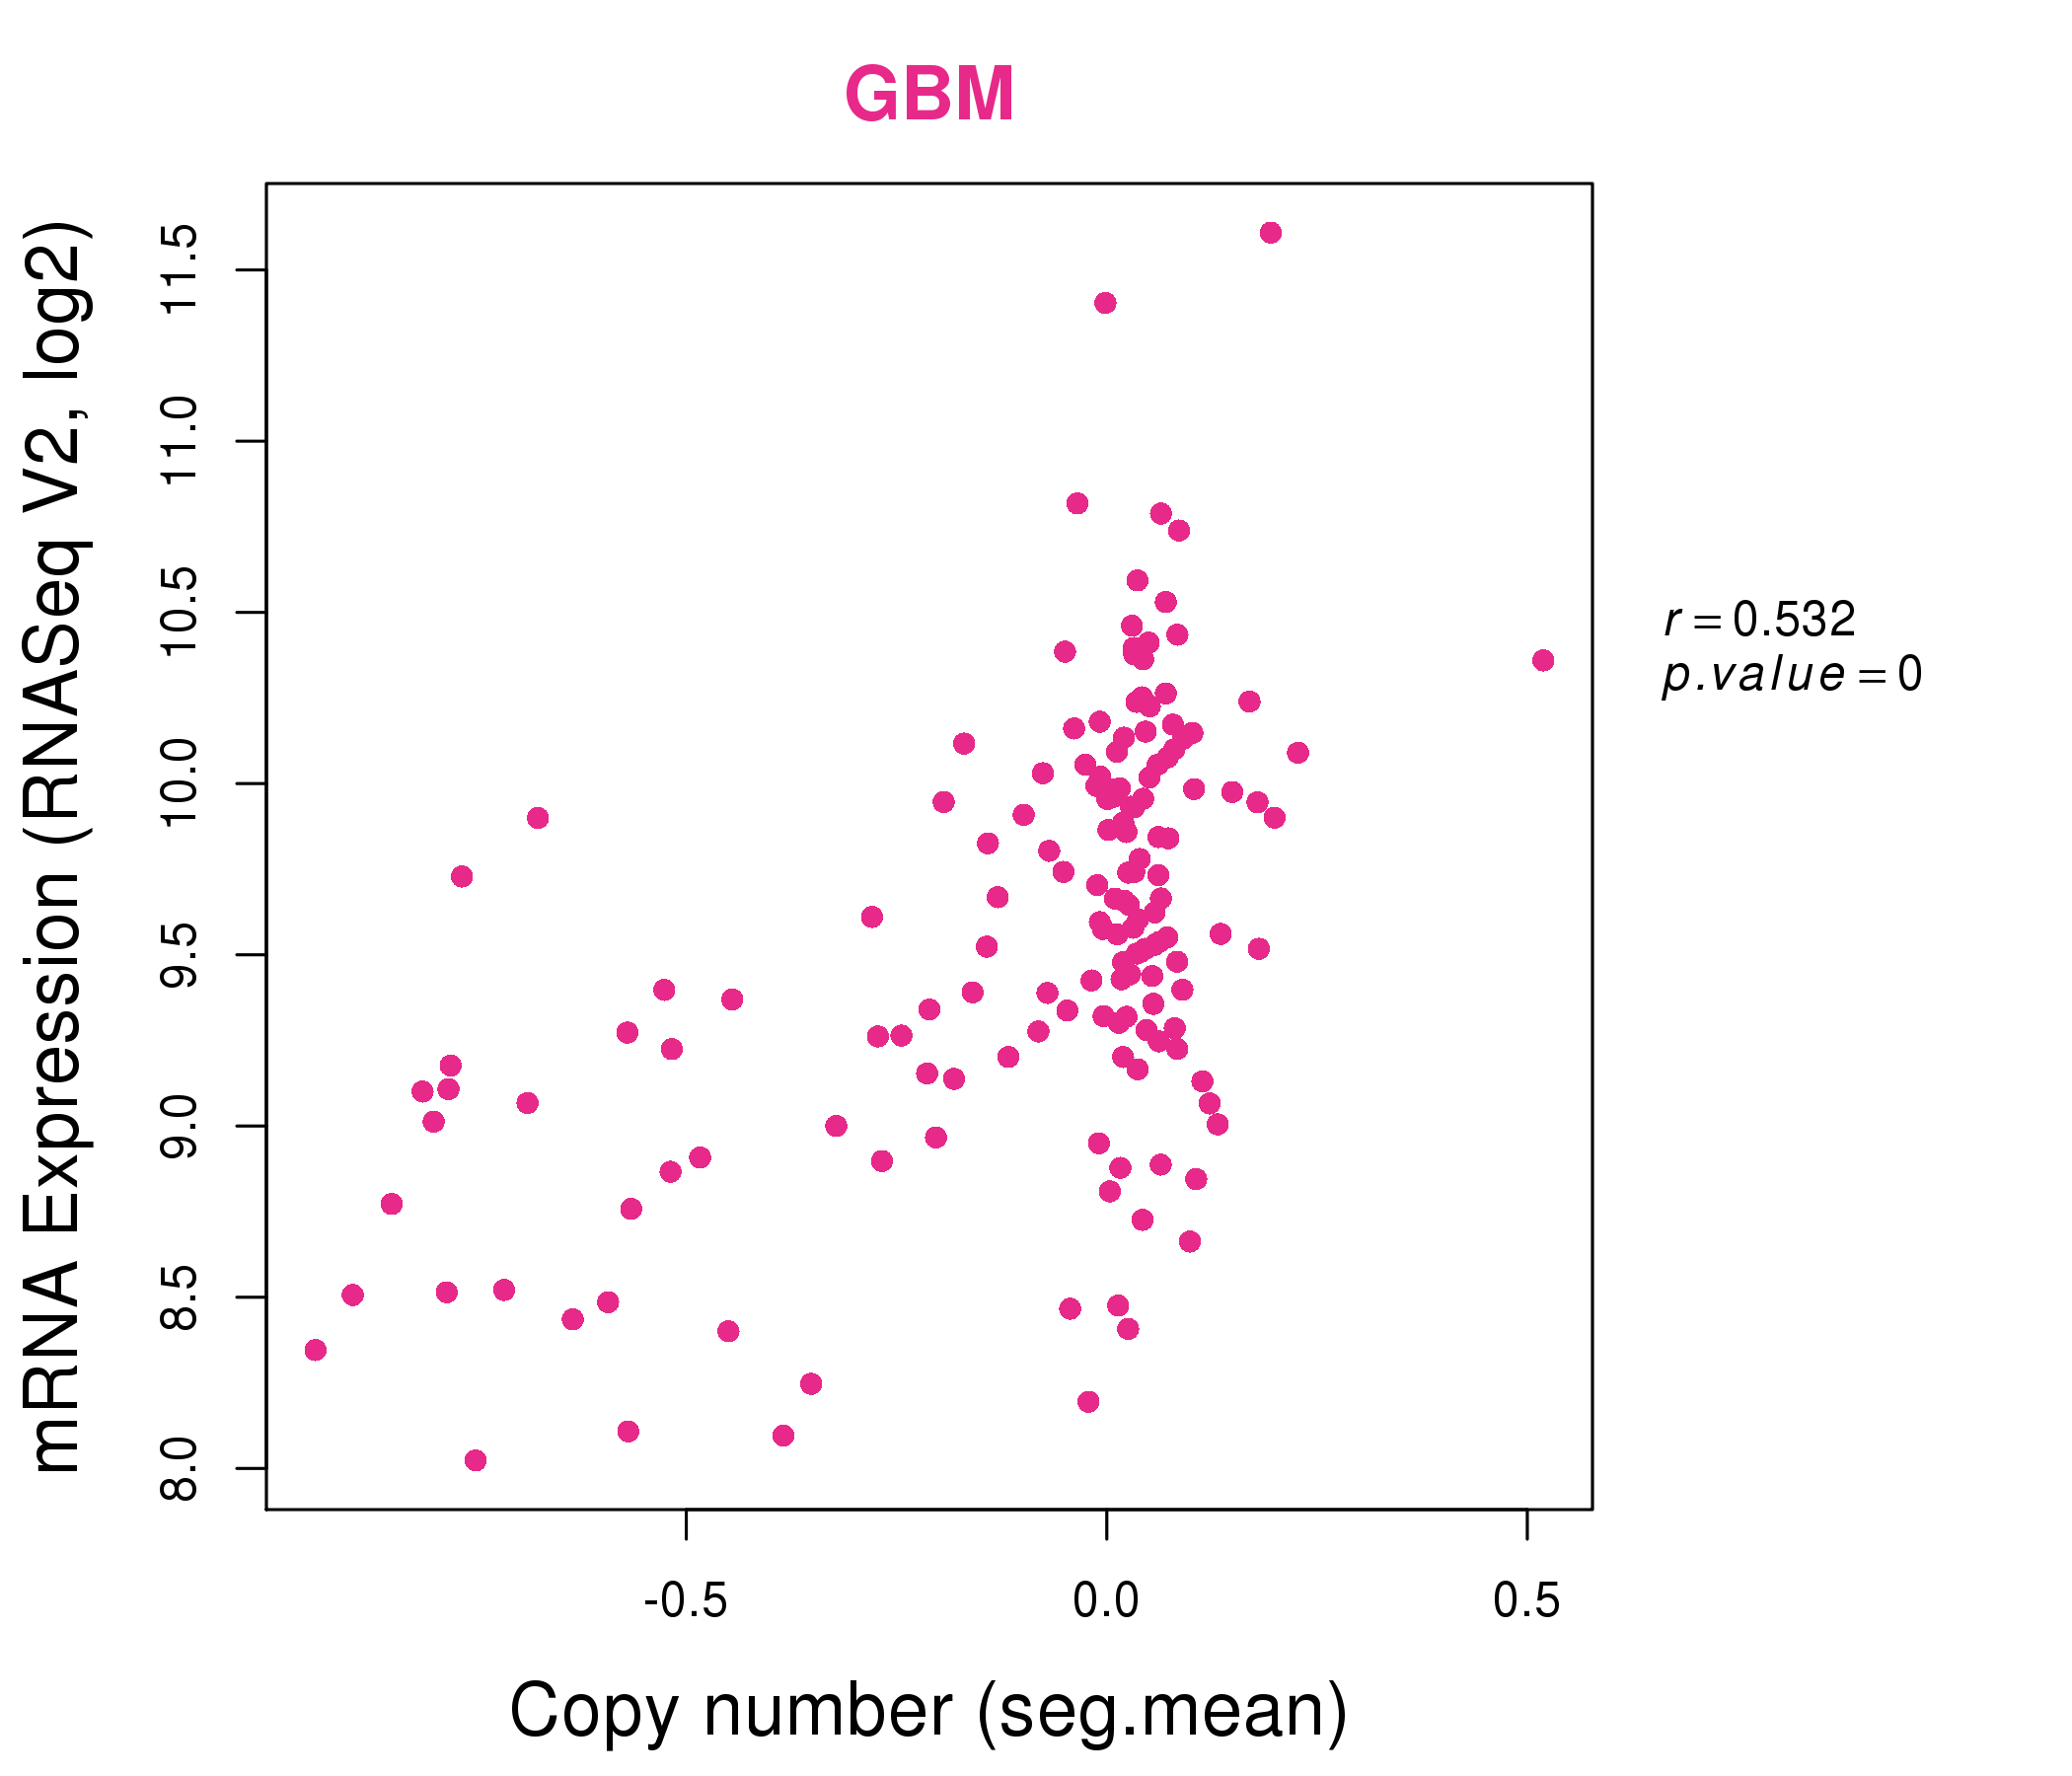
| * Normalized gene expression data of RNASeqV2 was extracted from TCGA using R package TCGA-Assembler. The URLs of all public data files on TCGA DCC data server were gathered at Jan-05-2015. Only eight cancer types have enough normal control samples for differential expression analysis. (t test, adjusted p<0.05 (using Benjamini-Hochberg FDR)) |
 |
| Top |
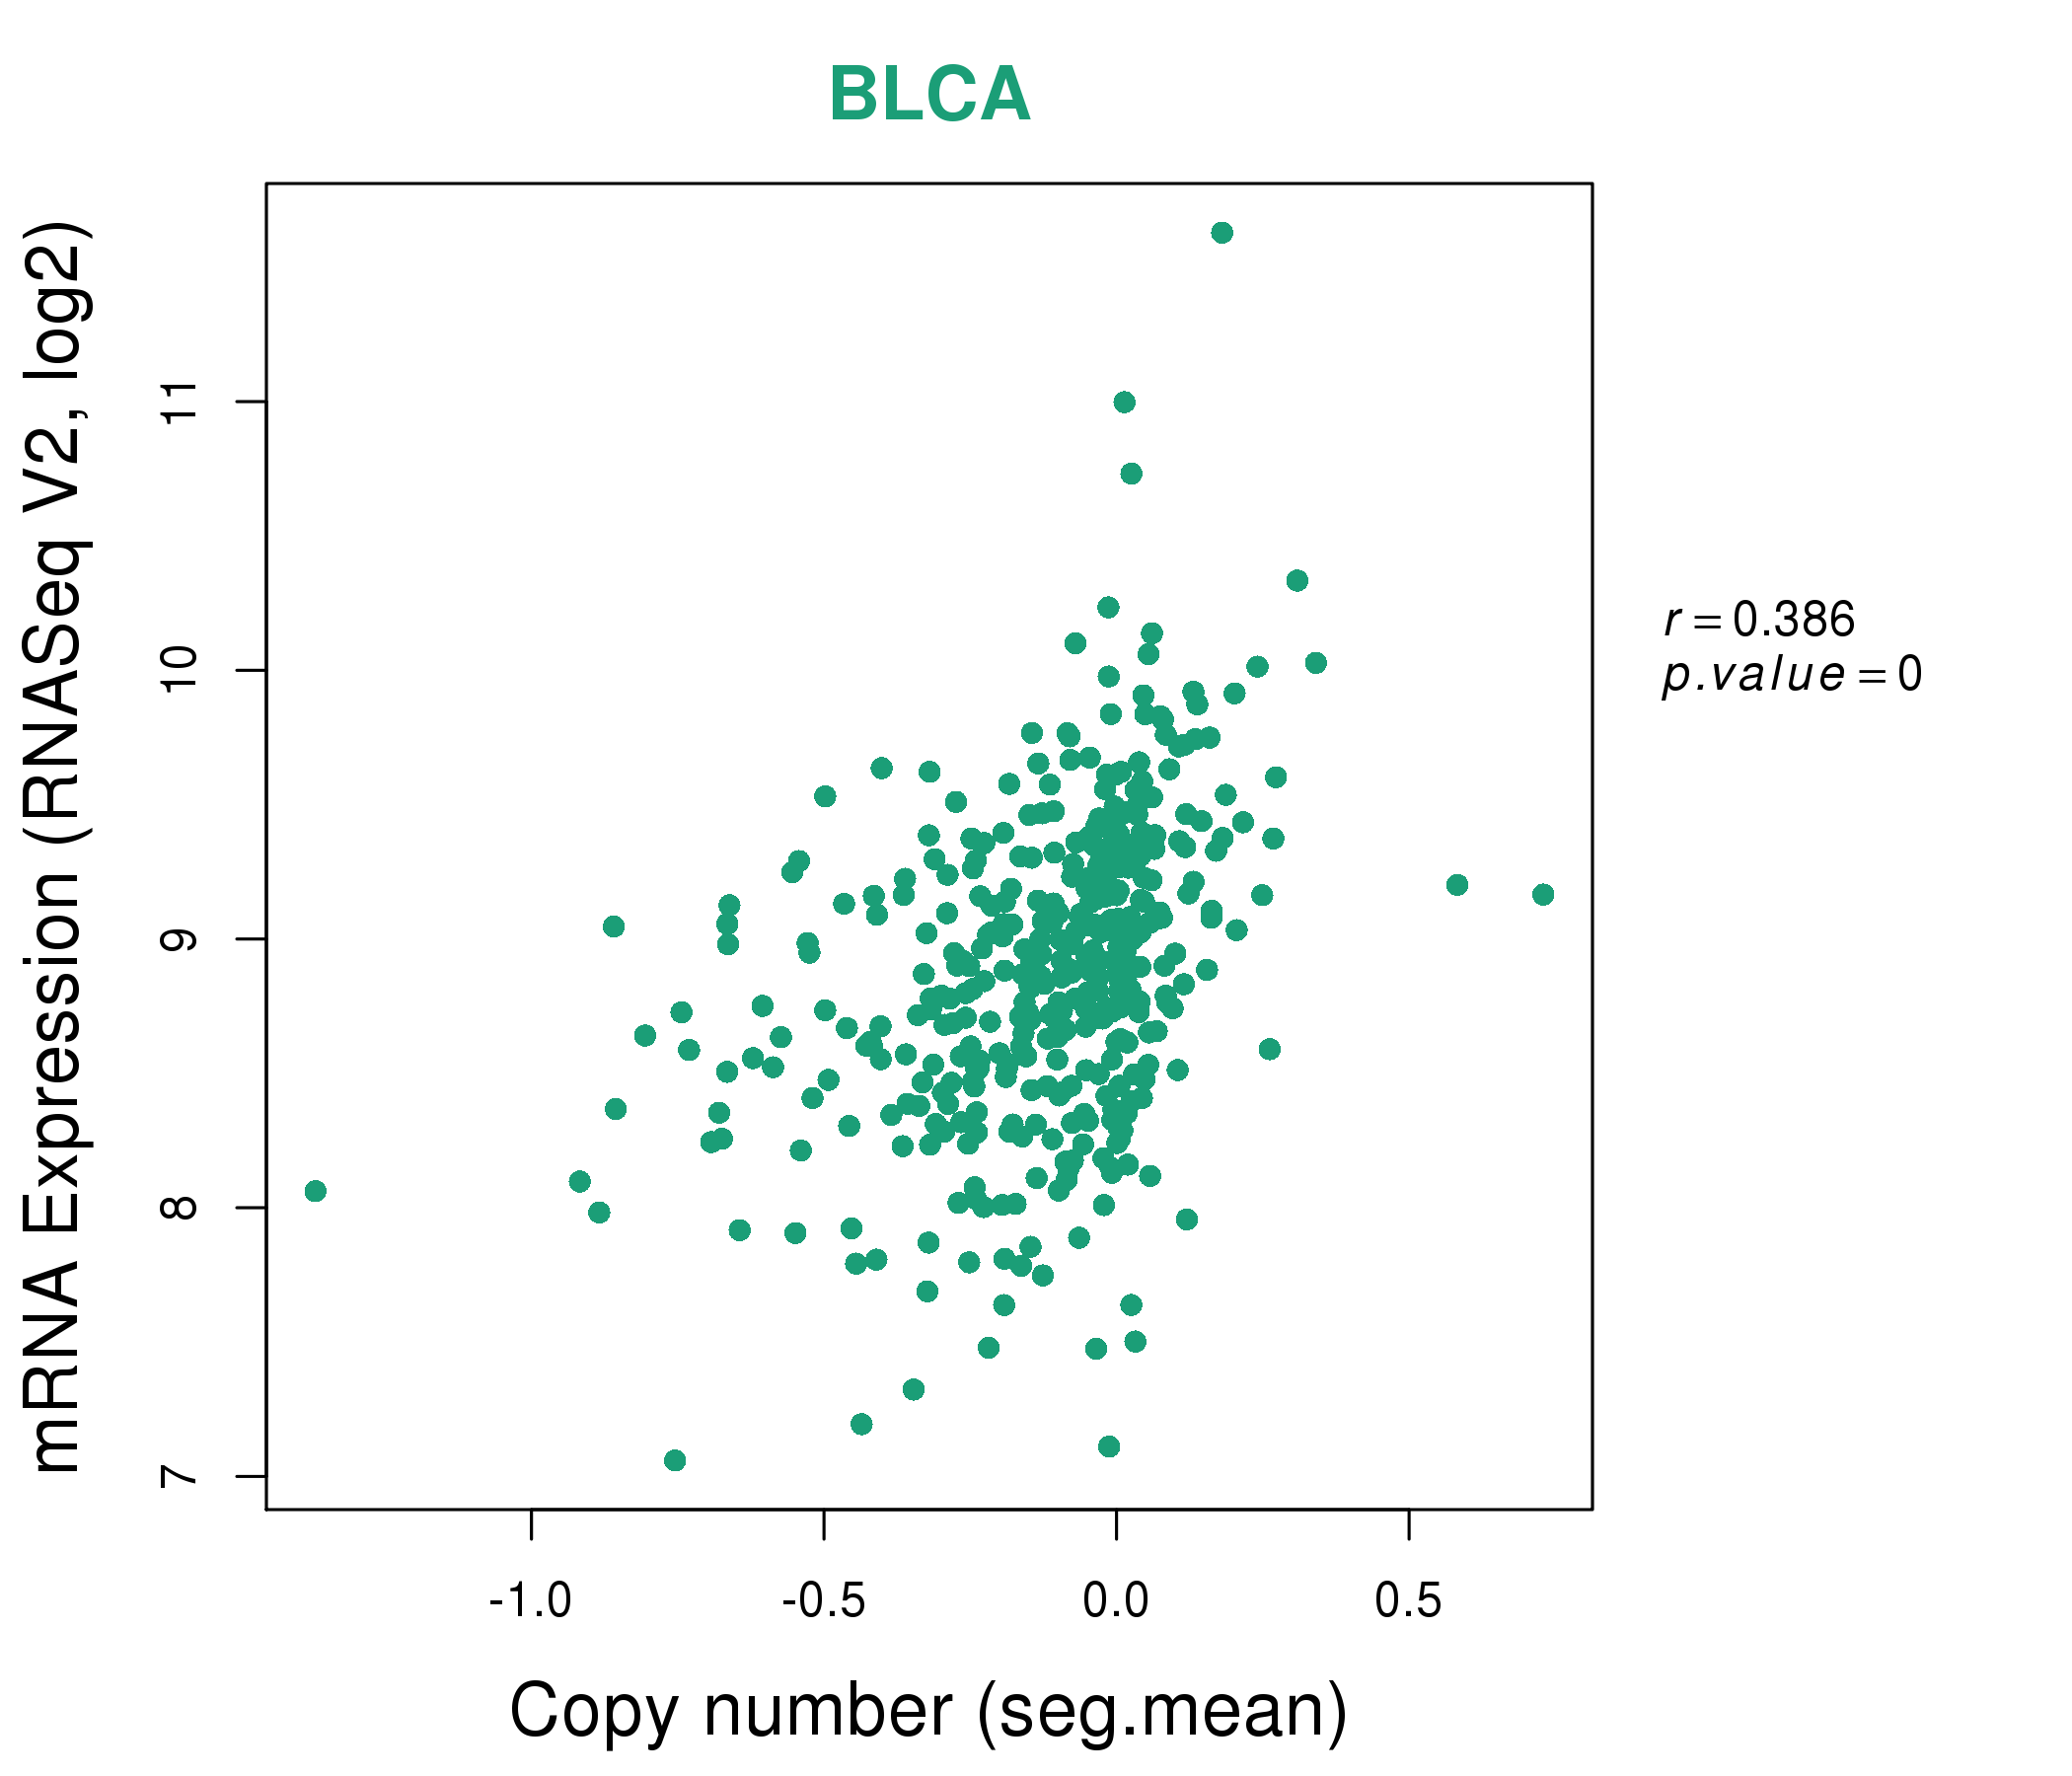
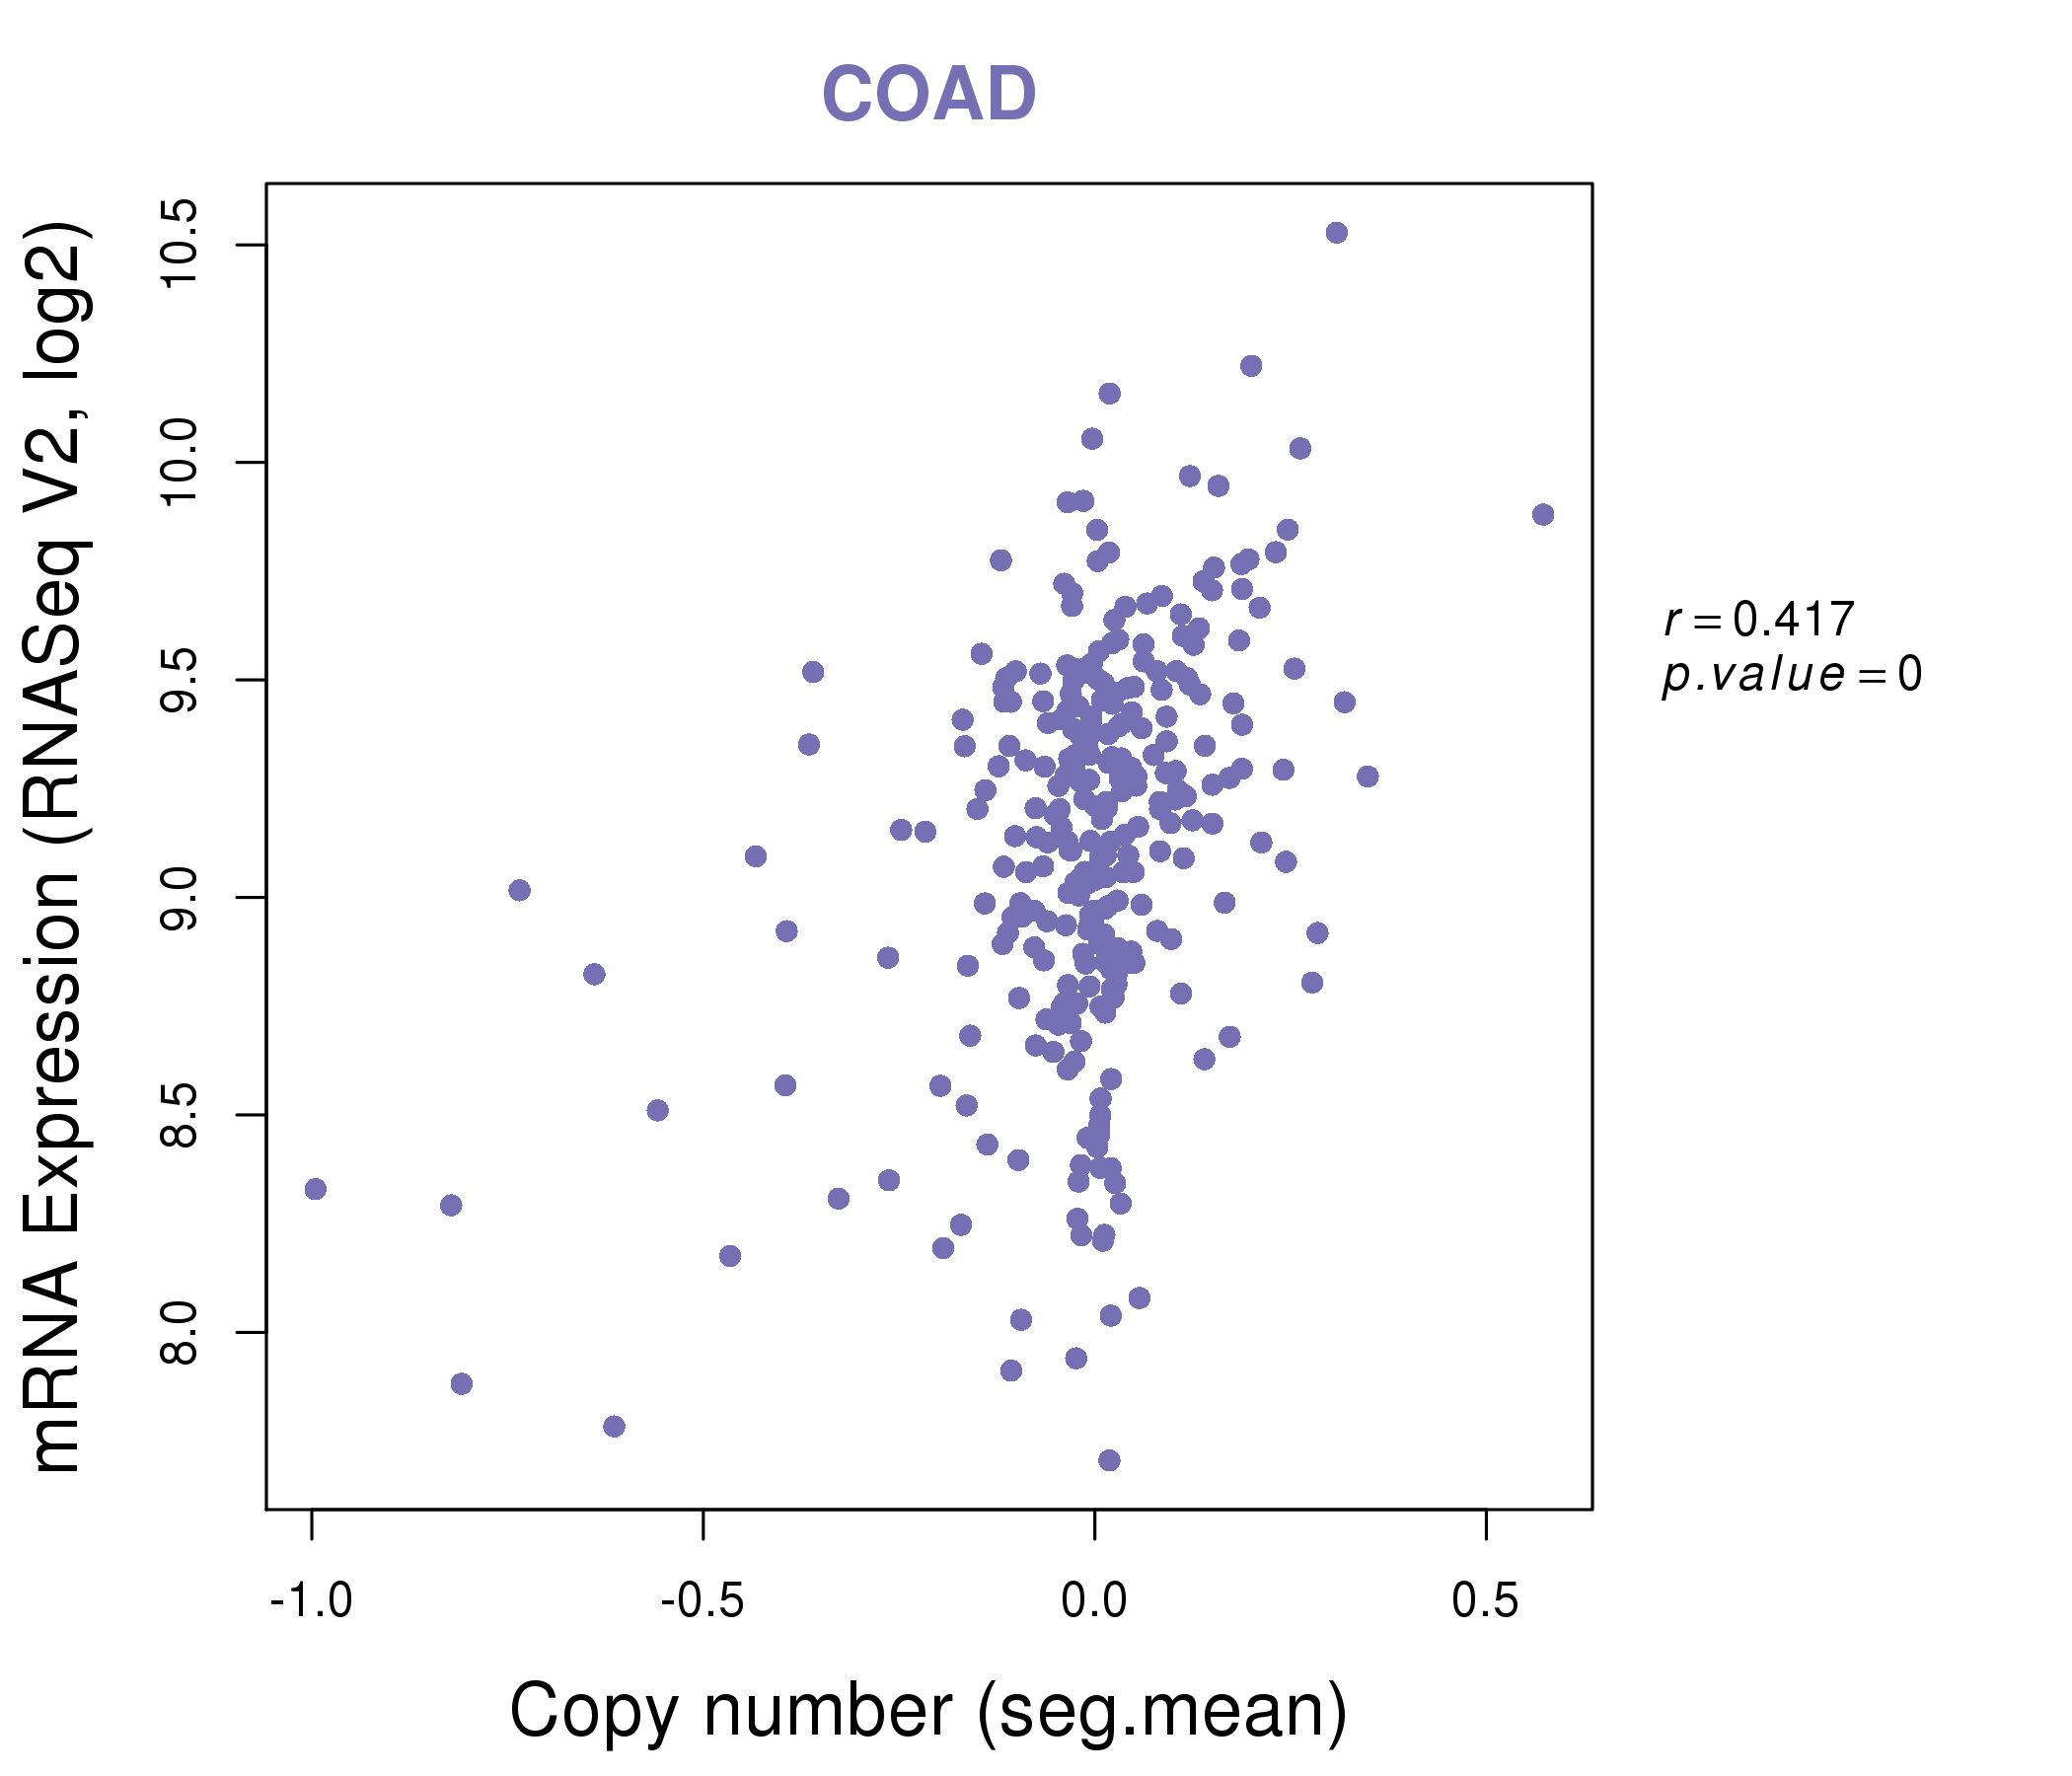
| * This plots show the correlation between CNV and gene expression. |
: Open all plots for all cancer types
 |
|
 |
|
| Top |
| Gene-Gene Network Information |
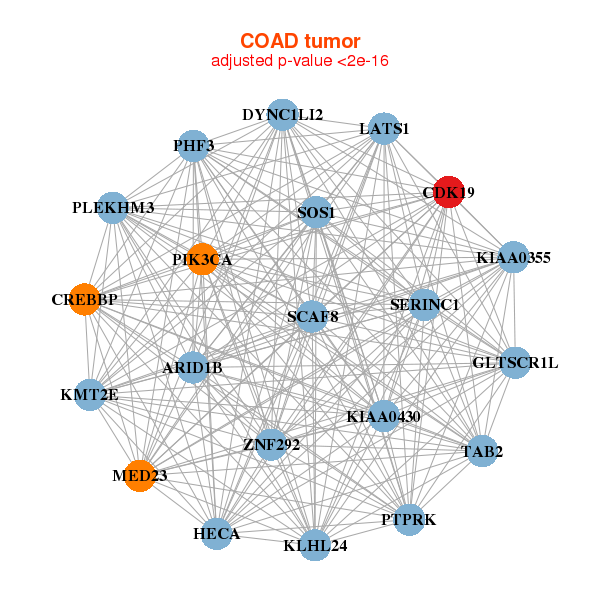
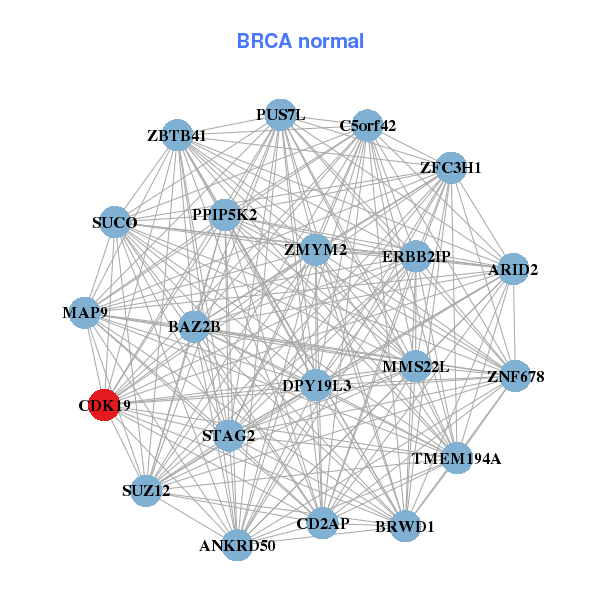
| * Co-Expression network figures were drawn using R package igraph. Only the top 20 genes with the highest correlations were shown. Red circle: input gene, orange circle: cell metabolism gene, sky circle: other gene |
: Open all plots for all cancer types
 |
|
| AK9,AMD1,ARMC2,CEP57L1,CD164,CD24,CDC40, CDK19,FOXO3,FOXO3B,HACE1,LHX1,MRGPRD,PRIM2, REV3L,RPF2,SEC63,SYNCRIP,TRAF3IP2,TUBE1,ZBTB24 | ANKRD50,ARID2,BAZ2B,BRWD1,SUCO,C5orf42,MMS22L, CD2AP,CDK19,DPY19L3,ERBB2IP,MAP9,PPIP5K2,PUS7L, STAG2,SUZ12,TMEM194A,ZBTB41,ZFC3H1,ZMYM2,ZNF678 |
 |
|
| ARID1B,CDK19,CREBBP,DYNC1LI2,HECA,GLTSCR1L,KIAA0355, KIAA0430,KLHL24,LATS1,MED23,KMT2E,PHF3,PIK3CA, PLEKHM3,PTPRK,SCAF8,SERINC1,SOS1,TAB2,ZNF292 | ATP9A,BAHD1,BTBD9,CDK19,COL17A1,CTDSP2,CXorf23, ERBB3,HECA,IGSF3,INSR,LOC90110,MKRN1,N4BP1, NBR1,PLCL2,RMND5A,RXRA,SLC26A2,SORL1,SPPL3 |
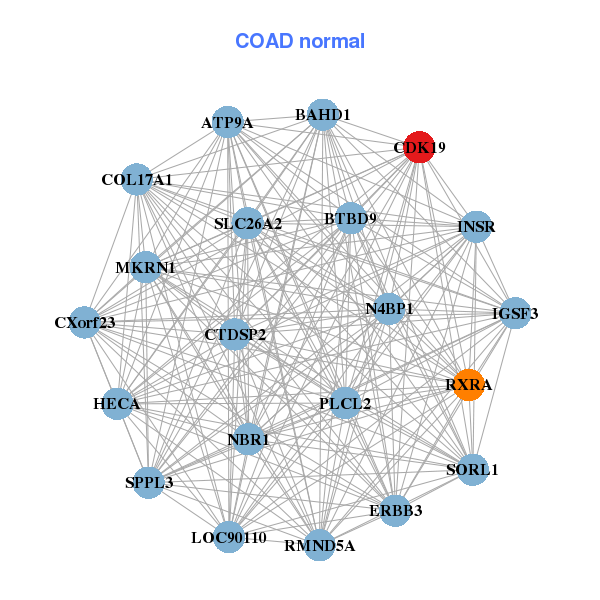
| * Co-Expression network figures were drawn using R package igraph. Only the top 20 genes with the highest correlations were shown. Red circle: input gene, orange circle: cell metabolism gene, sky circle: other gene |
: Open all plots for all cancer types
| Top |
: Open all interacting genes' information including KEGG pathway for all interacting genes from DAVID
| Top |
| Pharmacological Information for CDK19 |
| There's no related Drug. |
| Top |
| Cross referenced IDs for CDK19 |
| * We obtained these cross-references from Uniprot database. It covers 150 different DBs, 18 categories. http://www.uniprot.org/help/cross_references_section |
: Open all cross reference information
|
Copyright © 2016-Present - The Univsersity of Texas Health Science Center at Houston @ |