|
|||||||||||||||||||||||||||||||||||||||||||||||||||||||||||||||||||||||||||||||||||||||||||||||||||||||||||||||||||||||||||||||||||||||||||||||||||||||||||||||||||||||||||||||||||||||||||||||||||||||||||||||||||||||||||||||||||||||||||||||||||||||||||||||||||||||||||||||||||||||||||||||||||||||||||||||||||||||||||||||||||||||||||||
| |
| Phenotypic Information (metabolism pathway, cancer, disease, phenome) |
| |
| |
| Gene-Gene Network Information: Co-Expression Network, Interacting Genes & KEGG |
| |
|


| Gene Summary for LPIN1 |
| Basic gene info. | Gene symbol | LPIN1 |
| Gene name | lipin 1 | |
| Synonyms | PAP1 | |
| Cytomap | UCSC genome browser: 2p25.1 | |
| Genomic location | chr2 :11886739-11967533 | |
| Type of gene | protein-coding | |
| RefGenes | NM_001261427.1, NM_001261428.1,NM_001261429.1,NM_145693.2, | |
| Ensembl id | ENSG00000134324 | |
| Description | lipin-1phosphatidate phosphatase LPIN1 | |
| Modification date | 20141207 | |
| dbXrefs | MIM : 605518 | |
| HGNC : HGNC | ||
| Ensembl : ENSG00000134324 | ||
| HPRD : 09271 | ||
| Vega : OTTHUMG00000119082 | ||
| Protein | UniProt: go to UniProt's Cross Reference DB Table | |
| Expression | CleanEX: HS_LPIN1 | |
| BioGPS: 23175 | ||
| Gene Expression Atlas: ENSG00000134324 | ||
| The Human Protein Atlas: ENSG00000134324 | ||
| Pathway | NCI Pathway Interaction Database: LPIN1 | |
| KEGG: LPIN1 | ||
| REACTOME: LPIN1 | ||
| ConsensusPathDB | ||
| Pathway Commons: LPIN1 | ||
| Metabolism | MetaCyc: LPIN1 | |
| HUMANCyc: LPIN1 | ||
| Regulation | Ensembl's Regulation: ENSG00000134324 | |
| miRBase: chr2 :11,886,739-11,967,533 | ||
| TargetScan: NM_001261427 | ||
| cisRED: ENSG00000134324 | ||
| Context | iHOP: LPIN1 | |
| cancer metabolism search in PubMed: LPIN1 | ||
| UCL Cancer Institute: LPIN1 | ||
| Assigned class in ccmGDB | C | |
| Top |
| Phenotypic Information for LPIN1(metabolism pathway, cancer, disease, phenome) |
| Cancer | CGAP: LPIN1 |
| Familial Cancer Database: LPIN1 | |
| * This gene is included in those cancer gene databases. |
|
|
|
|
|
|
| |||||||||||||||||||||||||||||||||||||||||||||||||||||||||||||||||||||||||||||||||||||||||||||||||||||||||||||||||||||||||||||||||||||||||||||||||||||||||||||||||||||||||||||||||||||||||||||||||||||||||||||||||||||||||||||||||||||||||||||||||||||||||||||||||||||||||||||||||||||||||||||||||||||||||||||||||||||||||||||||||||||||
Oncogene 1 | Significant driver gene in | ||||||||||||||||||||||||||||||||||||||||||||||||||||||||||||||||||||||||||||||||||||||||||||||||||||||||||||||||||||||||||||||||||||||||||||||||||||||||||||||||||||||||||||||||||||||||||||||||||||||||||||||||||||||||||||||||||||||||||||||||||||||||||||||||||||||||||||||||||||||||||||||||||||||||||||||||||||||||||||||||||||||||||||
| cf) number; DB name 1 Oncogene; http://nar.oxfordjournals.org/content/35/suppl_1/D721.long, 2 Tumor Suppressor gene; https://bioinfo.uth.edu/TSGene/, 3 Cancer Gene Census; http://www.nature.com/nrc/journal/v4/n3/abs/nrc1299.html, 4 CancerGenes; http://nar.oxfordjournals.org/content/35/suppl_1/D721.long, 5 Network of Cancer Gene; http://ncg.kcl.ac.uk/index.php, 1Therapeutic Vulnerabilities in Cancer; http://cbio.mskcc.org/cancergenomics/statius/ |
| REACTOME_PHOSPHOLIPID_METABOLISM REACTOME_METABOLISM_OF_LIPIDS_AND_LIPOPROTEINS | |
| OMIM | |
| Orphanet | |
| Disease | KEGG Disease: LPIN1 |
| MedGen: LPIN1 (Human Medical Genetics with Condition) | |
| ClinVar: LPIN1 | |
| Phenotype | MGI: LPIN1 (International Mouse Phenotyping Consortium) |
| PhenomicDB: LPIN1 | |
| Mutations for LPIN1 |
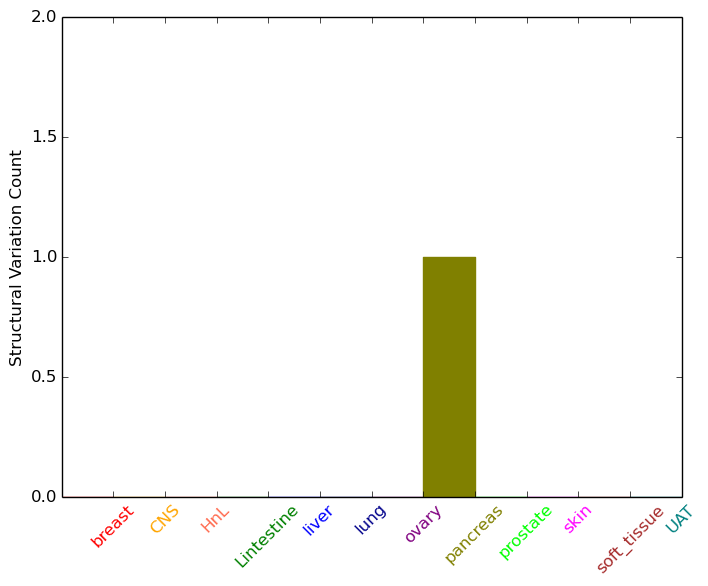
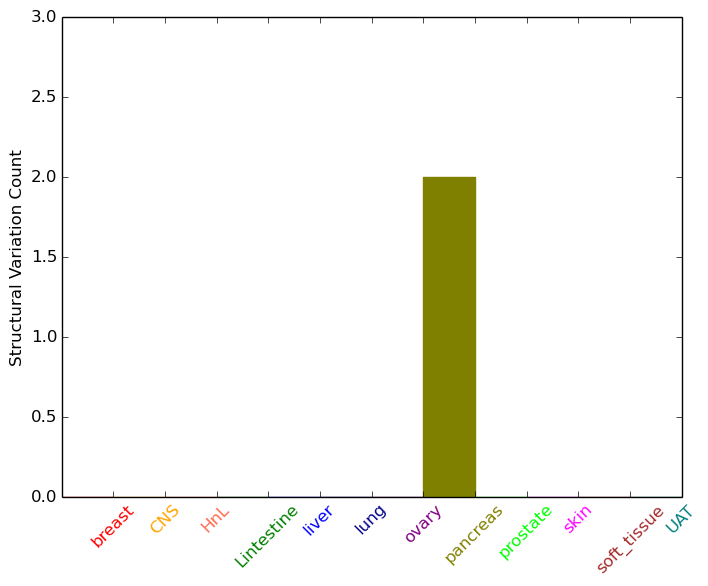
| * Under tables are showing count per each tissue to give us broad intuition about tissue specific mutation patterns.You can go to the detailed page for each mutation database's web site. |
| - Statistics for Tissue and Mutation type | Top |
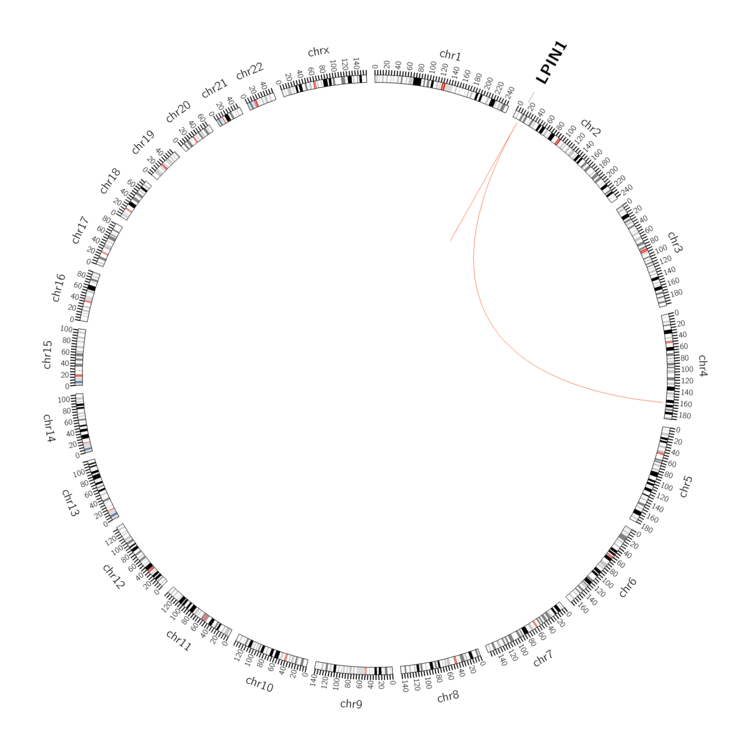 |
| - For Inter-chromosomal Variations |
| * Inter-chromosomal variantions includes 'interchromosomal amplicon to amplicon', 'interchromosomal amplicon to non-amplified dna', 'interchromosomal insertion', 'Interchromosomal unknown type'. |
 |
| - For Intra-chromosomal Variations |
| * Intra-chromosomal variantions includes 'intrachromosomal amplicon to amplicon', 'intrachromosomal amplicon to non-amplified dna', 'intrachromosomal deletion', 'intrachromosomal fold-back inversion', 'intrachromosomal inversion', 'intrachromosomal tandem duplication', 'Intrachromosomal unknown type', 'intrachromosomal with inverted orientation', 'intrachromosomal with non-inverted orientation'. |
 |
| Sample | Symbol_a | Chr_a | Start_a | End_a | Symbol_b | Chr_b | Start_b | End_b |
| pancreas | LPIN1 | chr2 | 11889535 | 11889555 | chr2 | 11870036 | 11870056 | |
| pancreas | LPIN1 | chr2 | 11902827 | 11902847 | chr2 | 11855171 | 11855191 | |
| pancreas | LPIN1 | chr2 | 11930008 | 11930028 | chr4 | 162053240 | 162053260 |
| cf) Tissue number; Tissue name (1;Breast, 2;Central_nervous_system, 3;Haematopoietic_and_lymphoid_tissue, 4;Large_intestine, 5;Liver, 6;Lung, 7;Ovary, 8;Pancreas, 9;Prostate, 10;Skin, 11;Soft_tissue, 12;Upper_aerodigestive_tract) |
| * From mRNA Sanger sequences, Chitars2.0 arranged chimeric transcripts. This table shows LPIN1 related fusion information. |
| ID | Head Gene | Tail Gene | Accession | Gene_a | qStart_a | qEnd_a | Chromosome_a | tStart_a | tEnd_a | Gene_a | qStart_a | qEnd_a | Chromosome_a | tStart_a | tEnd_a |
| DA403287 | ARL16 | 1 | 163 | 17 | 79650564 | 79650824 | LPIN1 | 161 | 542 | 2 | 11905658 | 11911581 | |
| BF932023 | ANKS1B | 18 | 276 | 12 | 99145182 | 99166957 | LPIN1 | 270 | 422 | 2 | 11944623 | 11945273 | |
| BF365751 | ARGLU1 | 1 | 78 | 13 | 107210812 | 107210889 | LPIN1 | 71 | 227 | 2 | 11938938 | 11939094 | |
| AW889856 | ARGLU1 | 1 | 78 | 13 | 107210812 | 107210889 | LPIN1 | 71 | 227 | 2 | 11938938 | 11939094 | |
| BF352637 | LPIN1 | 31 | 231 | 2 | 11959372 | 11959572 | LPIN1 | 230 | 352 | 2 | 11959577 | 11959699 | |
| BF352618 | LPIN1 | 23 | 223 | 2 | 11959372 | 11959572 | LPIN1 | 222 | 344 | 2 | 11959577 | 11959699 | |
| Top |
| Mutation type/ Tissue ID | brca | cns | cerv | endome | haematopo | kidn | Lintest | liver | lung | ns | ovary | pancre | prost | skin | stoma | thyro | urina | |||
| Total # sample | 1 | |||||||||||||||||||
| GAIN (# sample) | ||||||||||||||||||||
| LOSS (# sample) | 1 |
| cf) Tissue ID; Tissue type (1; Breast, 2; Central_nervous_system, 3; Cervix, 4; Endometrium, 5; Haematopoietic_and_lymphoid_tissue, 6; Kidney, 7; Large_intestine, 8; Liver, 9; Lung, 10; NS, 11; Ovary, 12; Pancreas, 13; Prostate, 14; Skin, 15; Stomach, 16; Thyroid, 17; Urinary_tract) |
| Top |
|
 |
| Top |
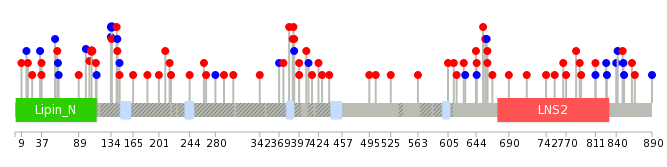
| Stat. for Non-Synonymous SNVs (# total SNVs=67) | (# total SNVs=24) |
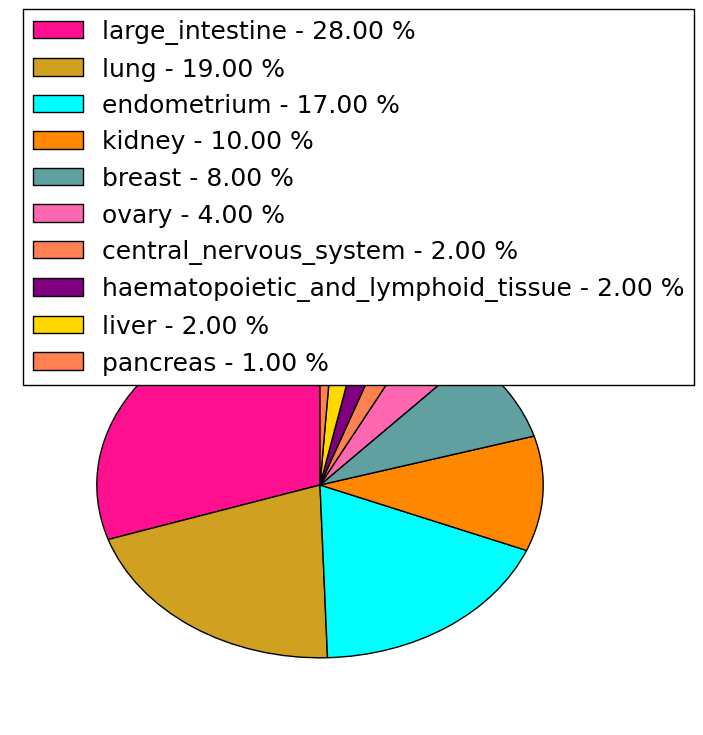 | 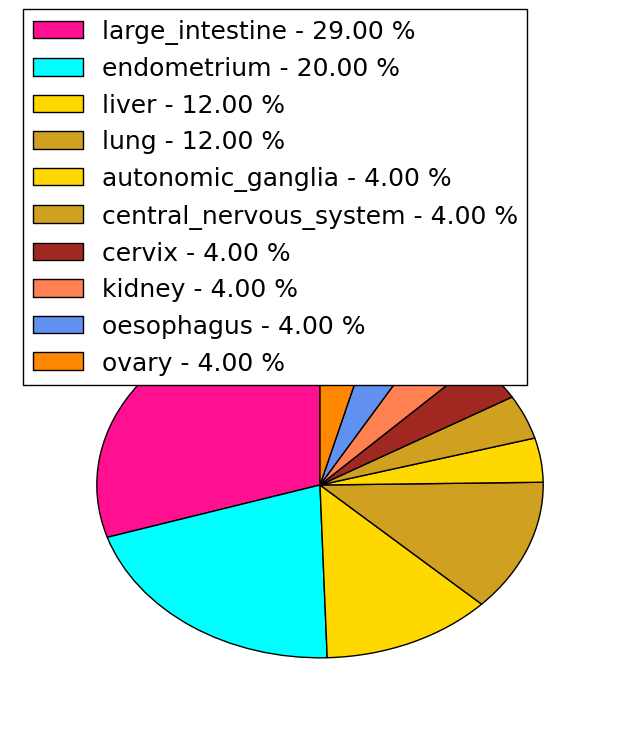 |
(# total SNVs=1) | (# total SNVs=2) |
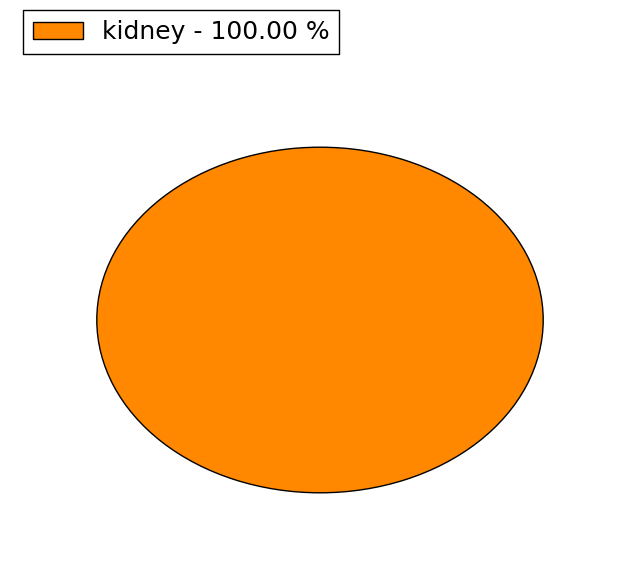 | 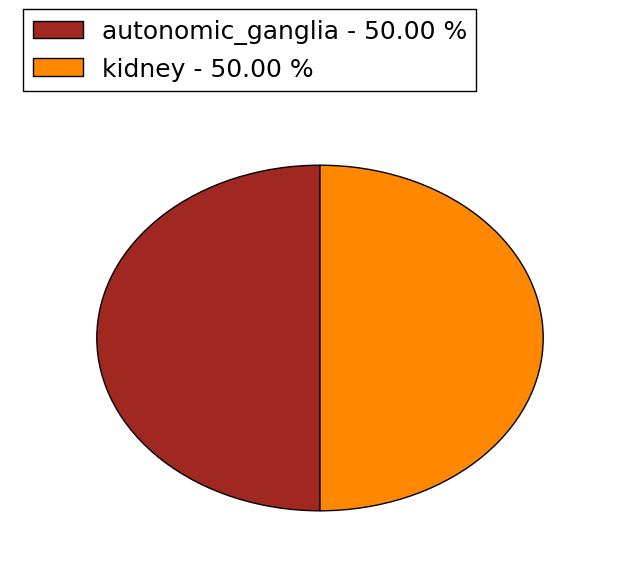 |
| Top |
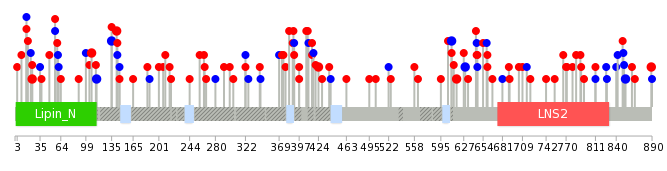
| * When you move the cursor on each content, you can see more deailed mutation information on the Tooltip. Those are primary_site,primary_histology,mutation(aa),pubmedID. |
| GRCh37 position | Mutation(aa) | Unique sampleID count |
| chr2:11943103-11943103 | p.P617S | 2 |
| chr2:11964803-11964803 | p.L853L | 2 |
| chr2:11925031-11925031 | p.A424T | 2 |
| chr2:11943141-11943141 | p.R629R | 2 |
| chr2:11911528-11911528 | p.P107S | 2 |
| chr2:11964910-11964910 | p.S889L | 2 |
| chr2:11911551-11911551 | p.S114S | 2 |
| chr2:11905715-11905715 | p.K16K | 2 |
| chr2:11911614-11911614 | p.T135T | 2 |
| chr2:11911634-11911634 | p.P142L | 2 |
| Top |
|
 |
| Point Mutation/ Tissue ID | 1 | 2 | 3 | 4 | 5 | 6 | 7 | 8 | 9 | 10 | 11 | 12 | 13 | 14 | 15 | 16 | 17 | 18 | 19 | 20 |
| # sample | 4 | 3 | 1 | 14 | 2 | 2 | 4 | 2 | 4 | 4 | 3 | 1 | 17 | 10 | 12 | |||||
| # mutation | 4 | 3 | 1 | 17 | 2 | 2 | 4 | 3 | 4 | 4 | 3 | 1 | 20 | 10 | 16 | |||||
| nonsynonymous SNV | 2 | 3 | 13 | 2 | 1 | 4 | 2 | 2 | 4 | 2 | 1 | 13 | 7 | 11 | ||||||
| synonymous SNV | 2 | 1 | 4 | 1 | 1 | 2 | 1 | 7 | 3 | 5 |
| cf) Tissue ID; Tissue type (1; BLCA[Bladder Urothelial Carcinoma], 2; BRCA[Breast invasive carcinoma], 3; CESC[Cervical squamous cell carcinoma and endocervical adenocarcinoma], 4; COAD[Colon adenocarcinoma], 5; GBM[Glioblastoma multiforme], 6; Glioma Low Grade, 7; HNSC[Head and Neck squamous cell carcinoma], 8; KICH[Kidney Chromophobe], 9; KIRC[Kidney renal clear cell carcinoma], 10; KIRP[Kidney renal papillary cell carcinoma], 11; LAML[Acute Myeloid Leukemia], 12; LUAD[Lung adenocarcinoma], 13; LUSC[Lung squamous cell carcinoma], 14; OV[Ovarian serous cystadenocarcinoma ], 15; PAAD[Pancreatic adenocarcinoma], 16; PRAD[Prostate adenocarcinoma], 17; SKCM[Skin Cutaneous Melanoma], 18:STAD[Stomach adenocarcinoma], 19:THCA[Thyroid carcinoma], 20:UCEC[Uterine Corpus Endometrial Carcinoma]) |
| Top |
| * We represented just top 10 SNVs. When you move the cursor on each content, you can see more deailed mutation information on the Tooltip. Those are primary_site, primary_histology, mutation(aa), pubmedID. |
| Genomic Position | Mutation(aa) | Unique sampleID count |
| chr2:11911614 | p.P107S,LPIN1 | 2 |
| chr2:11911638 | p.T135T,LPIN1 | 2 |
| chr2:11911528 | p.S143S,LPIN1 | 2 |
| chr2:11911613 | p.V89I,LPIN1 | 1 |
| chr2:11925046 | p.D210E,LPIN1 | 1 |
| chr2:11960606 | p.R390Q,LPIN1 | 1 |
| chr2:11913802 | p.T627N,LPIN1 | 1 |
| chr2:11944573 | p.K770N,LPIN1 | 1 |
| chr2:11905843 | p.I99I,LPIN1 | 1 |
| chr2:11923961 | p.N216S,LPIN1 | 1 |
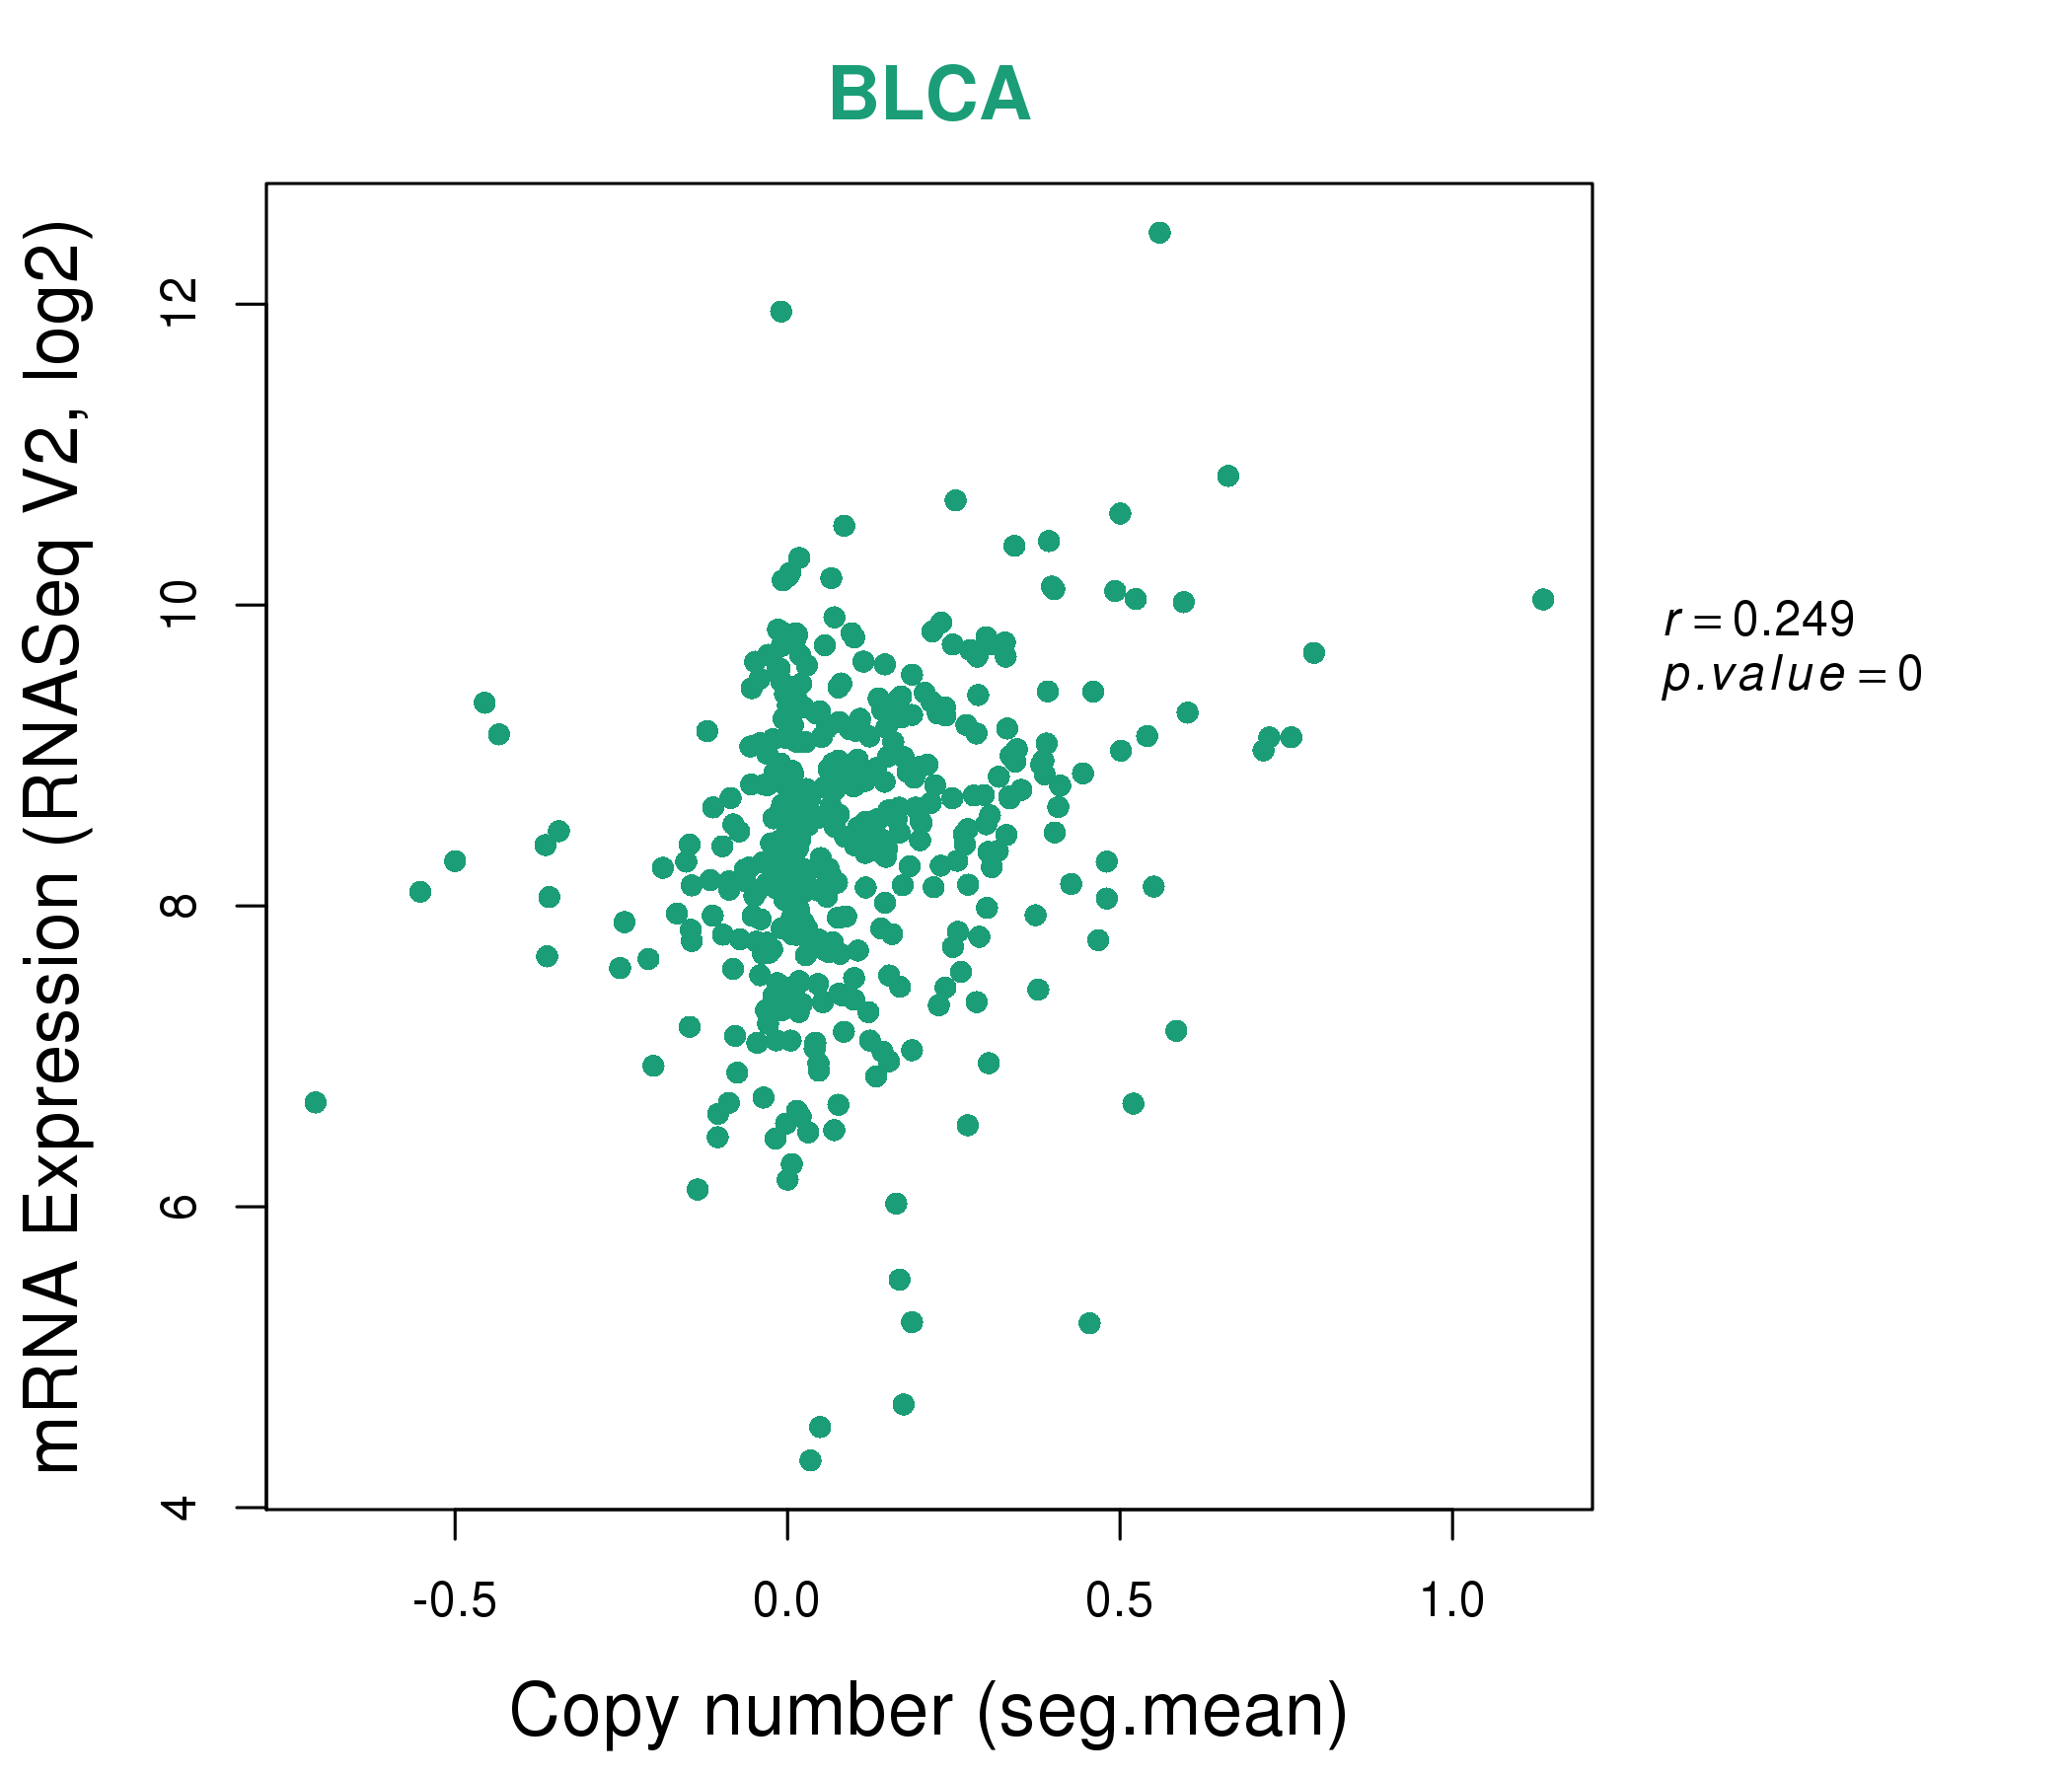
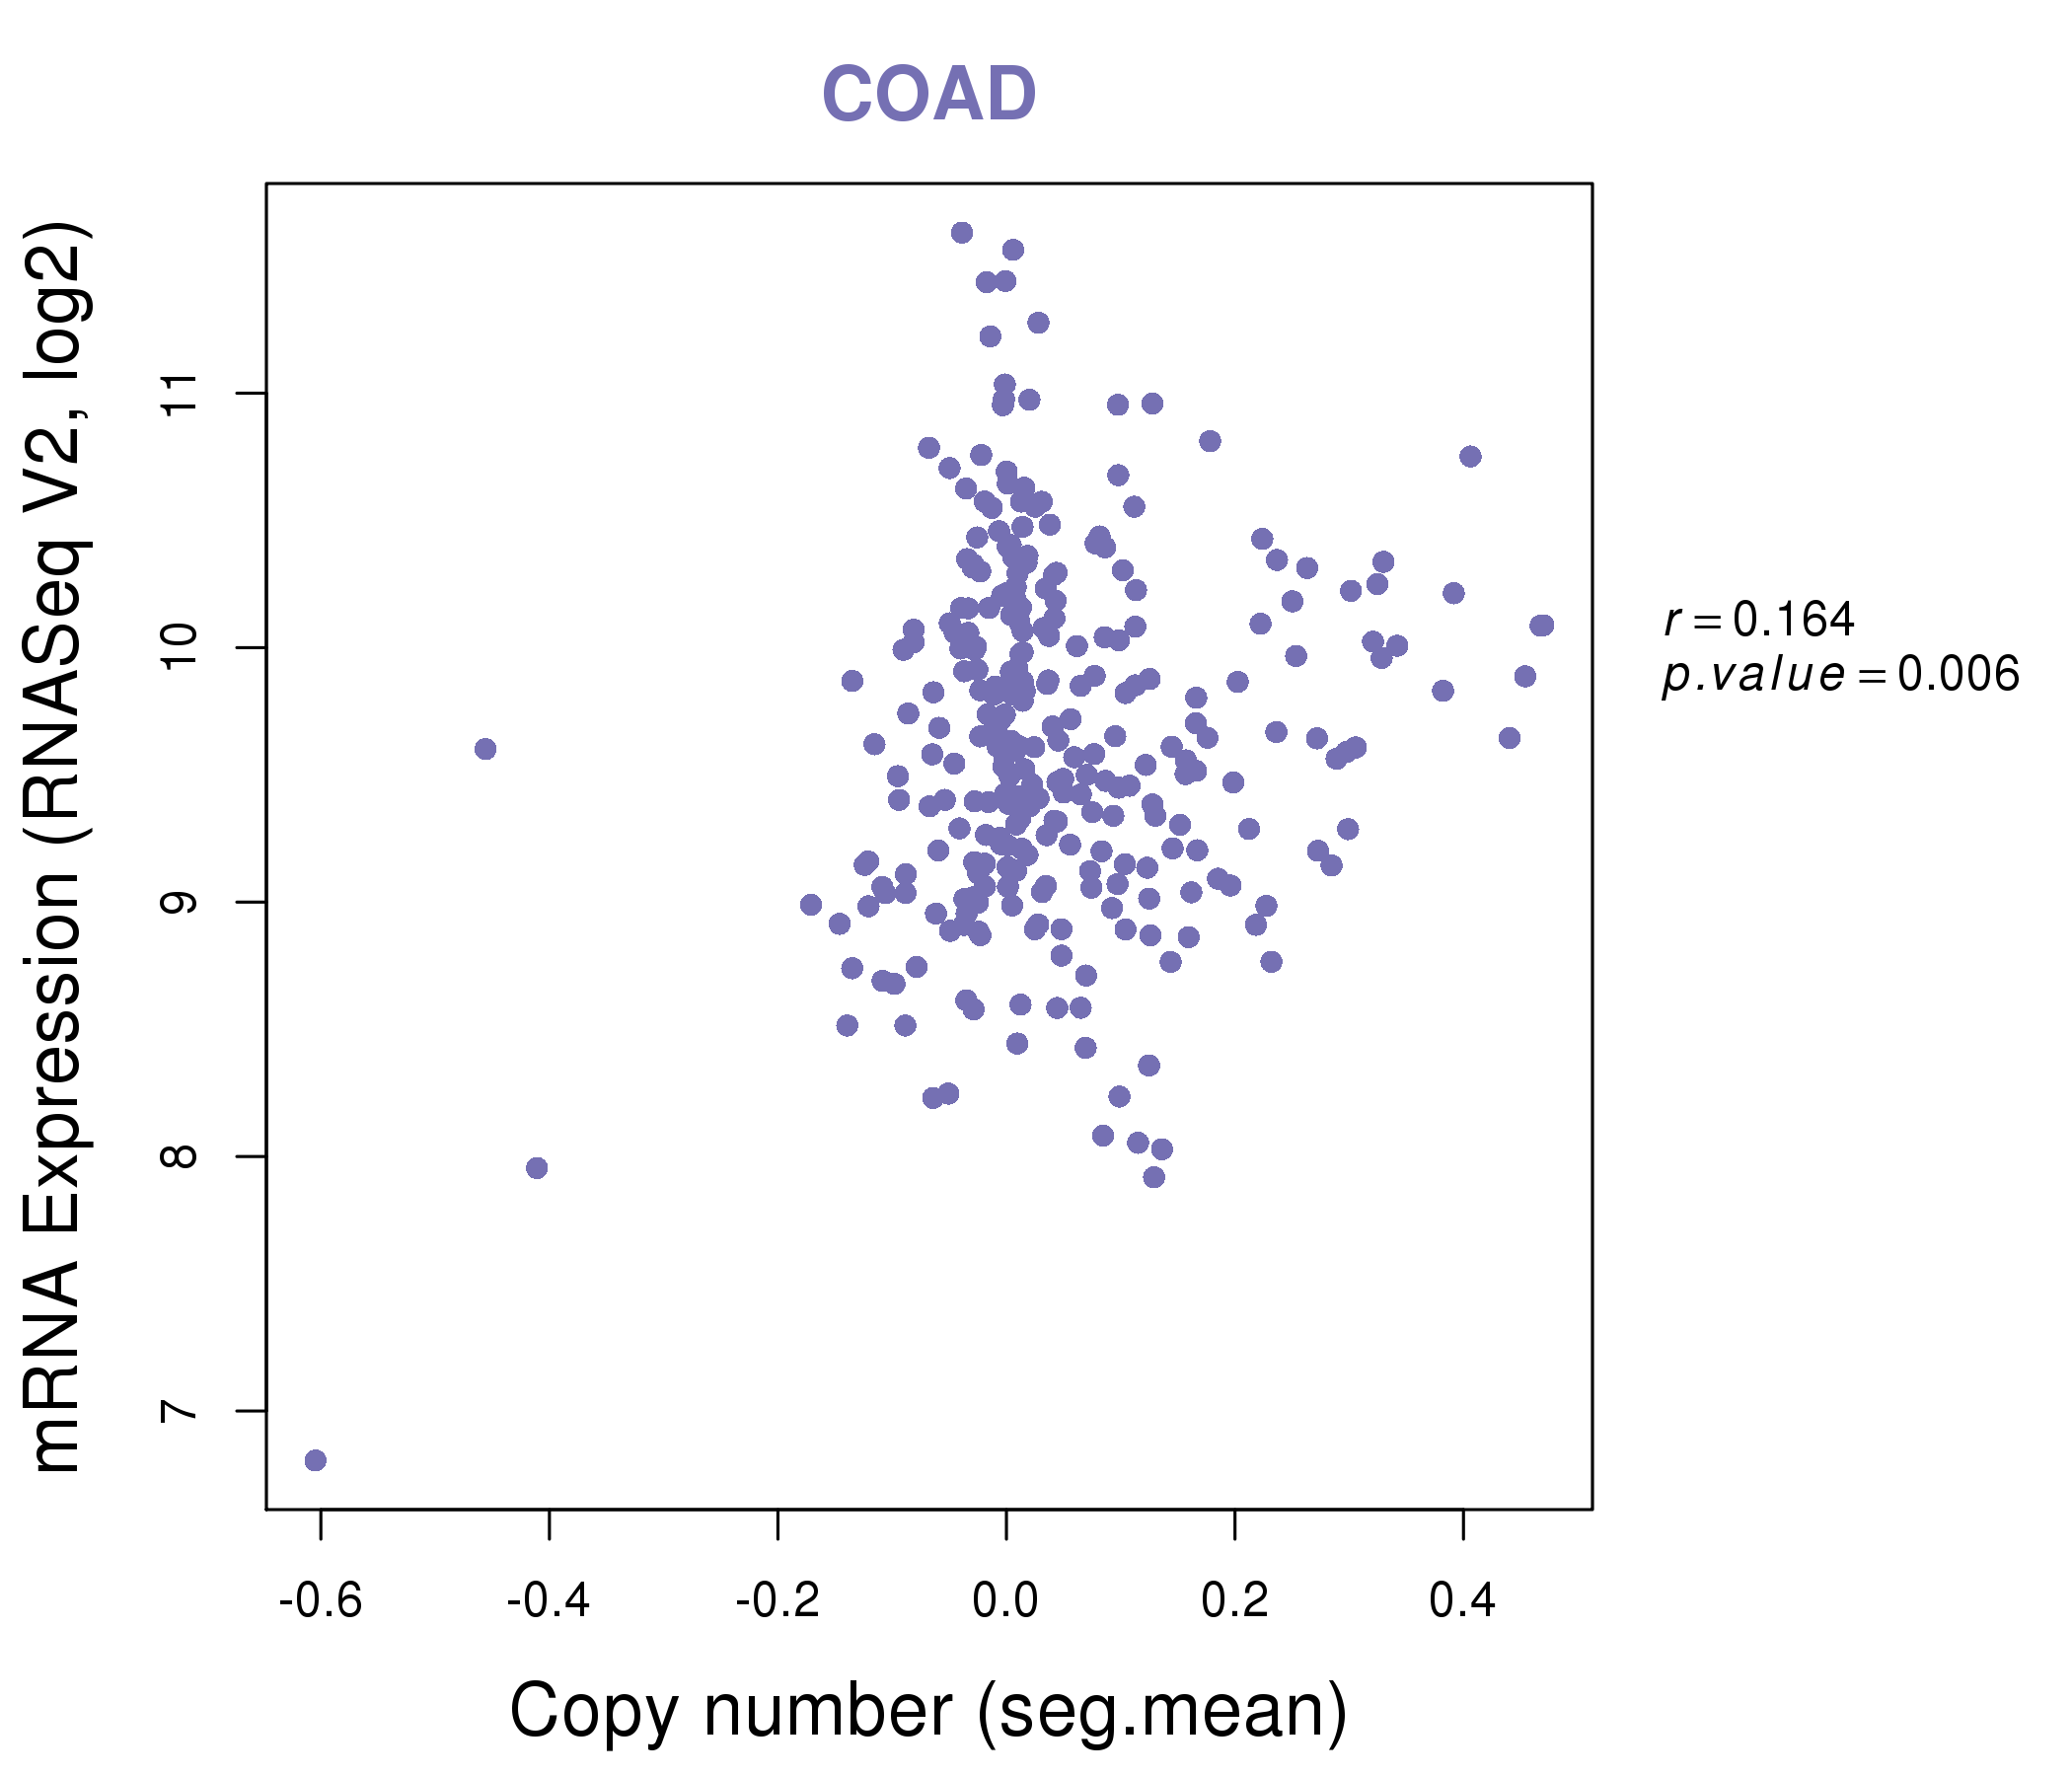
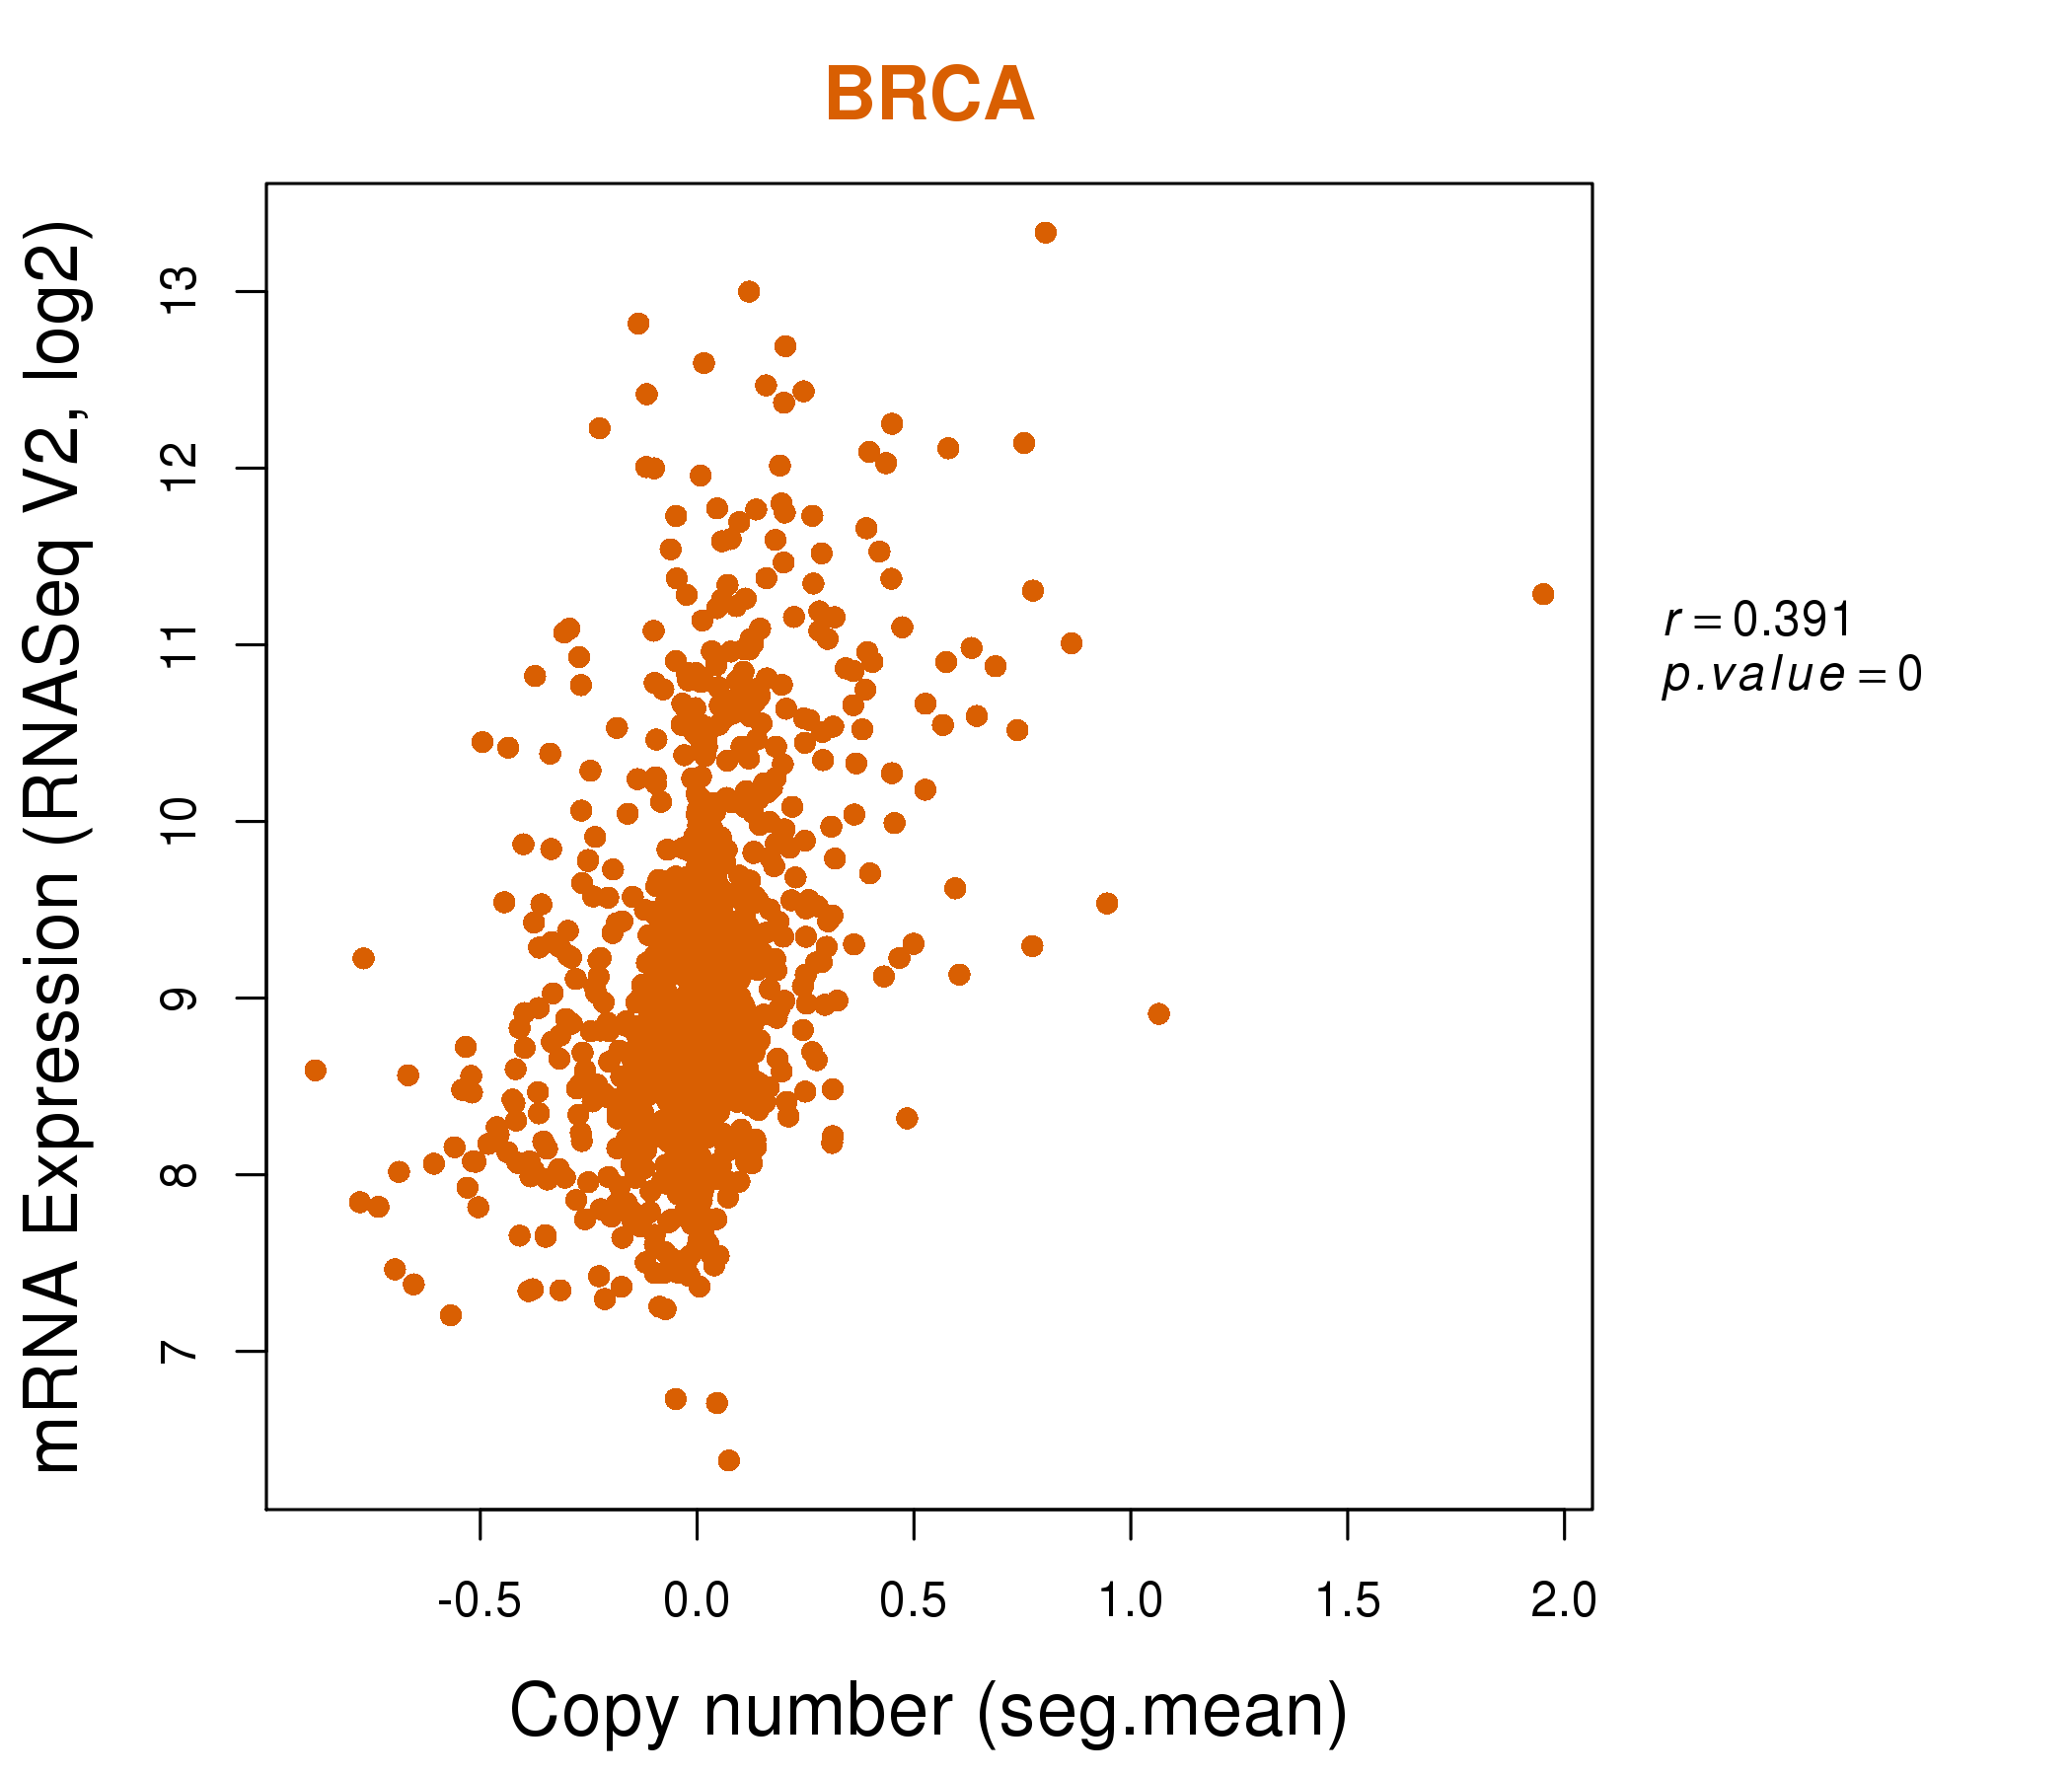
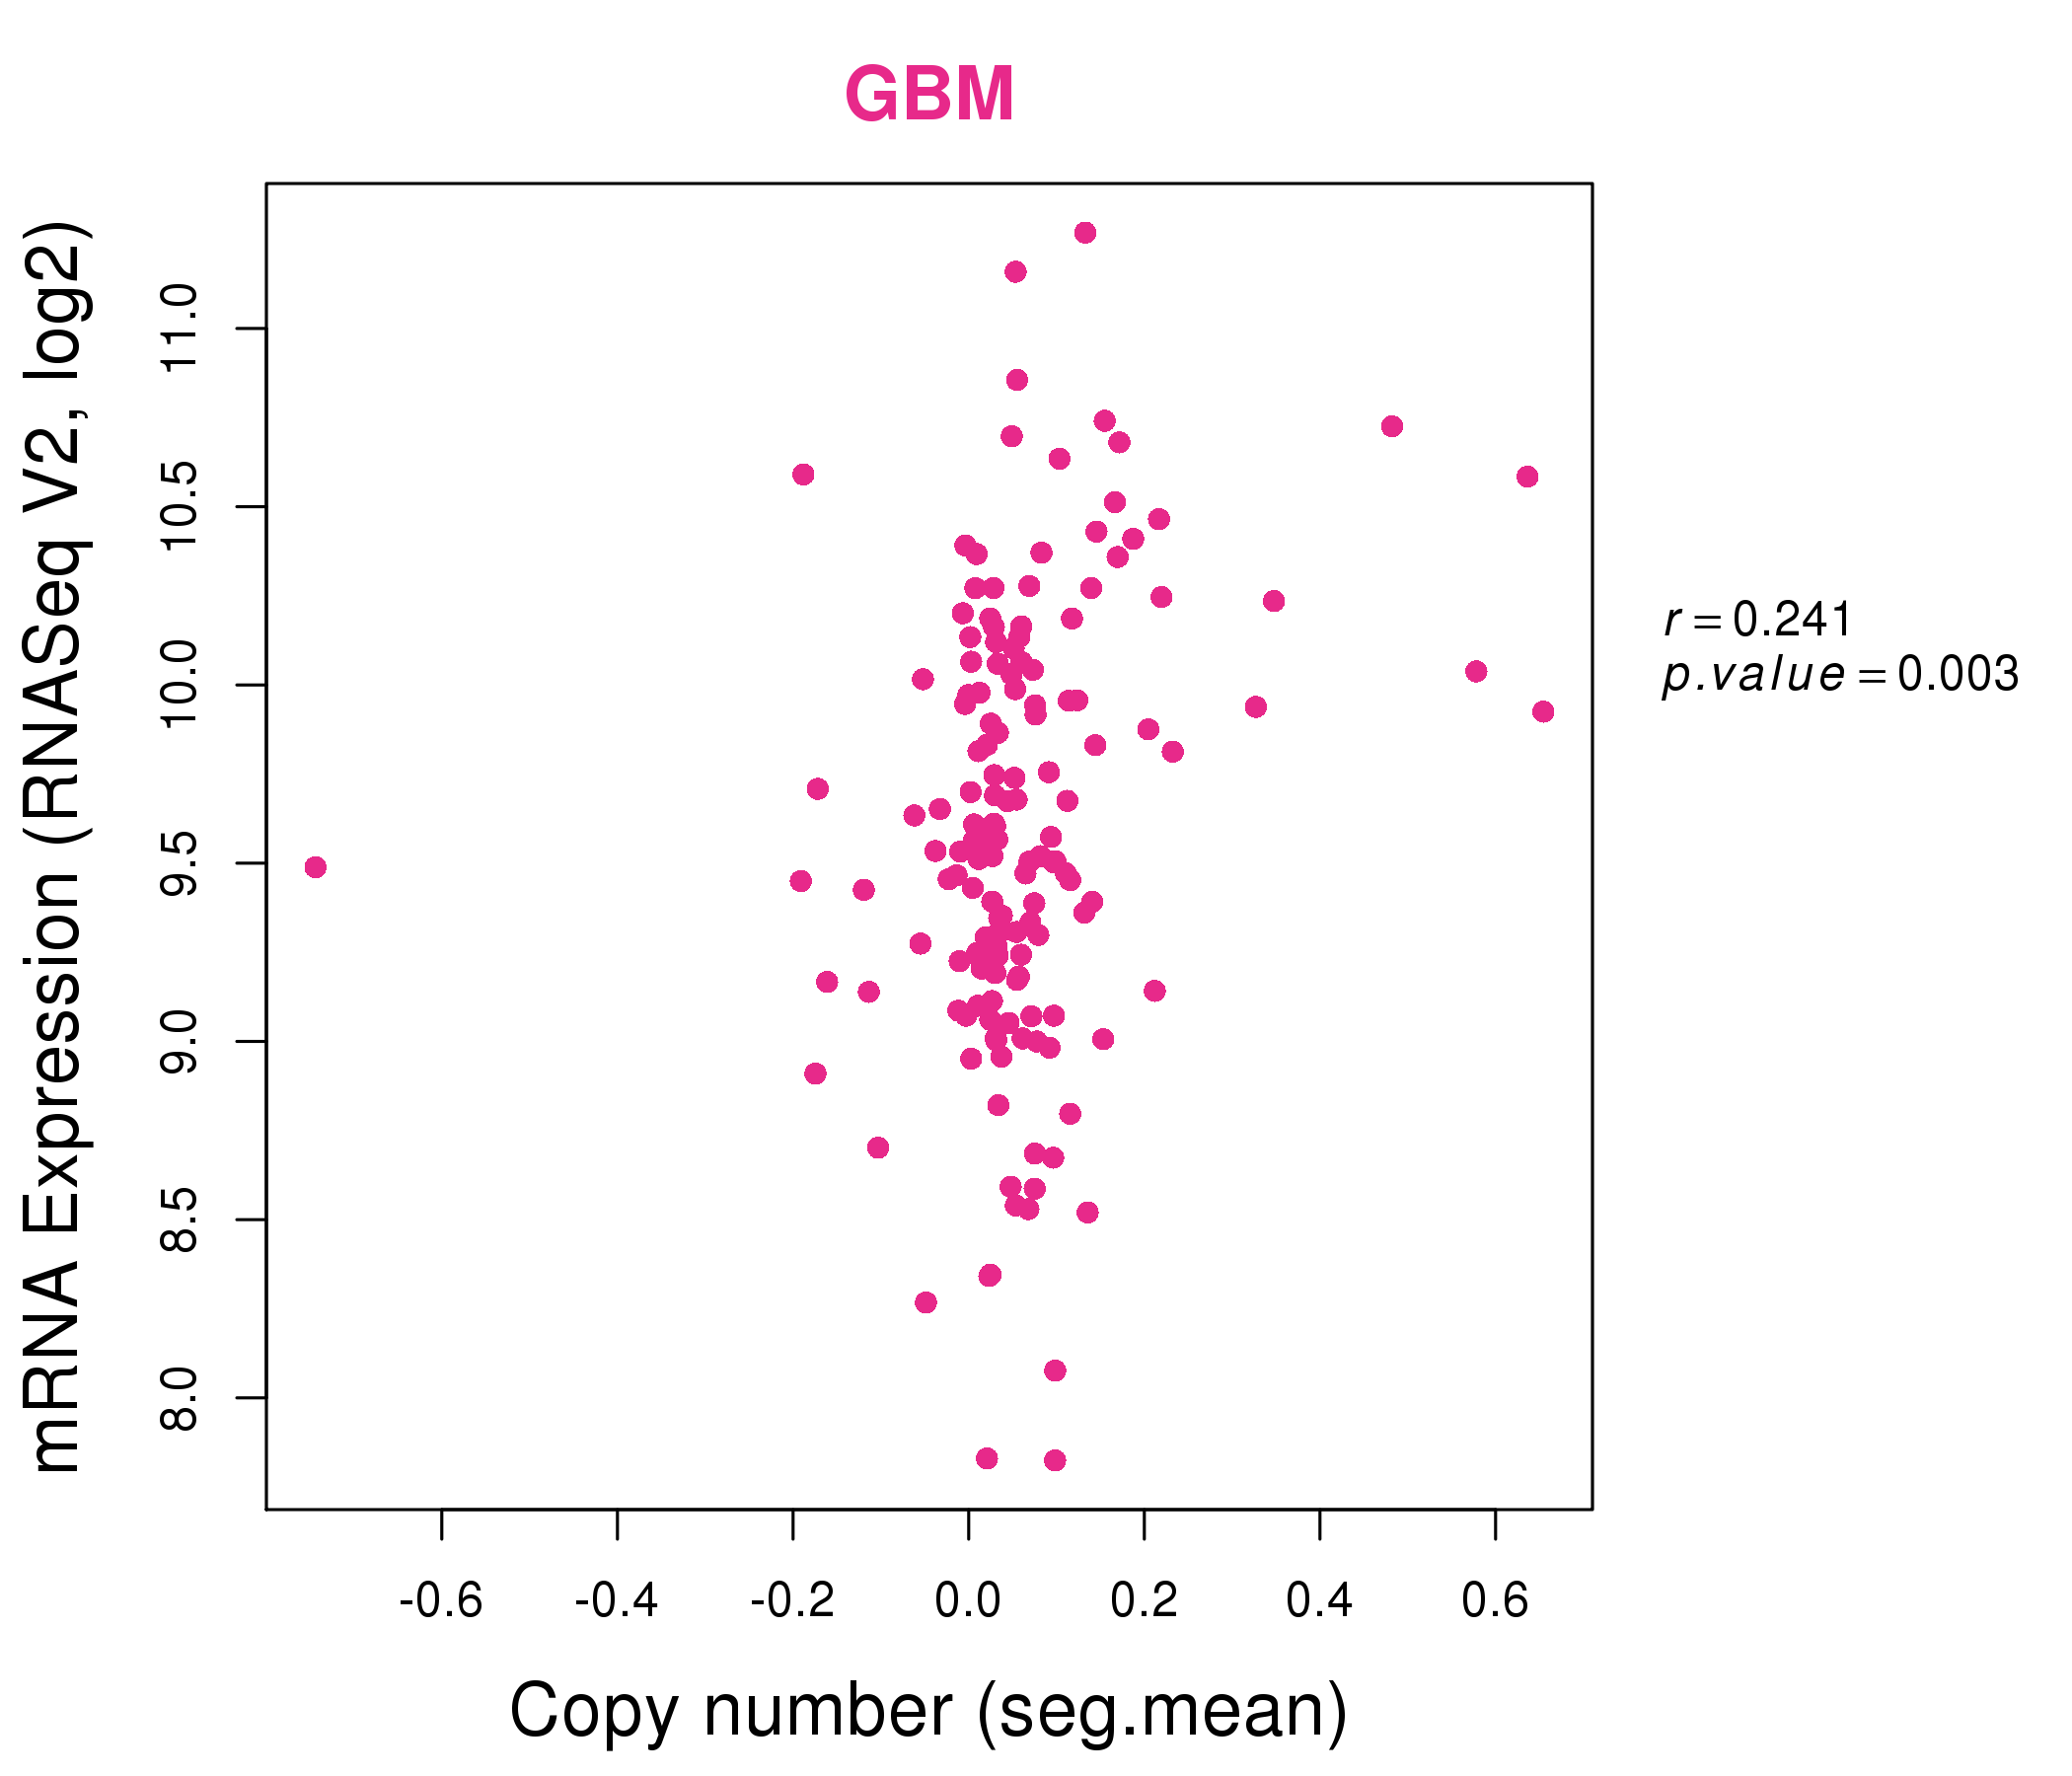
| * Copy number data were extracted from TCGA using R package TCGA-Assembler. The URLs of all public data files on TCGA DCC data server were gathered on Jan-05-2015. Function ProcessCNAData in TCGA-Assembler package was used to obtain gene-level copy number value which is calculated as the average copy number of the genomic region of a gene. |
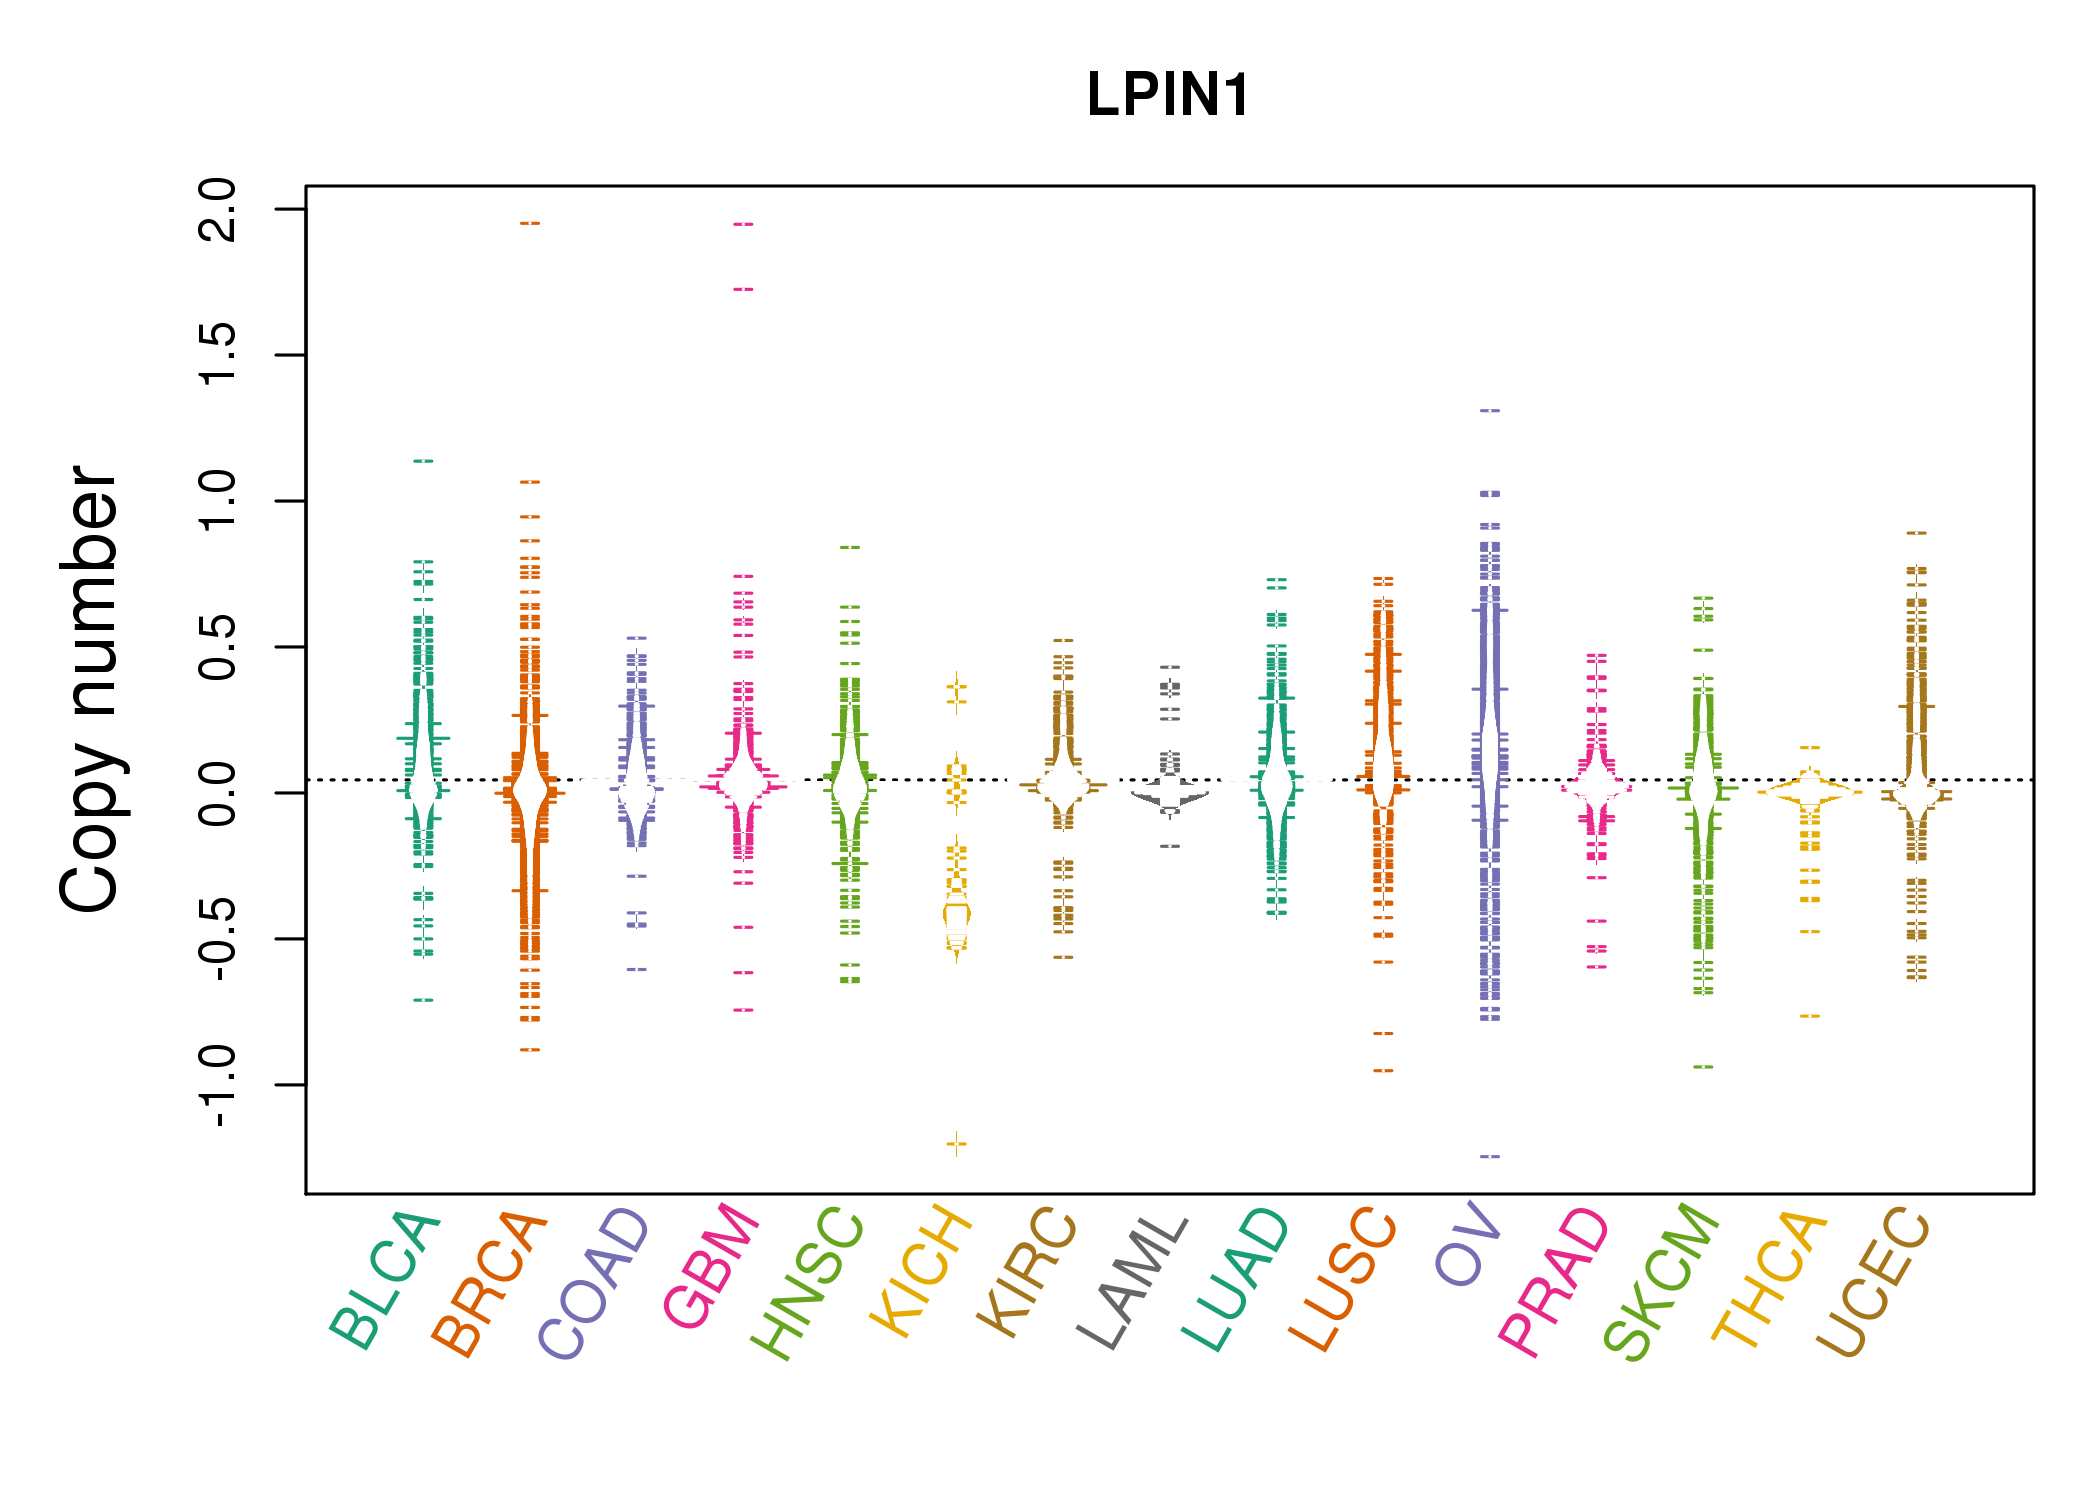 |
| cf) Tissue ID[Tissue type]: BLCA[Bladder Urothelial Carcinoma], BRCA[Breast invasive carcinoma], CESC[Cervical squamous cell carcinoma and endocervical adenocarcinoma], COAD[Colon adenocarcinoma], GBM[Glioblastoma multiforme], Glioma Low Grade, HNSC[Head and Neck squamous cell carcinoma], KICH[Kidney Chromophobe], KIRC[Kidney renal clear cell carcinoma], KIRP[Kidney renal papillary cell carcinoma], LAML[Acute Myeloid Leukemia], LUAD[Lung adenocarcinoma], LUSC[Lung squamous cell carcinoma], OV[Ovarian serous cystadenocarcinoma ], PAAD[Pancreatic adenocarcinoma], PRAD[Prostate adenocarcinoma], SKCM[Skin Cutaneous Melanoma], STAD[Stomach adenocarcinoma], THCA[Thyroid carcinoma], UCEC[Uterine Corpus Endometrial Carcinoma] |
| Top |
| Gene Expression for LPIN1 |
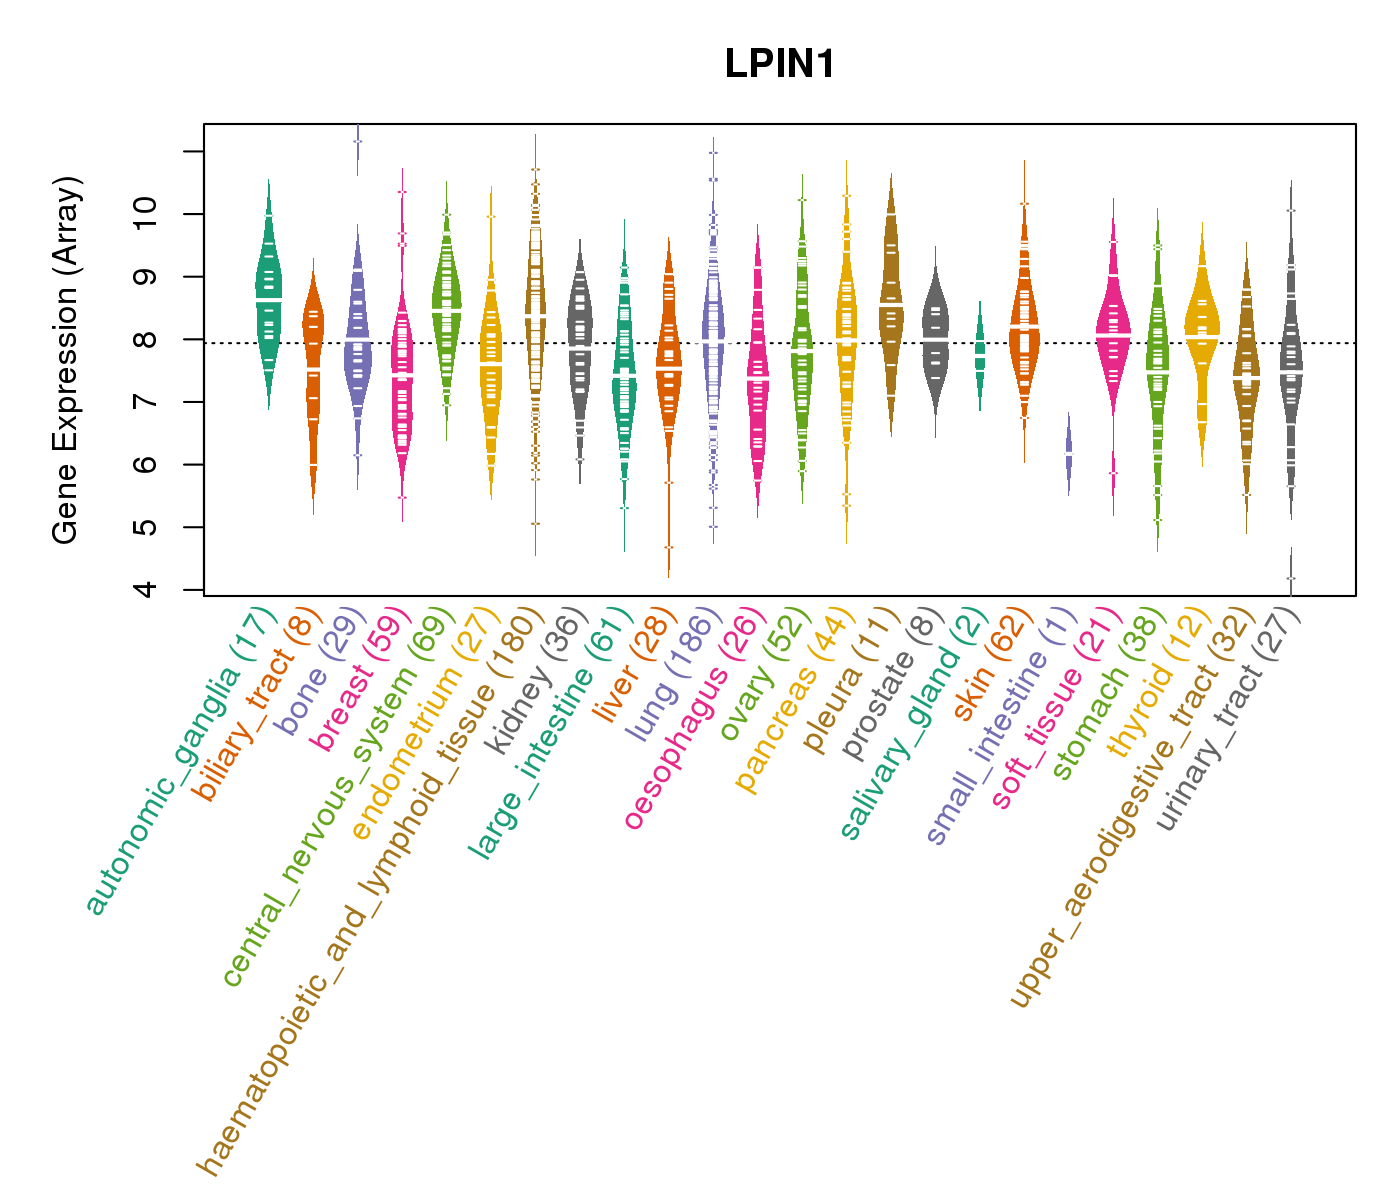
| * CCLE gene expression data were extracted from CCLE_Expression_Entrez_2012-10-18.res: Gene-centric RMA-normalized mRNA expression data. |
 |
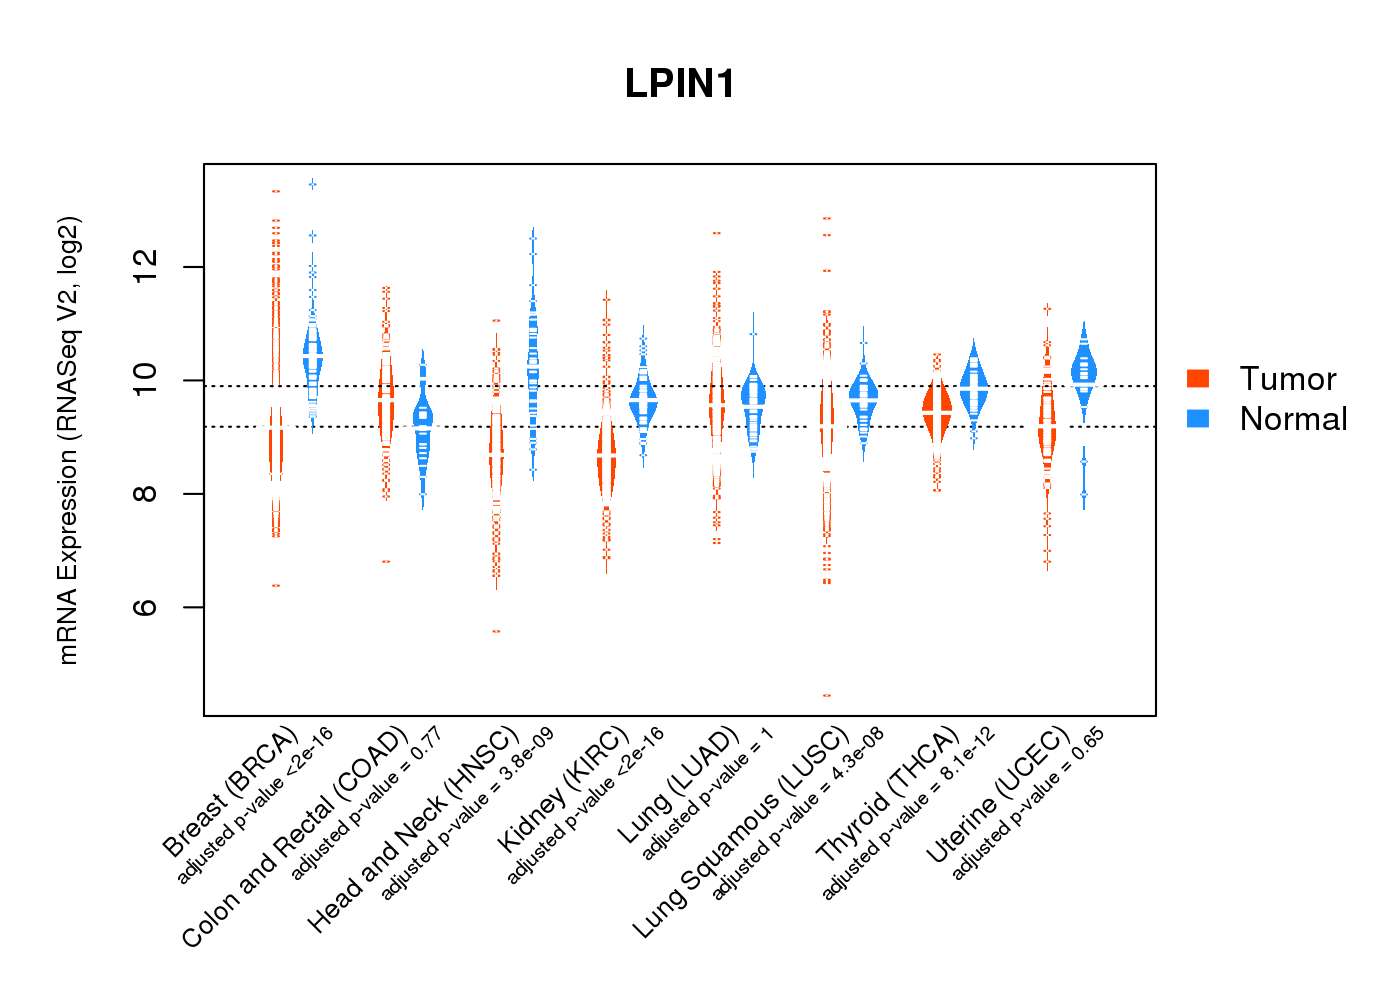
| * Normalized gene expression data of RNASeqV2 was extracted from TCGA using R package TCGA-Assembler. The URLs of all public data files on TCGA DCC data server were gathered at Jan-05-2015. Only eight cancer types have enough normal control samples for differential expression analysis. (t test, adjusted p<0.05 (using Benjamini-Hochberg FDR)) |
 |
| Top |
| * This plots show the correlation between CNV and gene expression. |
: Open all plots for all cancer types
 |
|
 |
|
| Top |
| Gene-Gene Network Information |
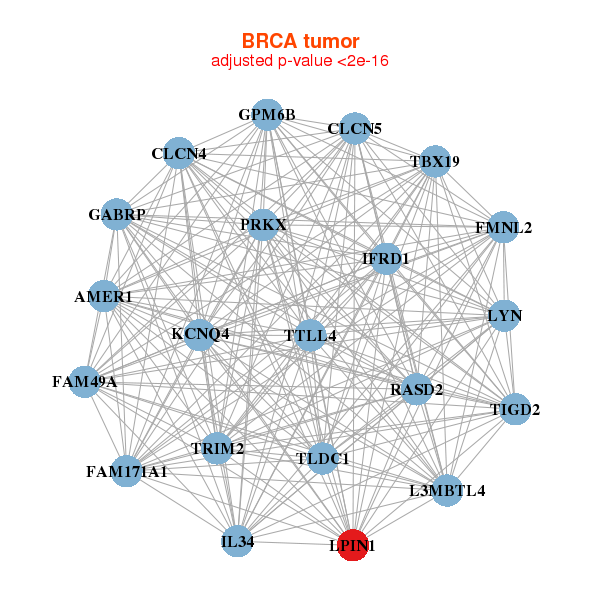
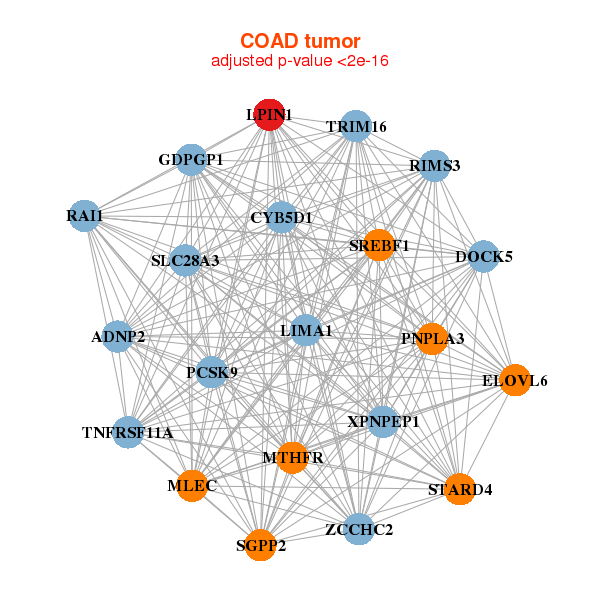
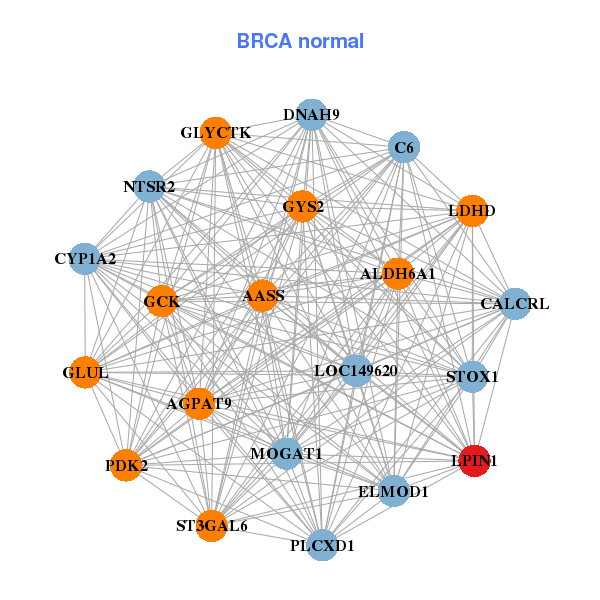
| * Co-Expression network figures were drawn using R package igraph. Only the top 20 genes with the highest correlations were shown. Red circle: input gene, orange circle: cell metabolism gene, sky circle: other gene |
: Open all plots for all cancer types
 |
| ||||
| CLCN4,CLCN5,AMER1,FAM171A1,FAM49A,FMNL2,GABRP, GPM6B,IFRD1,IL34,KCNQ4,TLDC1,L3MBTL4,LPIN1, LYN,PRKX,RASD2,TBX19,TIGD2,TRIM2,TTLL4 | AASS,AGPAT9,ALDH6A1,C6,CALCRL,CYP1A2,DNAH9, ELMOD1,GCK,GLUL,GLYCTK,GYS2,LDHD,LOC149620, LPIN1,MOGAT1,NTSR2,PDK2,PLCXD1,ST3GAL6,STOX1 | ||||
 |
| ||||
| ADNP2,GDPGP1,CYB5D1,DOCK5,ELOVL6,LIMA1,LPIN1, MLEC,MTHFR,PCSK9,PNPLA3,RAI1,RIMS3,SGPP2, SLC28A3,SREBF1,STARD4,TNFRSF11A,TRIM16,XPNPEP1,ZCCHC2 | AKAP2,ARHGAP23,CCDC88A,CELF2,CEP170,CLIP1,FAM120C, FAM65A,HDAC4,LPIN1,MAP4,NCDN,RAB36,RABEP1, RIMKLB,ROBO1,SACS,SLC41A1,SYNE1,TRIB2,ZNF154 |

| * Co-Expression network figures were drawn using R package igraph. Only the top 20 genes with the highest correlations were shown. Red circle: input gene, orange circle: cell metabolism gene, sky circle: other gene |
: Open all plots for all cancer types
| Top |
: Open all interacting genes' information including KEGG pathway for all interacting genes from DAVID
| Top |
| Pharmacological Information for LPIN1 |
| DB Category | DB Name | DB's ID and Url link |
| * Gene Centered Interaction Network. |
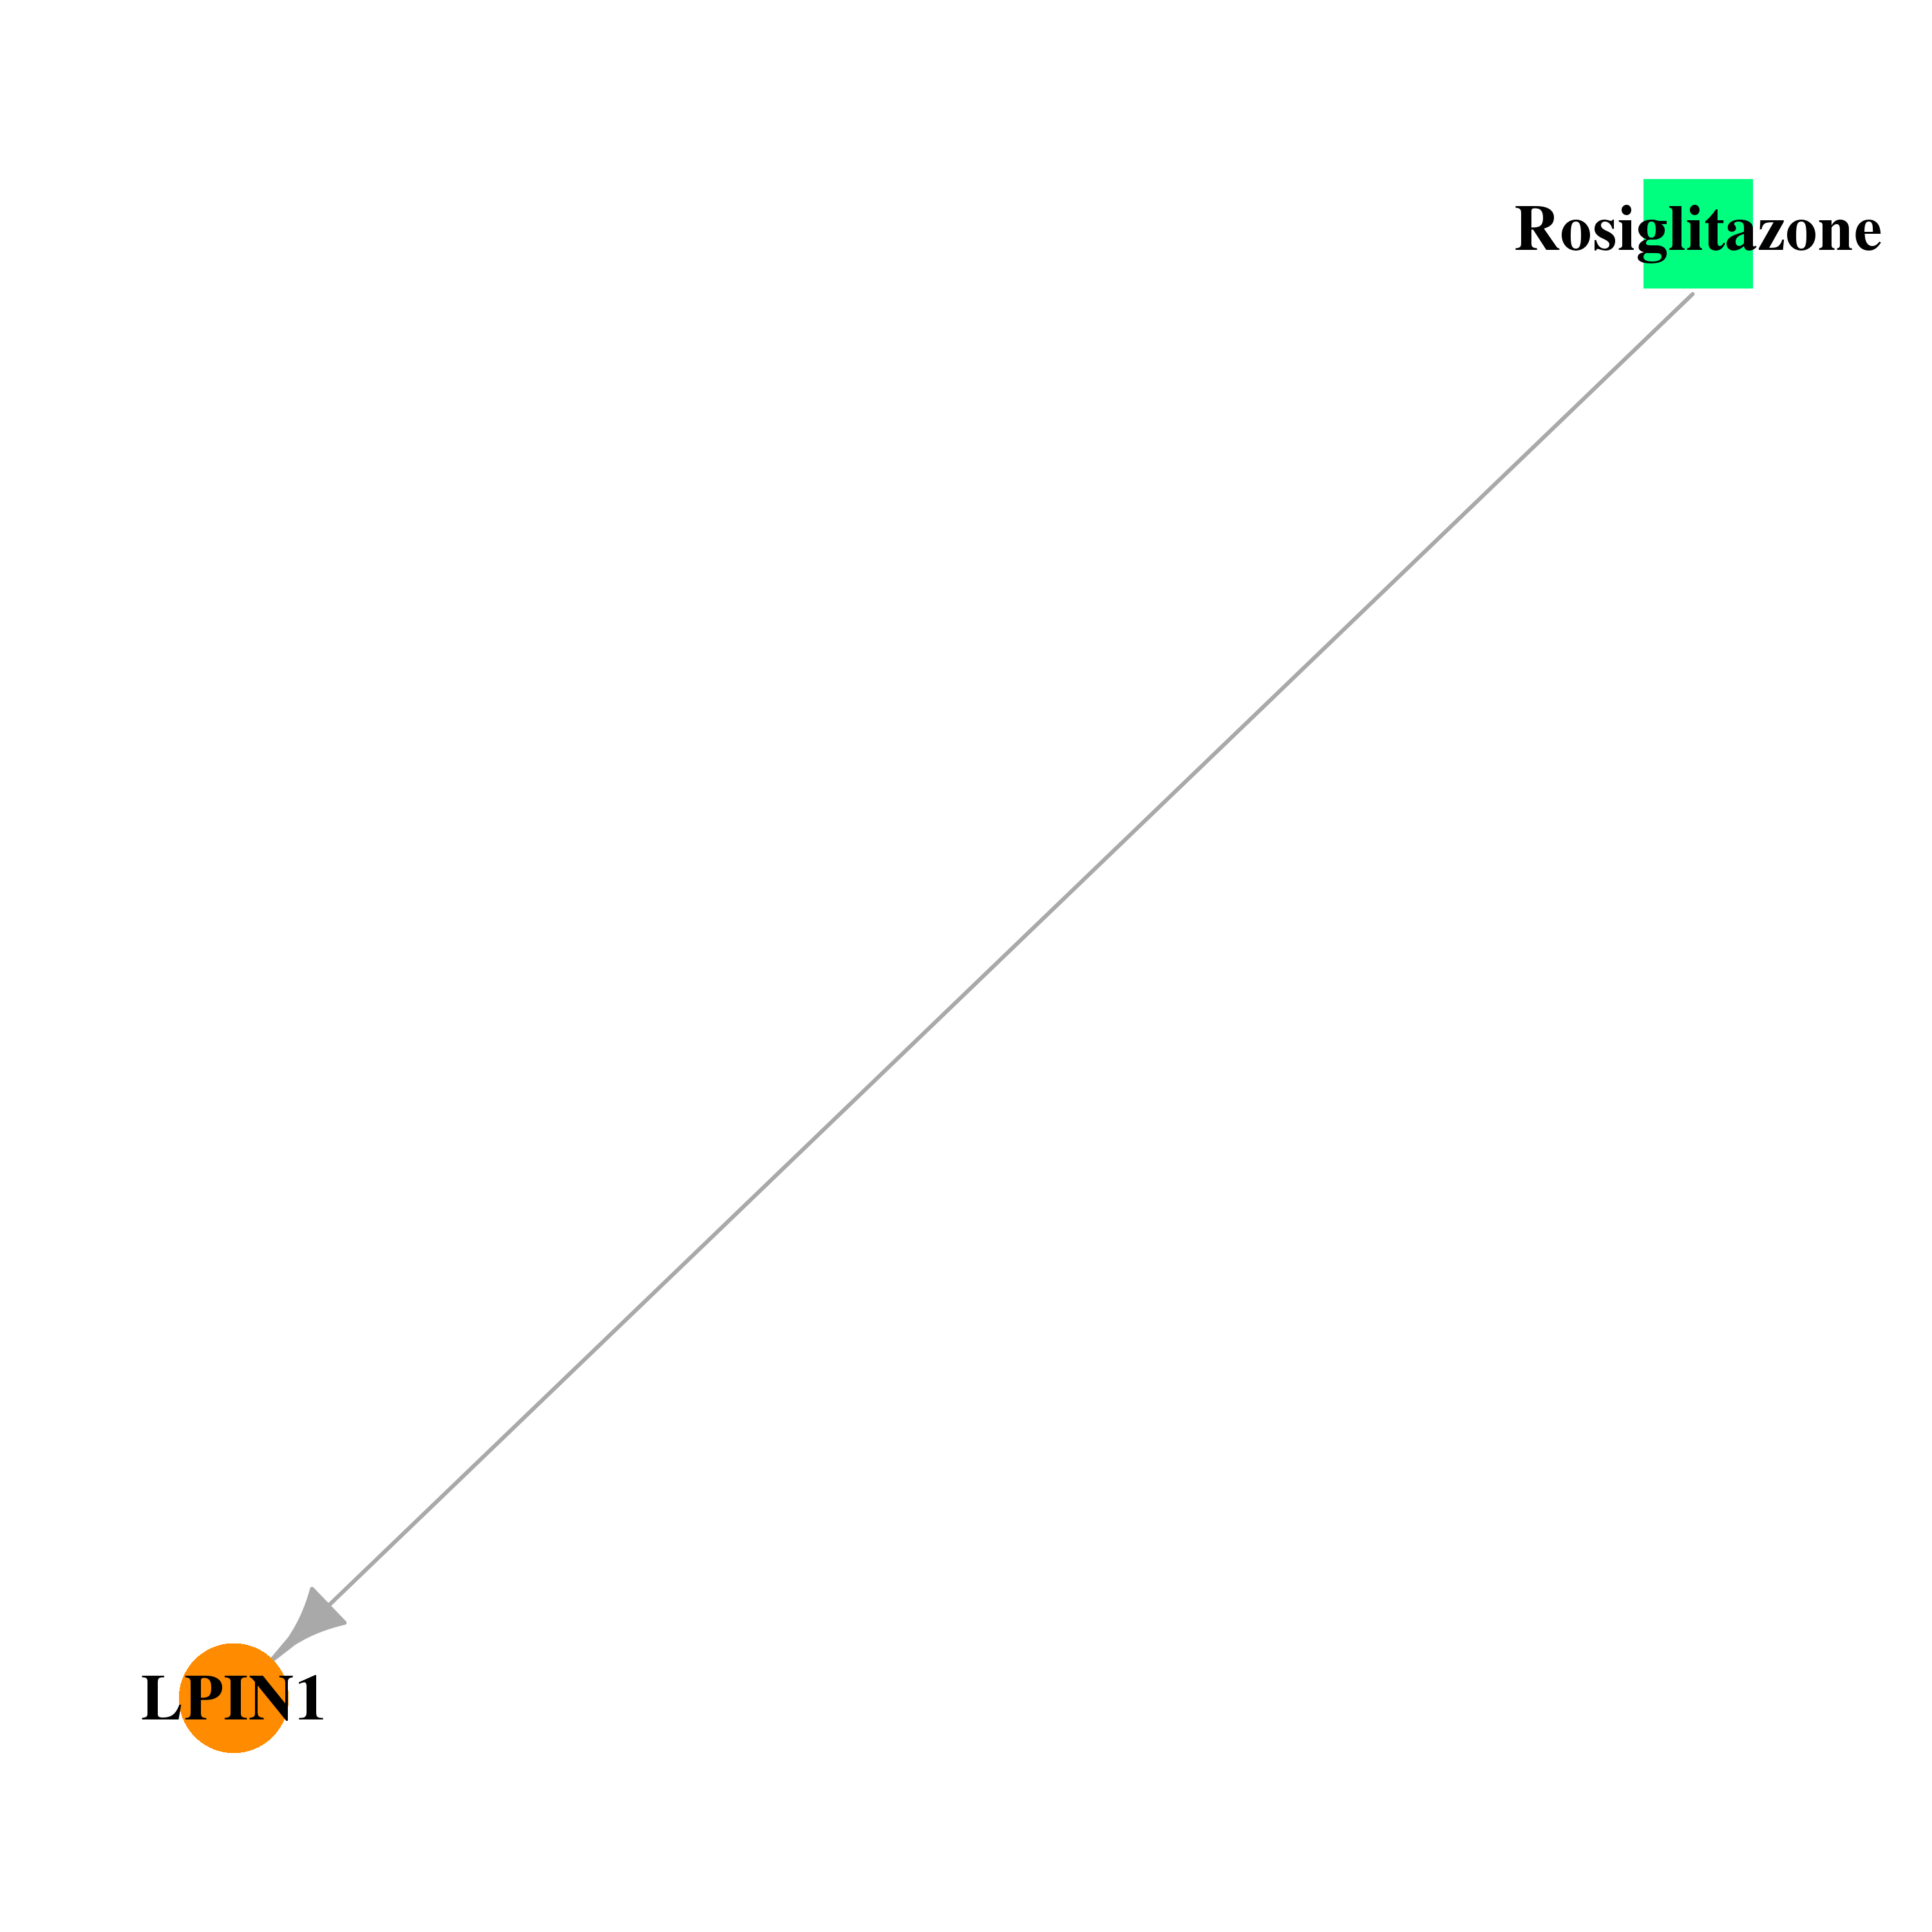 |
| * Drug Centered Interaction Network. |
| DrugBank ID | Target Name | Drug Groups | Generic Name | Drug Centered Network | Drug Structure |
| DB00412 | lipin 1 | approved; investigational | Rosiglitazone | 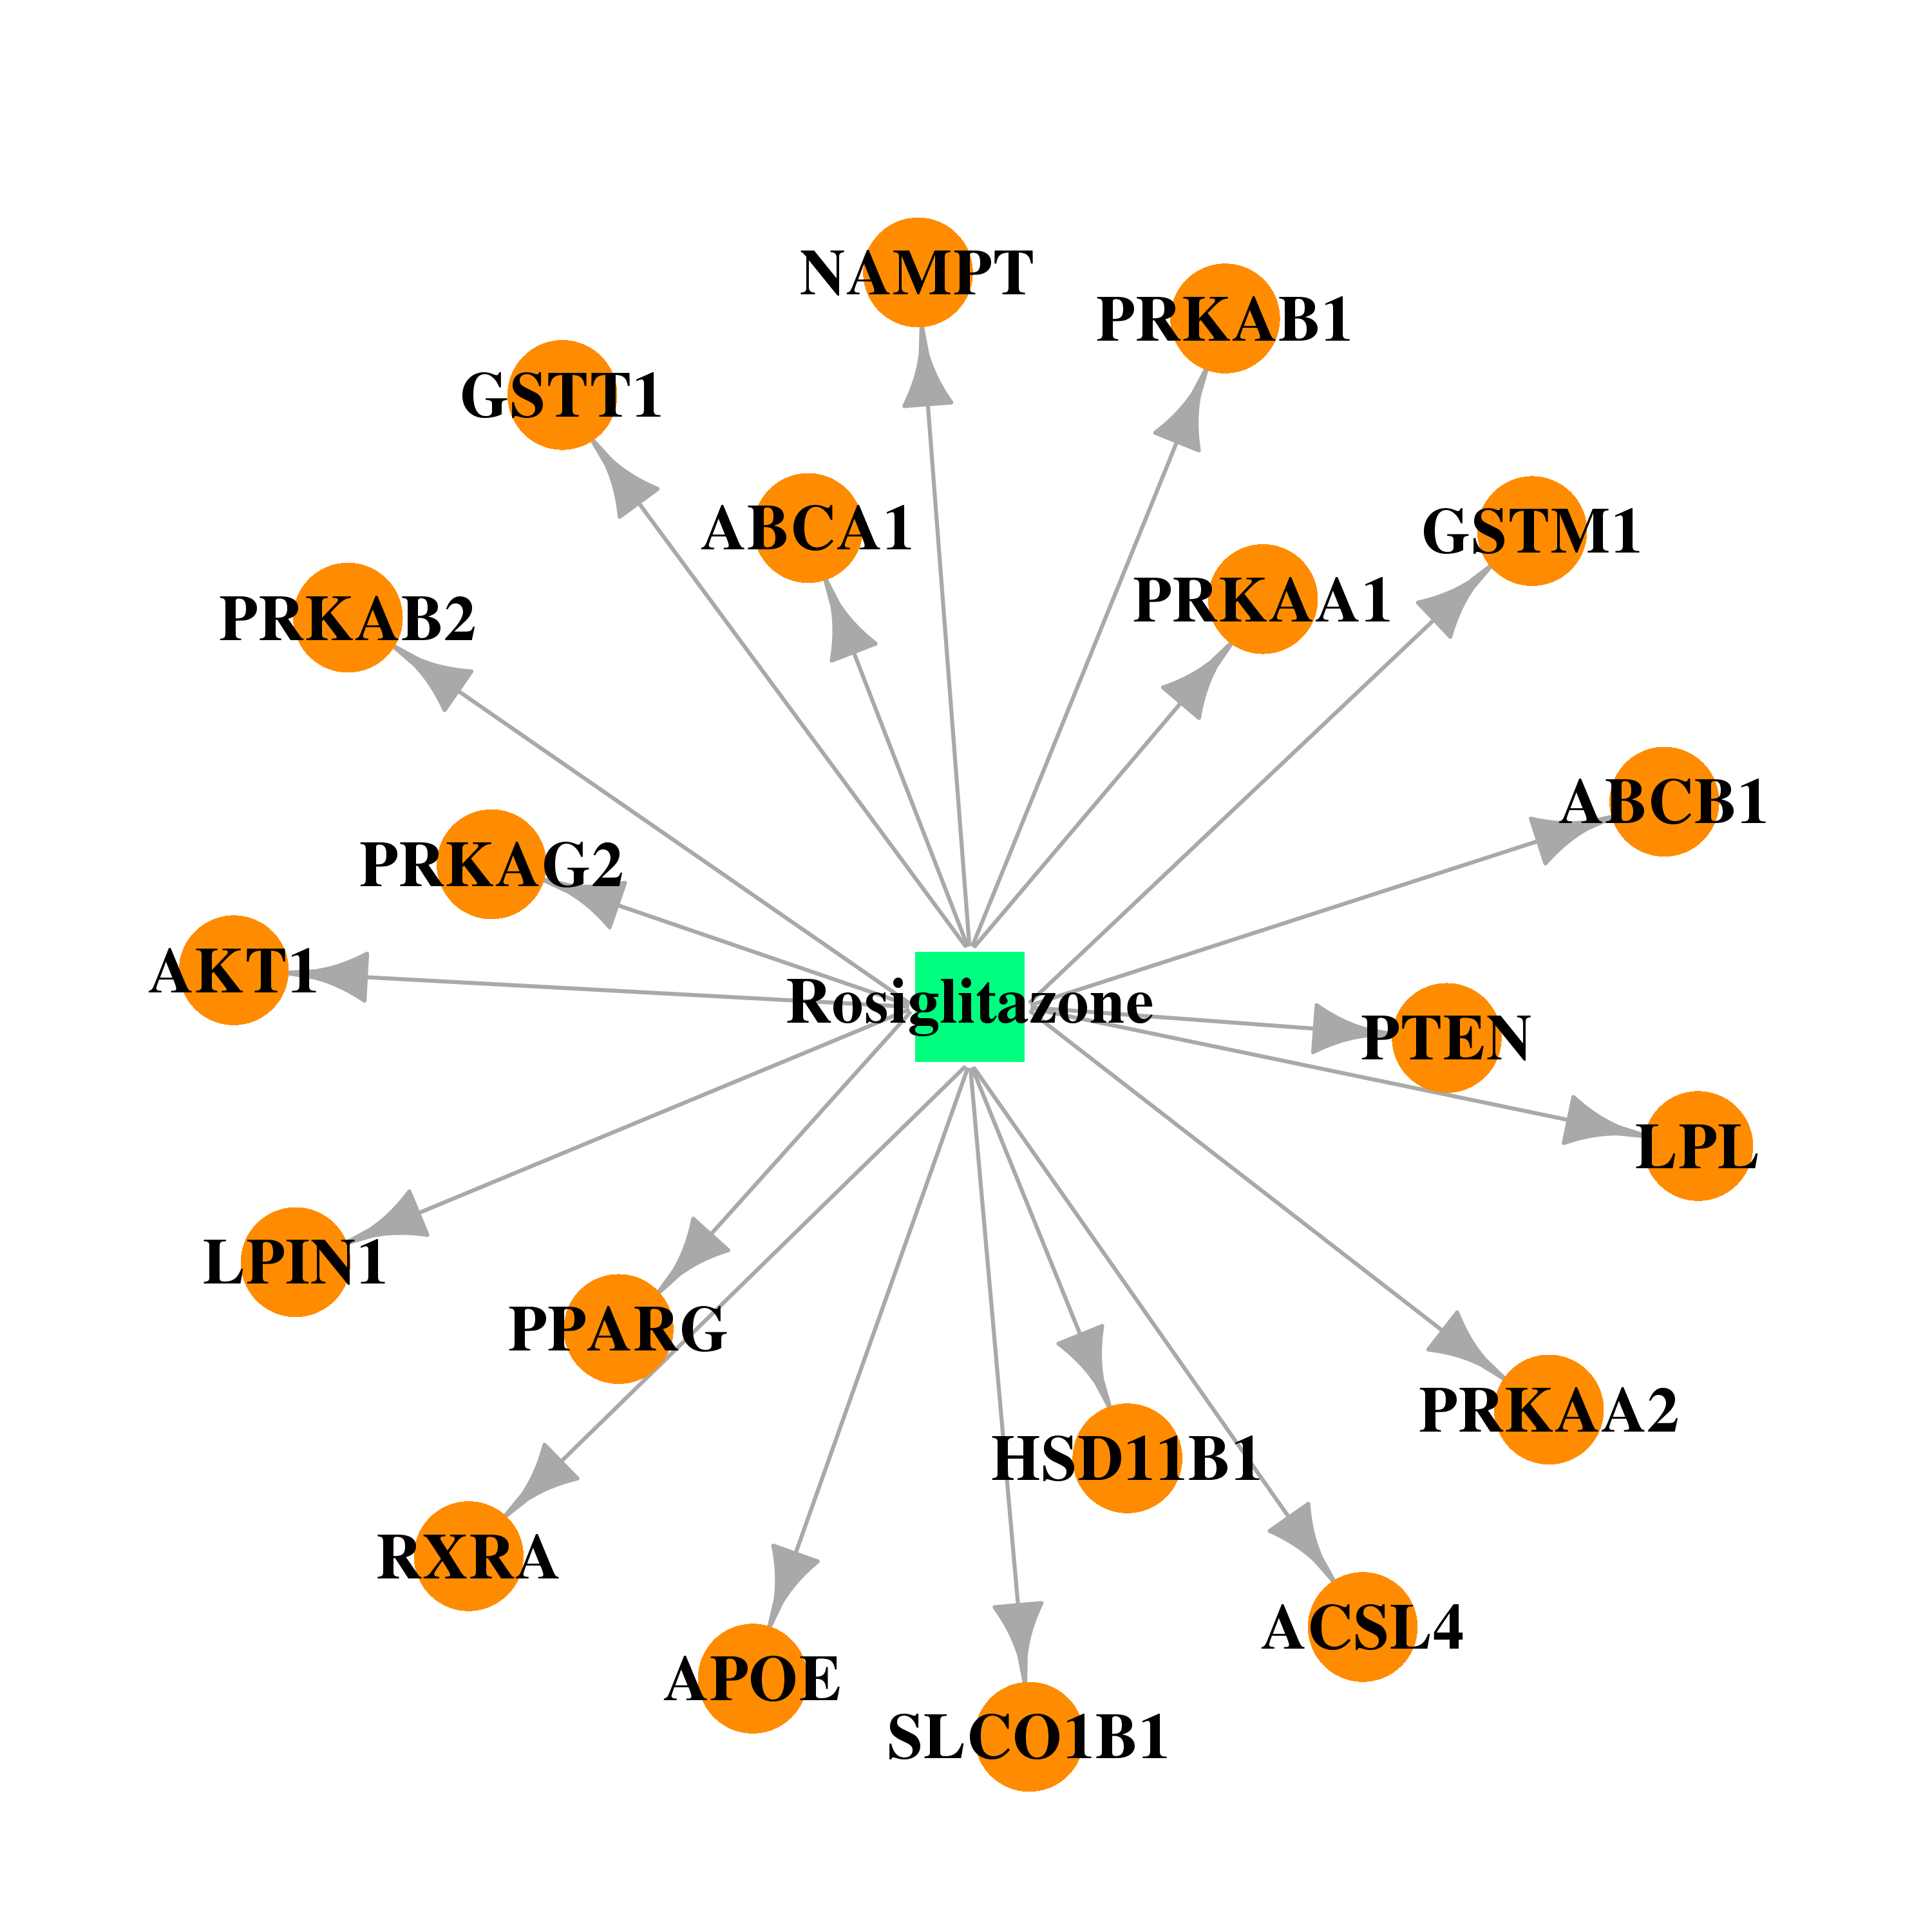 |  |
| Top |
| Cross referenced IDs for LPIN1 |
| * We obtained these cross-references from Uniprot database. It covers 150 different DBs, 18 categories. http://www.uniprot.org/help/cross_references_section |
: Open all cross reference information
|
Copyright © 2016-Present - The Univsersity of Texas Health Science Center at Houston @ |