|
||||||||||||||||||||||||||||||||||||||||||||||||||||||||||||||||||||||||||||||||||||||||||||||||||||||||||||||||||||||||||||||||||||||||||||||||||||||||||||||||||||||||||||||||||||||||||||||||||||||||||||||||||||||||||||||||||||||||||||||||||||||||||||||||||||||||||||||||||||||||||||||||||||||||||||||||||||||||||
| |
| Phenotypic Information (metabolism pathway, cancer, disease, phenome) |
| |
| |
| Gene-Gene Network Information: Co-Expression Network, Interacting Genes & KEGG |
| |
|


| Gene Summary for GANAB |
| Top |
| Phenotypic Information for GANAB(metabolism pathway, cancer, disease, phenome) |
| Cancer | CGAP: GANAB |
| Familial Cancer Database: GANAB | |
| * This gene is included in those cancer gene databases. |
|
|
|
|
|
| . | ||||||||||||||||||||||||||||||||||||||||||||||||||||||||||||||||||||||||||||||||||||||||||||||||||||||||||||||||||||||||||||||||||||||||||||||||||||||||||||||||||||||||||||||||||||||||||||||||||||||||||||||||||||||||||||||||||||||||||||||||||||||||||||||||||||||||||||||||||||||||||||||||||||||||||||||||||||
Oncogene 1 | Significant driver gene in | |||||||||||||||||||||||||||||||||||||||||||||||||||||||||||||||||||||||||||||||||||||||||||||||||||||||||||||||||||||||||||||||||||||||||||||||||||||||||||||||||||||||||||||||||||||||||||||||||||||||||||||||||||||||||||||||||||||||||||||||||||||||||||||||||||||||||||||||||||||||||||||||||||||||||||||||||||||||||
| cf) number; DB name 1 Oncogene; http://nar.oxfordjournals.org/content/35/suppl_1/D721.long, 2 Tumor Suppressor gene; https://bioinfo.uth.edu/TSGene/, 3 Cancer Gene Census; http://www.nature.com/nrc/journal/v4/n3/abs/nrc1299.html, 4 CancerGenes; http://nar.oxfordjournals.org/content/35/suppl_1/D721.long, 5 Network of Cancer Gene; http://ncg.kcl.ac.uk/index.php, 1Therapeutic Vulnerabilities in Cancer; http://cbio.mskcc.org/cancergenomics/statius/ |
| REACTOME_METABOLISM_OF_PROTEINS | |
| OMIM | |
| Orphanet | |
| Disease | KEGG Disease: GANAB |
| MedGen: GANAB (Human Medical Genetics with Condition) | |
| ClinVar: GANAB | |
| Phenotype | MGI: GANAB (International Mouse Phenotyping Consortium) |
| PhenomicDB: GANAB | |
| Mutations for GANAB |
| * Under tables are showing count per each tissue to give us broad intuition about tissue specific mutation patterns.You can go to the detailed page for each mutation database's web site. |
| There's no structural variation information in COSMIC data for this gene. |
| * From mRNA Sanger sequences, Chitars2.0 arranged chimeric transcripts. This table shows GANAB related fusion information. |
| ID | Head Gene | Tail Gene | Accession | Gene_a | qStart_a | qEnd_a | Chromosome_a | tStart_a | tEnd_a | Gene_a | qStart_a | qEnd_a | Chromosome_a | tStart_a | tEnd_a |
| DA340619 | RAMP1 | 1 | 247 | 2 | 238768266 | 238786006 | GANAB | 244 | 583 | 11 | 62406459 | 62407205 | |
| AK295899 | RAMP1 | 1 | 246 | 2 | 238768266 | 238786006 | GANAB | 243 | 3424 | 11 | 62392904 | 62407205 | |
| DB067719 | TRAF6 | 1 | 230 | 11 | 36531596 | 36531822 | GANAB | 228 | 465 | 11 | 62406560 | 62407204 | |
| AI339818 | ASNA1 | 10 | 192 | 19 | 12858955 | 12859137 | GANAB | 193 | 284 | 11 | 62392488 | 62392579 | |
| DW439793 | RPL18 | 18 | 114 | 19 | 49119986 | 49120082 | GANAB | 114 | 189 | 11 | 62392305 | 62392381 | |
| BF085691 | GANAB | 12 | 74 | 11 | 62408925 | 62408987 | STX7 | 68 | 175 | 6 | 132824675 | 132834200 | |
| BF514651 | RPS6 | 17 | 330 | 9 | 19376253 | 19378387 | GANAB | 329 | 405 | 11 | 62406928 | 62407163 | |
| BF987702 | GANAB | 1 | 190 | 11 | 62393060 | 62393248 | GANAB | 178 | 432 | 11 | 62394517 | 62396350 | |
| BE710656 | GANAB | 14 | 111 | 11 | 62392762 | 62392861 | GANAB | 107 | 296 | 11 | 62392952 | 62393141 | |
| AA557976 | GANAB | 7 | 114 | 11 | 62392736 | 62392843 | GANAB | 112 | 357 | 11 | 62392841 | 62393086 | |
| BF893584 | GRM8 | 171 | 204 | 7 | 126524936 | 126524998 | GANAB | 204 | 463 | 11 | 62392486 | 62393205 | |
| BE773523 | PRKCSH | 1 | 62 | 19 | 11557098 | 11557160 | GANAB | 55 | 159 | 11 | 62407307 | 62407411 | |
| Top |
| Mutation type/ Tissue ID | brca | cns | cerv | endome | haematopo | kidn | Lintest | liver | lung | ns | ovary | pancre | prost | skin | stoma | thyro | urina | |||
| Total # sample | 1 | |||||||||||||||||||
| GAIN (# sample) | 1 | |||||||||||||||||||
| LOSS (# sample) |
| cf) Tissue ID; Tissue type (1; Breast, 2; Central_nervous_system, 3; Cervix, 4; Endometrium, 5; Haematopoietic_and_lymphoid_tissue, 6; Kidney, 7; Large_intestine, 8; Liver, 9; Lung, 10; NS, 11; Ovary, 12; Pancreas, 13; Prostate, 14; Skin, 15; Stomach, 16; Thyroid, 17; Urinary_tract) |
| Top |
|
 |
| Top |
| Stat. for Non-Synonymous SNVs (# total SNVs=79) | (# total SNVs=19) |
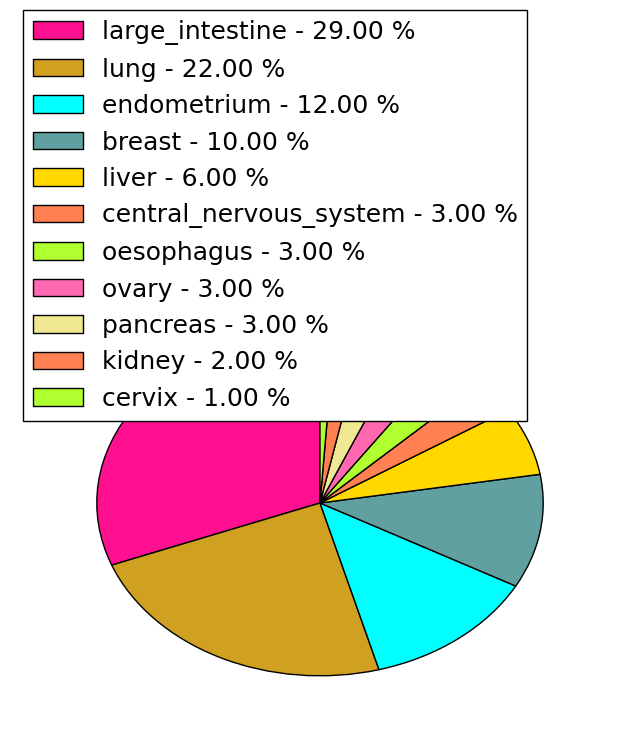 | 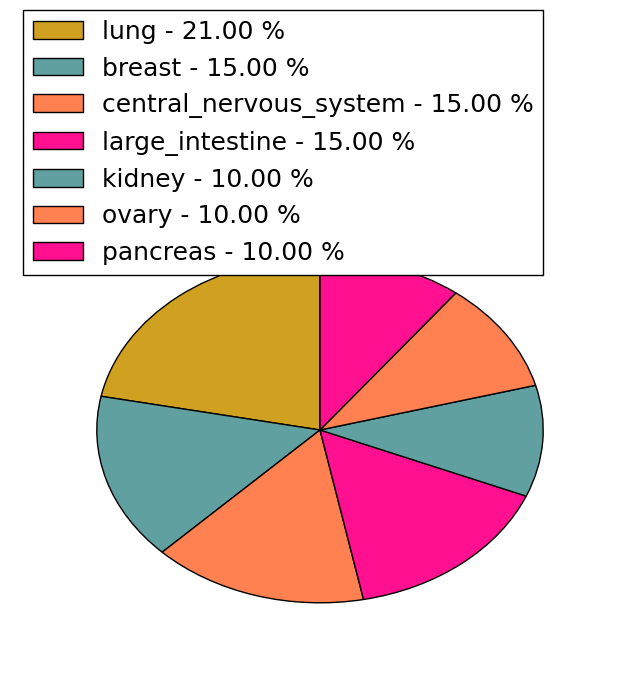 |
(# total SNVs=2) | (# total SNVs=0) |
 |
| Top |
| * When you move the cursor on each content, you can see more deailed mutation information on the Tooltip. Those are primary_site,primary_histology,mutation(aa),pubmedID. |
| GRCh37 position | Mutation(aa) | Unique sampleID count |
| chr11:62396762-62396762 | p.V614M | 3 |
| chr11:62400658-62400658 | p.Y239C | 2 |
| chr11:62407101-62407101 | p.C47C | 2 |
| chr11:62400050-62400050 | p.N328S | 2 |
| chr11:62407103-62407103 | p.C47R | 2 |
| chr11:62407174-62407174 | p.L23fs*1 | 2 |
| chr11:62406527-62406527 | p.I103T | 2 |
| chr11:62400735-62400735 | p.E213D | 2 |
| chr11:62406868-62406868 | p.D72G | 2 |
| chr11:62396262-62396262 | p.R720L | 2 |
| Top |
|
 |
| Point Mutation/ Tissue ID | 1 | 2 | 3 | 4 | 5 | 6 | 7 | 8 | 9 | 10 | 11 | 12 | 13 | 14 | 15 | 16 | 17 | 18 | 19 | 20 |
| # sample | 7 | 6 | 1 | 12 | 2 | 2 | 2 | 8 | 4 | 4 | 4 | 3 | 1 | 6 | ||||||
| # mutation | 8 | 6 | 1 | 11 | 2 | 2 | 2 | 9 | 4 | 4 | 4 | 3 | 1 | 8 | ||||||
| nonsynonymous SNV | 4 | 3 | 1 | 9 | 1 | 1 | 6 | 4 | 2 | 4 | 1 | 1 | 8 | |||||||
| synonymous SNV | 4 | 3 | 2 | 2 | 1 | 1 | 3 | 2 | 2 |
| cf) Tissue ID; Tissue type (1; BLCA[Bladder Urothelial Carcinoma], 2; BRCA[Breast invasive carcinoma], 3; CESC[Cervical squamous cell carcinoma and endocervical adenocarcinoma], 4; COAD[Colon adenocarcinoma], 5; GBM[Glioblastoma multiforme], 6; Glioma Low Grade, 7; HNSC[Head and Neck squamous cell carcinoma], 8; KICH[Kidney Chromophobe], 9; KIRC[Kidney renal clear cell carcinoma], 10; KIRP[Kidney renal papillary cell carcinoma], 11; LAML[Acute Myeloid Leukemia], 12; LUAD[Lung adenocarcinoma], 13; LUSC[Lung squamous cell carcinoma], 14; OV[Ovarian serous cystadenocarcinoma ], 15; PAAD[Pancreatic adenocarcinoma], 16; PRAD[Prostate adenocarcinoma], 17; SKCM[Skin Cutaneous Melanoma], 18:STAD[Stomach adenocarcinoma], 19:THCA[Thyroid carcinoma], 20:UCEC[Uterine Corpus Endometrial Carcinoma]) |
| Top |
| * We represented just top 10 SNVs. When you move the cursor on each content, you can see more deailed mutation information on the Tooltip. Those are primary_site, primary_histology, mutation(aa), pubmedID. |
| Genomic Position | Mutation(aa) | Unique sampleID count |
| chr11:62407103 | p.E99E,GANAB | 2 |
| chr11:62400735 | p.C47R,GANAB | 2 |
| chr11:62397917 | p.H672Y,GANAB | 1 |
| chr11:62406541 | p.M429I,GANAB | 1 |
| chr11:62394105 | p.M179L,GANAB | 1 |
| chr11:62400106 | p.V16F,GANAB | 1 |
| chr11:62396766 | p.P610P,GANAB | 1 |
| chr11:62402314 | p.A420P,GANAB | 1 |
| chr11:62397951 | p.E174G,GANAB | 1 |
| chr11:62406547 | p.R13R,GANAB | 1 |
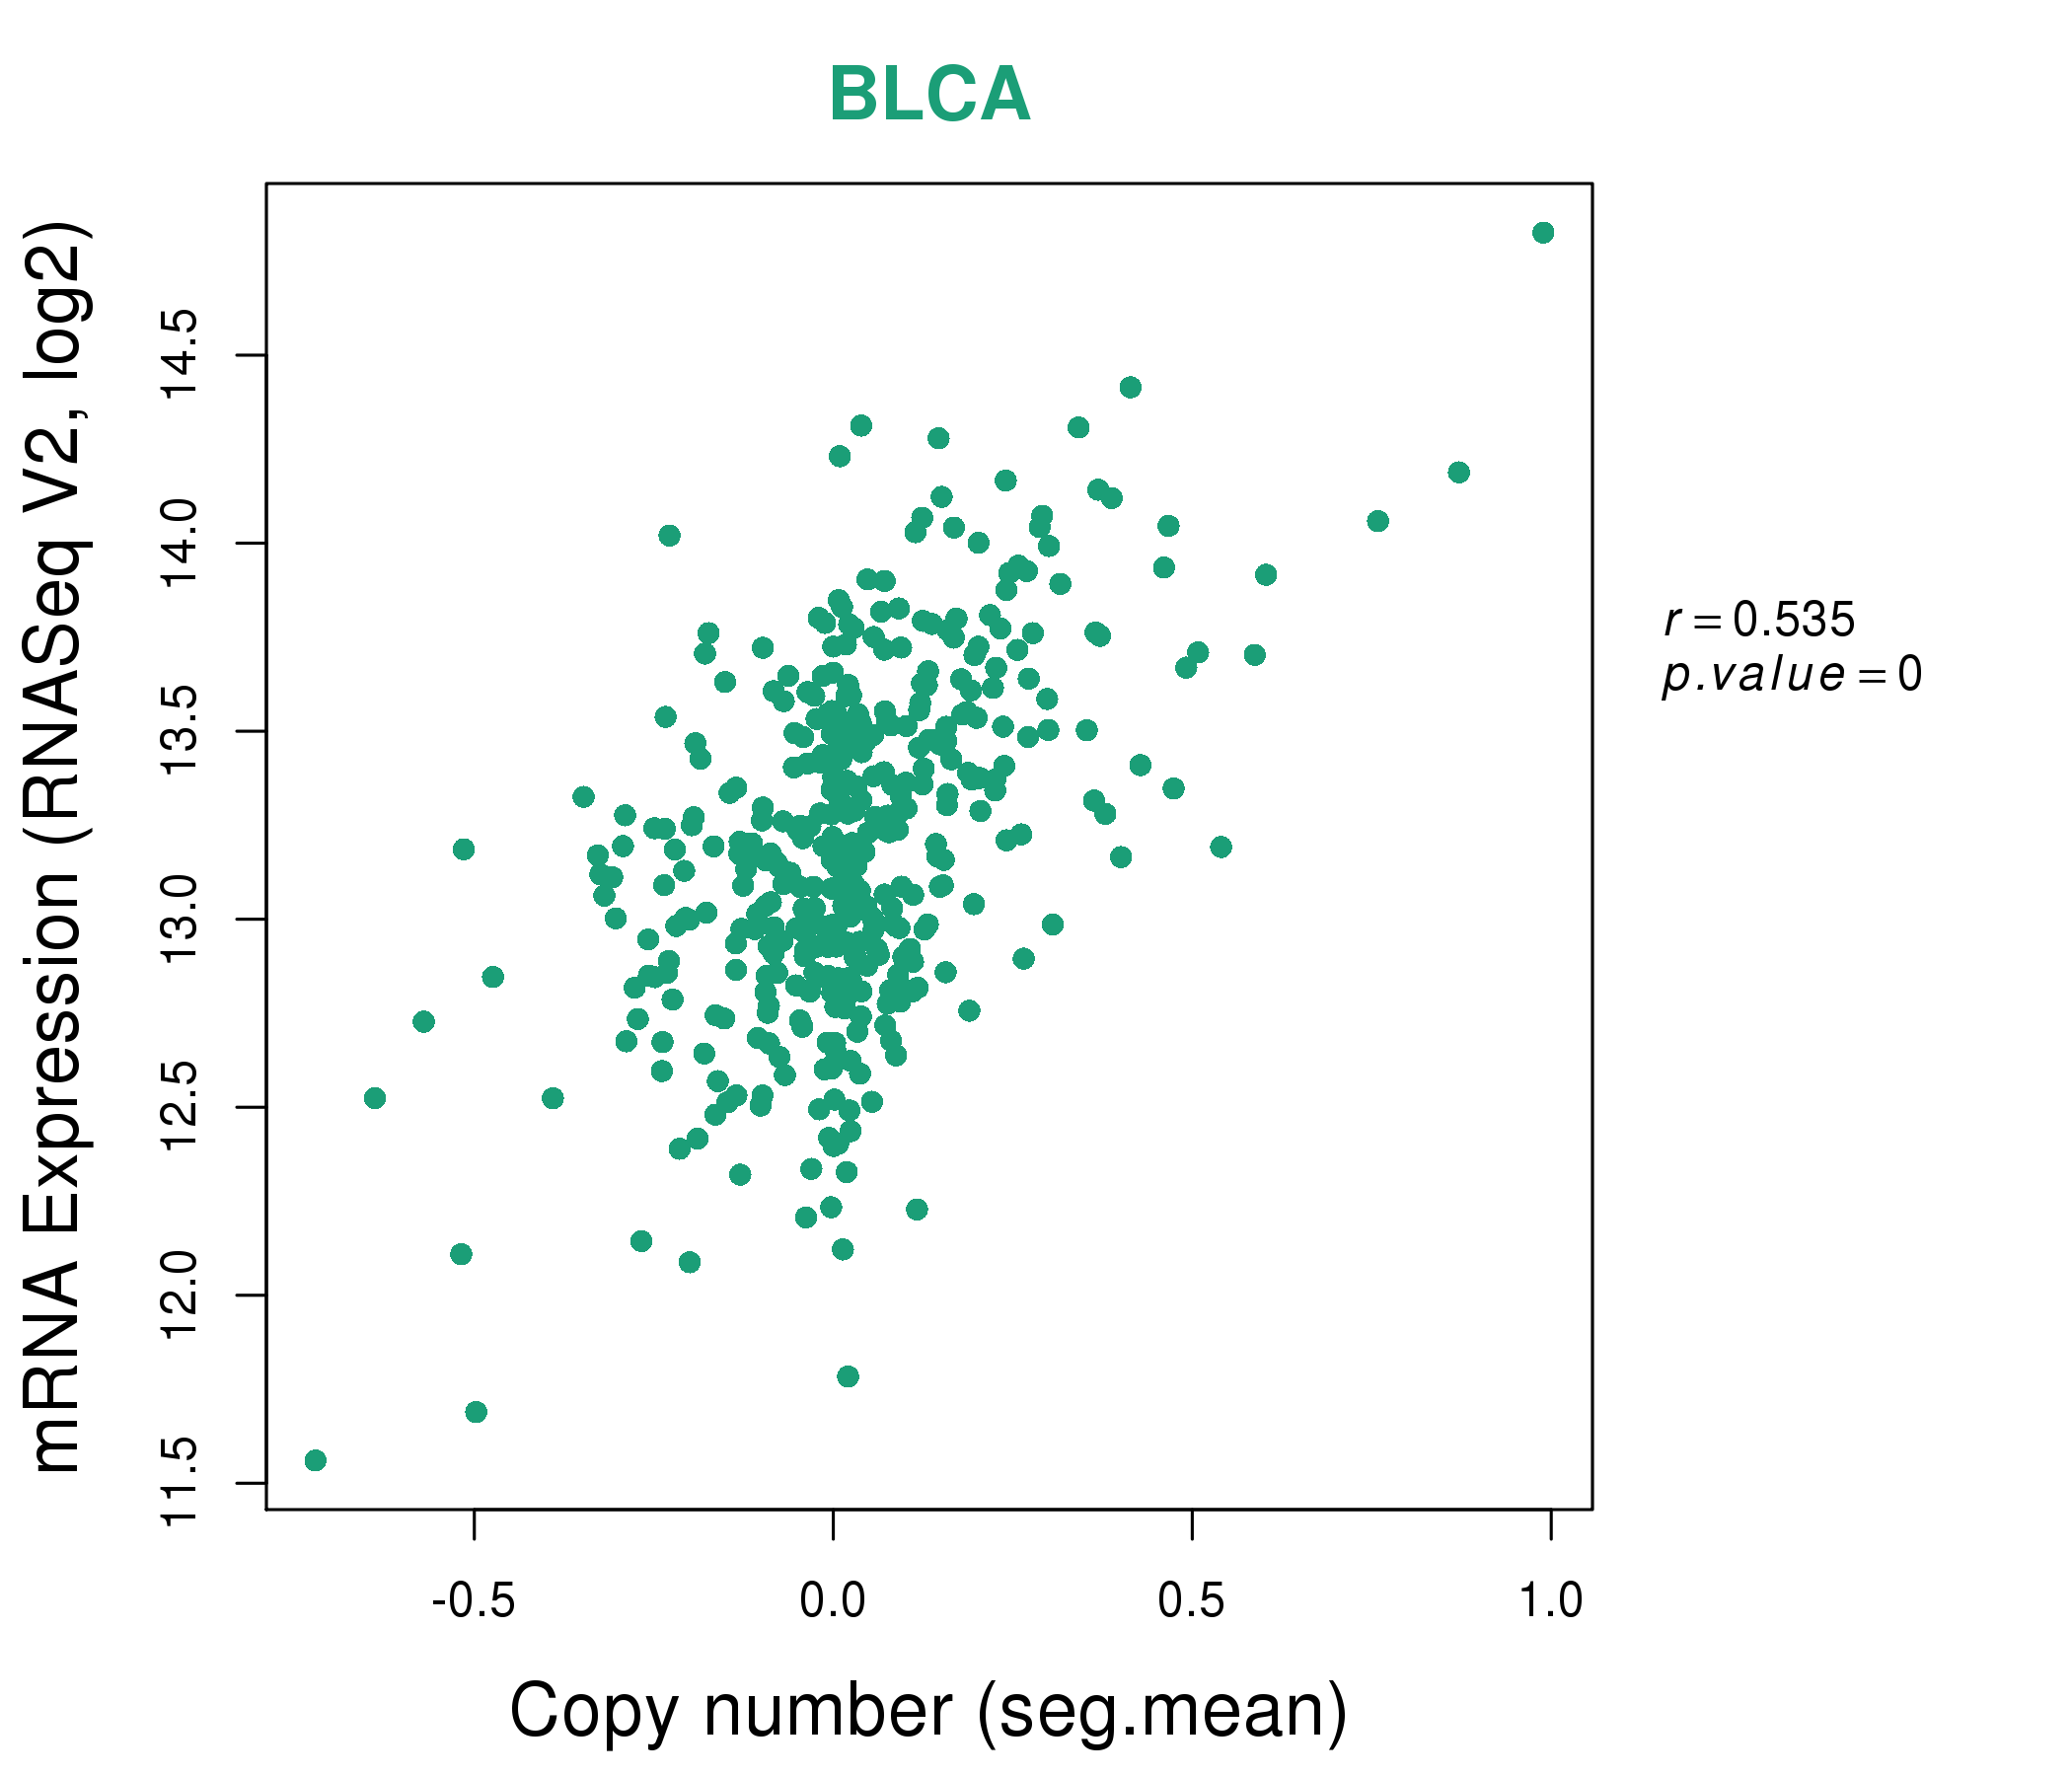
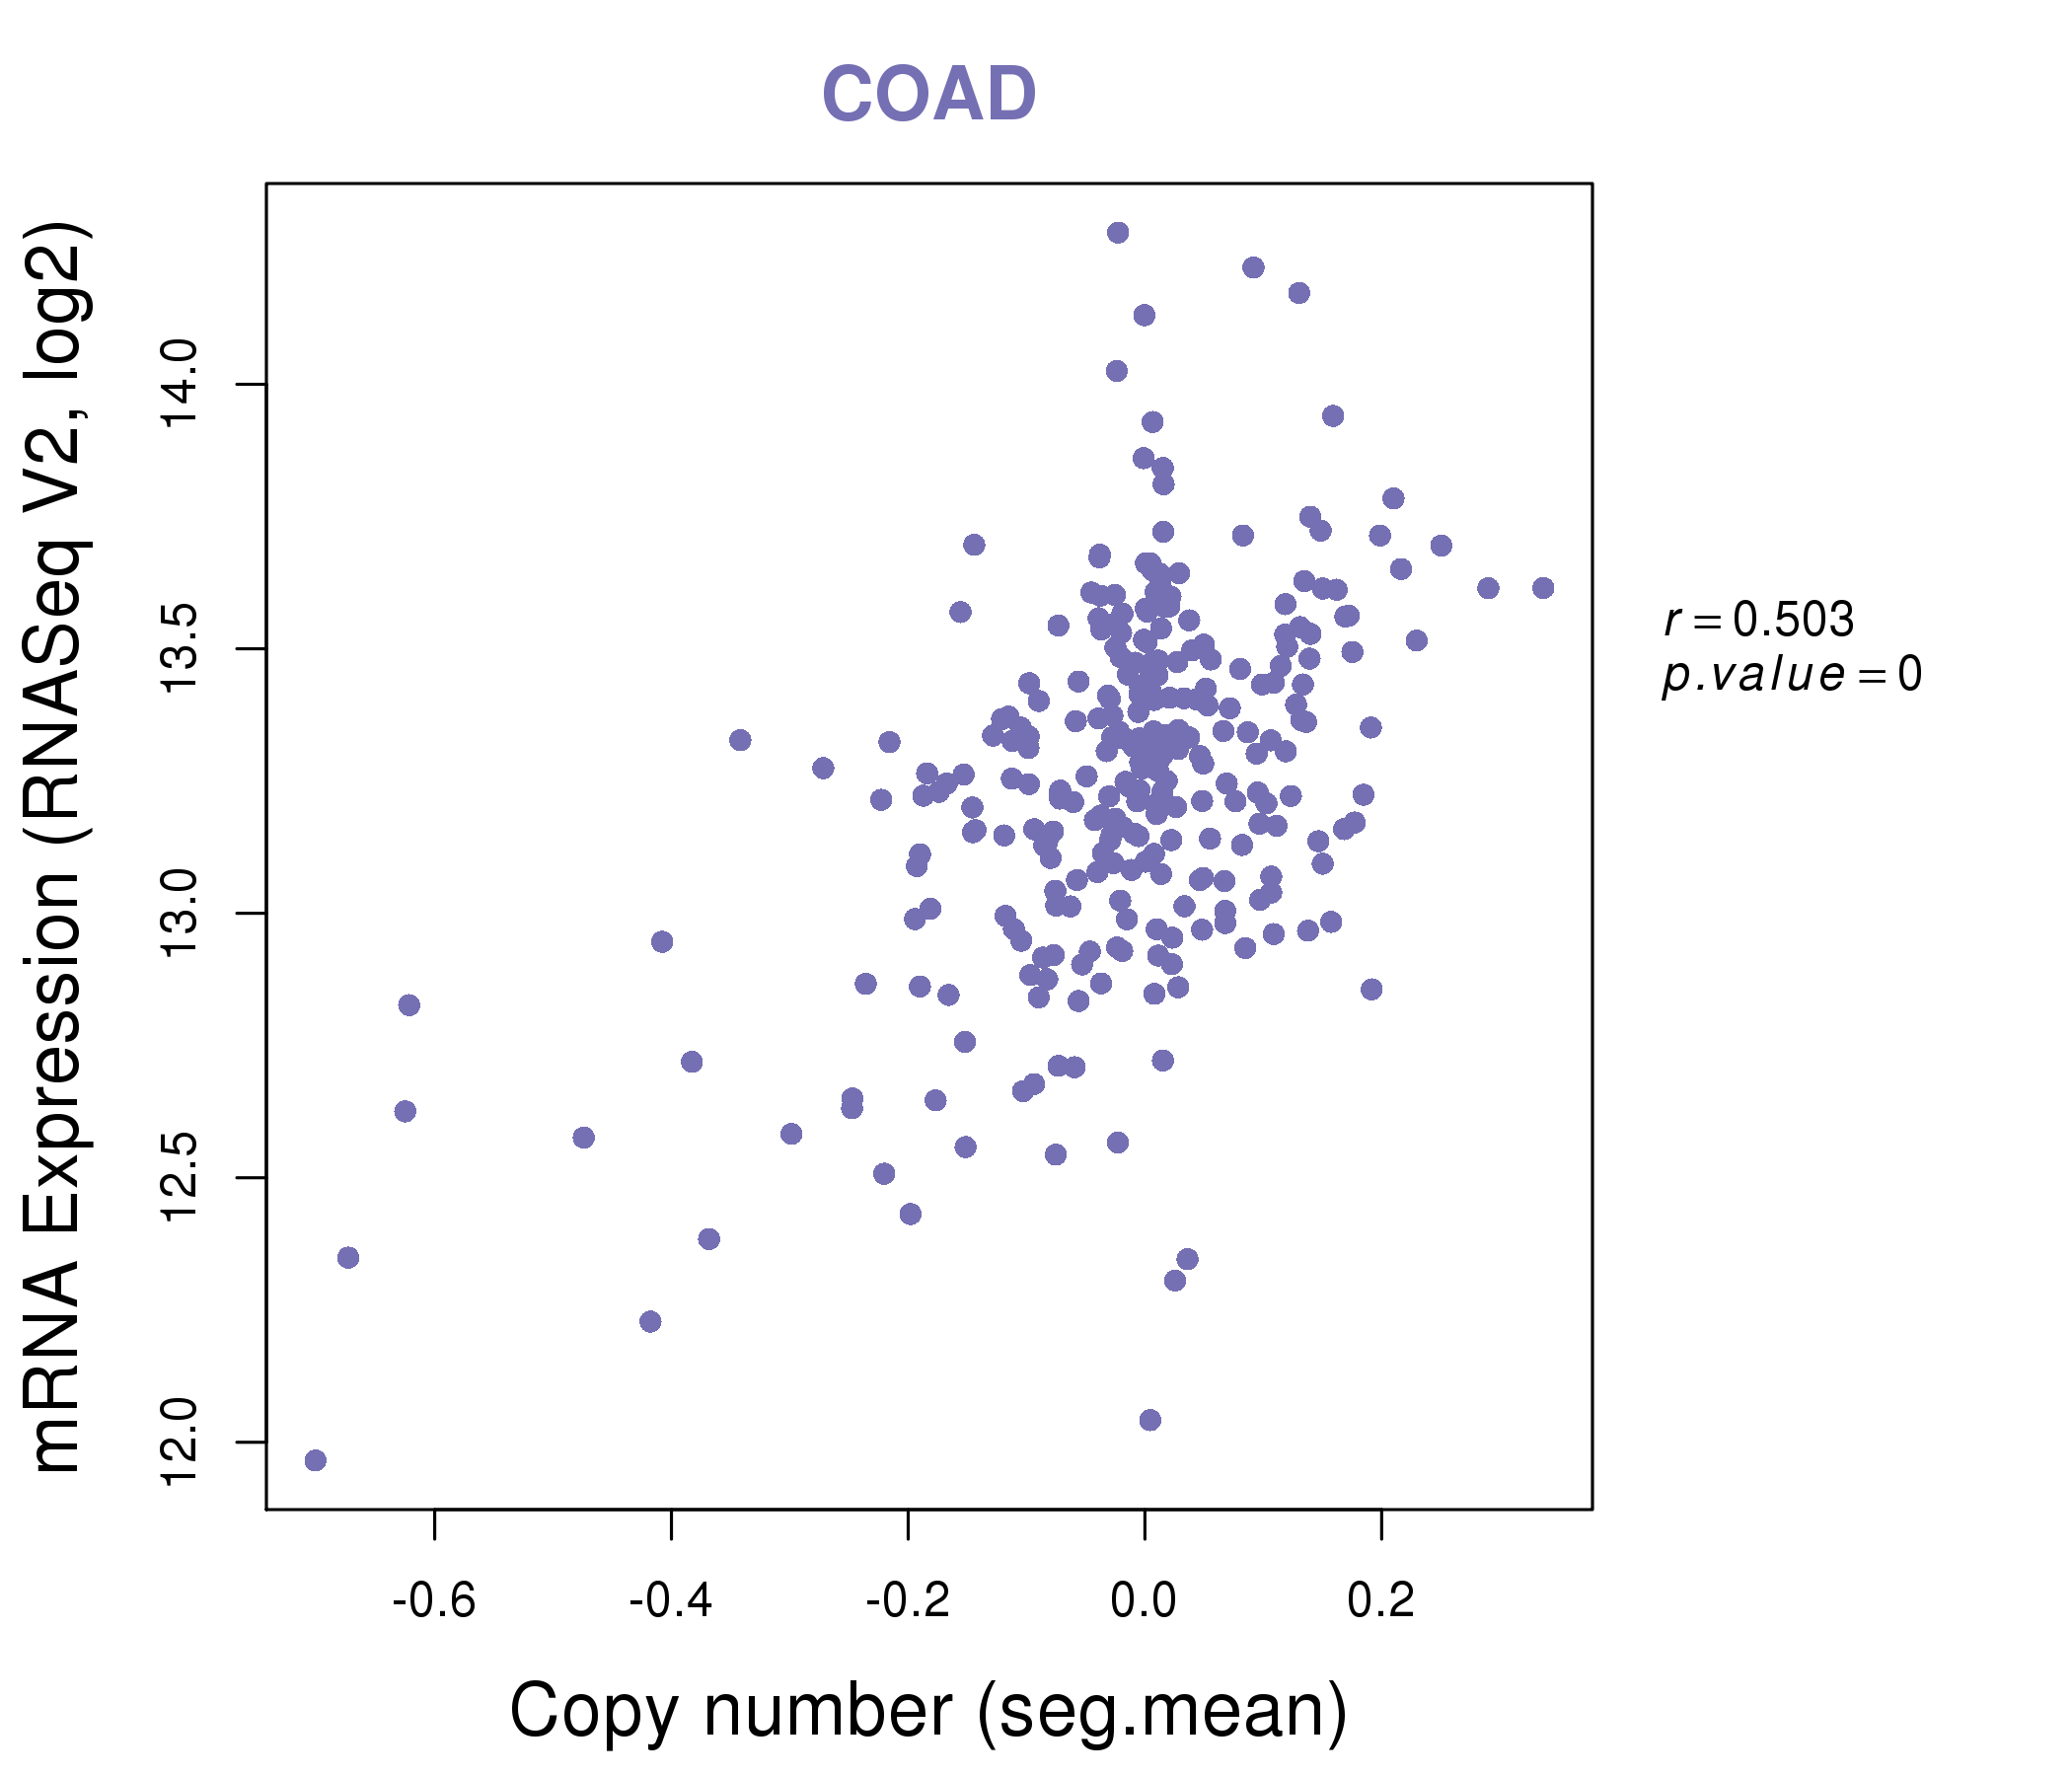
| * Copy number data were extracted from TCGA using R package TCGA-Assembler. The URLs of all public data files on TCGA DCC data server were gathered on Jan-05-2015. Function ProcessCNAData in TCGA-Assembler package was used to obtain gene-level copy number value which is calculated as the average copy number of the genomic region of a gene. |
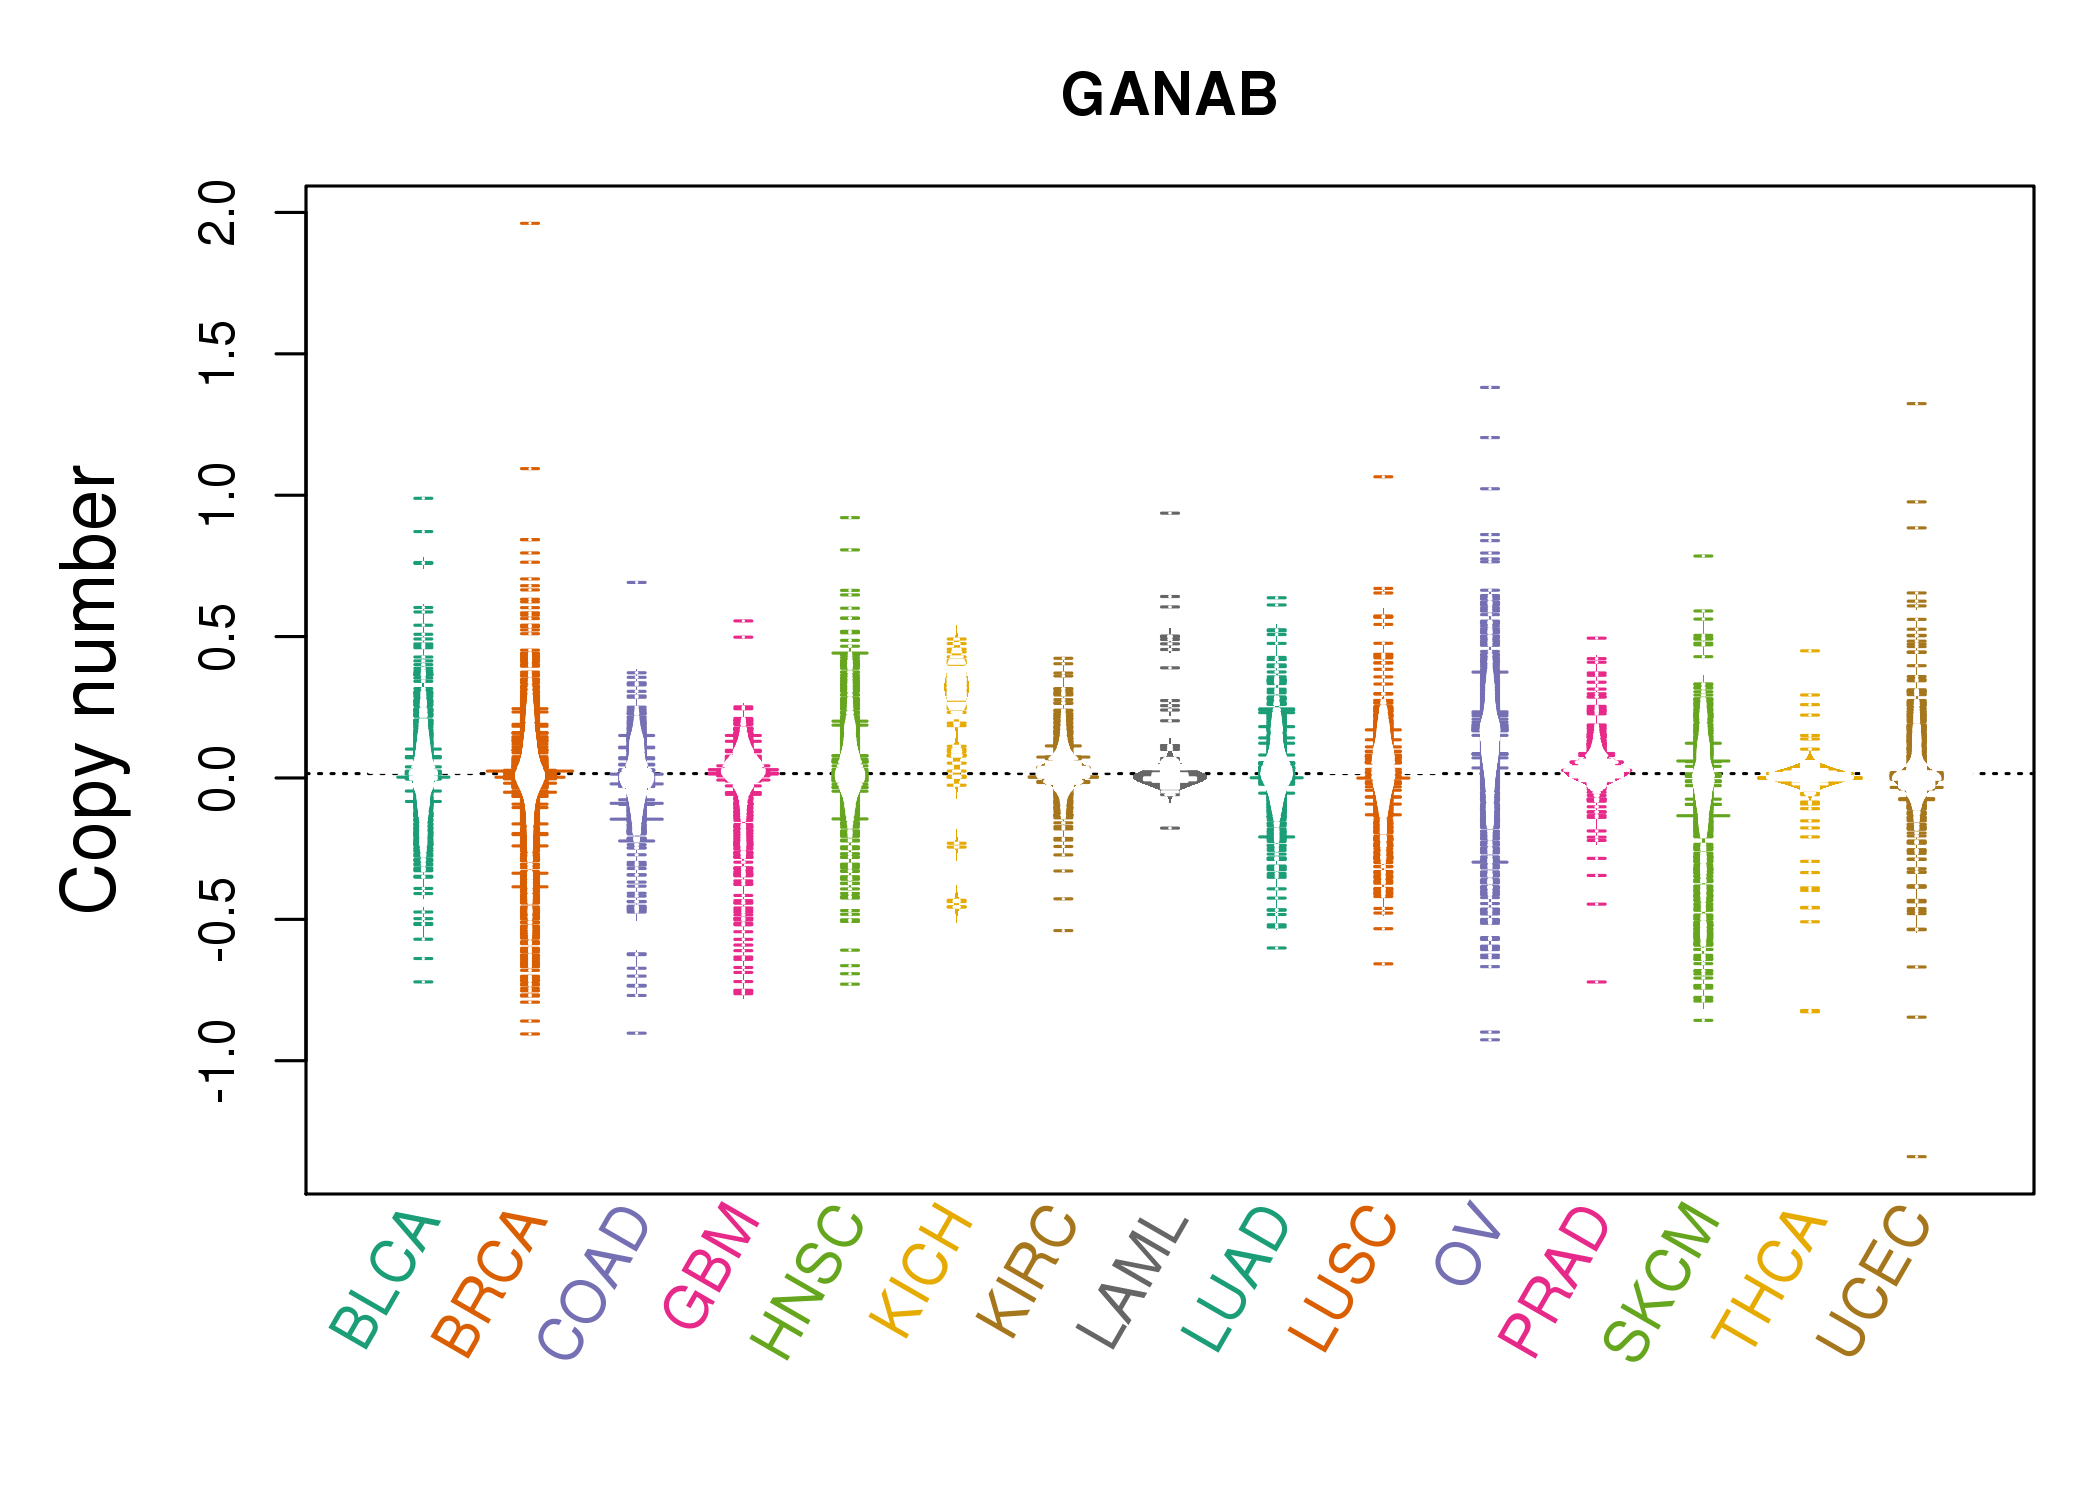 |
| cf) Tissue ID[Tissue type]: BLCA[Bladder Urothelial Carcinoma], BRCA[Breast invasive carcinoma], CESC[Cervical squamous cell carcinoma and endocervical adenocarcinoma], COAD[Colon adenocarcinoma], GBM[Glioblastoma multiforme], Glioma Low Grade, HNSC[Head and Neck squamous cell carcinoma], KICH[Kidney Chromophobe], KIRC[Kidney renal clear cell carcinoma], KIRP[Kidney renal papillary cell carcinoma], LAML[Acute Myeloid Leukemia], LUAD[Lung adenocarcinoma], LUSC[Lung squamous cell carcinoma], OV[Ovarian serous cystadenocarcinoma ], PAAD[Pancreatic adenocarcinoma], PRAD[Prostate adenocarcinoma], SKCM[Skin Cutaneous Melanoma], STAD[Stomach adenocarcinoma], THCA[Thyroid carcinoma], UCEC[Uterine Corpus Endometrial Carcinoma] |
| Top |
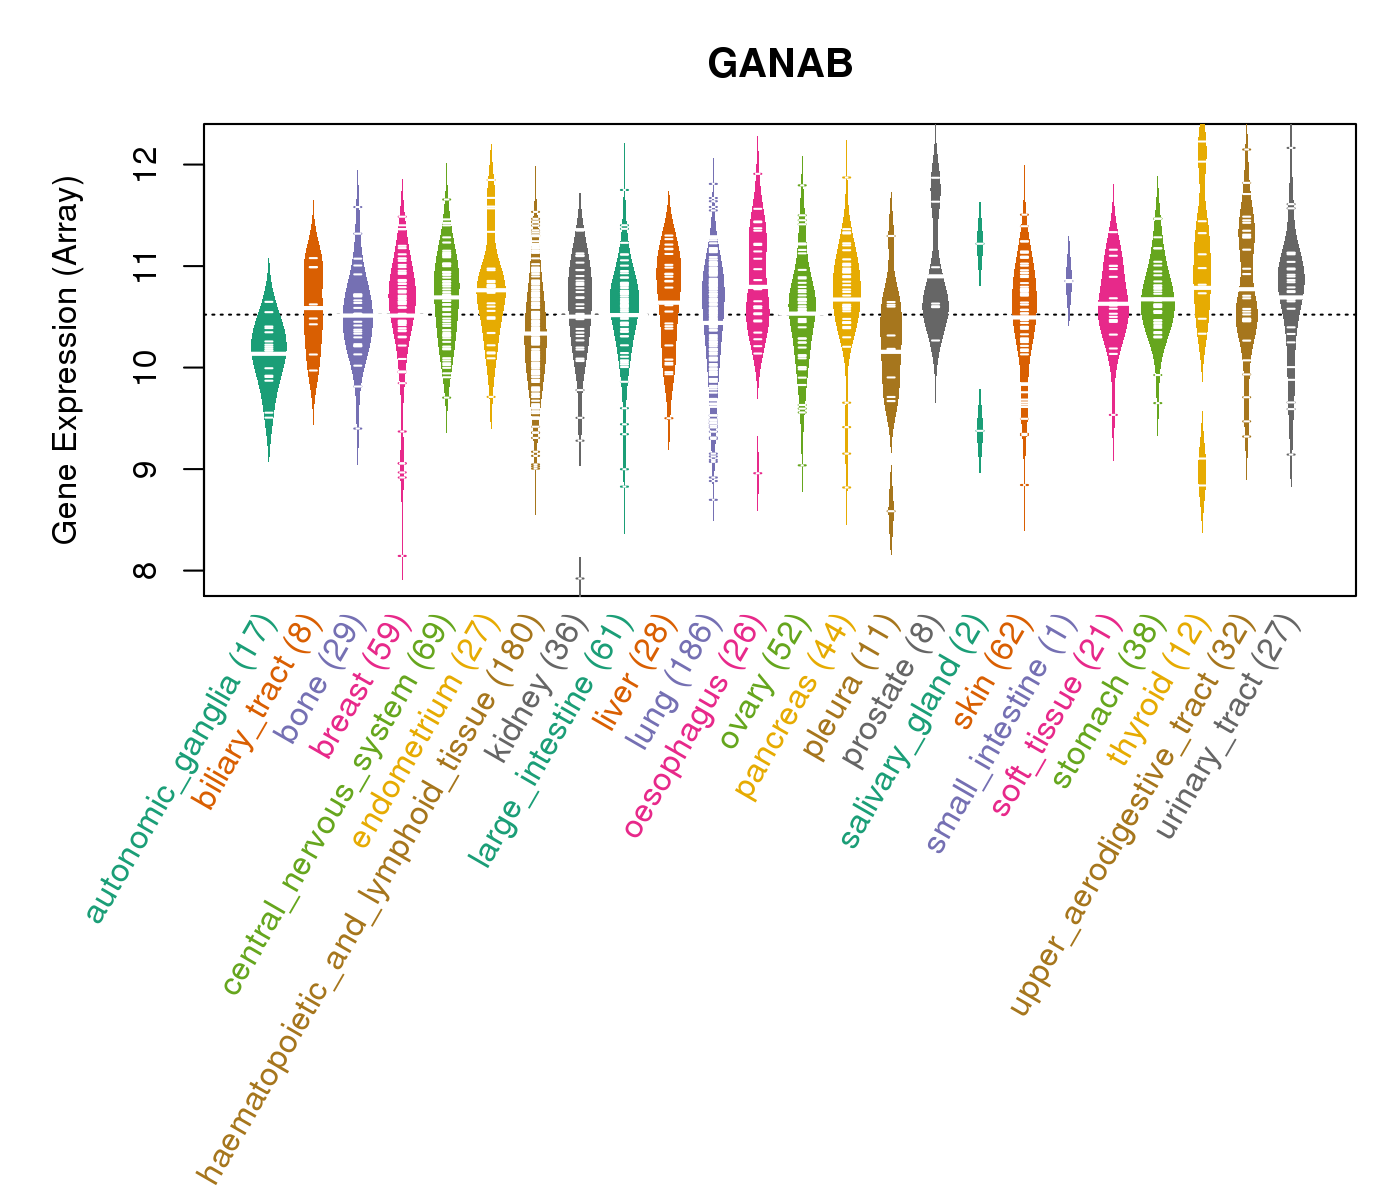
| Gene Expression for GANAB |
| * CCLE gene expression data were extracted from CCLE_Expression_Entrez_2012-10-18.res: Gene-centric RMA-normalized mRNA expression data. |
 |
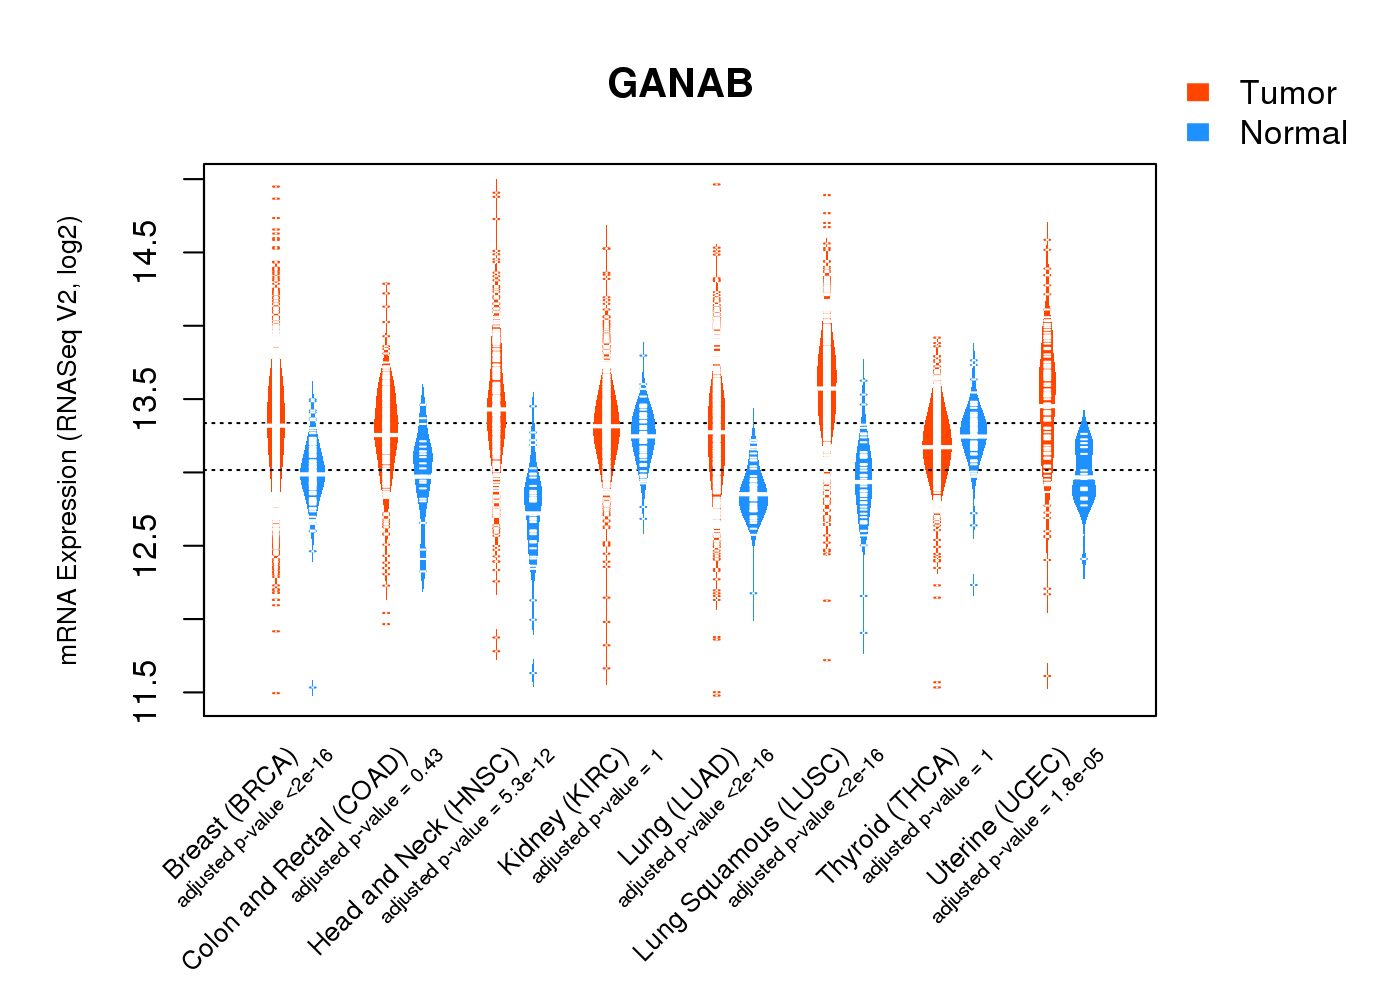
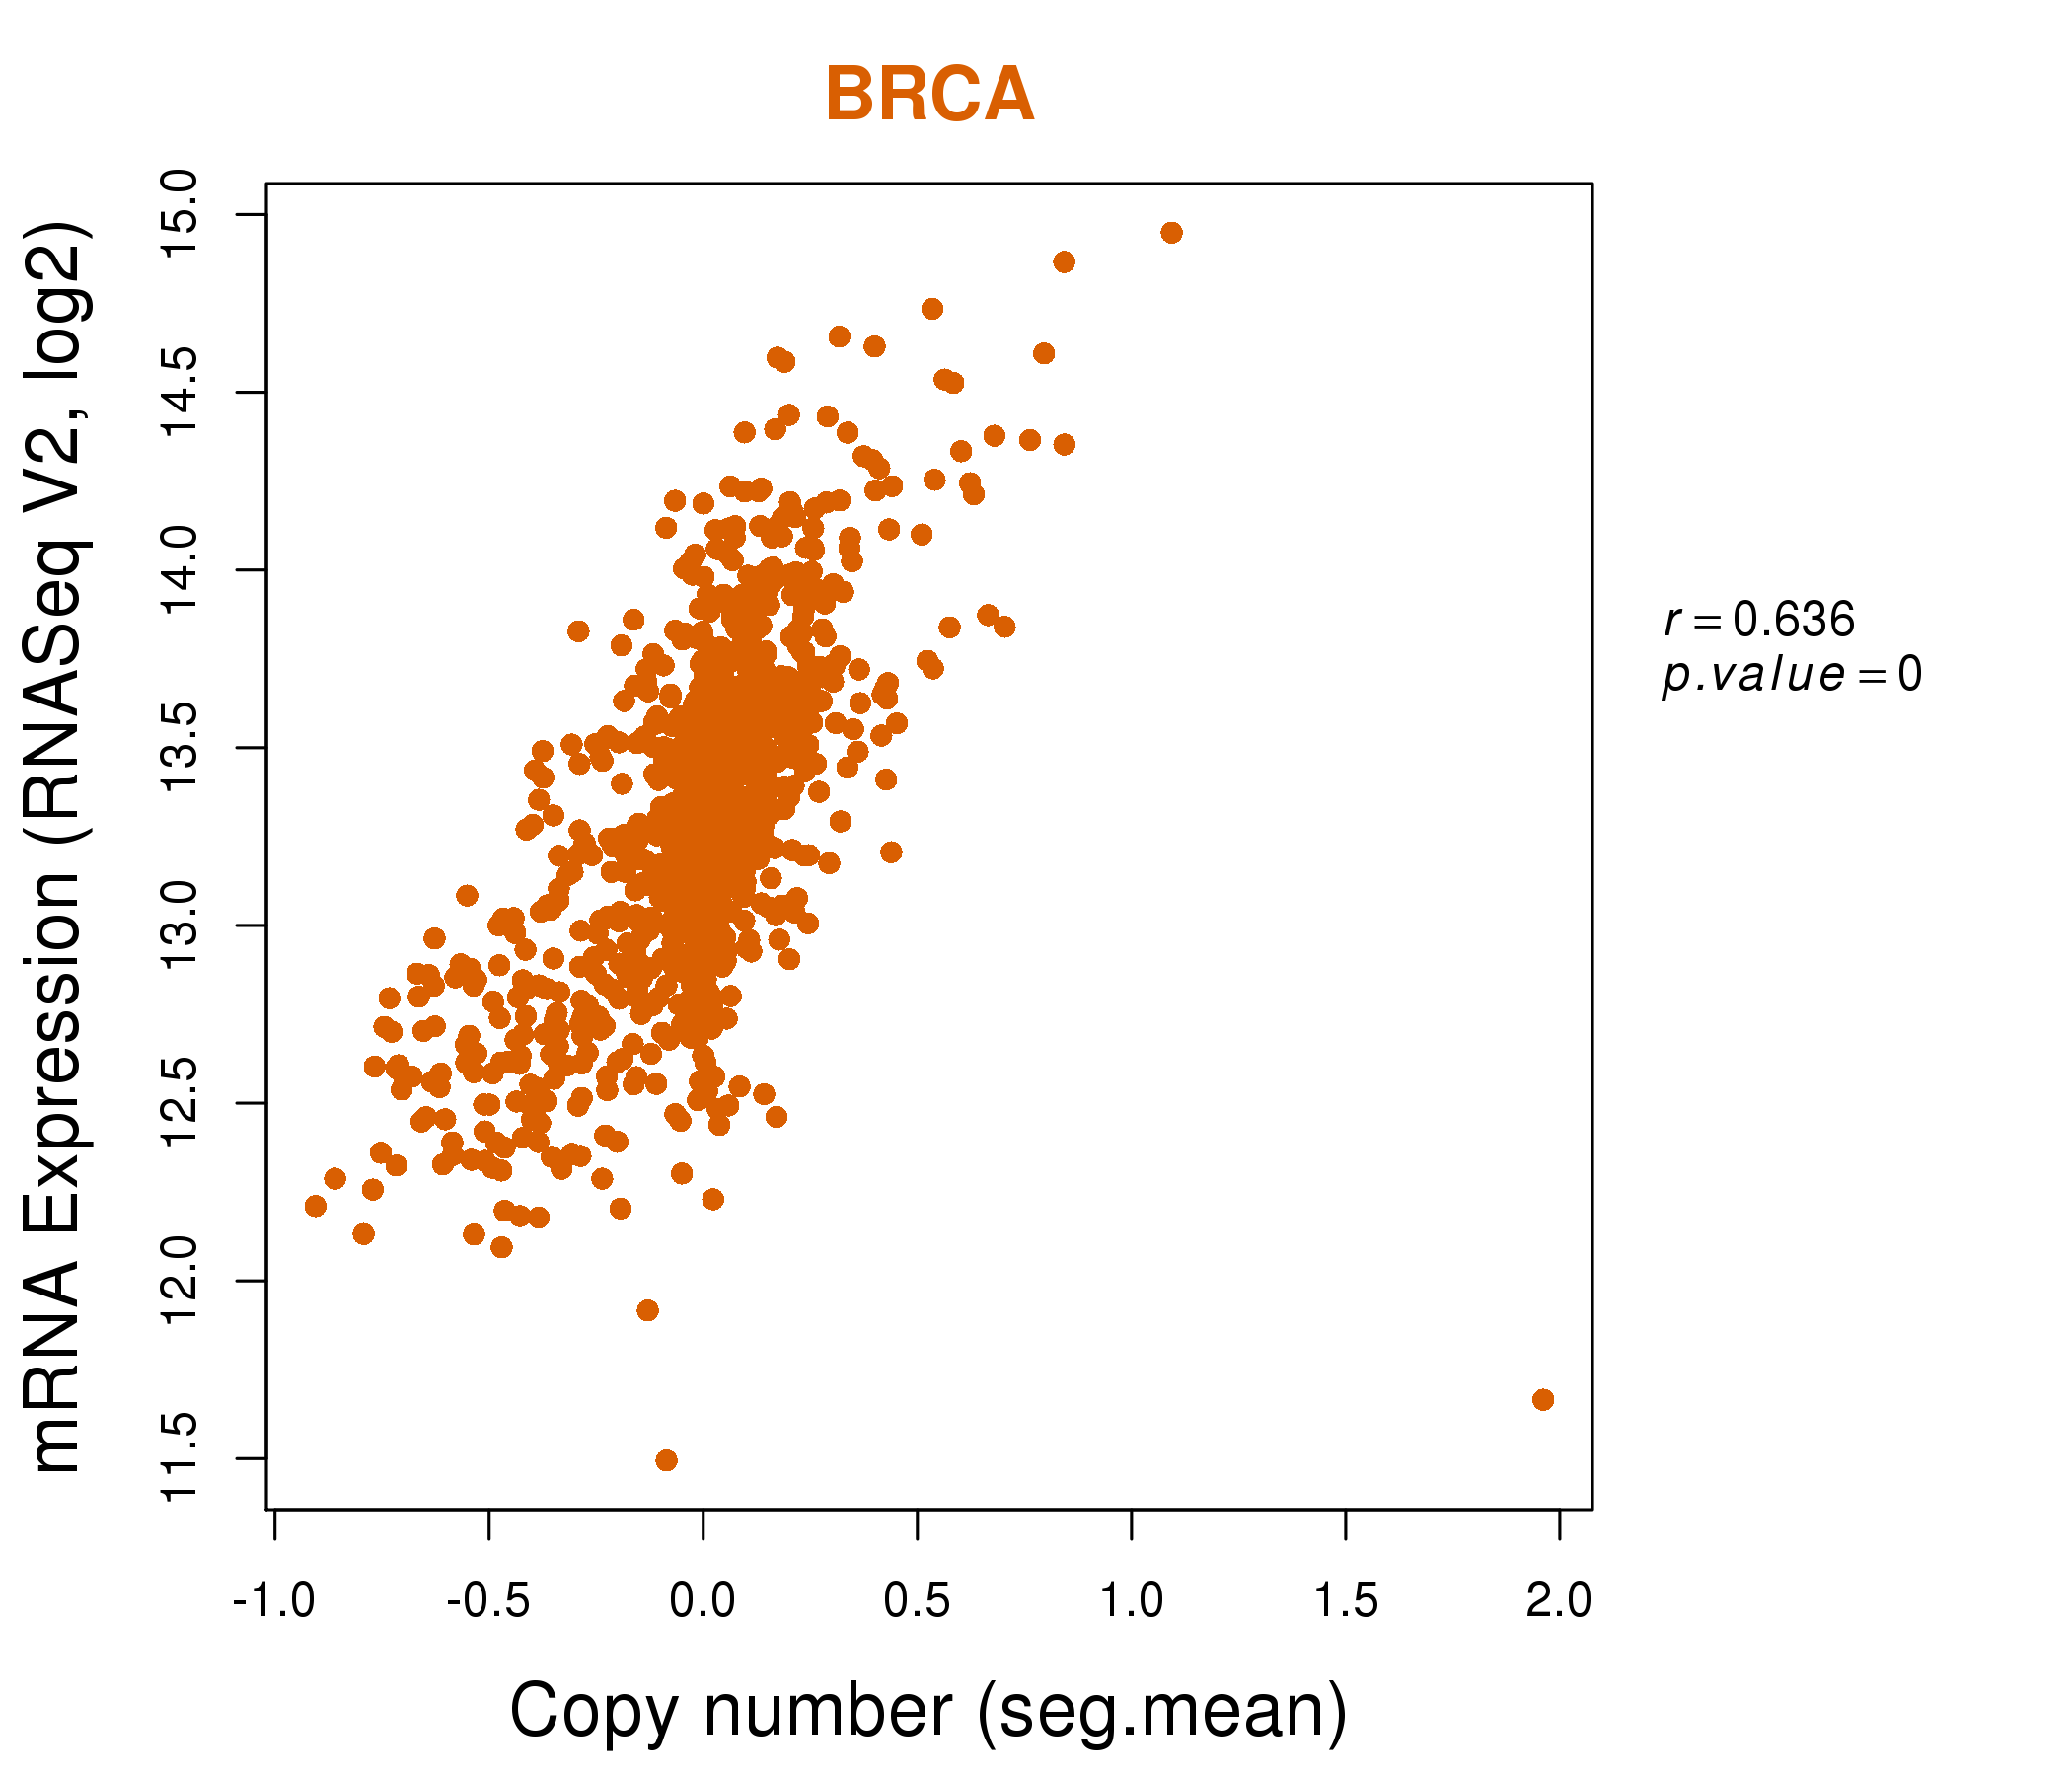
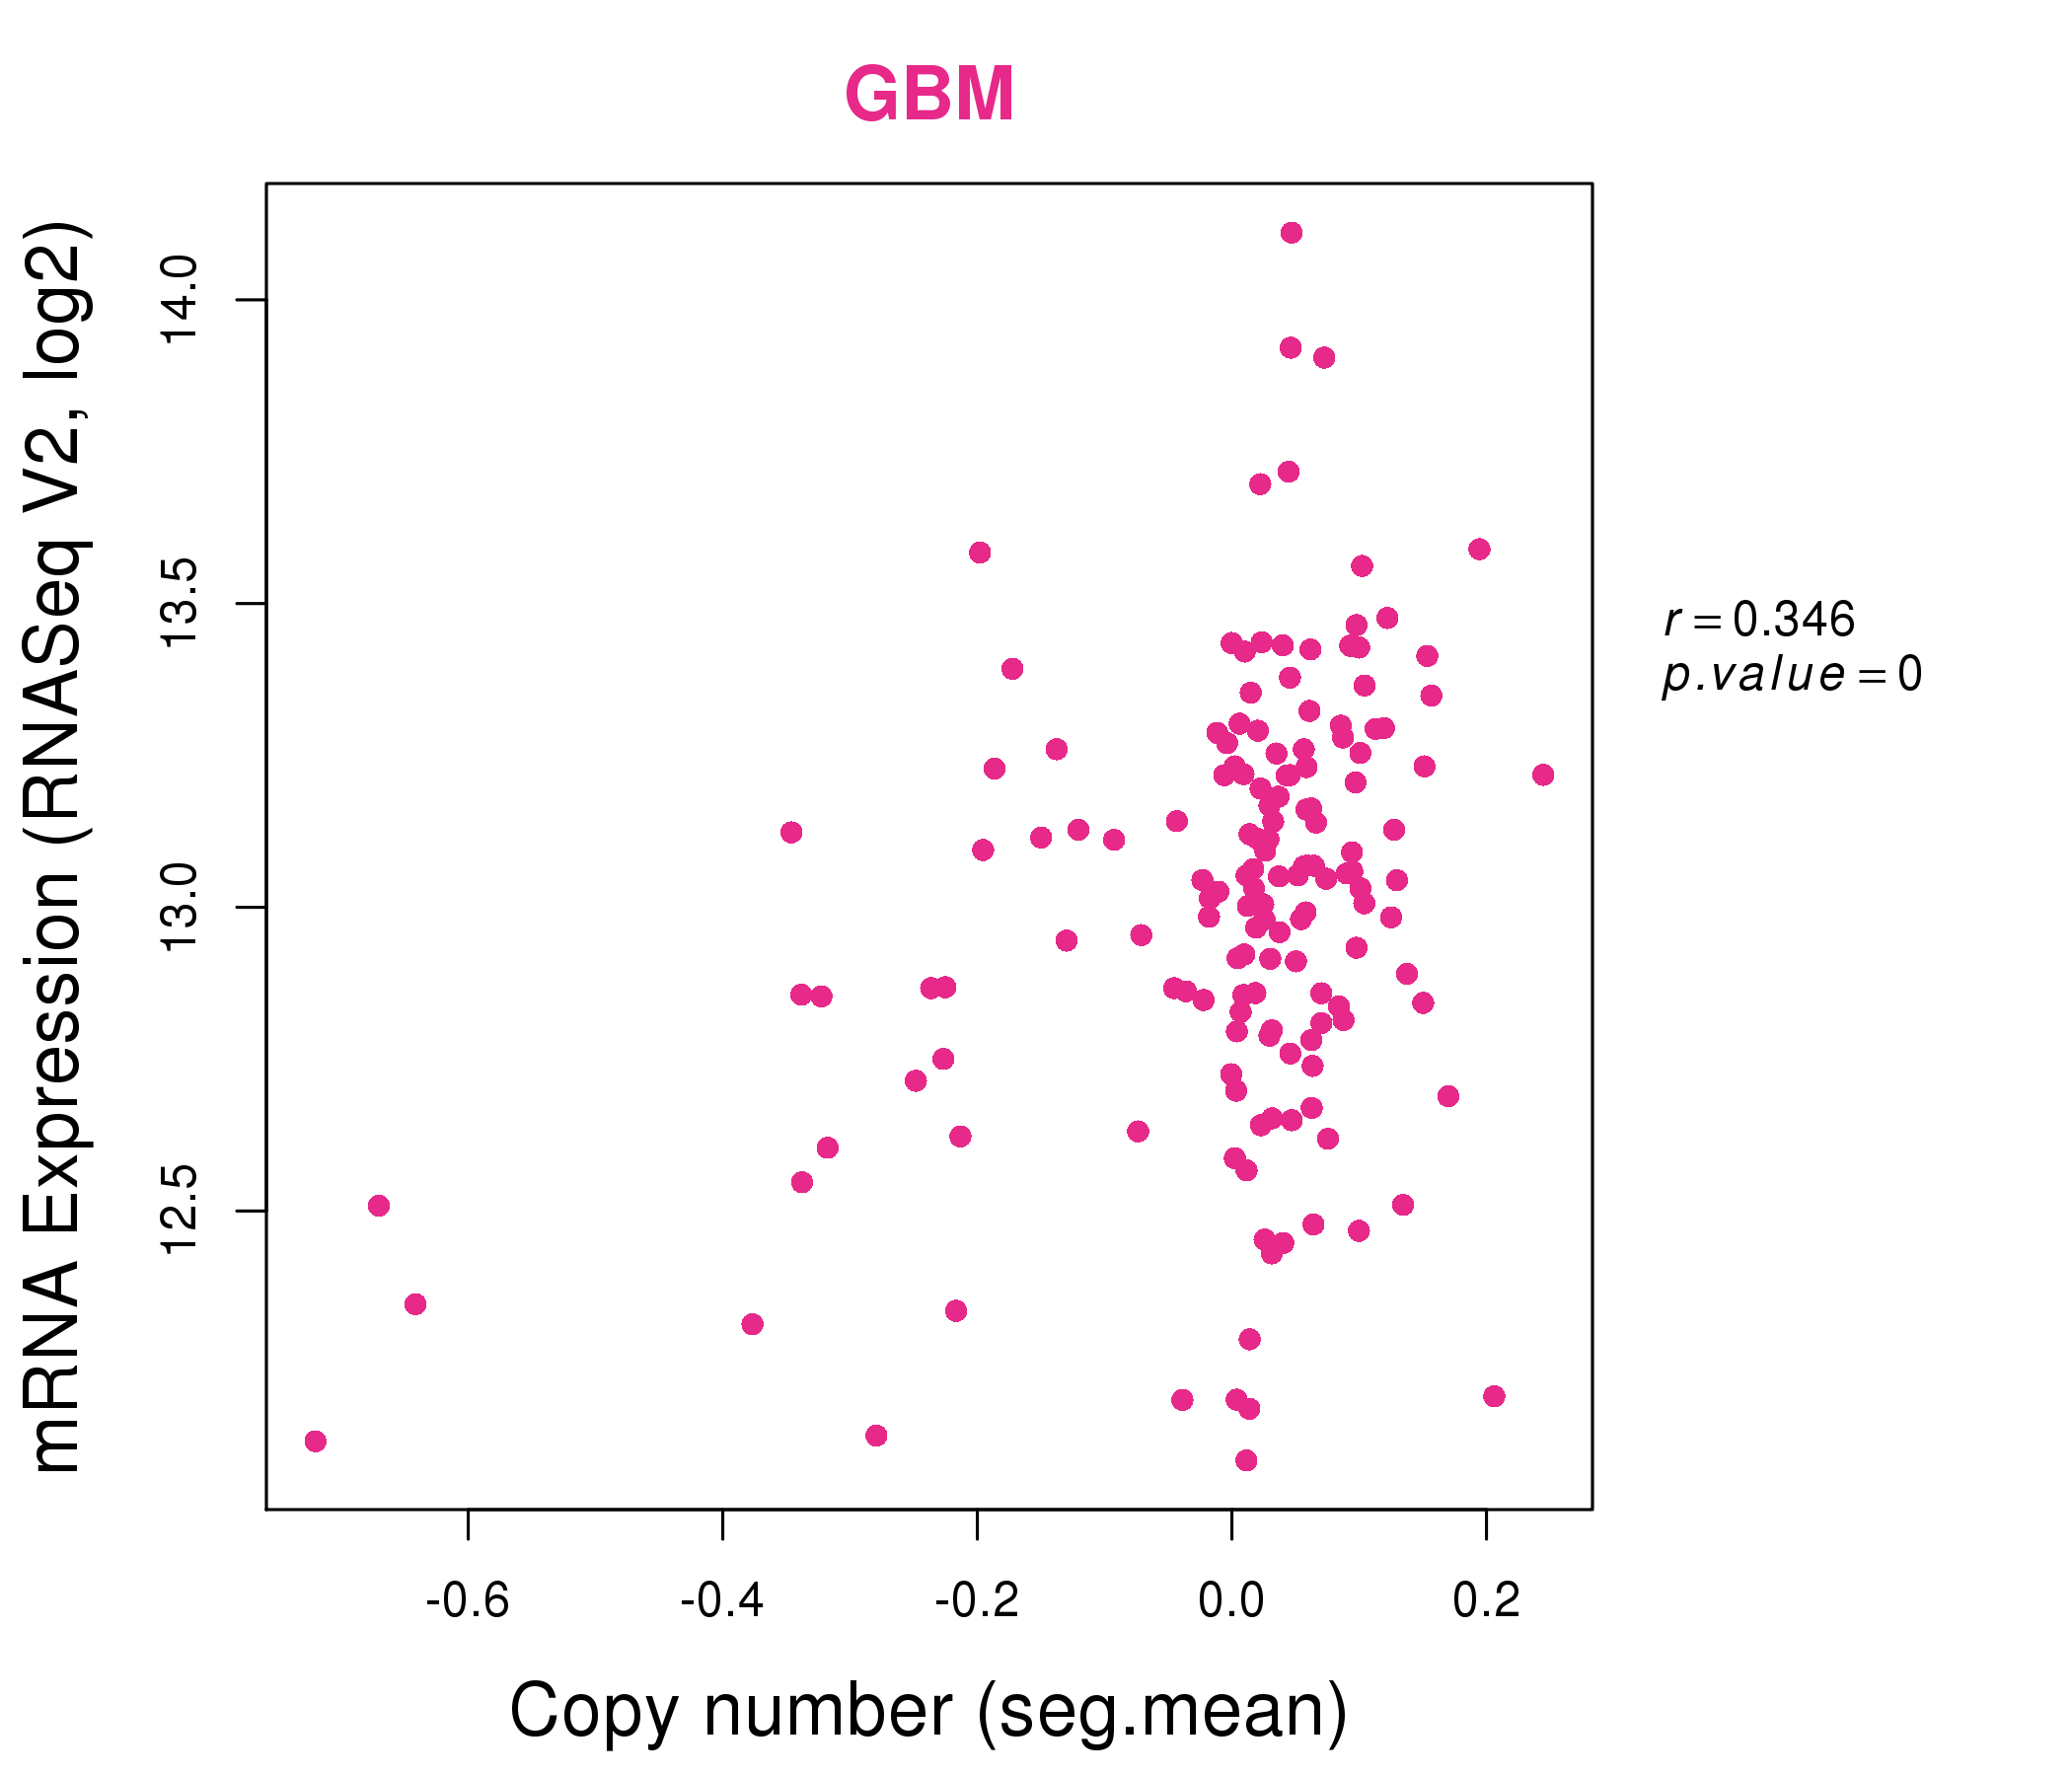
| * Normalized gene expression data of RNASeqV2 was extracted from TCGA using R package TCGA-Assembler. The URLs of all public data files on TCGA DCC data server were gathered at Jan-05-2015. Only eight cancer types have enough normal control samples for differential expression analysis. (t test, adjusted p<0.05 (using Benjamini-Hochberg FDR)) |
 |
| Top |
| * This plots show the correlation between CNV and gene expression. |
: Open all plots for all cancer types
 |
|
 |
|
| Top |
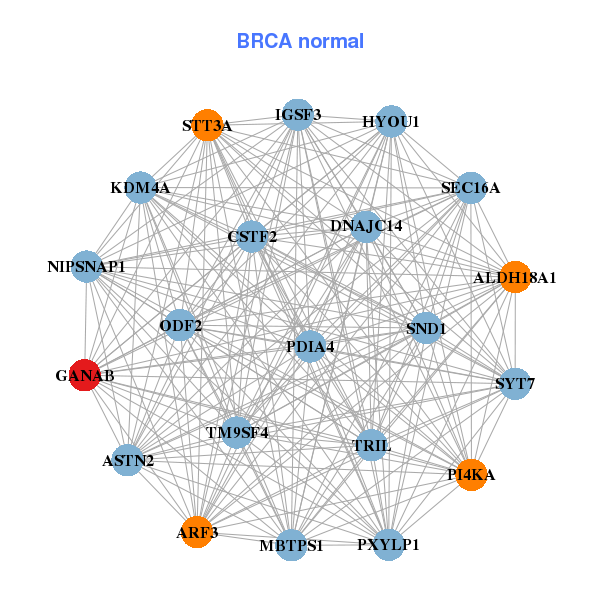
| Gene-Gene Network Information |
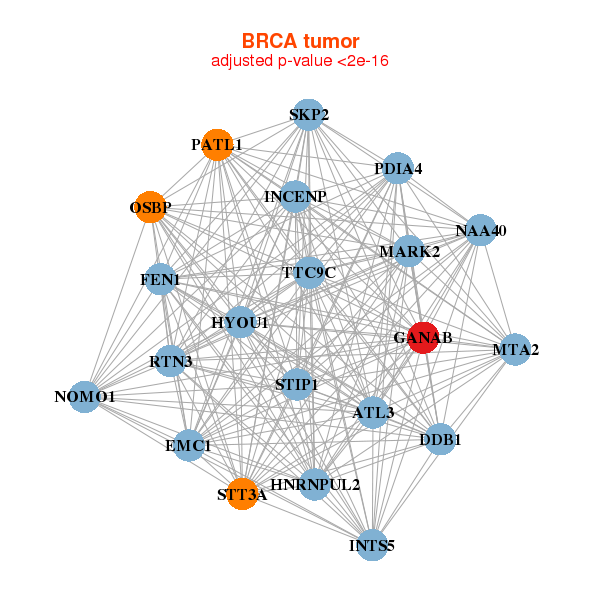
| * Co-Expression network figures were drawn using R package igraph. Only the top 20 genes with the highest correlations were shown. Red circle: input gene, orange circle: cell metabolism gene, sky circle: other gene |
: Open all plots for all cancer types
 |
|
| ATL3,DDB1,FEN1,GANAB,HNRNPUL2,HYOU1,INCENP, INTS5,EMC1,MARK2,MTA2,NAA40,NOMO1,OSBP, PATL1,PDIA4,RTN3,SKP2,STIP1,STT3A,TTC9C | PXYLP1,ALDH18A1,ARF3,ASTN2,CSTF2,DNAJC14,GANAB, HYOU1,IGSF3,KDM4A,MBTPS1,NIPSNAP1,ODF2,PDIA4, PI4KA,SEC16A,SND1,STT3A,SYT7,TM9SF4,TRIL |
 |
|
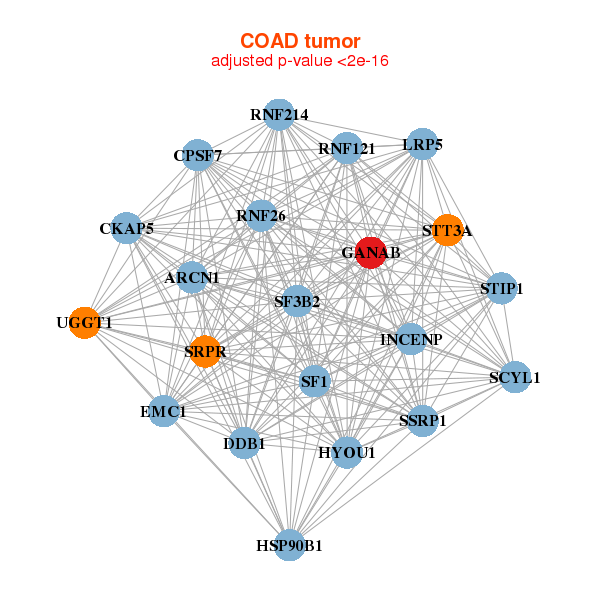
| ARCN1,CKAP5,CPSF7,DDB1,GANAB,HSP90B1,HYOU1, INCENP,EMC1,LRP5,RNF121,RNF214,RNF26,SCYL1, SF1,SF3B2,SRPR,SSRP1,STIP1,STT3A,UGGT1 | BMS1,CBX5,CKAP5,DCAF7,DDB1,GANAB,GCN1L1, HNRNPU,EMC1,VWA8,LARP1,LRBA,NUP214,PRKDC, PRPF8,SAFB2,SAFB,SF3B3,TAF15,UGGT1,VPRBP |
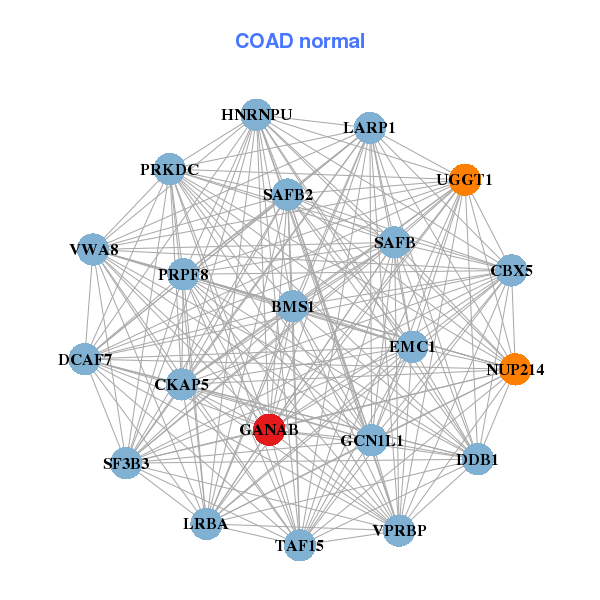
| * Co-Expression network figures were drawn using R package igraph. Only the top 20 genes with the highest correlations were shown. Red circle: input gene, orange circle: cell metabolism gene, sky circle: other gene |
: Open all plots for all cancer types
| Top |
: Open all interacting genes' information including KEGG pathway for all interacting genes from DAVID
| Top |
| Pharmacological Information for GANAB |
| There's no related Drug. |
| Top |
| Cross referenced IDs for GANAB |
| * We obtained these cross-references from Uniprot database. It covers 150 different DBs, 18 categories. http://www.uniprot.org/help/cross_references_section |
: Open all cross reference information
|
Copyright © 2016-Present - The Univsersity of Texas Health Science Center at Houston @ |