|
||||||||||||||||||||
| |
| Phenotypic Information (metabolism pathway, cancer, disease, phenome) |
| |
| |
| Gene-Gene Network Information: Co-Expression Network, Interacting Genes & KEGG |
| |
|


| Gene Summary for PMPCA |
| Top |
| Phenotypic Information for PMPCA(metabolism pathway, cancer, disease, phenome) |
| Cancer | CGAP: PMPCA |
| Familial Cancer Database: PMPCA | |
| * This gene is included in those cancer gene databases. |
|
|
|
|
|
|
| ||||||||||||||
Oncogene 1 | Significant driver gene in | |||||||||||||||||||
| cf) number; DB name 1 Oncogene; http://nar.oxfordjournals.org/content/35/suppl_1/D721.long, 2 Tumor Suppressor gene; https://bioinfo.uth.edu/TSGene/, 3 Cancer Gene Census; http://www.nature.com/nrc/journal/v4/n3/abs/nrc1299.html, 4 CancerGenes; http://nar.oxfordjournals.org/content/35/suppl_1/D721.long, 5 Network of Cancer Gene; http://ncg.kcl.ac.uk/index.php, 1Therapeutic Vulnerabilities in Cancer; http://cbio.mskcc.org/cancergenomics/statius/ |
| REACTOME_METABOLISM_OF_PROTEINS | |
| OMIM | |
| Orphanet | |
| Disease | KEGG Disease: PMPCA |
| MedGen: PMPCA (Human Medical Genetics with Condition) | |
| ClinVar: PMPCA | |
| Phenotype | MGI: PMPCA (International Mouse Phenotyping Consortium) |
| PhenomicDB: PMPCA | |
| Mutations for PMPCA |
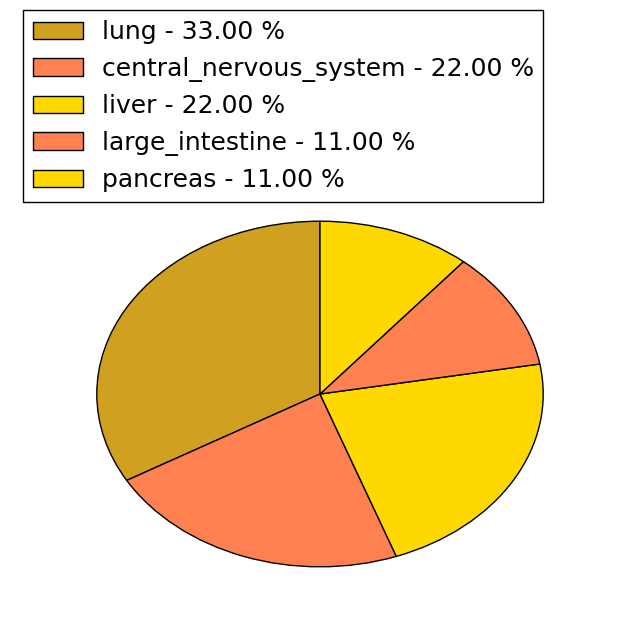
| * Under tables are showing count per each tissue to give us broad intuition about tissue specific mutation patterns.You can go to the detailed page for each mutation database's web site. |
| - Statistics for Tissue and Mutation type | Top |
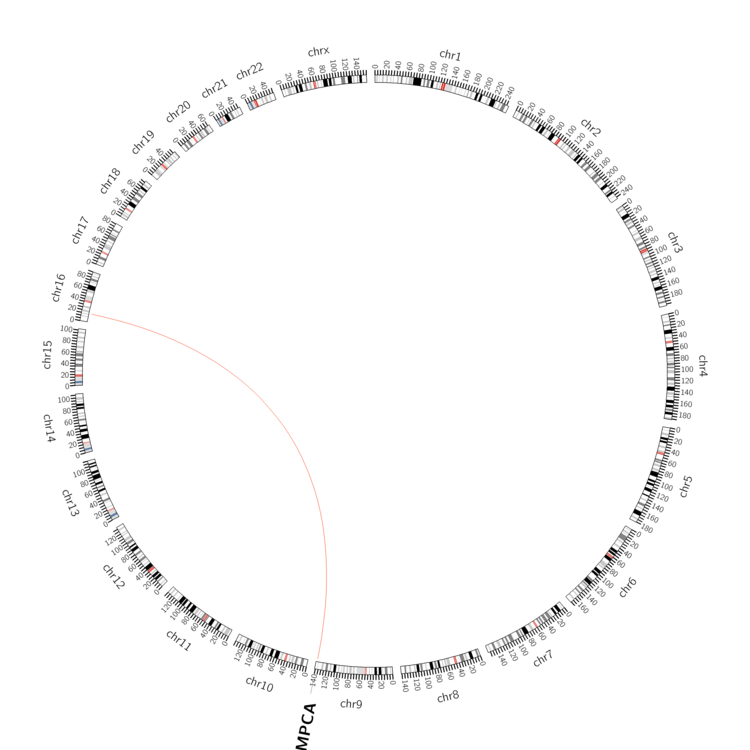 |
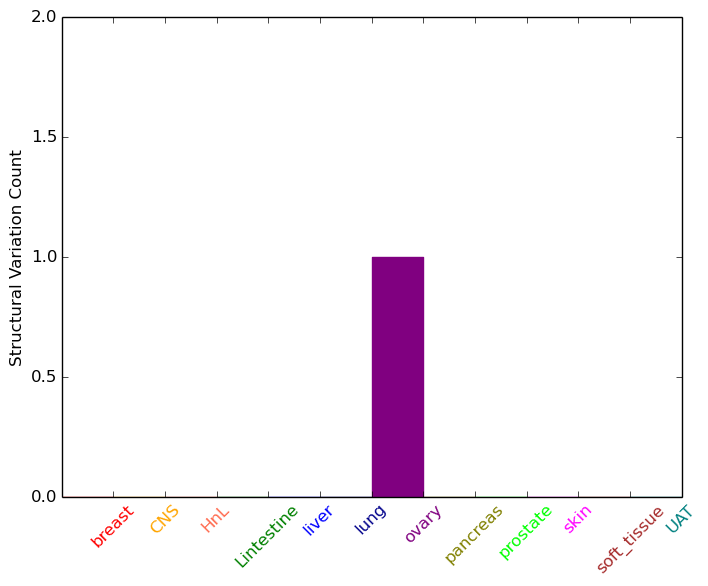
| - For Inter-chromosomal Variations |
| * Inter-chromosomal variantions includes 'interchromosomal amplicon to amplicon', 'interchromosomal amplicon to non-amplified dna', 'interchromosomal insertion', 'Interchromosomal unknown type'. |
 |
| - For Intra-chromosomal Variations |
| There's no intra-chromosomal structural variation. |
| Sample | Symbol_a | Chr_a | Start_a | End_a | Symbol_b | Chr_b | Start_b | End_b |
| cf) Tissue number; Tissue name (1;Breast, 2;Central_nervous_system, 3;Haematopoietic_and_lymphoid_tissue, 4;Large_intestine, 5;Liver, 6;Lung, 7;Ovary, 8;Pancreas, 9;Prostate, 10;Skin, 11;Soft_tissue, 12;Upper_aerodigestive_tract) |
| * From mRNA Sanger sequences, Chitars2.0 arranged chimeric transcripts. This table shows PMPCA related fusion information. |
| ID | Head Gene | Tail Gene | Accession | Gene_a | qStart_a | qEnd_a | Chromosome_a | tStart_a | tEnd_a | Gene_a | qStart_a | qEnd_a | Chromosome_a | tStart_a | tEnd_a |
| BF742243 | RILPL1 | 29 | 104 | 12 | 123984026 | 124008060 | PMPCA | 97 | 221 | 9 | 139317869 | 139317993 | |
| BF742244 | PMPCA | 2 | 54 | 9 | 139317869 | 139317921 | RILPL1 | 47 | 141 | 12 | 123984008 | 124008060 | |
| BF155162 | RILPL1 | 8 | 81 | 12 | 123984030 | 124008060 | PMPCA | 74 | 198 | 9 | 139317869 | 139317993 | |
| BE937971 | BOLA2 | 16 | 246 | 16 | 30129814 | 30133330 | PMPCA | 243 | 339 | 9 | 139316289 | 139316385 | |
| M78956 | PMPCA | 1 | 250 | 9 | 139317962 | 139318212 | GATAD2A | 250 | 311 | 19 | 19619679 | 19619740 | |
| Top |
| There's no copy number variation information in COSMIC data for this gene. |
| Top |
|
 |
| Top |
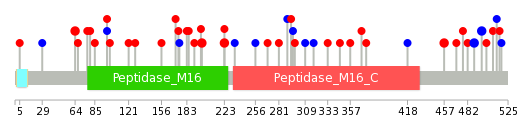
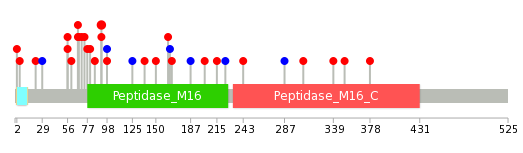
| Stat. for Non-Synonymous SNVs (# total SNVs=29) | (# total SNVs=9) |
 |  |
(# total SNVs=0) | (# total SNVs=0) |
| Top |
| * When you move the cursor on each content, you can see more deailed mutation information on the Tooltip. Those are primary_site,primary_histology,mutation(aa),pubmedID. |
| GRCh37 position | Mutation(aa) | Unique sampleID count |
| chr9:139311437-139311437 | p.R223H | 2 |
| chr9:139306568-139306568 | p.K64R | 2 |
| chr9:139317605-139317605 | p.P489P | 2 |
| chr9:139317629-139317629 | p.L497L | 2 |
| chr9:139316390-139316390 | p.R457L | 2 |
| chr9:139310805-139310805 | p.P199S | 2 |
| chr9:139306464-139306464 | p.A29A | 1 |
| chr9:139313014-139313014 | p.D333A | 1 |
| chr9:139309033-139309033 | p.D156N | 1 |
| chr9:139317583-139317583 | p.S482F | 1 |
| Top |
|
 |
| Point Mutation/ Tissue ID | 1 | 2 | 3 | 4 | 5 | 6 | 7 | 8 | 9 | 10 | 11 | 12 | 13 | 14 | 15 | 16 | 17 | 18 | 19 | 20 |
| # sample | 2 | 2 | 2 | 2 | 3 | 1 | 1 | 4 | 2 | 5 | 6 | 6 | ||||||||
| # mutation | 2 | 2 | 2 | 2 | 3 | 1 | 1 | 4 | 2 | 5 | 6 | 6 | ||||||||
| nonsynonymous SNV | 2 | 2 | 2 | 1 | 3 | 1 | 1 | 2 | 2 | 2 | 5 | 6 | ||||||||
| synonymous SNV | 1 | 2 | 3 | 1 |
| cf) Tissue ID; Tissue type (1; BLCA[Bladder Urothelial Carcinoma], 2; BRCA[Breast invasive carcinoma], 3; CESC[Cervical squamous cell carcinoma and endocervical adenocarcinoma], 4; COAD[Colon adenocarcinoma], 5; GBM[Glioblastoma multiforme], 6; Glioma Low Grade, 7; HNSC[Head and Neck squamous cell carcinoma], 8; KICH[Kidney Chromophobe], 9; KIRC[Kidney renal clear cell carcinoma], 10; KIRP[Kidney renal papillary cell carcinoma], 11; LAML[Acute Myeloid Leukemia], 12; LUAD[Lung adenocarcinoma], 13; LUSC[Lung squamous cell carcinoma], 14; OV[Ovarian serous cystadenocarcinoma ], 15; PAAD[Pancreatic adenocarcinoma], 16; PRAD[Prostate adenocarcinoma], 17; SKCM[Skin Cutaneous Melanoma], 18:STAD[Stomach adenocarcinoma], 19:THCA[Thyroid carcinoma], 20:UCEC[Uterine Corpus Endometrial Carcinoma]) |
| Top |
| * We represented just top 10 SNVs. When you move the cursor on each content, you can see more deailed mutation information on the Tooltip. Those are primary_site, primary_histology, mutation(aa), pubmedID. |
| Genomic Position | Mutation(aa) | Unique sampleID count |
| chr9:139311437 | p.R92H,PMPCA | 2 |
| chr9:139309033 | p.D56N,PMPCA | 2 |
| chr9:139311657 | p.A29A | 1 |
| chr9:139306464 | p.A378T,PMPCA | 1 |
| chr9:139317663 | p.T67A | 1 |
| chr9:139309088 | p.V125V,PMPCA | 1 |
| chr9:139311661 | p.R77C | 1 |
| chr9:139306576 | p.K138N,PMPCA | 1 |
| chr9:139310781 | p.S80F | 1 |
| chr9:139312525 | p.A150T,PMPCA | 1 |
| * Copy number data were extracted from TCGA using R package TCGA-Assembler. The URLs of all public data files on TCGA DCC data server were gathered on Jan-05-2015. Function ProcessCNAData in TCGA-Assembler package was used to obtain gene-level copy number value which is calculated as the average copy number of the genomic region of a gene. |
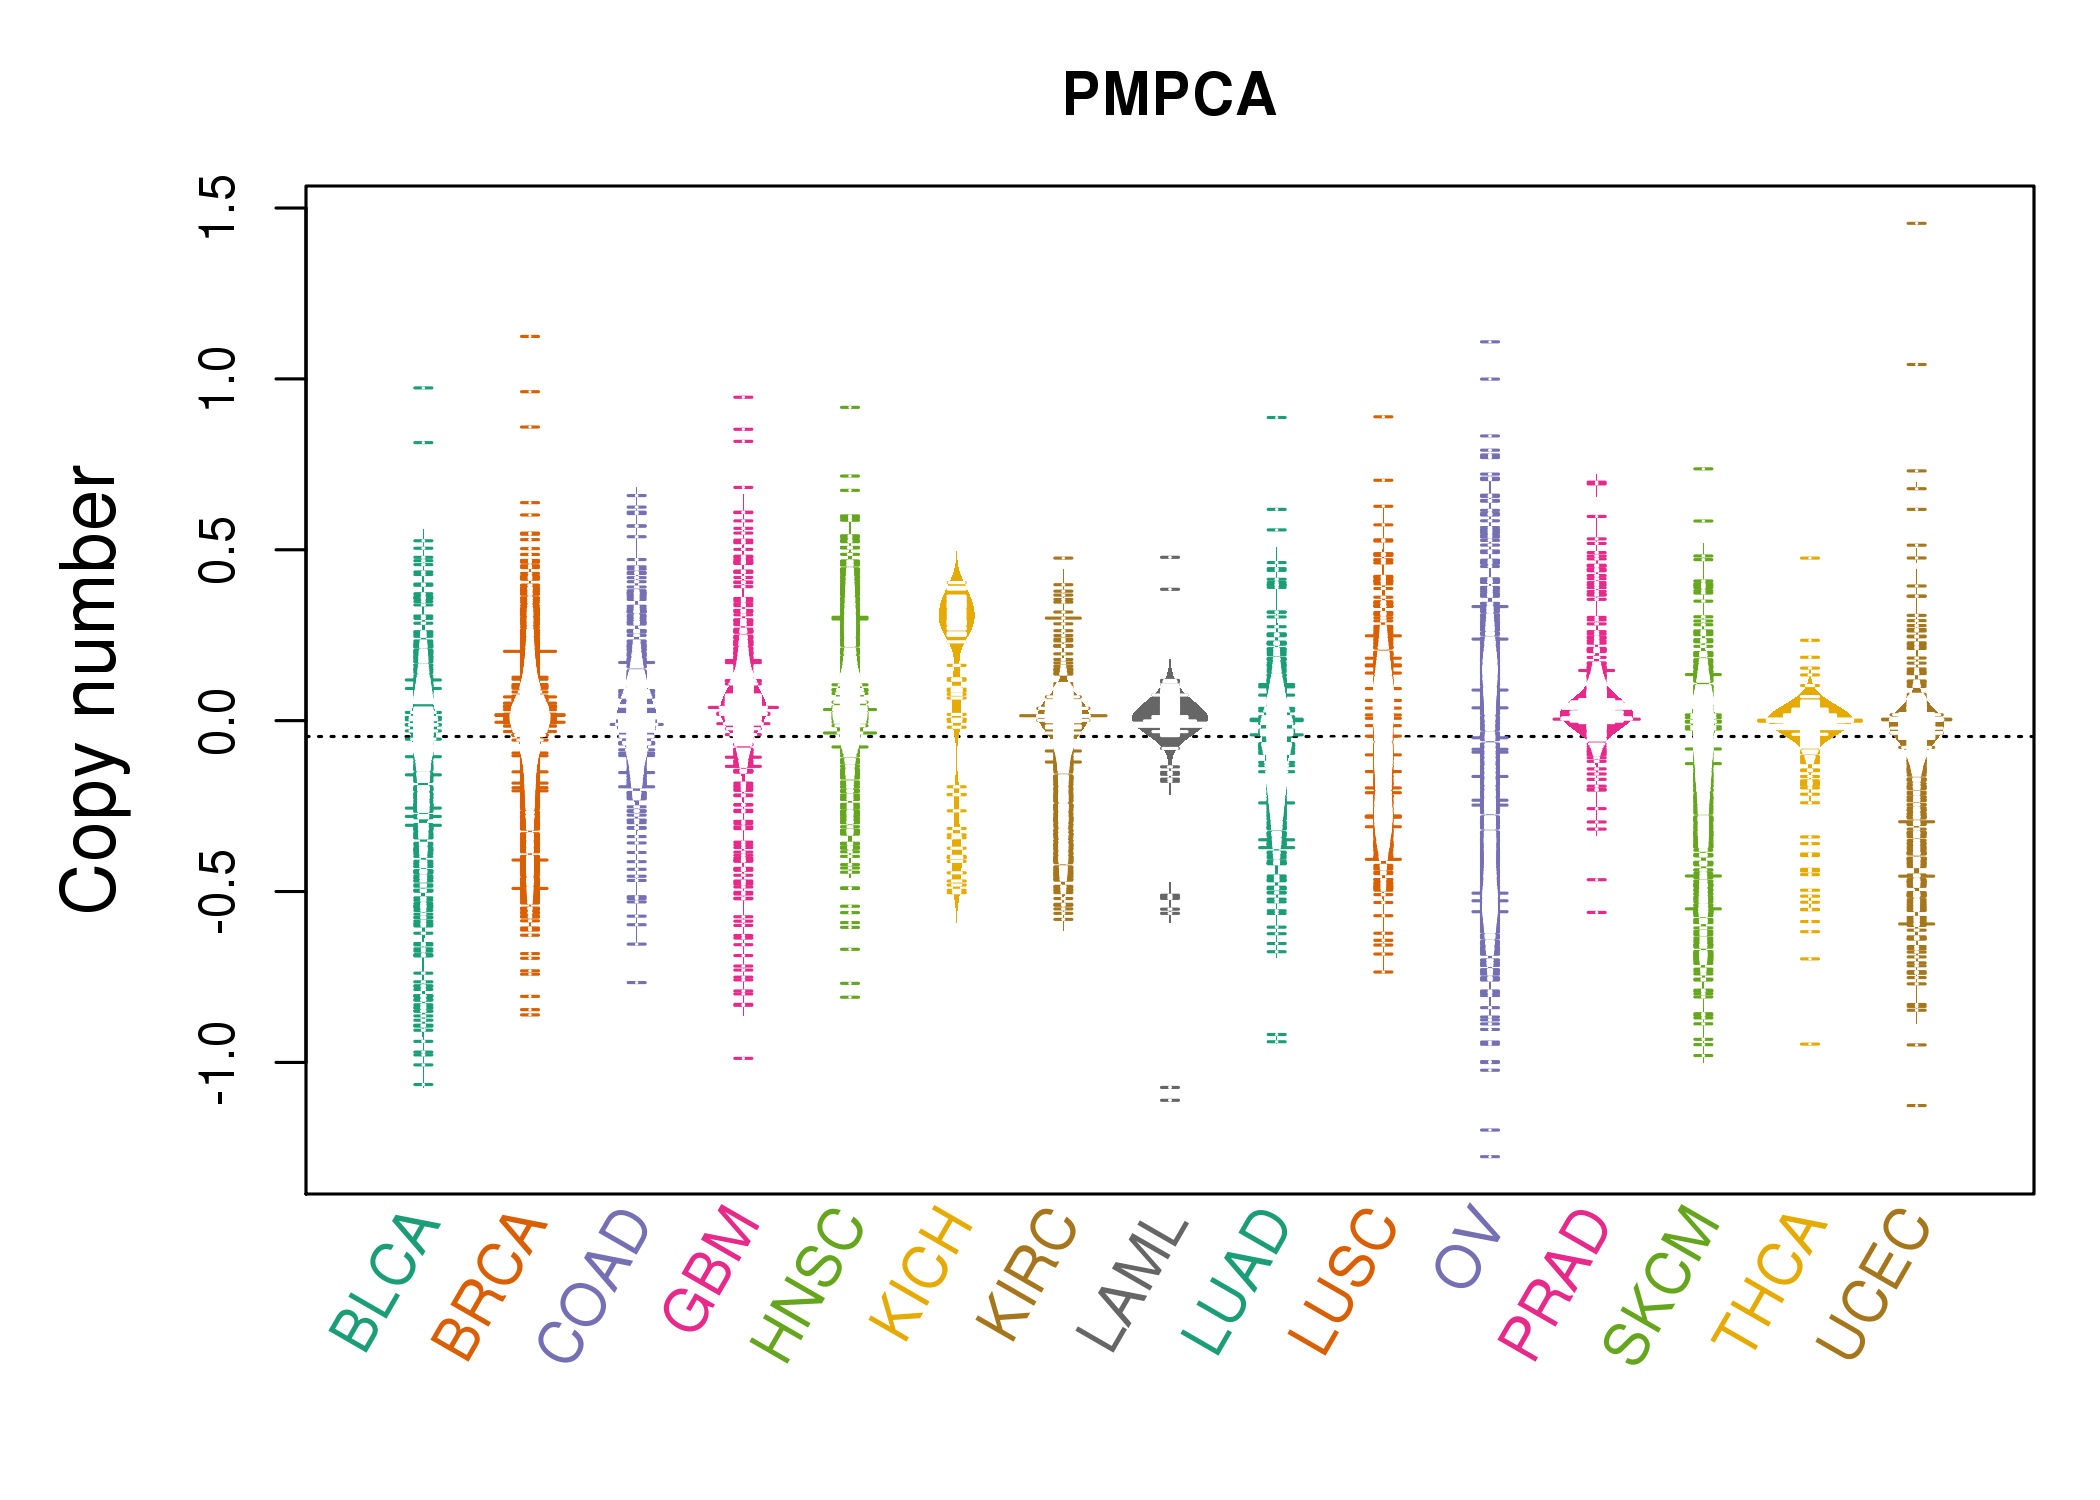 |
| cf) Tissue ID[Tissue type]: BLCA[Bladder Urothelial Carcinoma], BRCA[Breast invasive carcinoma], CESC[Cervical squamous cell carcinoma and endocervical adenocarcinoma], COAD[Colon adenocarcinoma], GBM[Glioblastoma multiforme], Glioma Low Grade, HNSC[Head and Neck squamous cell carcinoma], KICH[Kidney Chromophobe], KIRC[Kidney renal clear cell carcinoma], KIRP[Kidney renal papillary cell carcinoma], LAML[Acute Myeloid Leukemia], LUAD[Lung adenocarcinoma], LUSC[Lung squamous cell carcinoma], OV[Ovarian serous cystadenocarcinoma ], PAAD[Pancreatic adenocarcinoma], PRAD[Prostate adenocarcinoma], SKCM[Skin Cutaneous Melanoma], STAD[Stomach adenocarcinoma], THCA[Thyroid carcinoma], UCEC[Uterine Corpus Endometrial Carcinoma] |
| Top |
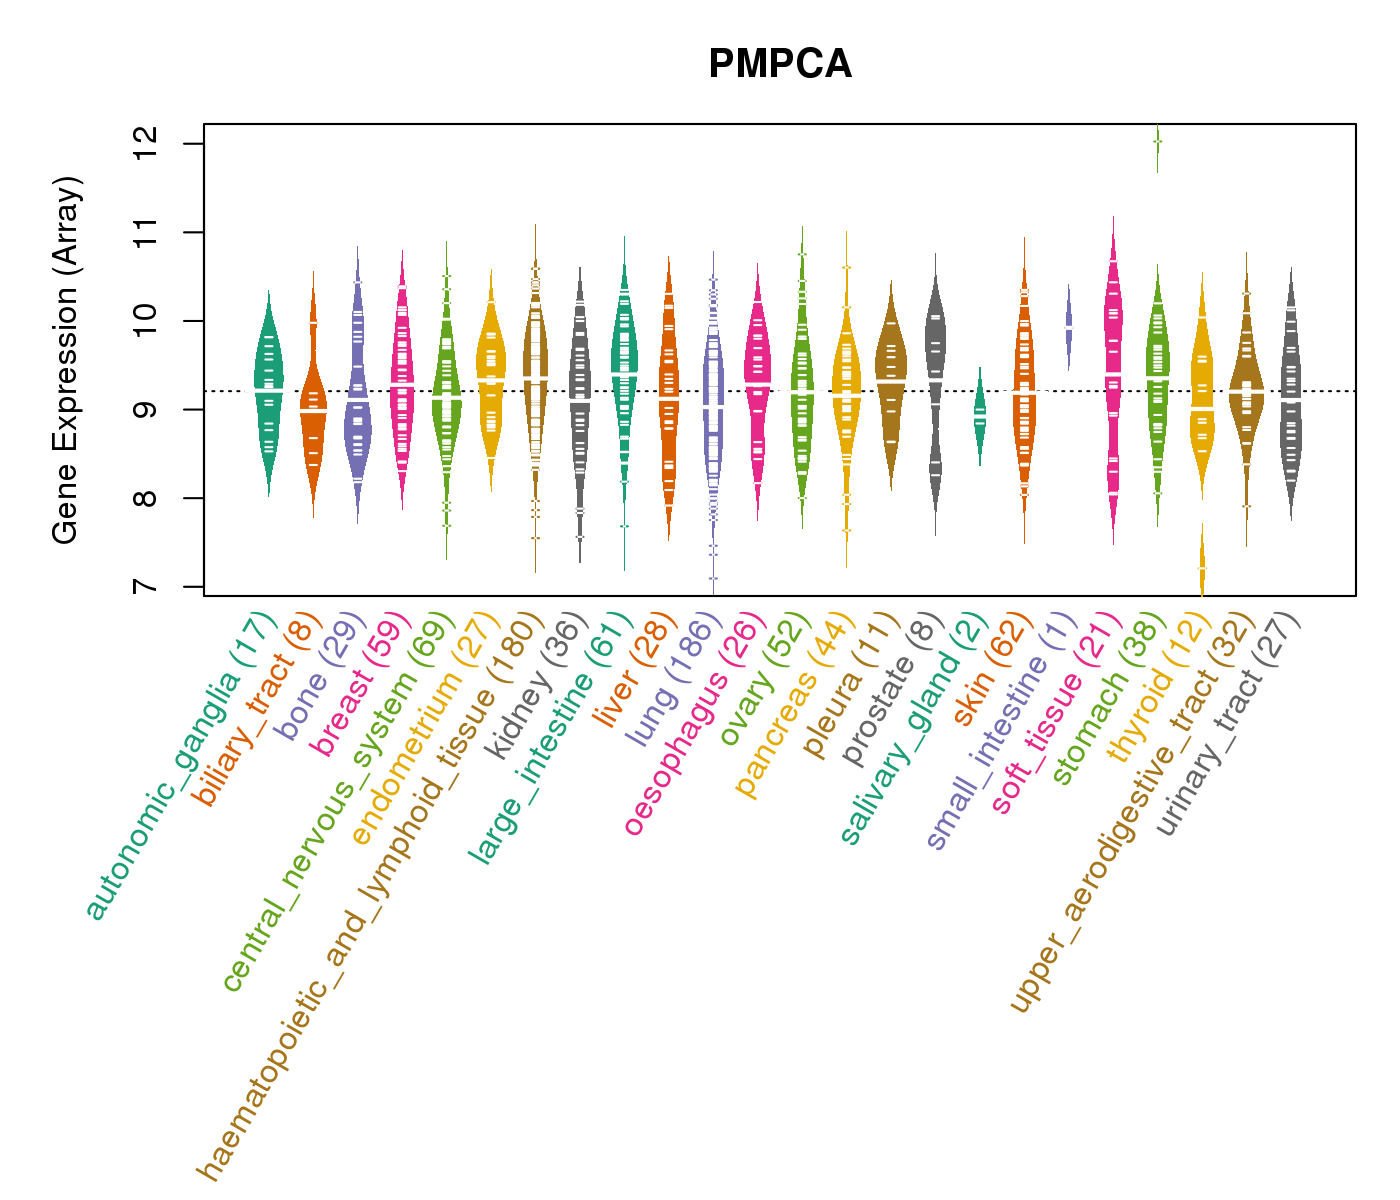
| Gene Expression for PMPCA |
| * CCLE gene expression data were extracted from CCLE_Expression_Entrez_2012-10-18.res: Gene-centric RMA-normalized mRNA expression data. |
 |
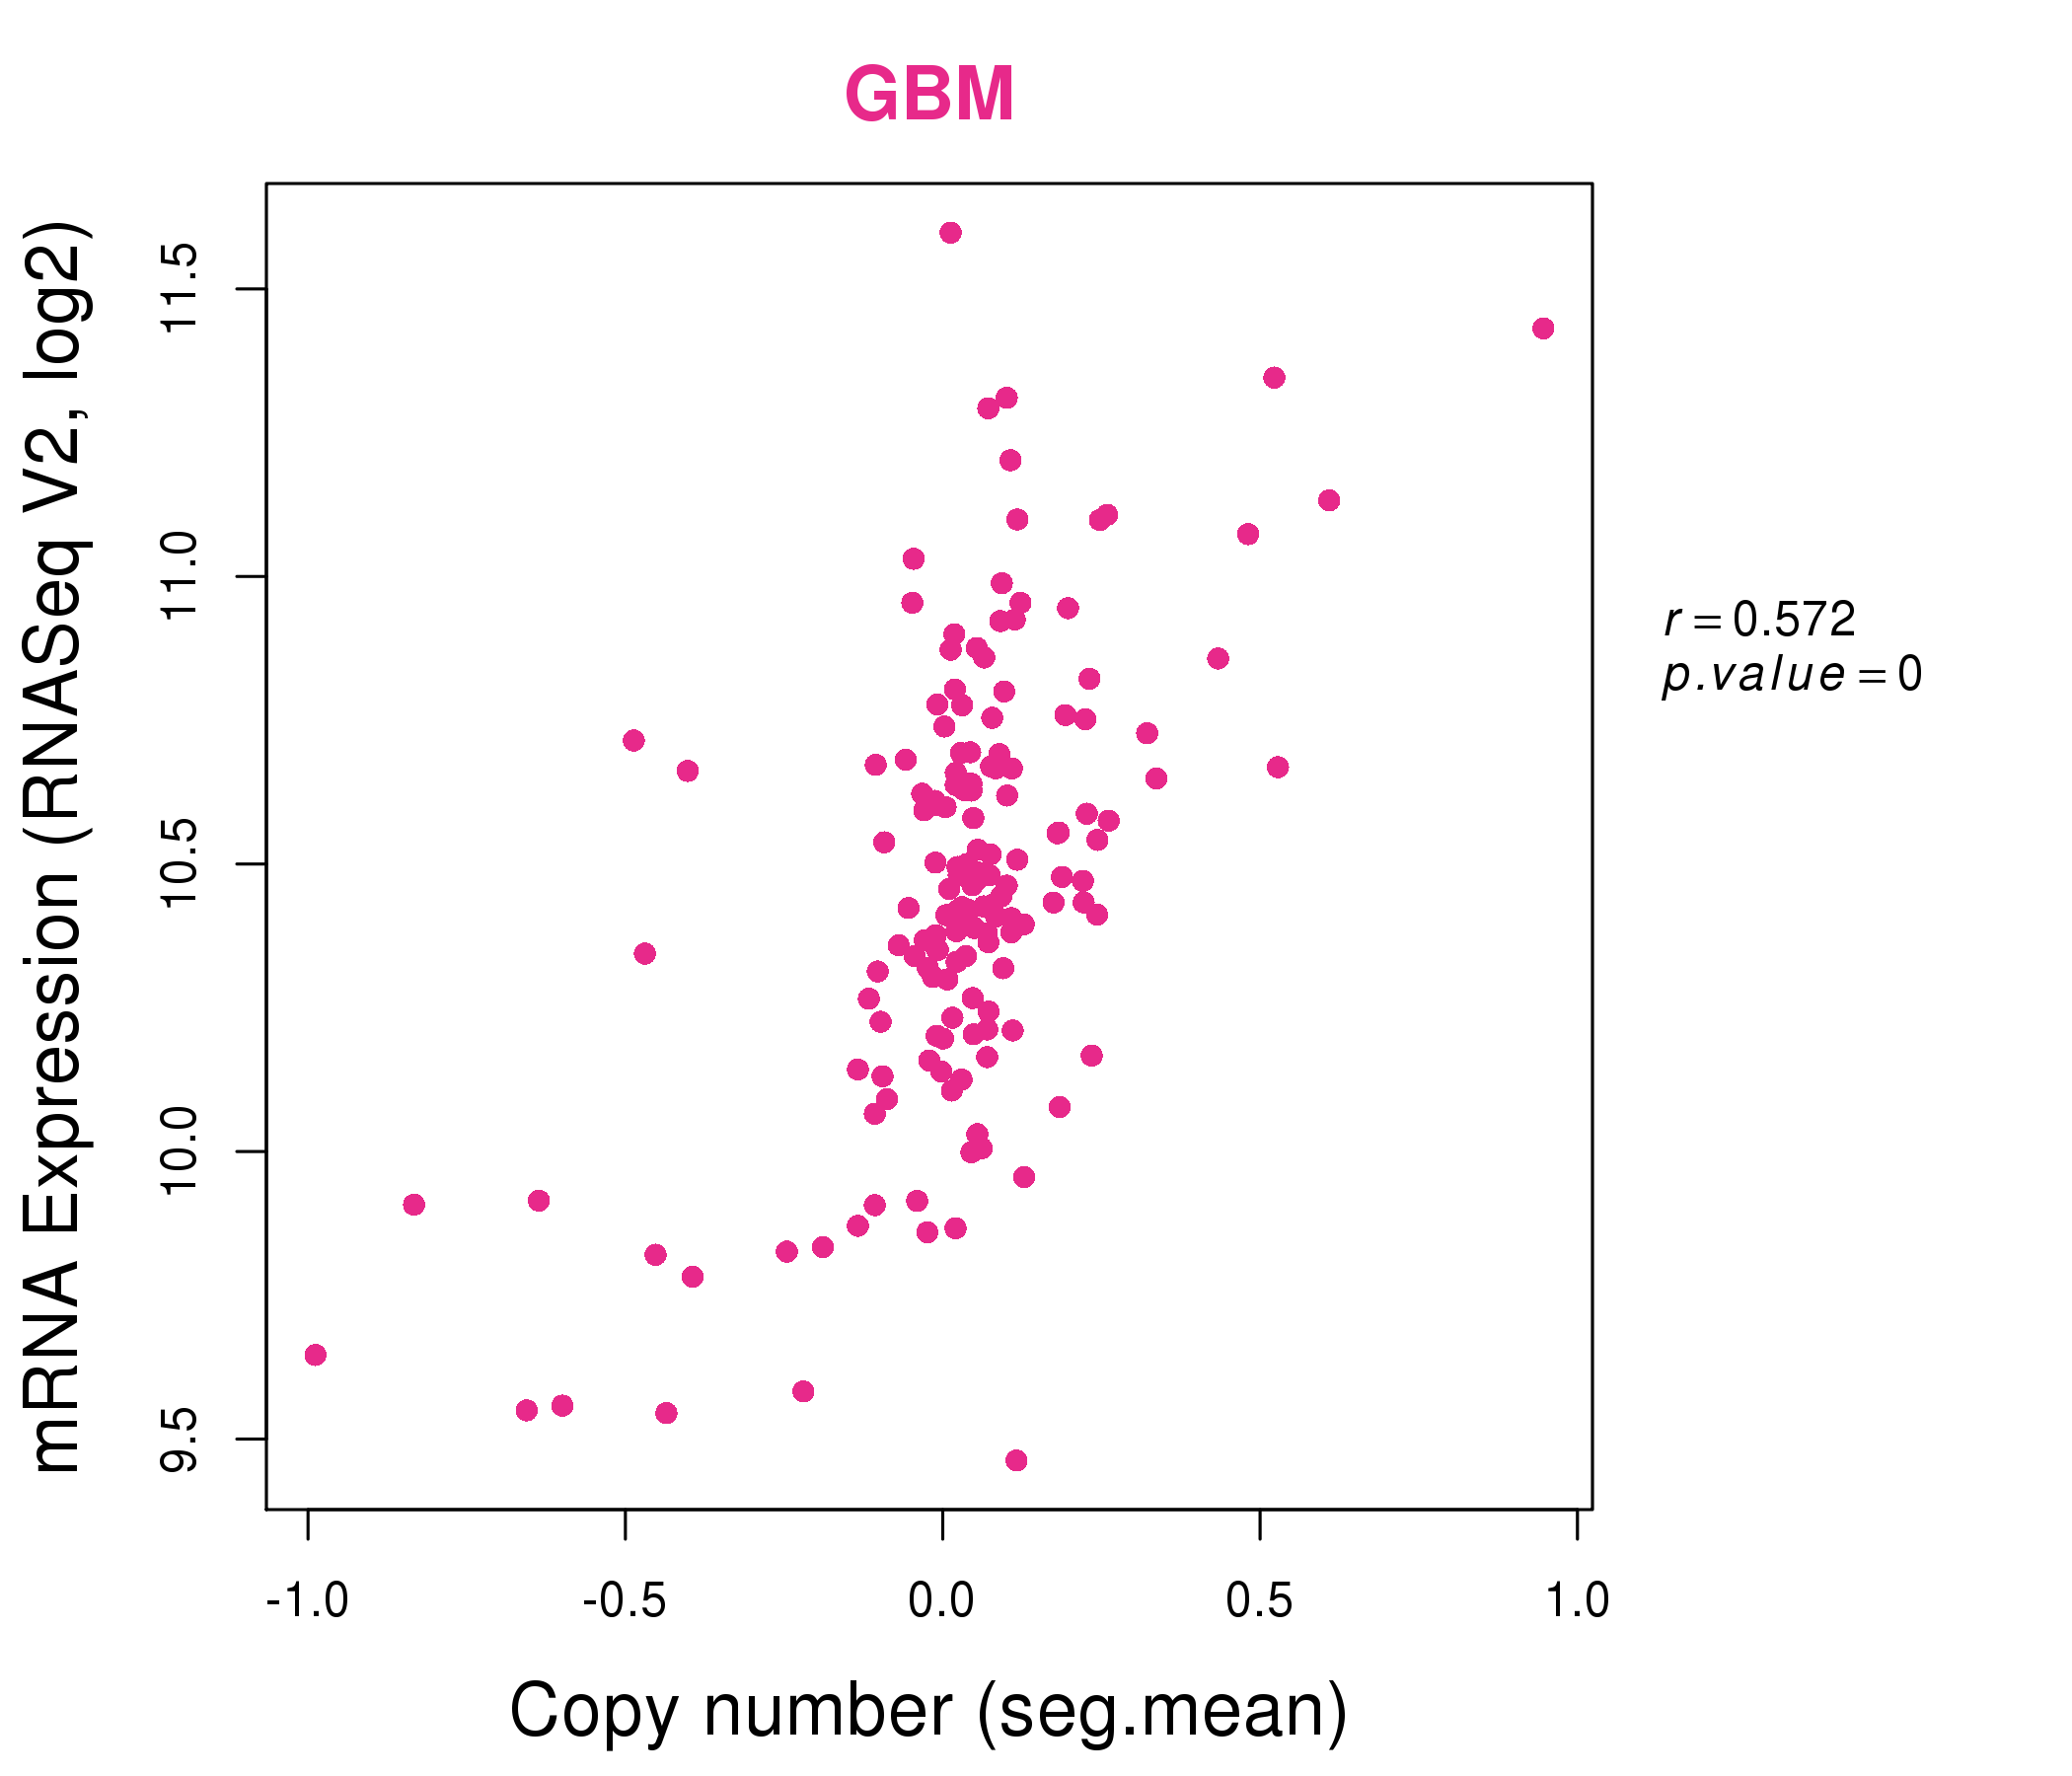
| * Normalized gene expression data of RNASeqV2 was extracted from TCGA using R package TCGA-Assembler. The URLs of all public data files on TCGA DCC data server were gathered at Jan-05-2015. Only eight cancer types have enough normal control samples for differential expression analysis. (t test, adjusted p<0.05 (using Benjamini-Hochberg FDR)) |
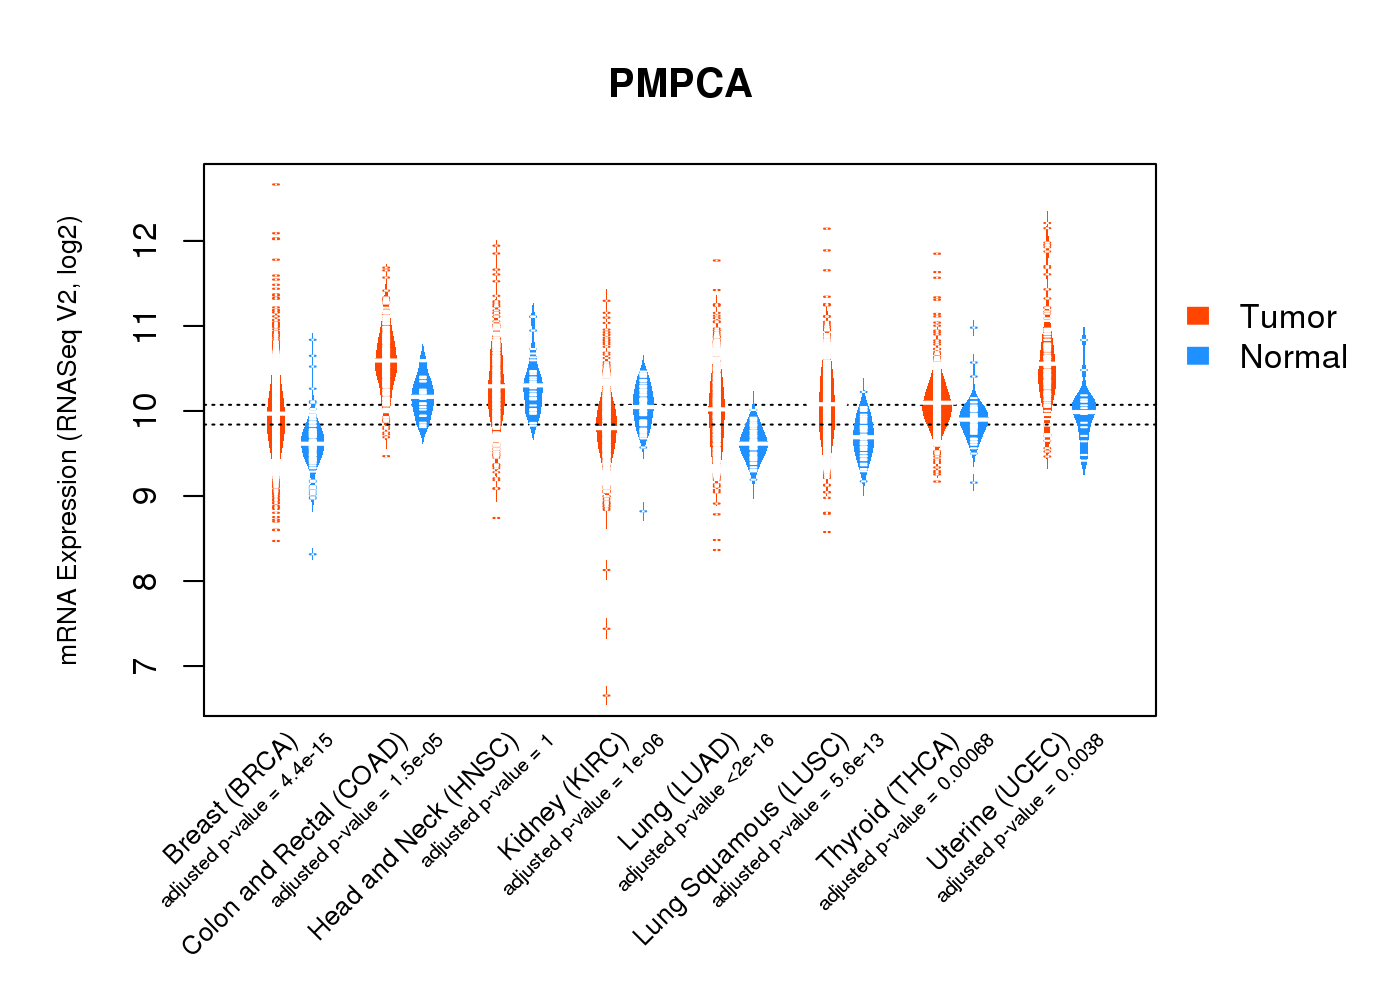 |
| Top |
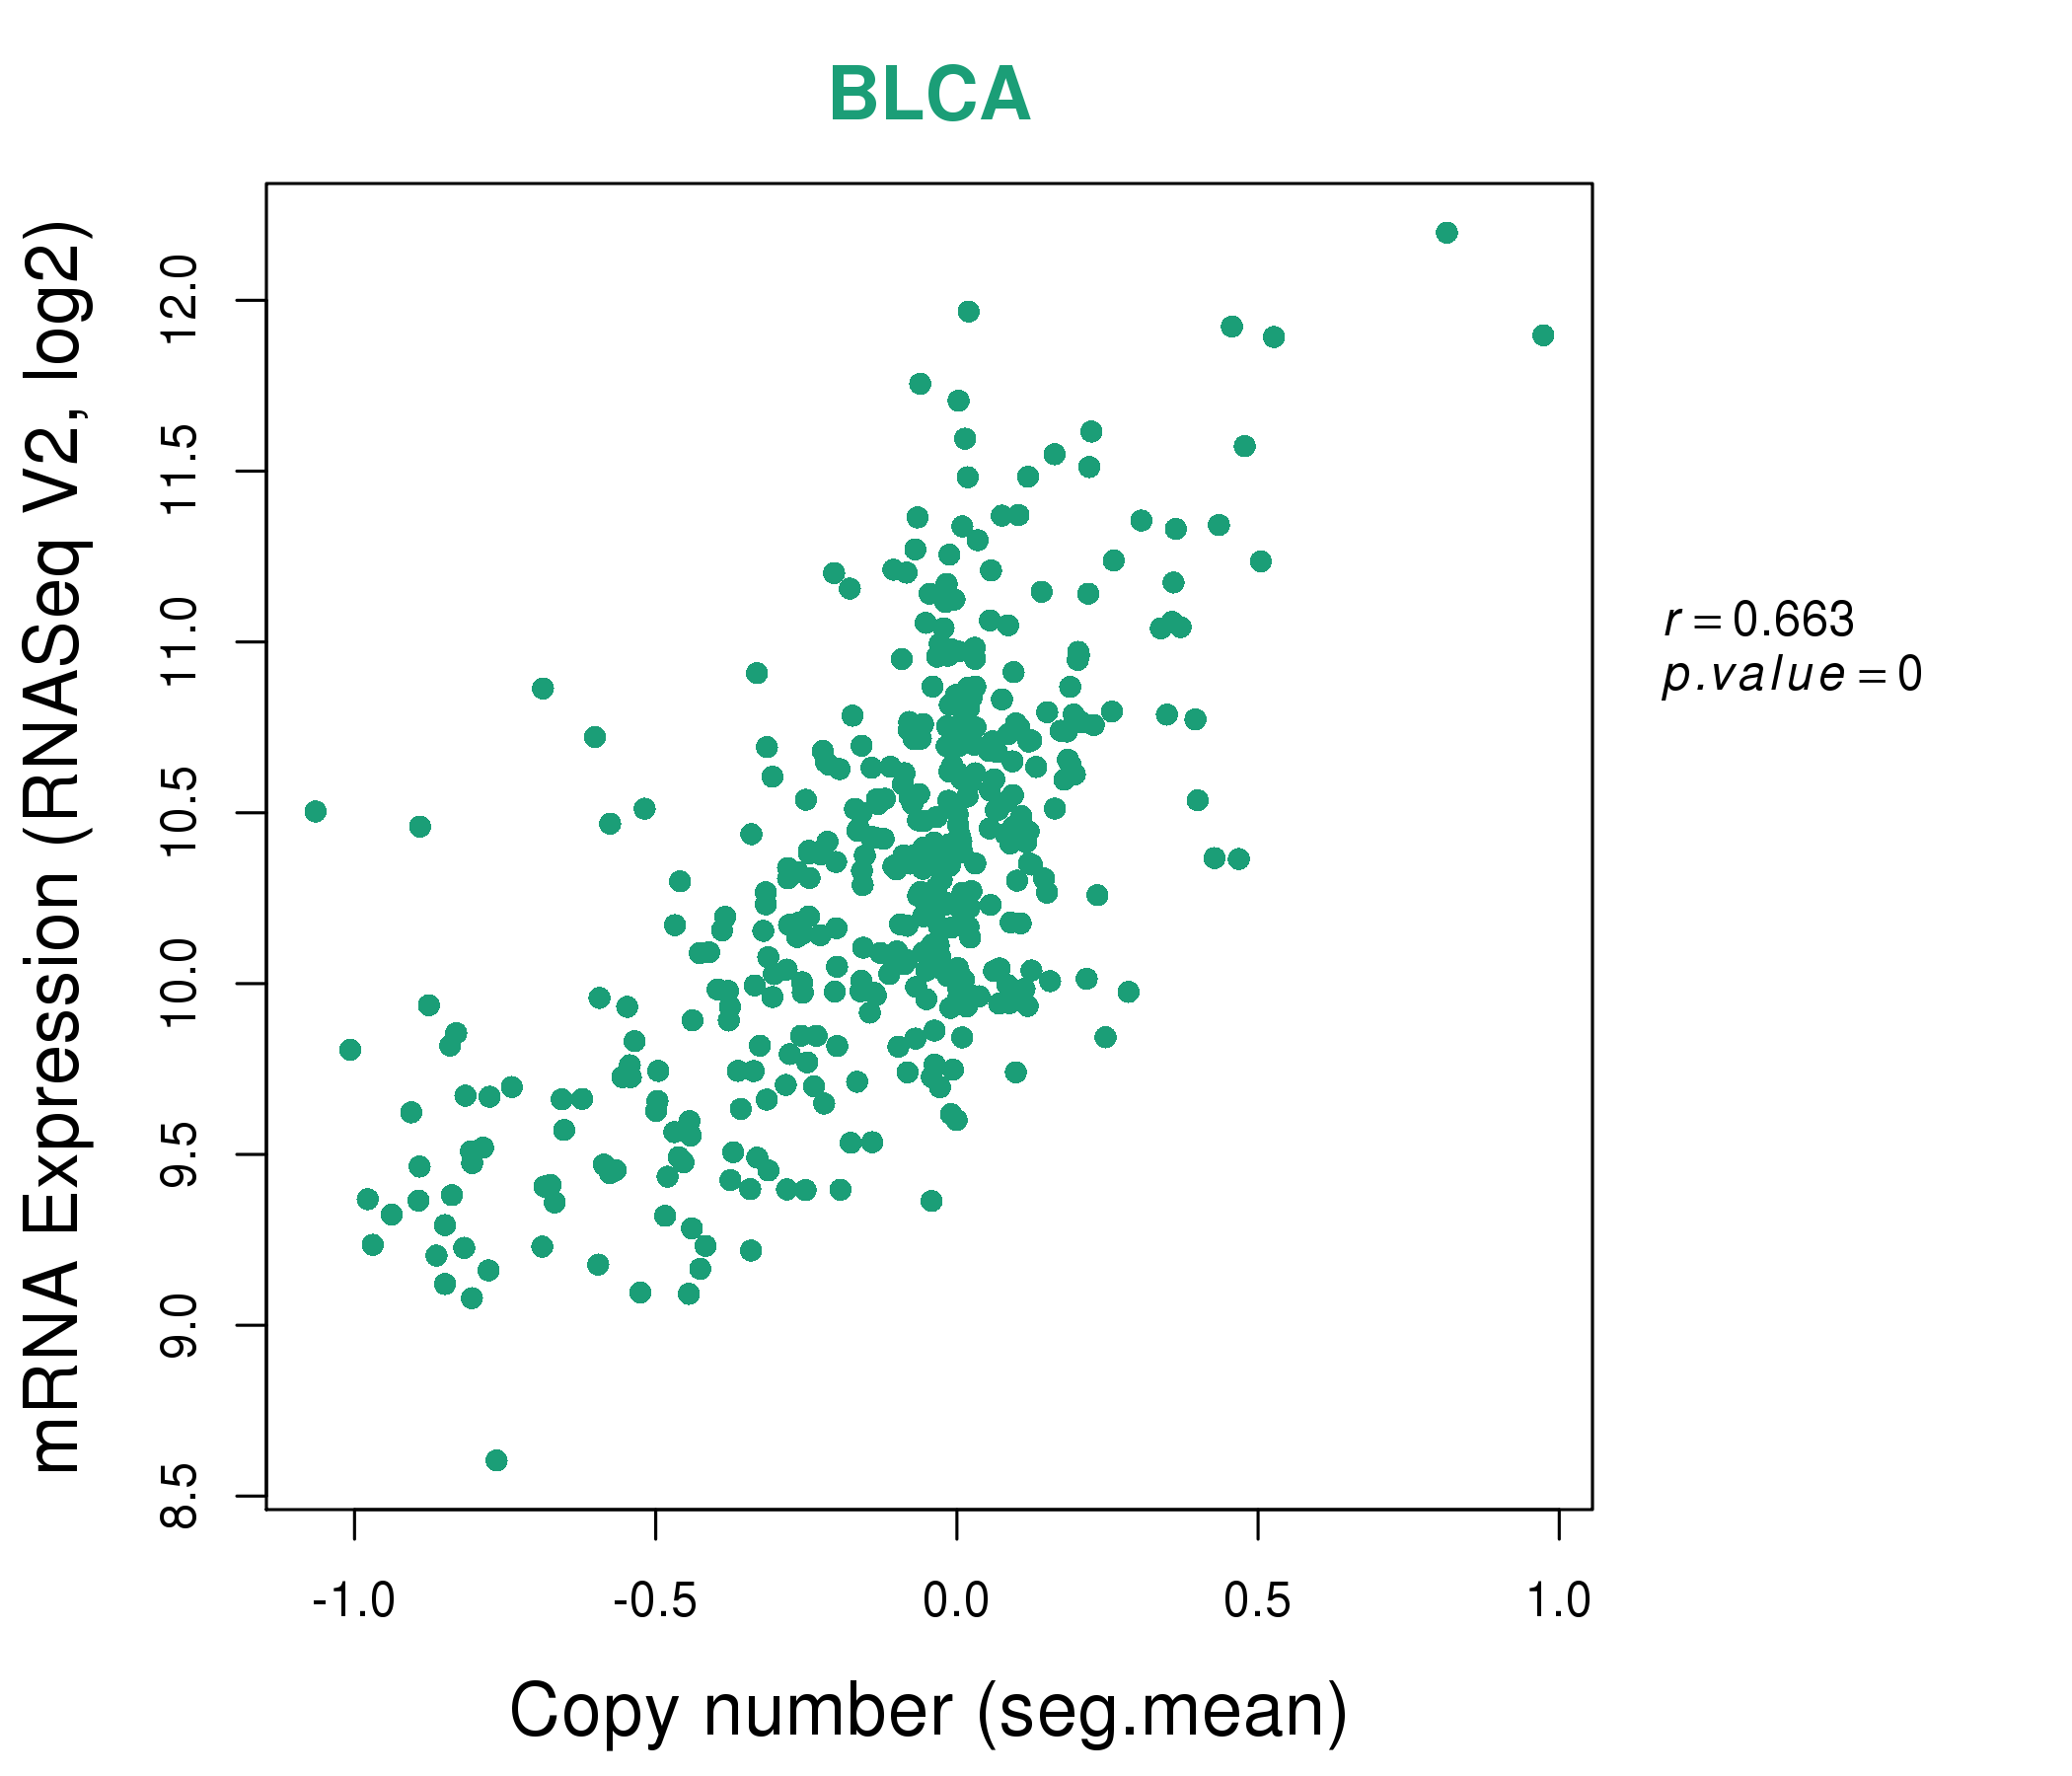
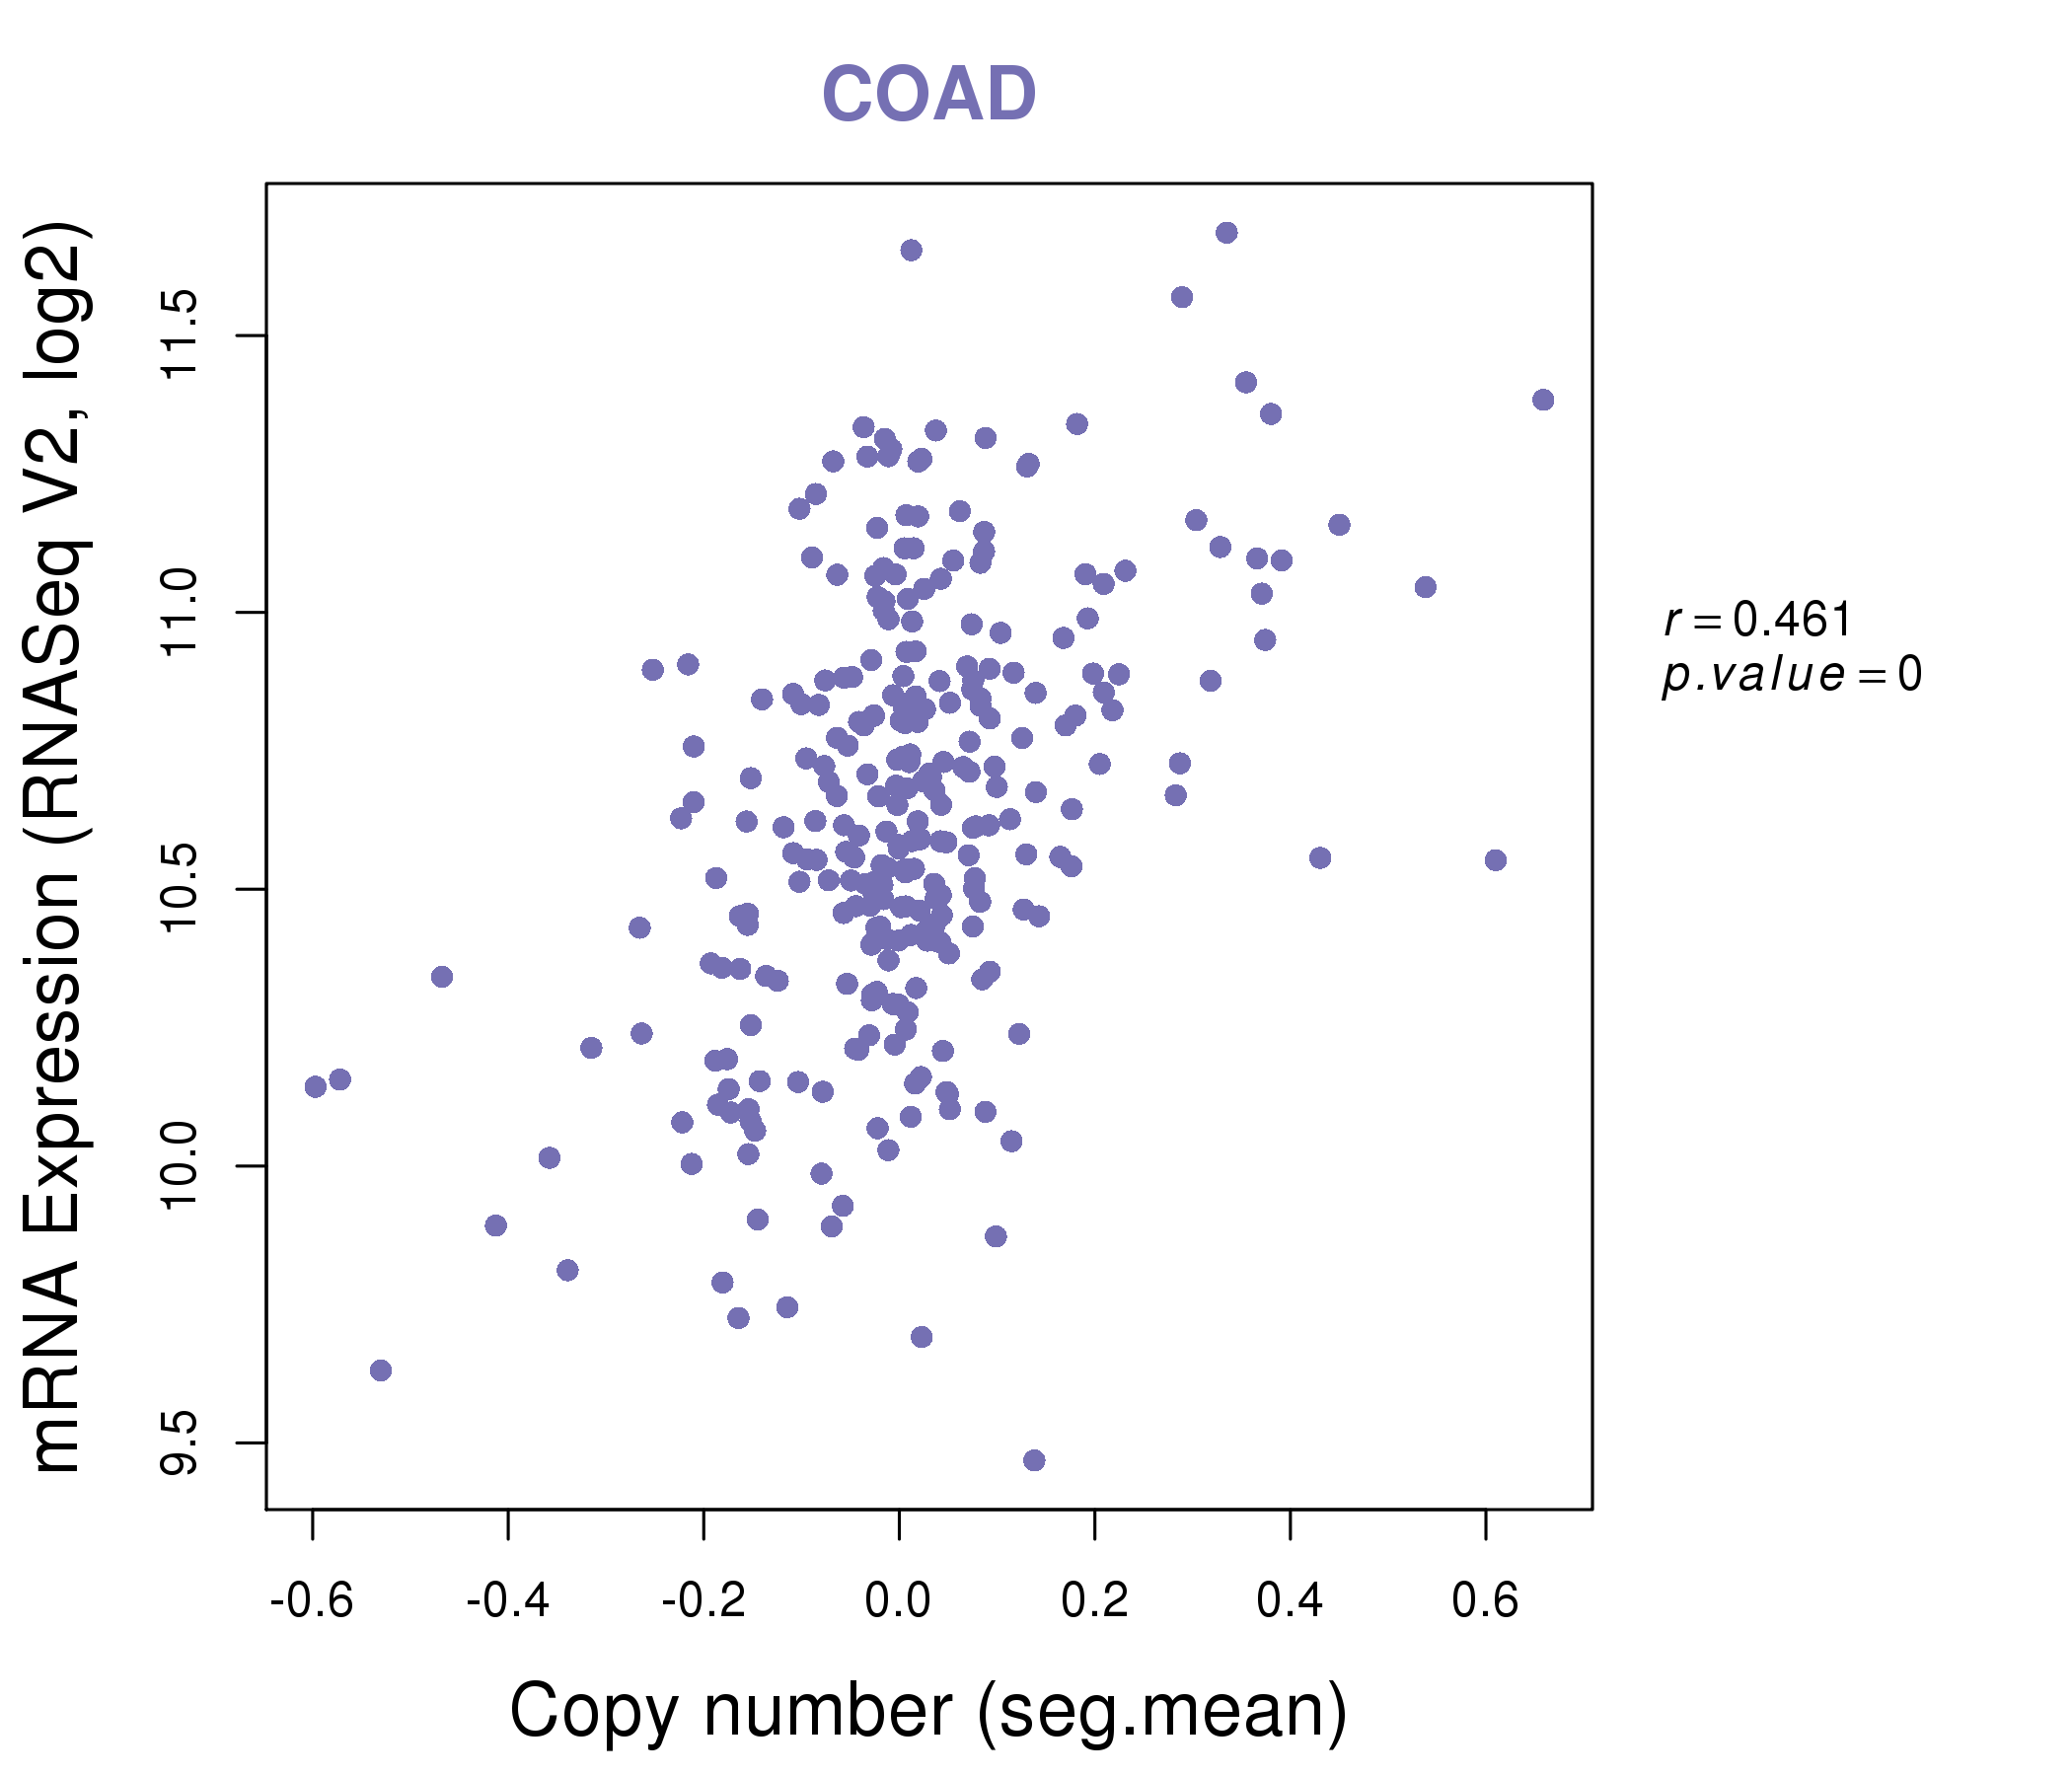
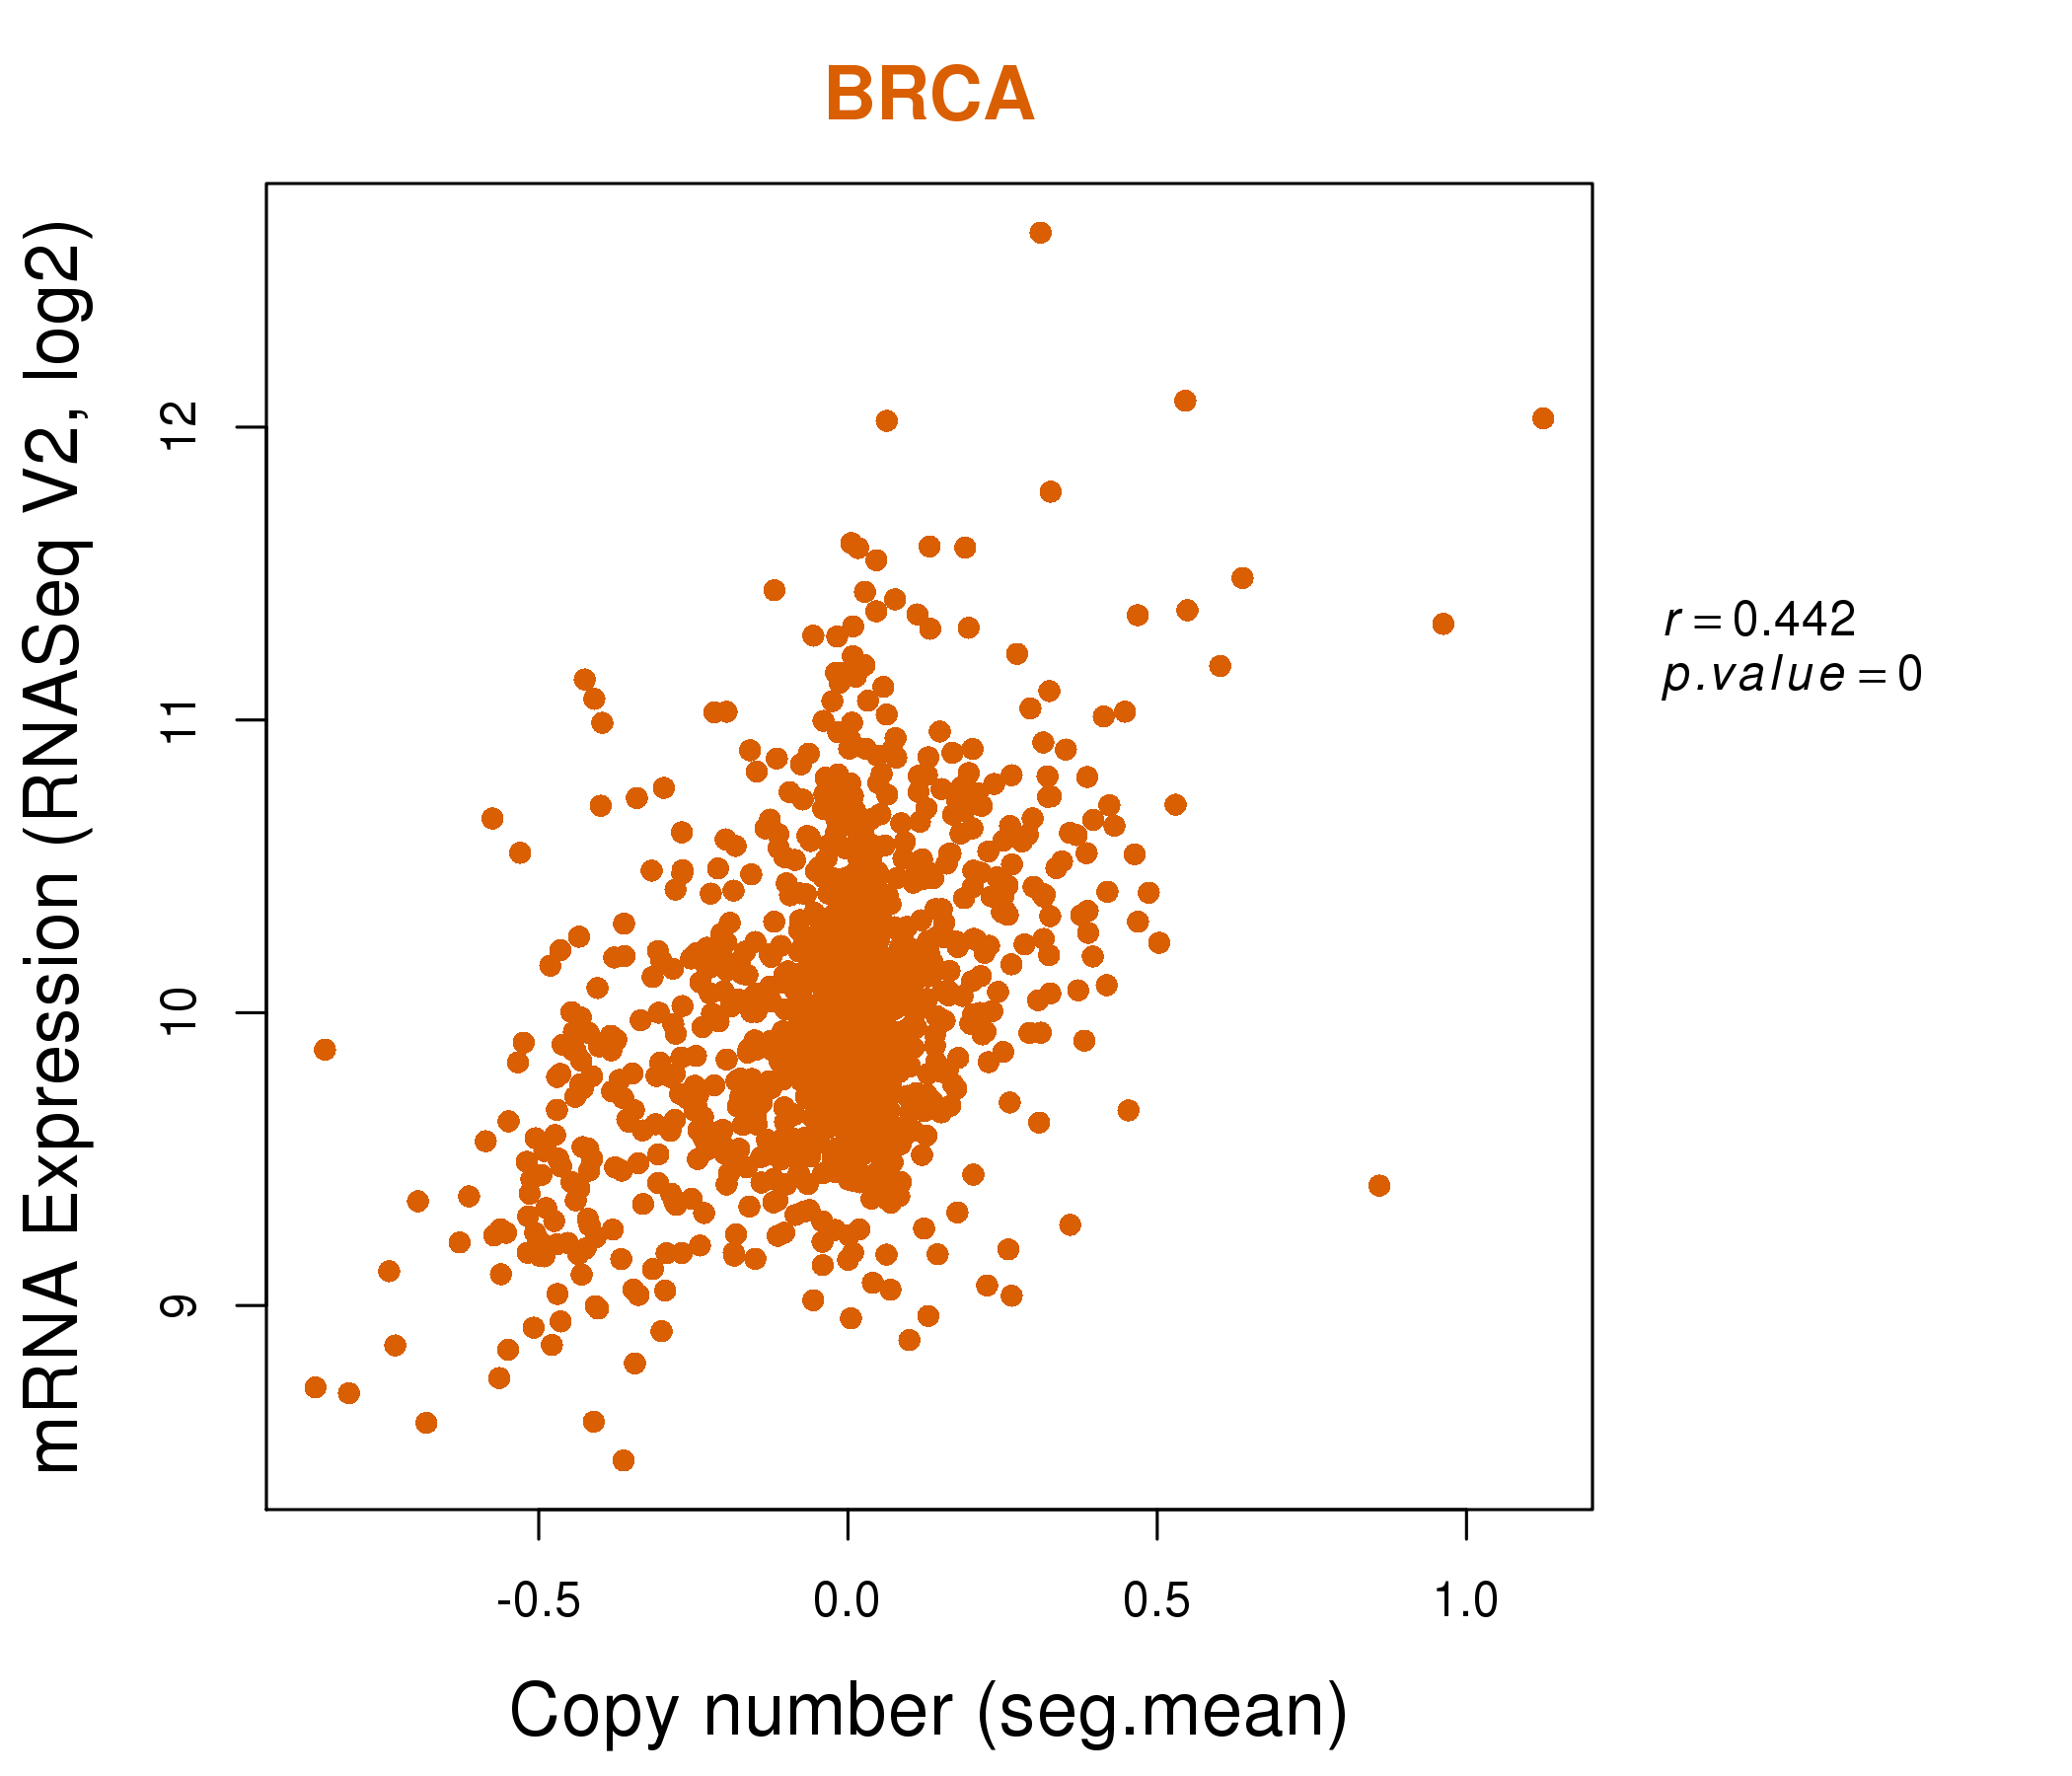
| * This plots show the correlation between CNV and gene expression. |
: Open all plots for all cancer types
 |
|
 |
|
| Top |
| Gene-Gene Network Information |
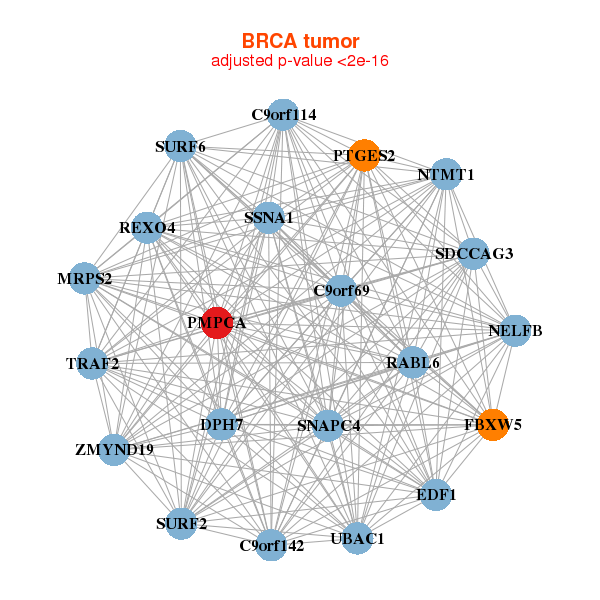
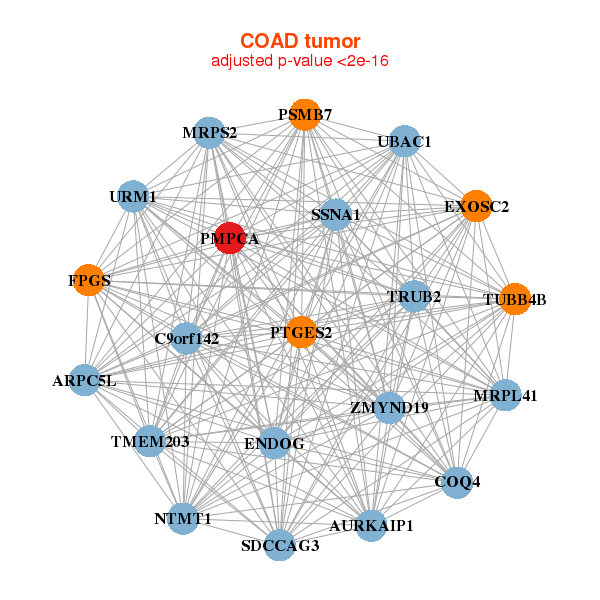
| * Co-Expression network figures were drawn using R package igraph. Only the top 20 genes with the highest correlations were shown. Red circle: input gene, orange circle: cell metabolism gene, sky circle: other gene |
: Open all plots for all cancer types
 |
|
| C9orf114,C9orf142,C9orf69,RABL6,NELFB,EDF1,FBXW5, NTMT1,MRPS2,PMPCA,PTGES2,REXO4,SDCCAG3,SNAPC4, SSNA1,SURF2,SURF6,TRAF2,UBAC1,DPH7,ZMYND19 | ADRM1,DHPS,ECSIT,FAM195A,FASTK,HSF1,MAP2K2, NTMT1,MRPL12,MRPL38,NDUFV1,NSUN5,PMPCA,PTGES2, RNMTL1,SDR39U1,TBRG4,THAP4,TIMM17B,TIMM44,TMED1 |
 |
|
| ARPC5L,AURKAIP1,C9orf142,COQ4,ENDOG,EXOSC2,FPGS, NTMT1,MRPL41,MRPS2,PMPCA,PSMB7,PTGES2,SDCCAG3, SSNA1,TMEM203,TRUB2,TUBB4B,UBAC1,URM1,ZMYND19 | C7orf26,CECR5,DDX28,ELK1,FBXW9,DANCR,LOC348926, MARS2,MRPL12,MRPL4,MRPS12,MRPS2,PMPCA,QTRT1, RCL1,RNMTL1,SFXN4,TIMM13,TRIM27,WDR74,ZMYND19 |
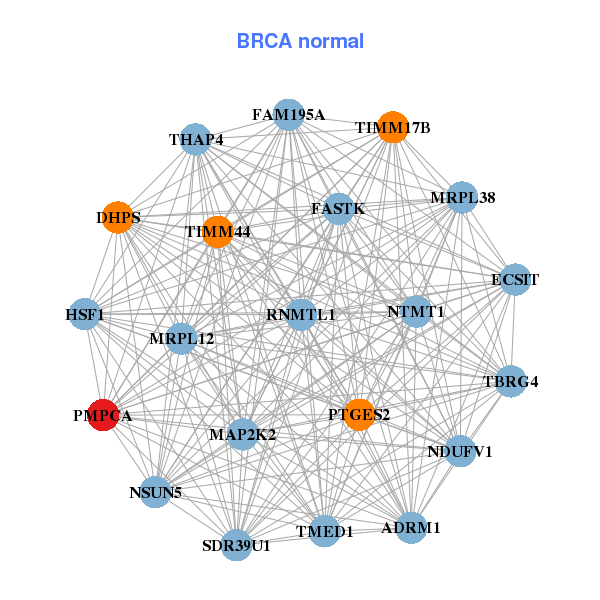
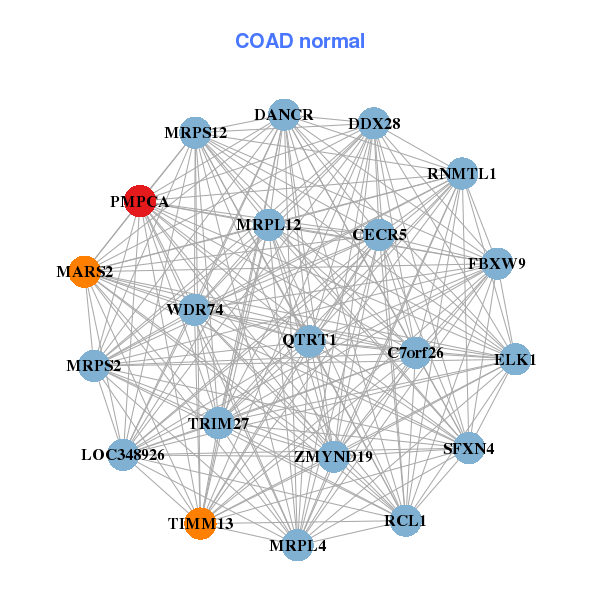
| * Co-Expression network figures were drawn using R package igraph. Only the top 20 genes with the highest correlations were shown. Red circle: input gene, orange circle: cell metabolism gene, sky circle: other gene |
: Open all plots for all cancer types
| Top |
: Open all interacting genes' information including KEGG pathway for all interacting genes from DAVID
| Top |
| Pharmacological Information for PMPCA |
| There's no related Drug. |
| Top |
| Cross referenced IDs for PMPCA |
| * We obtained these cross-references from Uniprot database. It covers 150 different DBs, 18 categories. http://www.uniprot.org/help/cross_references_section |
: Open all cross reference information
|
Copyright © 2016-Present - The Univsersity of Texas Health Science Center at Houston @ |