|
||||||||||||||||||||||||||||||||||||||||||||||||||||||||||||||||||||||||||||||||||||||||||||||||||||||||||||||||||||||||||||||||||||||||||||||||||||||||||||||||||||||||||||||||||||||||||||||||||||||||||||||||||||||||||||||||||||||||||||||||||||||||||||||||||||||||||||||||||||||||||||||||||||||||||||||||||||||||||
| |
| Phenotypic Information (metabolism pathway, cancer, disease, phenome) |
| |
| |
| Gene-Gene Network Information: Co-Expression Network, Interacting Genes & KEGG |
| |
|


| Gene Summary for NUP210 |
| Basic gene info. | Gene symbol | NUP210 |
| Gene name | nucleoporin 210kDa | |
| Synonyms | GP210|POM210 | |
| Cytomap | UCSC genome browser: 3p25.1 | |
| Genomic location | chr3 :13357736-13461809 | |
| Type of gene | protein-coding | |
| RefGenes | NM_024923.3, | |
| Ensembl id | ENSG00000132182 | |
| Description | nuclear envelope pore membrane protein POM 210nuclear pore membrane glycoprotein 210nuclear pore protein gp210nucleoporin Nup210pore membrane protein of 210 kDa | |
| Modification date | 20141207 | |
| dbXrefs | MIM : 607703 | |
| HGNC : HGNC | ||
| Ensembl : ENSG00000132182 | ||
| HPRD : 06368 | ||
| Vega : OTTHUMG00000157268 | ||
| Protein | UniProt: Q8TEM1 go to UniProt's Cross Reference DB Table | |
| Expression | CleanEX: HS_NUP210 | |
| BioGPS: 23225 | ||
| Gene Expression Atlas: ENSG00000132182 | ||
| The Human Protein Atlas: ENSG00000132182 | ||
| Pathway | NCI Pathway Interaction Database: NUP210 | |
| KEGG: NUP210 | ||
| REACTOME: NUP210 | ||
| ConsensusPathDB | ||
| Pathway Commons: NUP210 | ||
| Metabolism | MetaCyc: NUP210 | |
| HUMANCyc: NUP210 | ||
| Regulation | Ensembl's Regulation: ENSG00000132182 | |
| miRBase: chr3 :13,357,736-13,461,809 | ||
| TargetScan: NM_024923 | ||
| cisRED: ENSG00000132182 | ||
| Context | iHOP: NUP210 | |
| cancer metabolism search in PubMed: NUP210 | ||
| UCL Cancer Institute: NUP210 | ||
| Assigned class in ccmGDB | B - This gene belongs to cancer gene. | |
| Top |
| Phenotypic Information for NUP210(metabolism pathway, cancer, disease, phenome) |
| Cancer | CGAP: NUP210 |
| Familial Cancer Database: NUP210 | |
| * This gene is included in those cancer gene databases. |
|
|
|
|
|
| . | ||||||||||||||||||||||||||||||||||||||||||||||||||||||||||||||||||||||||||||||||||||||||||||||||||||||||||||||||||||||||||||||||||||||||||||||||||||||||||||||||||||||||||||||||||||||||||||||||||||||||||||||||||||||||||||||||||||||||||||||||||||||||||||||||||||||||||||||||||||||||||||||||||||||||||||||||||||
Oncogene 1 | Significant driver gene in | |||||||||||||||||||||||||||||||||||||||||||||||||||||||||||||||||||||||||||||||||||||||||||||||||||||||||||||||||||||||||||||||||||||||||||||||||||||||||||||||||||||||||||||||||||||||||||||||||||||||||||||||||||||||||||||||||||||||||||||||||||||||||||||||||||||||||||||||||||||||||||||||||||||||||||||||||||||||||
| cf) number; DB name 1 Oncogene; http://nar.oxfordjournals.org/content/35/suppl_1/D721.long, 2 Tumor Suppressor gene; https://bioinfo.uth.edu/TSGene/, 3 Cancer Gene Census; http://www.nature.com/nrc/journal/v4/n3/abs/nrc1299.html, 4 CancerGenes; http://nar.oxfordjournals.org/content/35/suppl_1/D721.long, 5 Network of Cancer Gene; http://ncg.kcl.ac.uk/index.php, 1Therapeutic Vulnerabilities in Cancer; http://cbio.mskcc.org/cancergenomics/statius/ |
| REACTOME_METABOLISM_OF_NON_CODING_RNA REACTOME_METABOLISM_OF_RNA REACTOME_METABOLISM_OF_CARBOHYDRATES | |
| OMIM | 607703; gene. |
| Orphanet | |
| Disease | KEGG Disease: NUP210 |
| MedGen: NUP210 (Human Medical Genetics with Condition) | |
| ClinVar: NUP210 | |
| Phenotype | MGI: NUP210 (International Mouse Phenotyping Consortium) |
| PhenomicDB: NUP210 | |
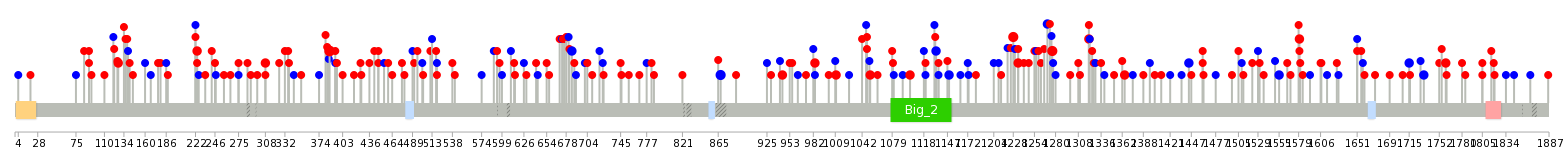
| Mutations for NUP210 |
| * Under tables are showing count per each tissue to give us broad intuition about tissue specific mutation patterns.You can go to the detailed page for each mutation database's web site. |
| There's no structural variation information in COSMIC data for this gene. |
| * From mRNA Sanger sequences, Chitars2.0 arranged chimeric transcripts. This table shows NUP210 related fusion information. |
| ID | Head Gene | Tail Gene | Accession | Gene_a | qStart_a | qEnd_a | Chromosome_a | tStart_a | tEnd_a | Gene_a | qStart_a | qEnd_a | Chromosome_a | tStart_a | tEnd_a |
| AW801070 | SURF2 | 9 | 71 | 9 | 136226834 | 136226896 | NUP210 | 57 | 159 | 3 | 13390185 | 13390287 | |
| AW800948 | SURF2 | 11 | 78 | 9 | 136226834 | 136226901 | NUP210 | 59 | 161 | 3 | 13390185 | 13390287 | |
| AW867470 | MALAT1 | 1 | 401 | 11 | 65268273 | 65268673 | NUP210 | 399 | 543 | 3 | 13367381 | 13368810 | |
| BF814512 | NUP210 | 41 | 487 | 3 | 13393247 | 13395161 | RPS4X | 486 | 544 | X | 71493766 | 71493824 | |
| BF331537 | NUP210 | 13 | 115 | 3 | 13392819 | 13392920 | FBXO4 | 107 | 317 | 5 | 41926160 | 41926370 | |
| BE073326 | NUP210 | 6 | 114 | 3 | 13392811 | 13392920 | FBXO4 | 106 | 316 | 5 | 41926160 | 41926370 | |
| BE073423 | NUP210 | 3 | 110 | 3 | 13392813 | 13392920 | FBXO4 | 102 | 312 | 5 | 41926160 | 41926370 | |
| BI047863 | CASP10 | 35 | 215 | 2 | 202082858 | 202083038 | NUP210 | 202 | 271 | 3 | 13372002 | 13372071 | |
| Top |
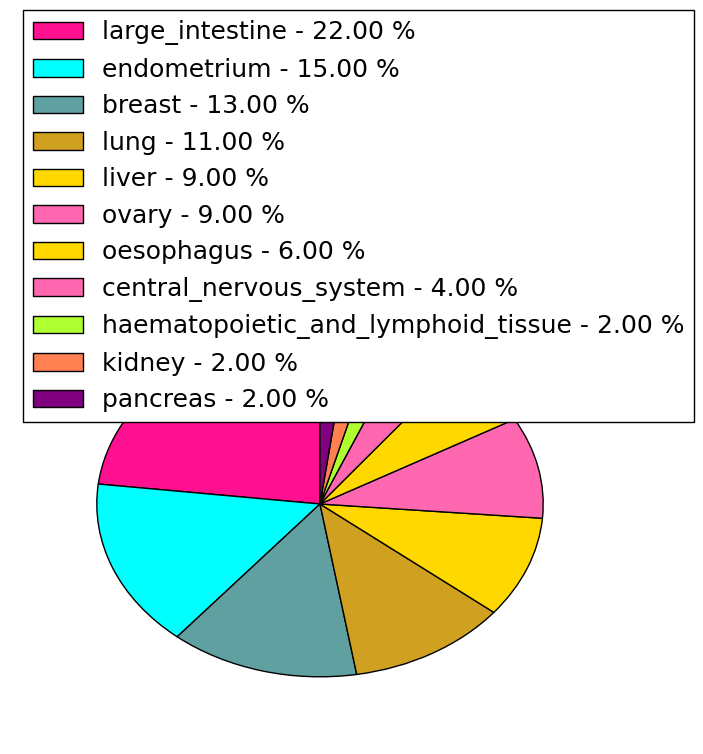
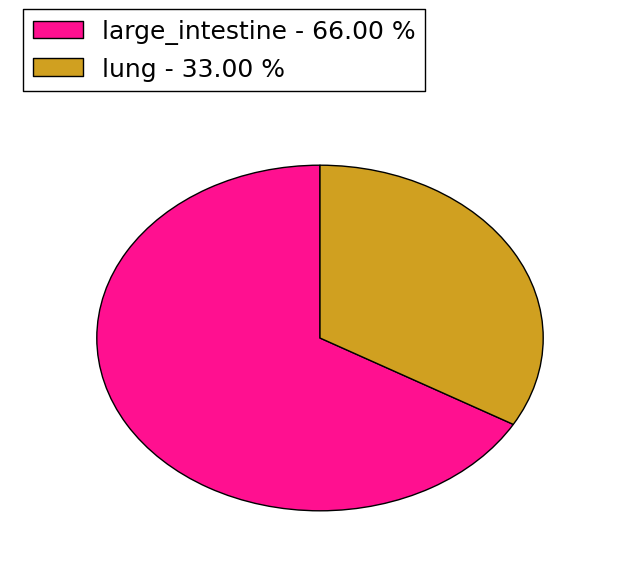
| Mutation type/ Tissue ID | brca | cns | cerv | endome | haematopo | kidn | Lintest | liver | lung | ns | ovary | pancre | prost | skin | stoma | thyro | urina | |||
| Total # sample | 2 | 1 | 3 | |||||||||||||||||
| GAIN (# sample) | 1 | 1 | 3 | |||||||||||||||||
| LOSS (# sample) | 1 |
| cf) Tissue ID; Tissue type (1; Breast, 2; Central_nervous_system, 3; Cervix, 4; Endometrium, 5; Haematopoietic_and_lymphoid_tissue, 6; Kidney, 7; Large_intestine, 8; Liver, 9; Lung, 10; NS, 11; Ovary, 12; Pancreas, 13; Prostate, 14; Skin, 15; Stomach, 16; Thyroid, 17; Urinary_tract) |
| Top |
|
 |
| Top |
| Stat. for Non-Synonymous SNVs (# total SNVs=129) | (# total SNVs=44) |
 |  |
(# total SNVs=3) | (# total SNVs=0) |
 |
| Top |
| * When you move the cursor on each content, you can see more deailed mutation information on the Tooltip. Those are primary_site,primary_histology,mutation(aa),pubmedID. |
| GRCh37 position | Mutation(aa) | Unique sampleID count |
| chr3:13417924-13417924 | p.R387Q | 4 |
| chr3:13378289-13378289 | p.E1228K | 3 |
| chr3:13376971-13376971 | p.D1276N | 3 |
| chr3:13395078-13395078 | p.L868L | 3 |
| chr3:13371956-13371956 | p.? | 2 |
| chr3:13372109-13372109 | p.R1321C | 2 |
| chr3:13381524-13381524 | p.E1101K | 2 |
| chr3:13371977-13371977 | p.I1365L | 2 |
| chr3:13429815-13429815 | p.E224D | 2 |
| chr3:13381378-13381378 | p.T1149T | 2 |
| Top |
|
 |
| Point Mutation/ Tissue ID | 1 | 2 | 3 | 4 | 5 | 6 | 7 | 8 | 9 | 10 | 11 | 12 | 13 | 14 | 15 | 16 | 17 | 18 | 19 | 20 |
| # sample | 8 | 4 | 21 | 3 | 5 | 2 | 1 | 16 | 4 | 8 | 1 | 37 | 16 | 18 | ||||||
| # mutation | 10 | 4 | 27 | 3 | 5 | 2 | 1 | 17 | 5 | 8 | 1 | 45 | 20 | 20 | ||||||
| nonsynonymous SNV | 4 | 2 | 18 | 2 | 3 | 2 | 1 | 15 | 3 | 6 | 1 | 29 | 11 | 13 | ||||||
| synonymous SNV | 6 | 2 | 9 | 1 | 2 | 2 | 2 | 2 | 16 | 9 | 7 |
| cf) Tissue ID; Tissue type (1; BLCA[Bladder Urothelial Carcinoma], 2; BRCA[Breast invasive carcinoma], 3; CESC[Cervical squamous cell carcinoma and endocervical adenocarcinoma], 4; COAD[Colon adenocarcinoma], 5; GBM[Glioblastoma multiforme], 6; Glioma Low Grade, 7; HNSC[Head and Neck squamous cell carcinoma], 8; KICH[Kidney Chromophobe], 9; KIRC[Kidney renal clear cell carcinoma], 10; KIRP[Kidney renal papillary cell carcinoma], 11; LAML[Acute Myeloid Leukemia], 12; LUAD[Lung adenocarcinoma], 13; LUSC[Lung squamous cell carcinoma], 14; OV[Ovarian serous cystadenocarcinoma ], 15; PAAD[Pancreatic adenocarcinoma], 16; PRAD[Prostate adenocarcinoma], 17; SKCM[Skin Cutaneous Melanoma], 18:STAD[Stomach adenocarcinoma], 19:THCA[Thyroid carcinoma], 20:UCEC[Uterine Corpus Endometrial Carcinoma]) |
| Top |
| * We represented just top 10 SNVs. When you move the cursor on each content, you can see more deailed mutation information on the Tooltip. Those are primary_site, primary_histology, mutation(aa), pubmedID. |
| Genomic Position | Mutation(aa) | Unique sampleID count |
| chr3:13378289 | p.E1228K | 3 |
| chr3:13417924 | p.R387Q | 3 |
| chr3:13363298 | p.I1133I | 2 |
| chr3:13393384 | p.A944T | 2 |
| chr3:13381426 | p.E447V | 2 |
| chr3:13417095 | p.T1651T | 2 |
| chr3:13368919 | p.S676F | 1 |
| chr3:13441258 | p.T1593T | 1 |
| chr3:13379373 | p.V513V | 1 |
| chr3:13401854 | p.V1394V | 1 |
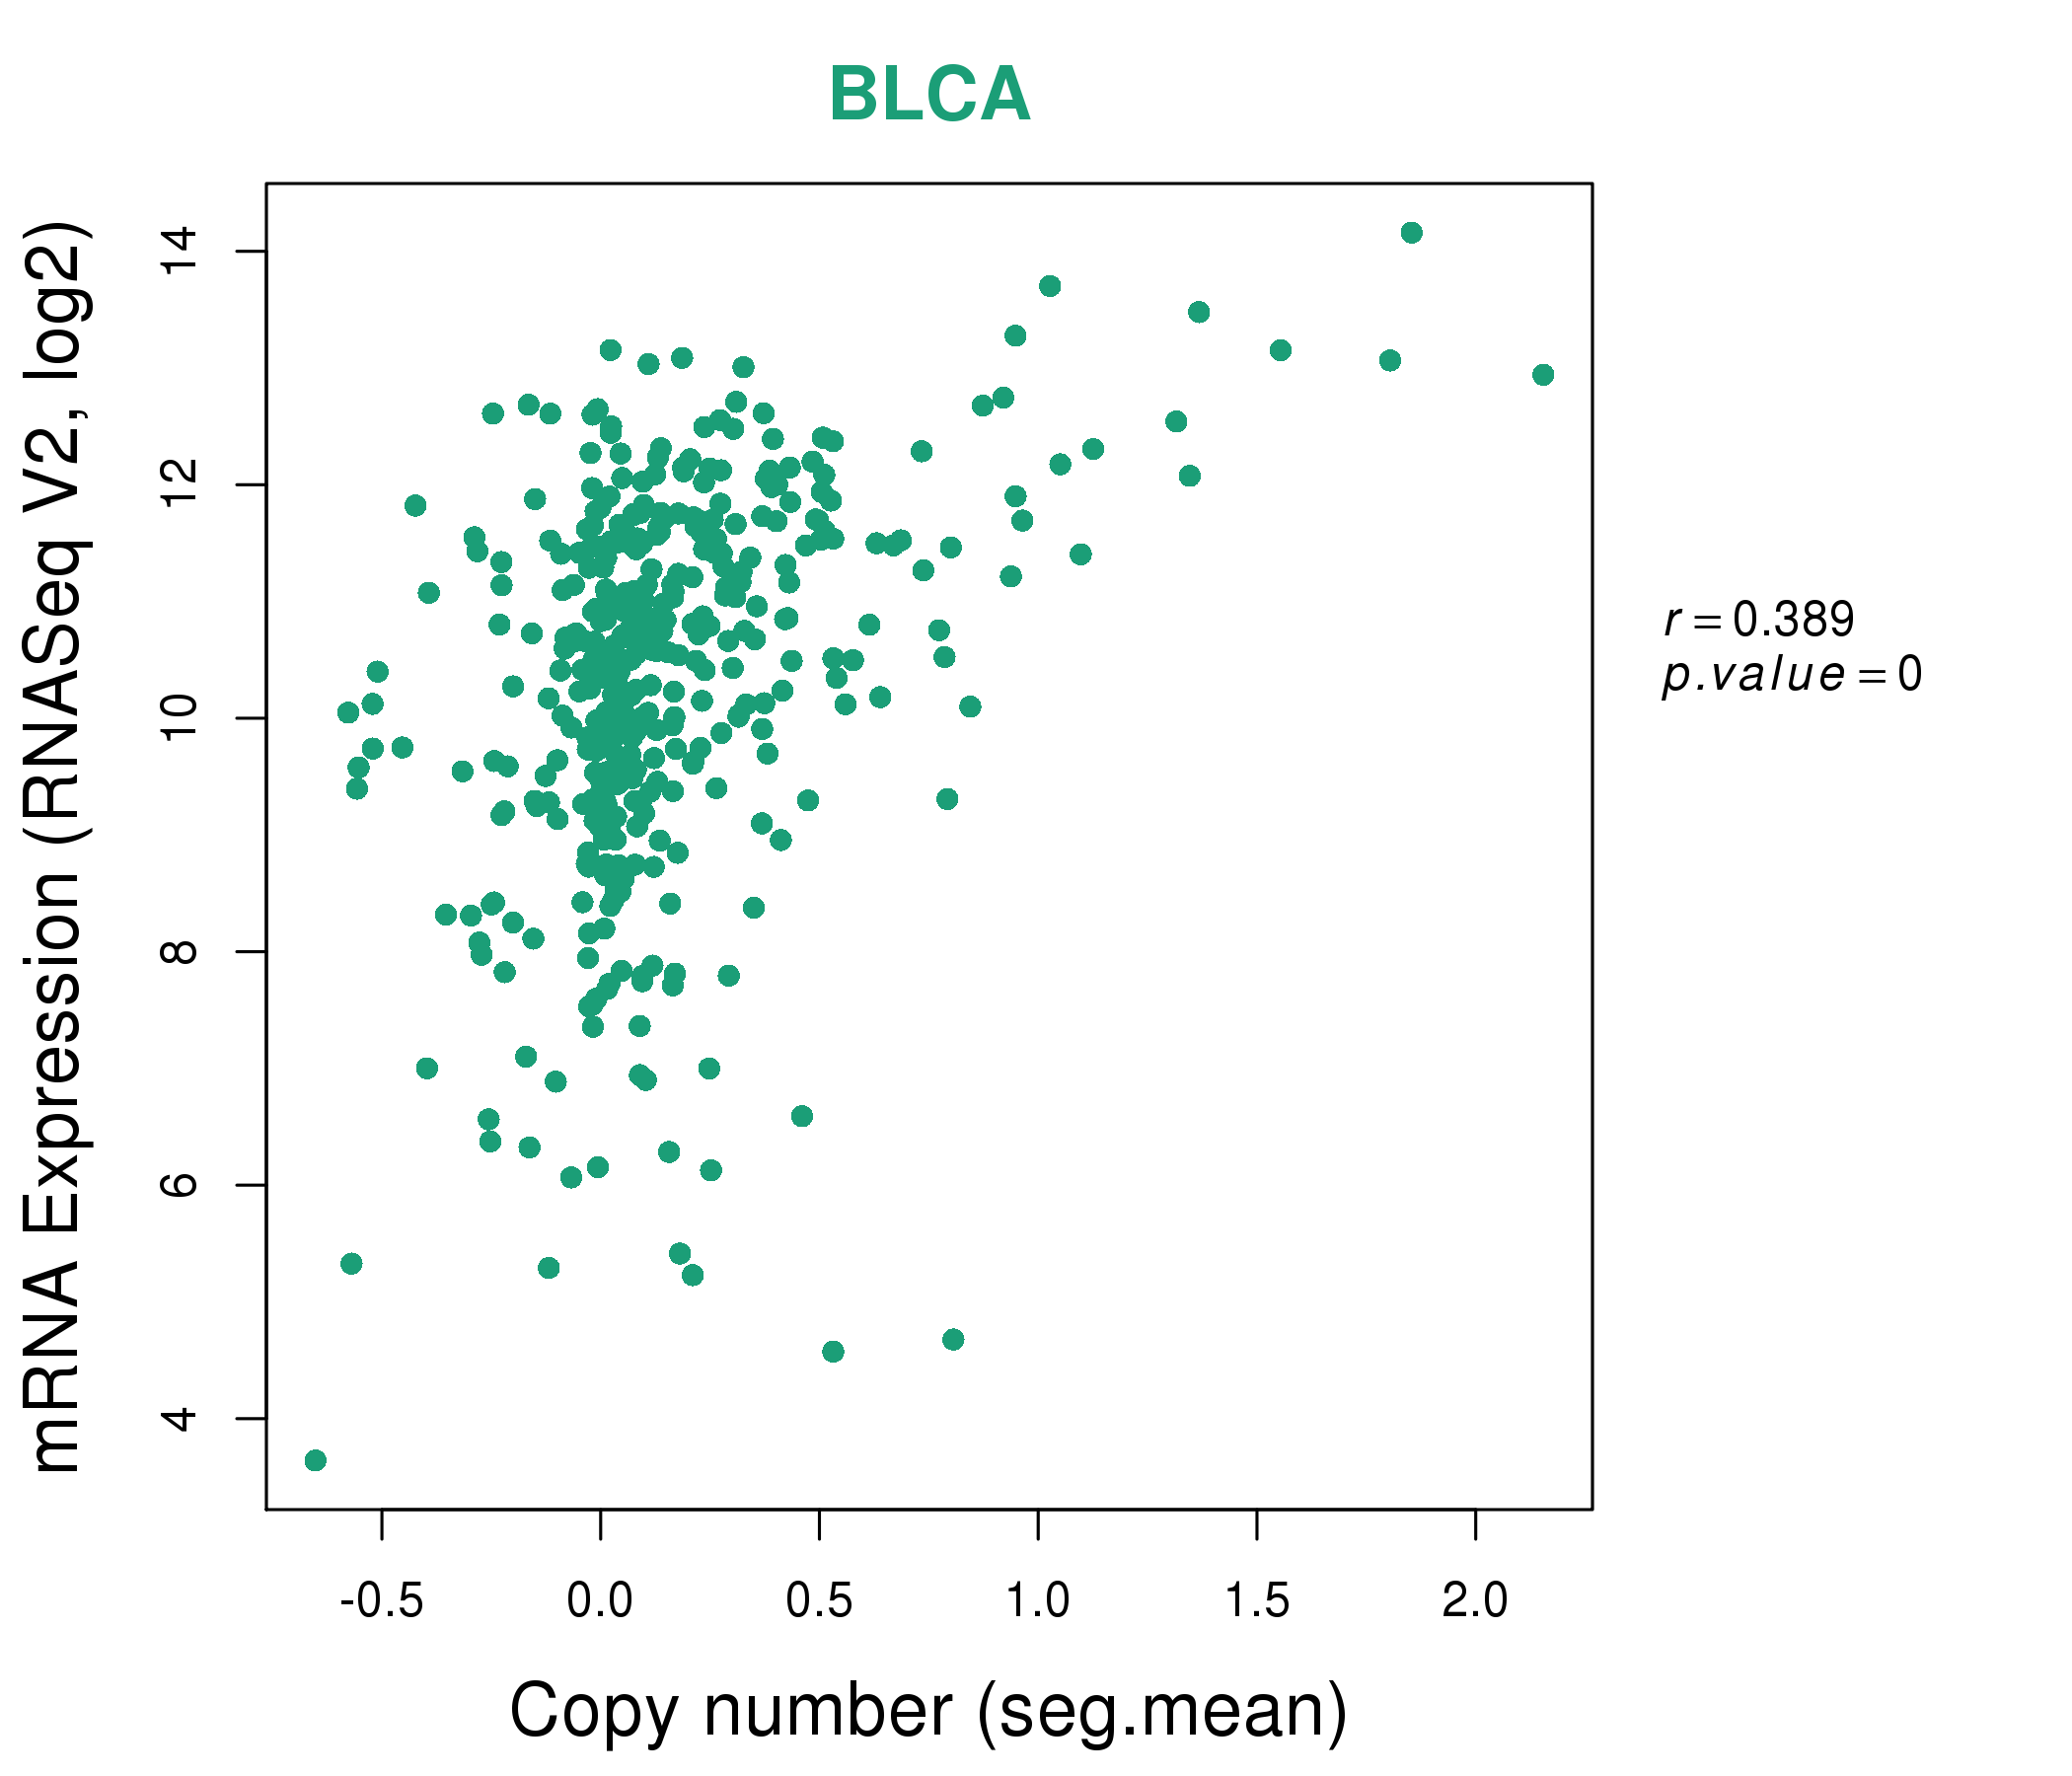
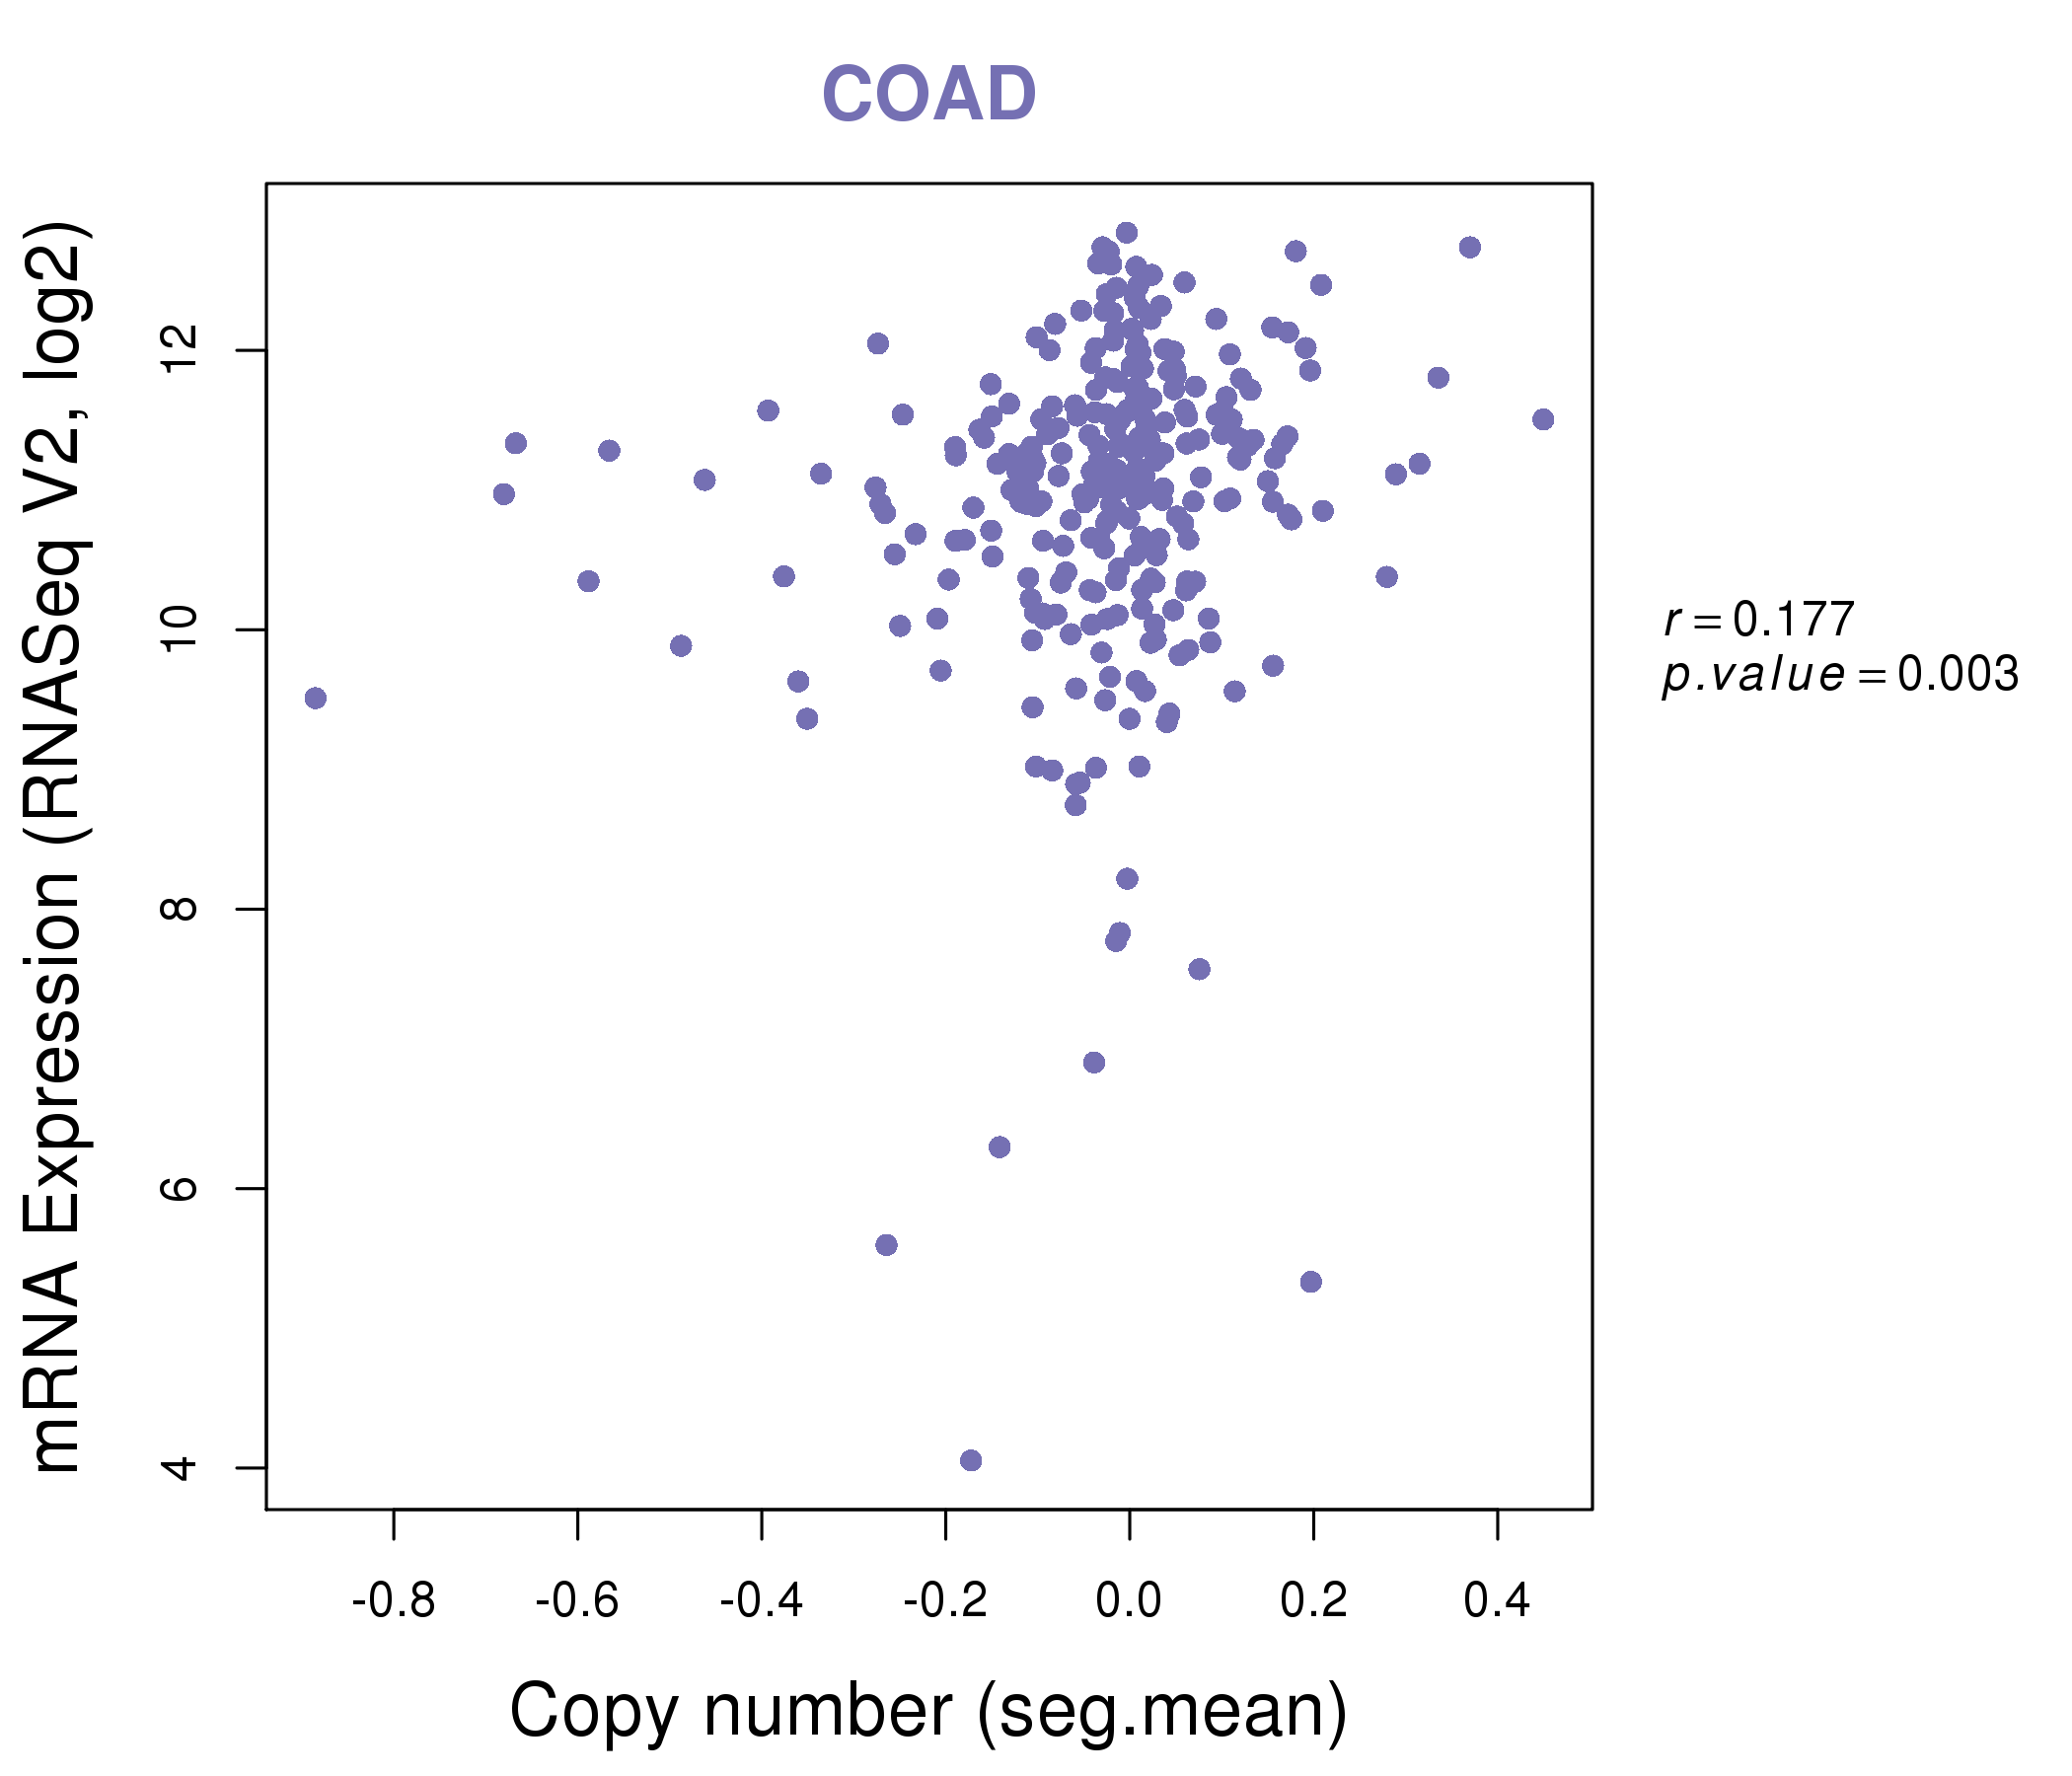
| * Copy number data were extracted from TCGA using R package TCGA-Assembler. The URLs of all public data files on TCGA DCC data server were gathered on Jan-05-2015. Function ProcessCNAData in TCGA-Assembler package was used to obtain gene-level copy number value which is calculated as the average copy number of the genomic region of a gene. |
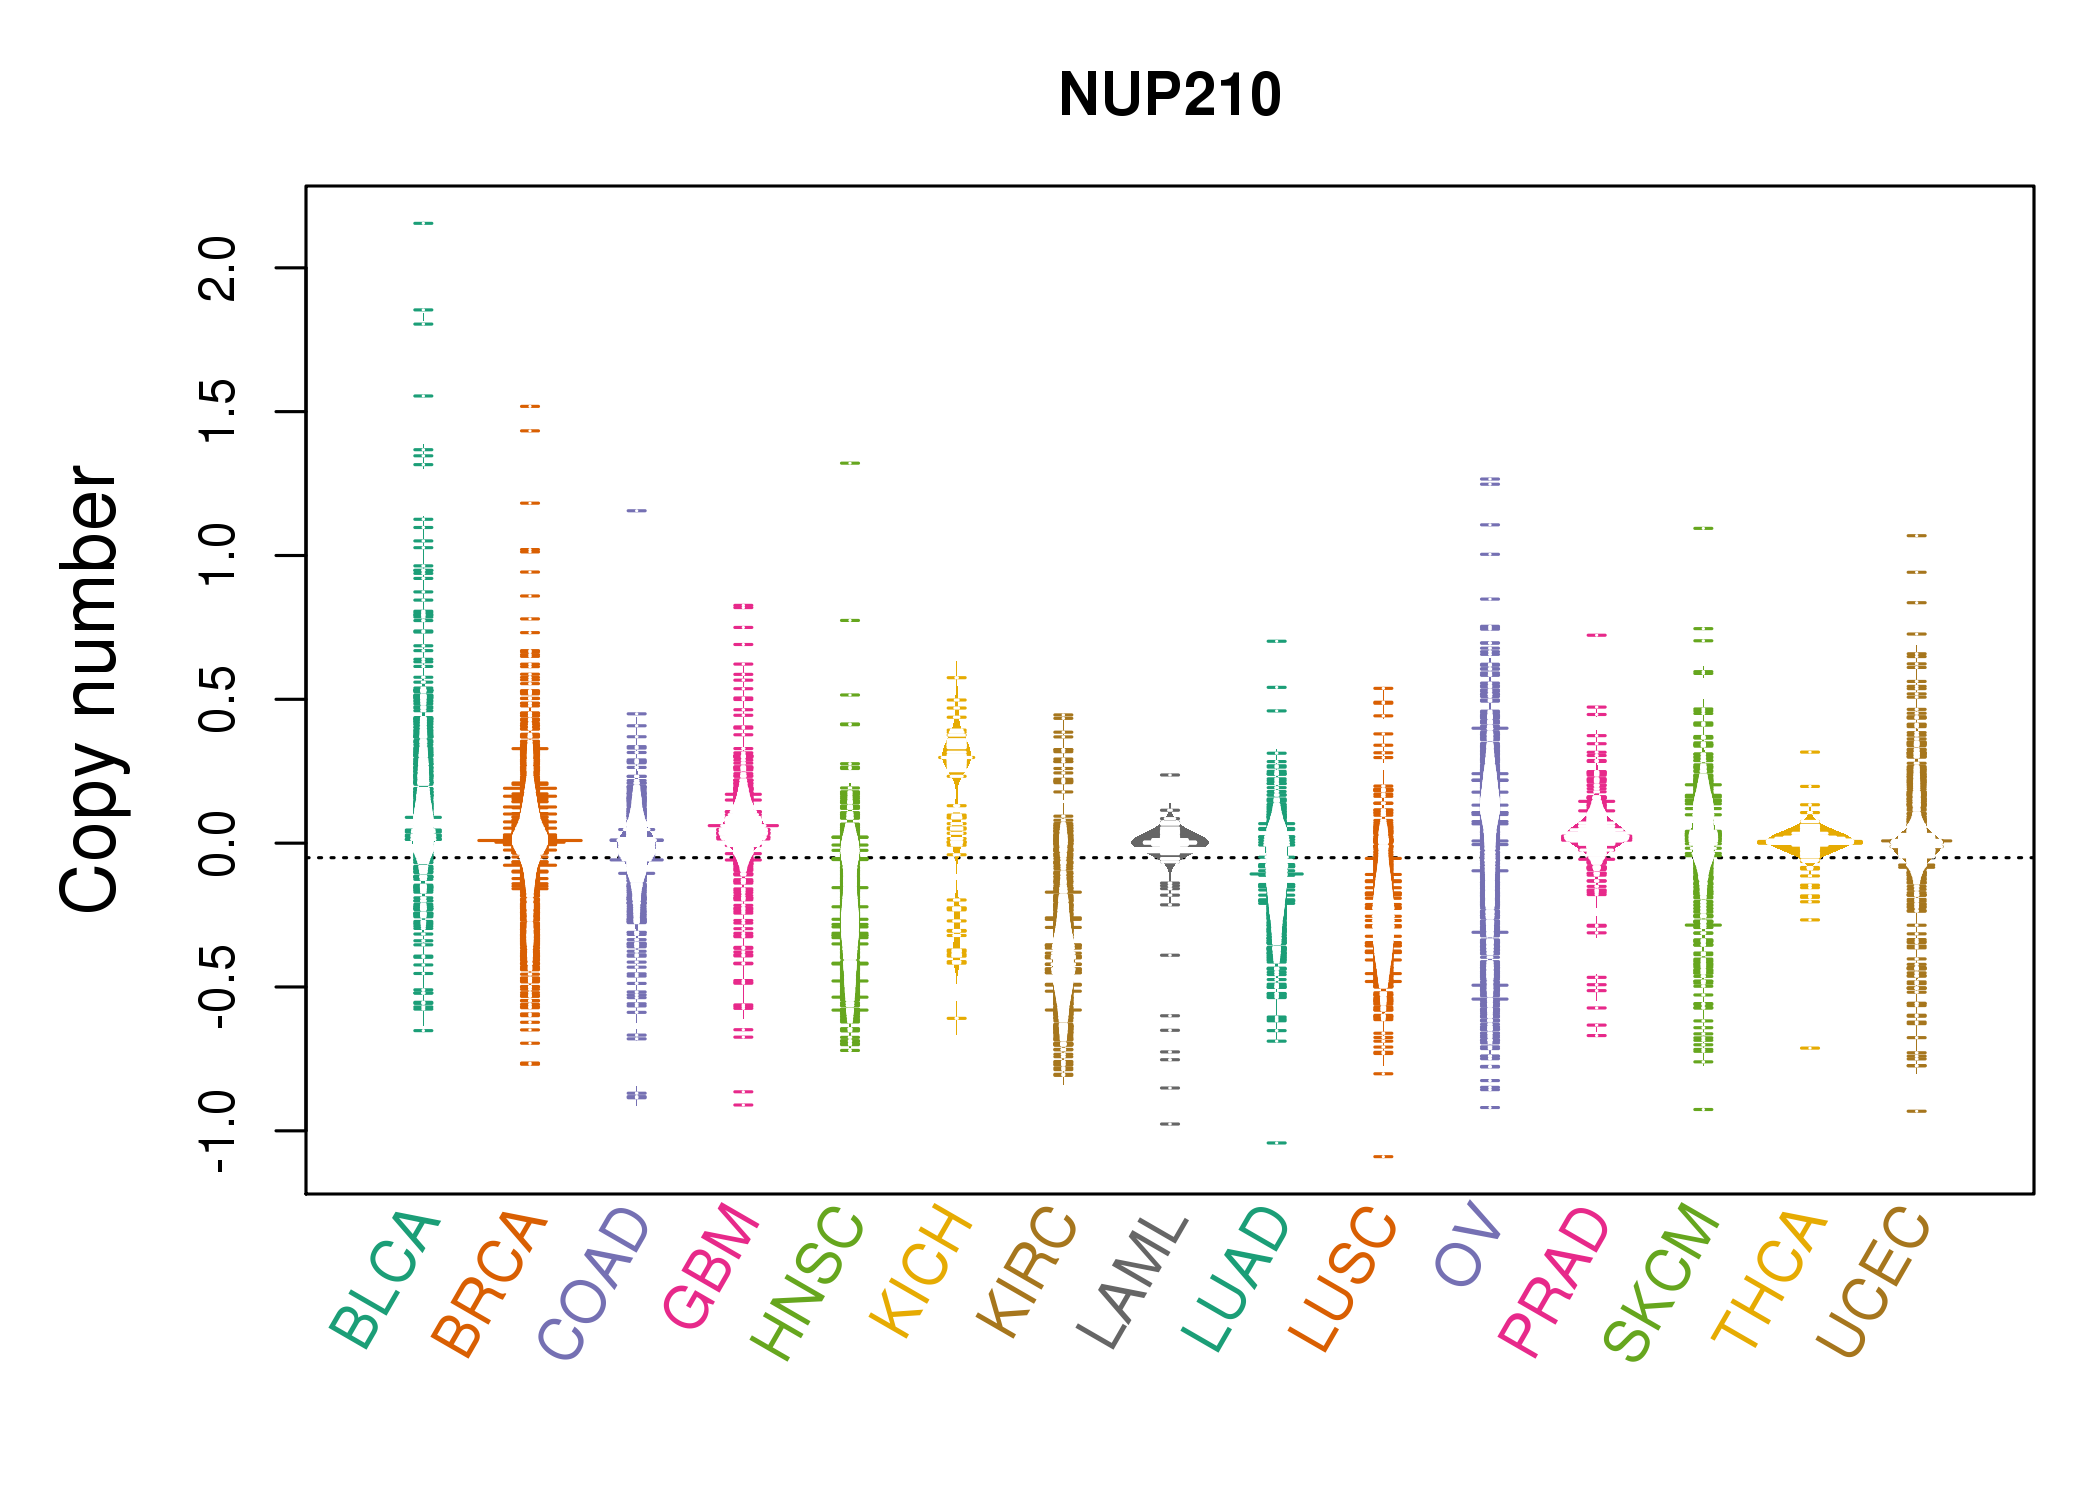 |
| cf) Tissue ID[Tissue type]: BLCA[Bladder Urothelial Carcinoma], BRCA[Breast invasive carcinoma], CESC[Cervical squamous cell carcinoma and endocervical adenocarcinoma], COAD[Colon adenocarcinoma], GBM[Glioblastoma multiforme], Glioma Low Grade, HNSC[Head and Neck squamous cell carcinoma], KICH[Kidney Chromophobe], KIRC[Kidney renal clear cell carcinoma], KIRP[Kidney renal papillary cell carcinoma], LAML[Acute Myeloid Leukemia], LUAD[Lung adenocarcinoma], LUSC[Lung squamous cell carcinoma], OV[Ovarian serous cystadenocarcinoma ], PAAD[Pancreatic adenocarcinoma], PRAD[Prostate adenocarcinoma], SKCM[Skin Cutaneous Melanoma], STAD[Stomach adenocarcinoma], THCA[Thyroid carcinoma], UCEC[Uterine Corpus Endometrial Carcinoma] |
| Top |
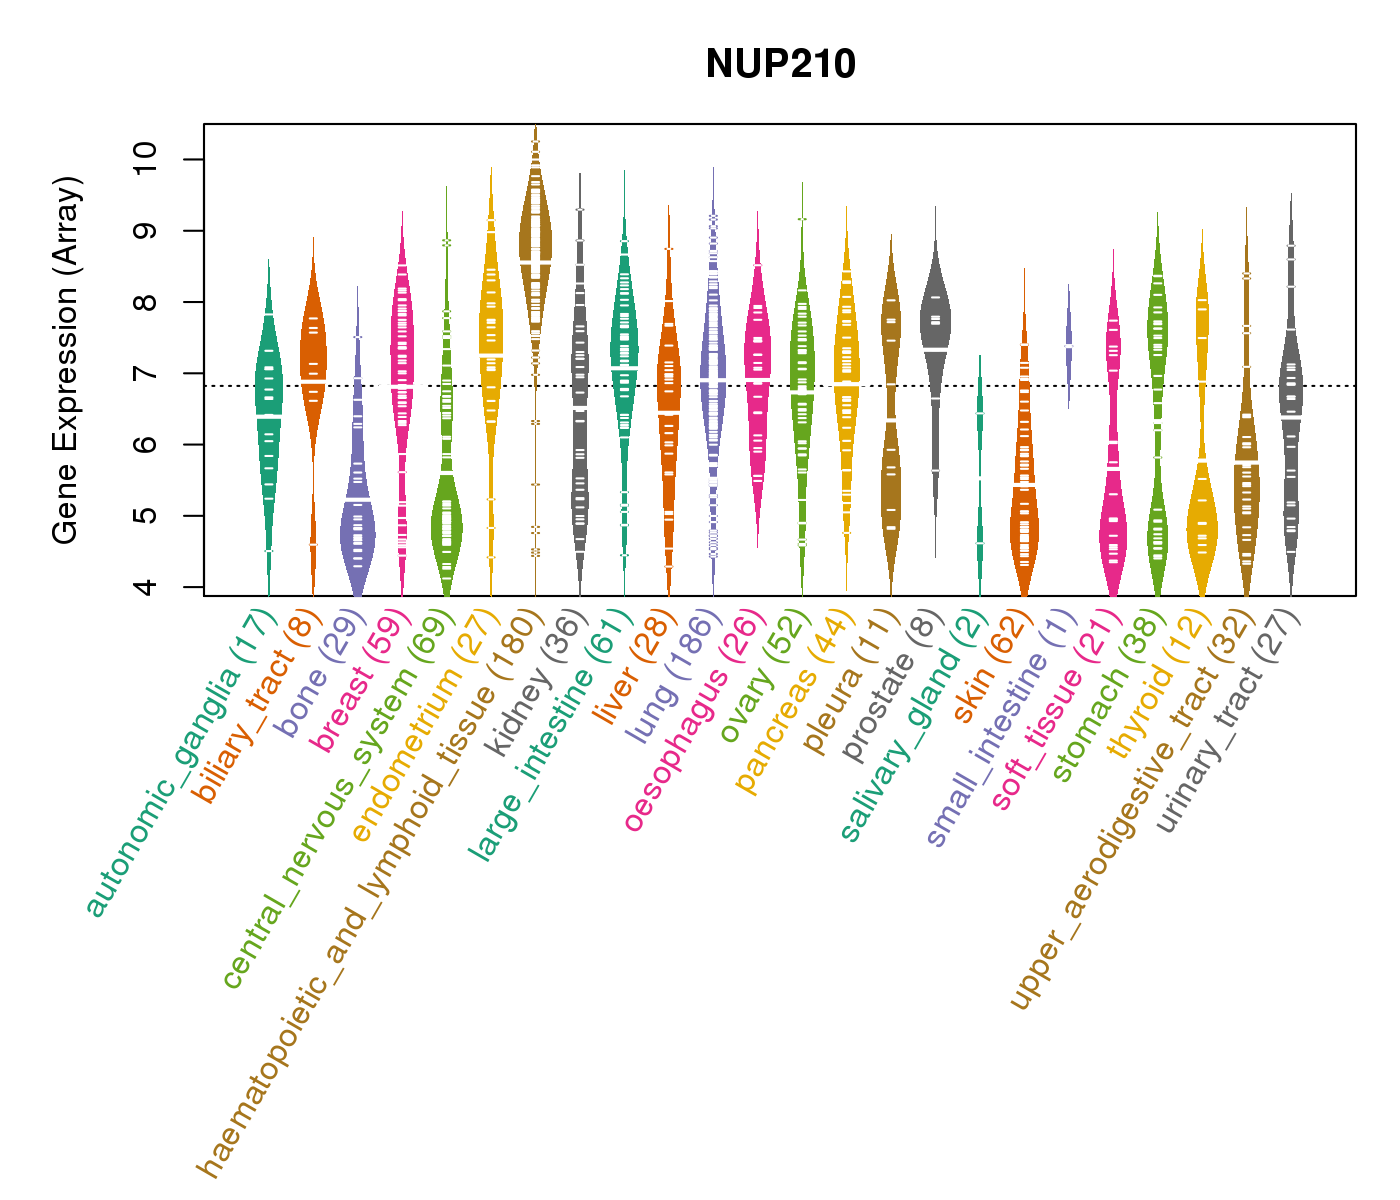
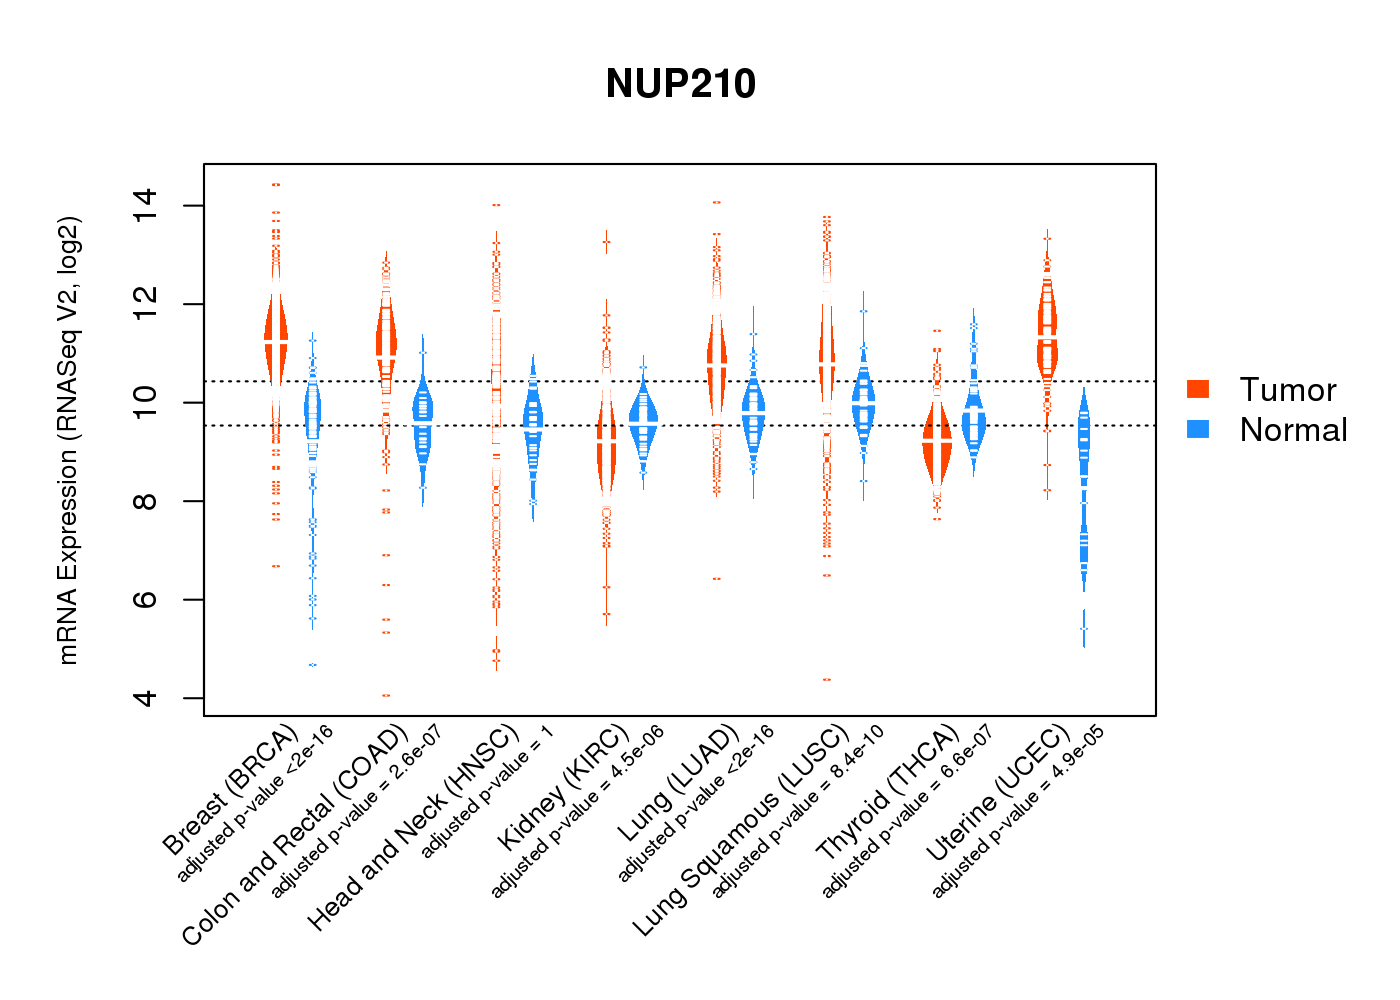
| Gene Expression for NUP210 |
| * CCLE gene expression data were extracted from CCLE_Expression_Entrez_2012-10-18.res: Gene-centric RMA-normalized mRNA expression data. |
 |
| * Normalized gene expression data of RNASeqV2 was extracted from TCGA using R package TCGA-Assembler. The URLs of all public data files on TCGA DCC data server were gathered at Jan-05-2015. Only eight cancer types have enough normal control samples for differential expression analysis. (t test, adjusted p<0.05 (using Benjamini-Hochberg FDR)) |
 |
| Top |
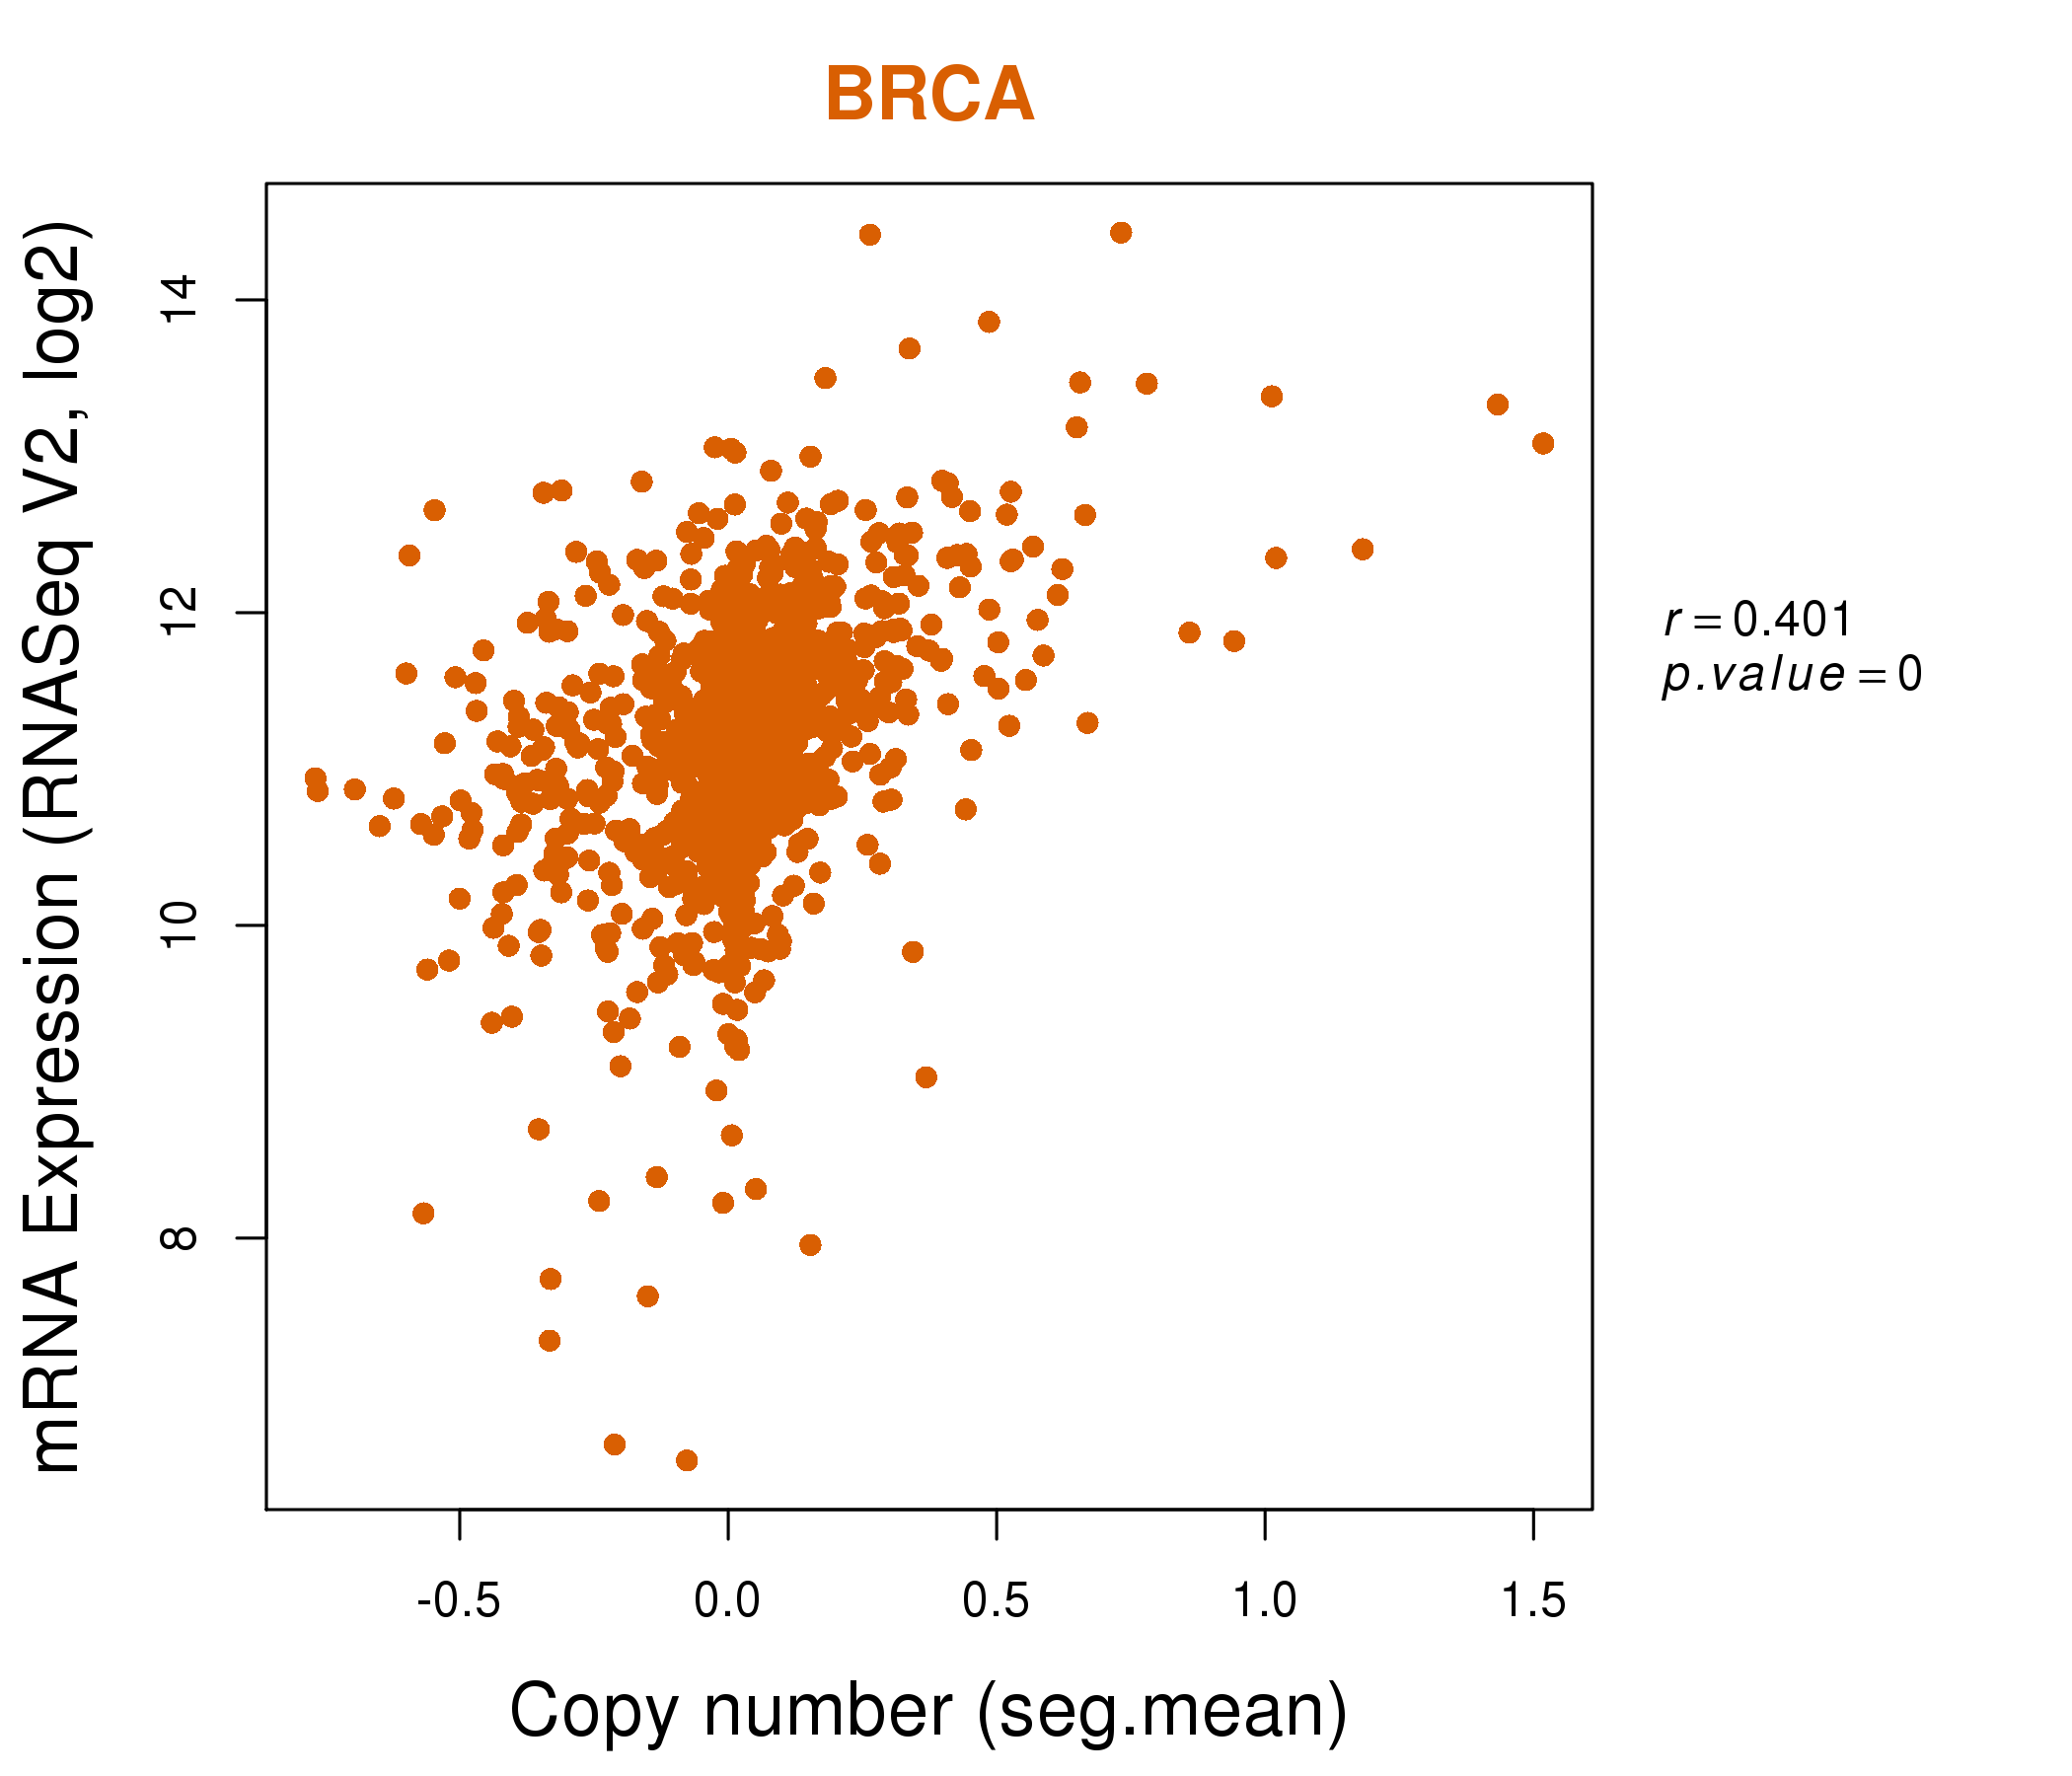
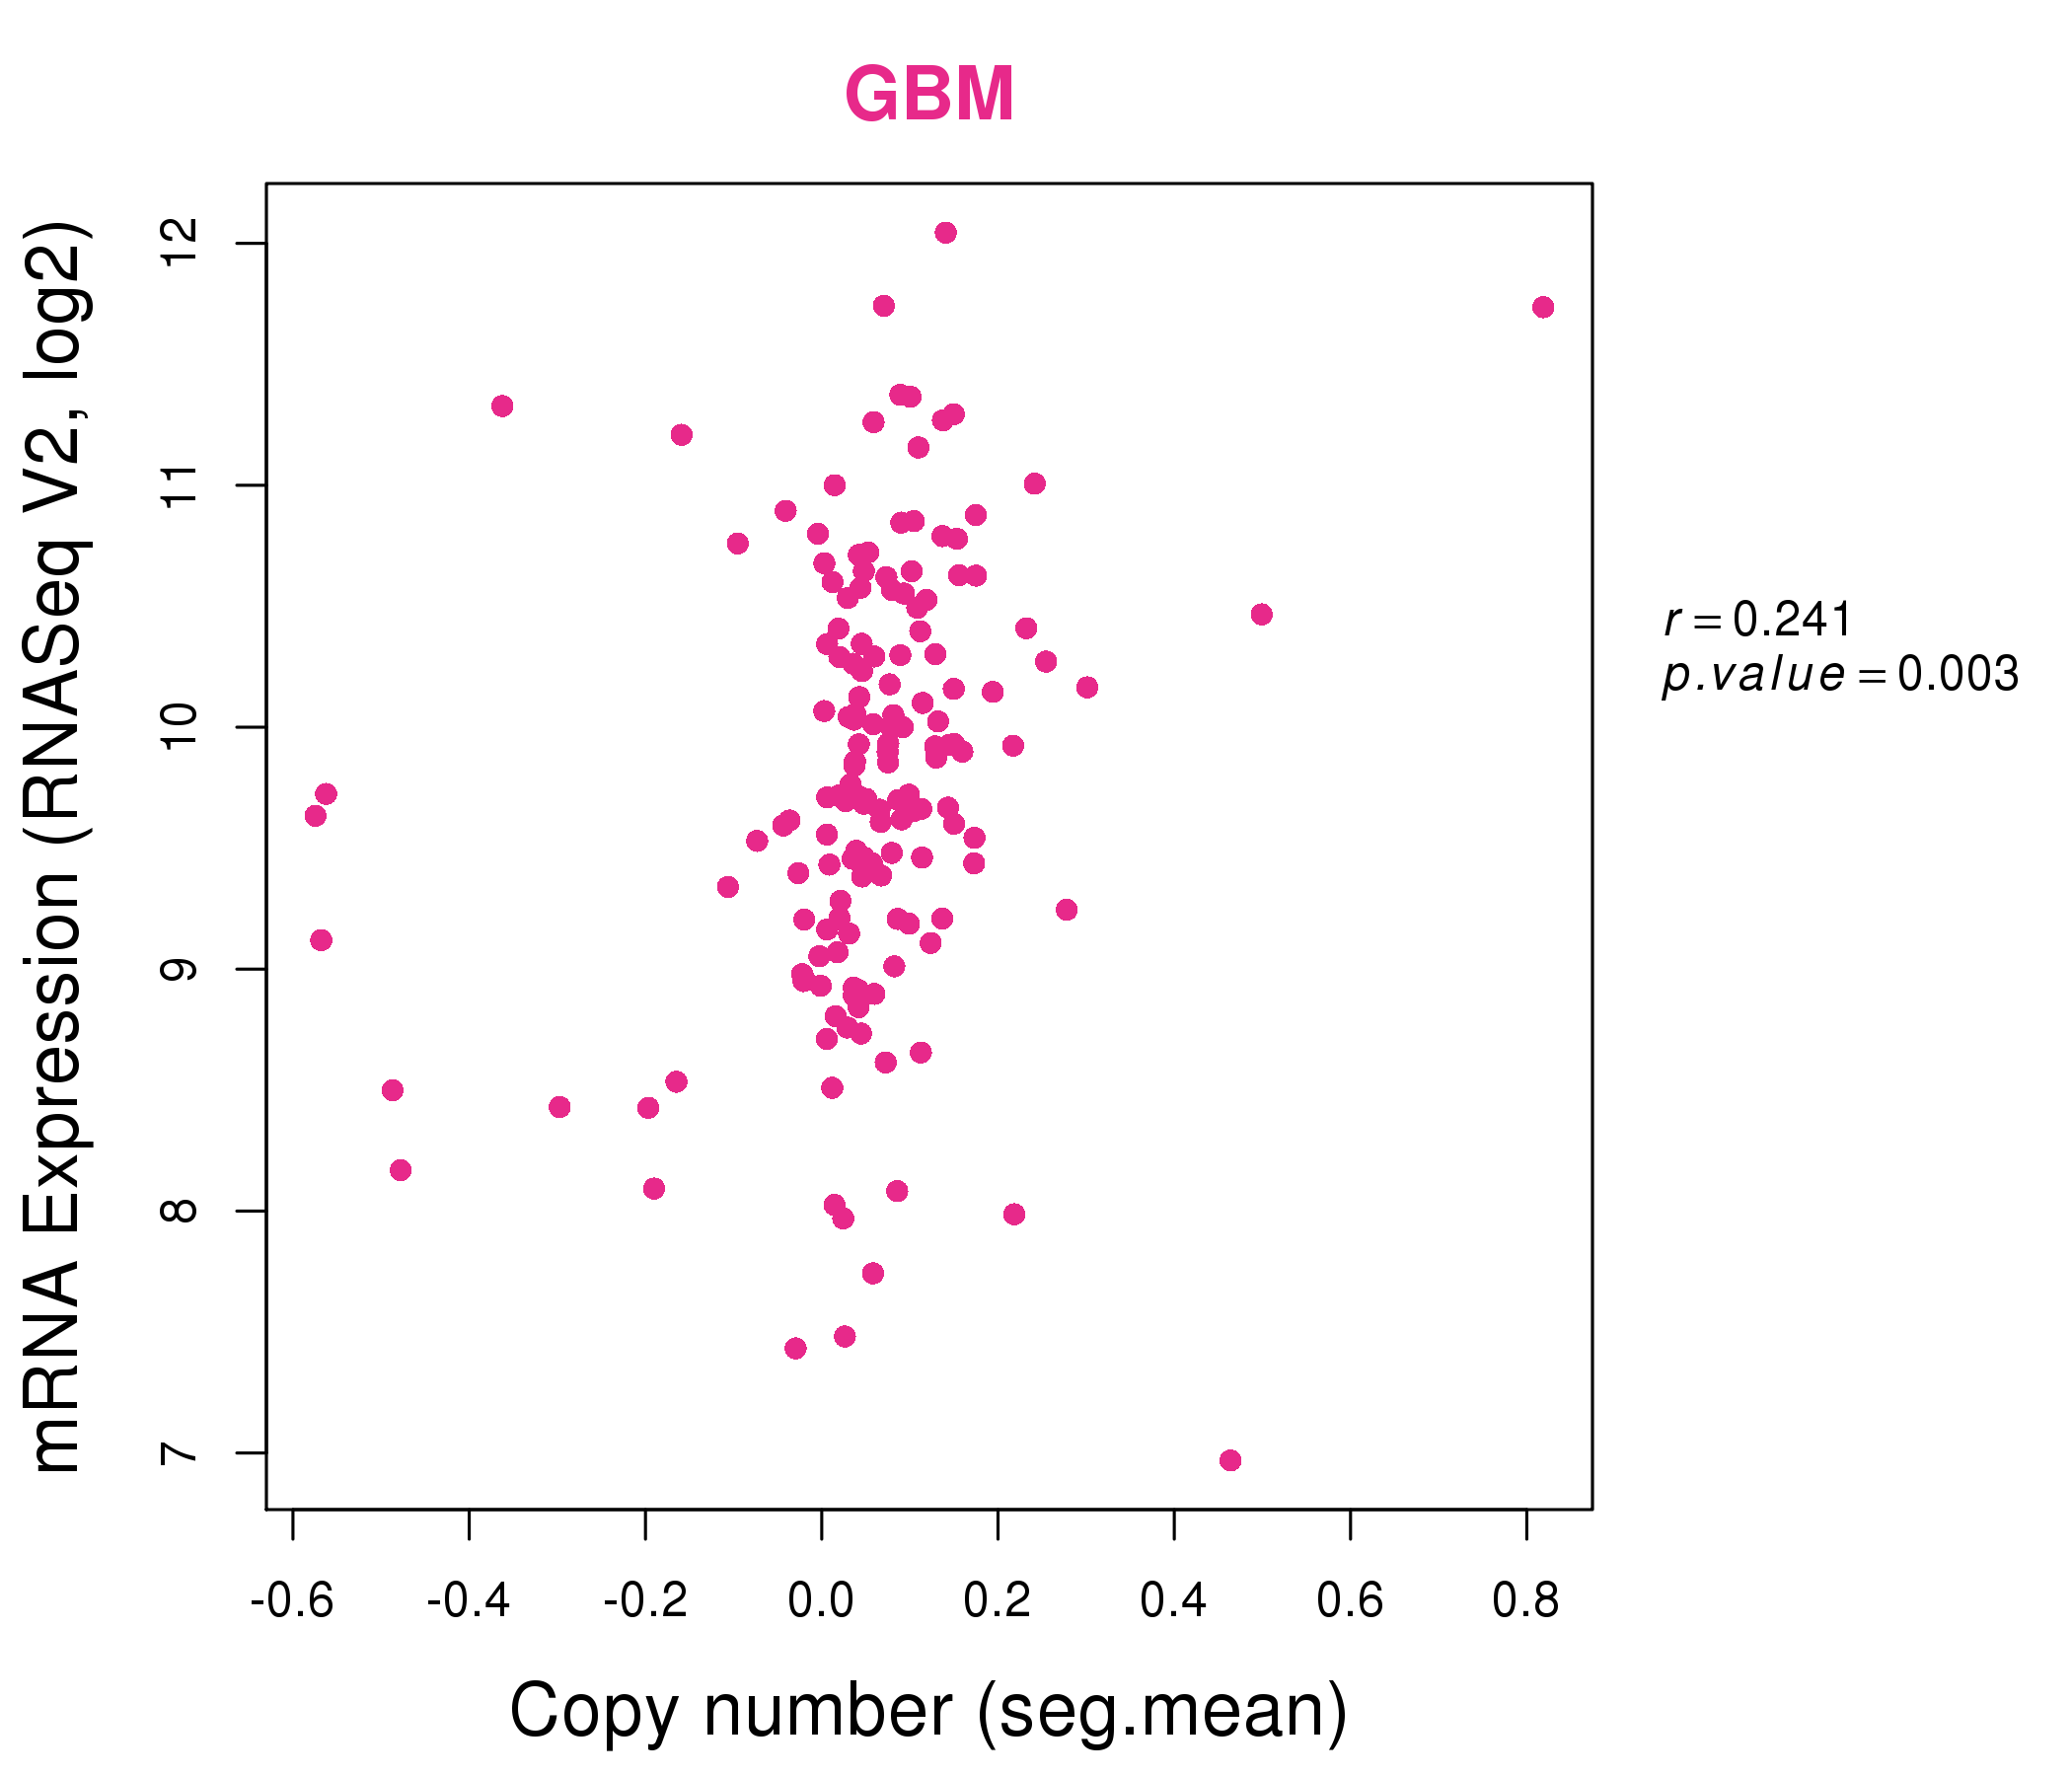
| * This plots show the correlation between CNV and gene expression. |
: Open all plots for all cancer types
 |
|
 |
|
| Top |
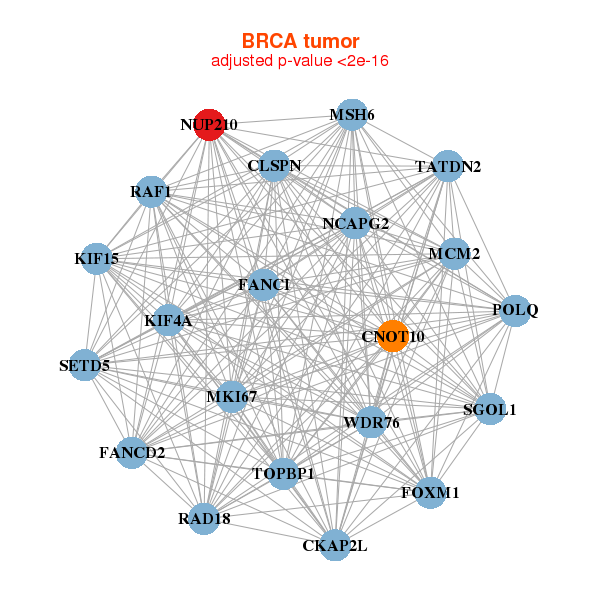
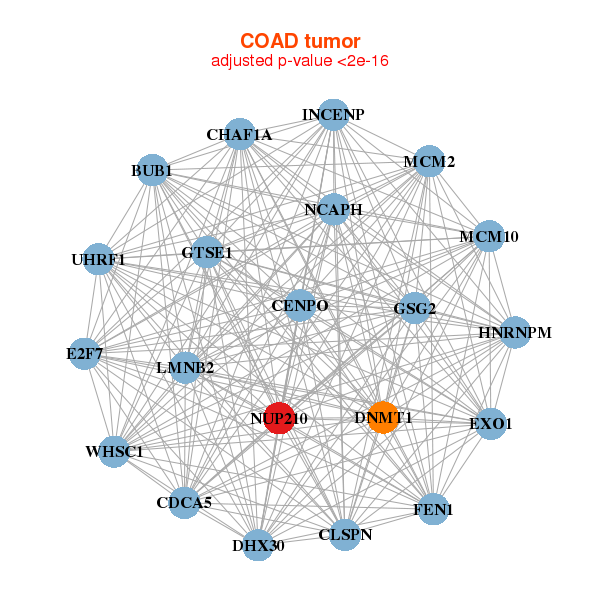
| Gene-Gene Network Information |
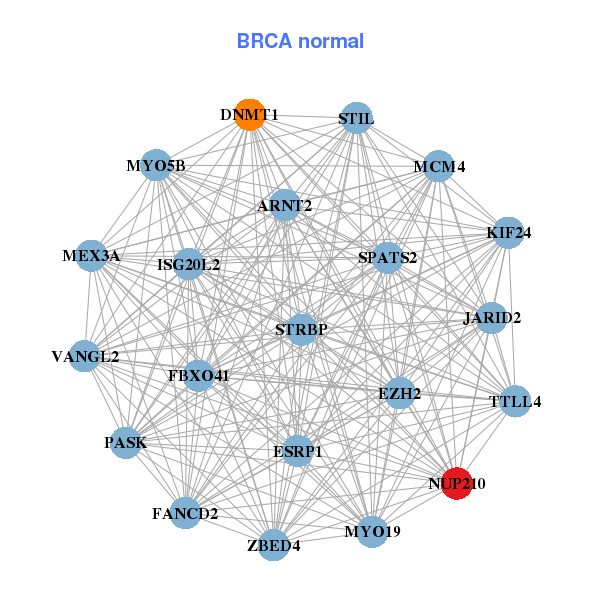
| * Co-Expression network figures were drawn using R package igraph. Only the top 20 genes with the highest correlations were shown. Red circle: input gene, orange circle: cell metabolism gene, sky circle: other gene |
: Open all plots for all cancer types
 |
|
| CKAP2L,CLSPN,CNOT10,FANCD2,FANCI,FOXM1,KIF15, KIF4A,MCM2,MKI67,MSH6,NCAPG2,NUP210,POLQ, RAD18,RAF1,SETD5,SGOL1,TATDN2,TOPBP1,WDR76 | ARNT2,DNMT1,ESRP1,EZH2,FANCD2,FBXO41,ISG20L2, JARID2,KIF24,MCM4,MEX3A,MYO19,MYO5B,NUP210, PASK,SPATS2,STIL,STRBP,TTLL4,VANGL2,ZBED4 |
 |
|
| BUB1,CDCA5,CENPO,CHAF1A,CLSPN,DHX30,DNMT1, E2F7,EXO1,FEN1,GSG2,GTSE1,HNRNPM,INCENP, LMNB2,MCM10,MCM2,NCAPH,NUP210,UHRF1,WHSC1 | AKNA,BEND4,CARD11,DOCK2,DOCK8,DOK3,IKZF1, IKZF3,INPP5D,MAP4K1,NUP210,P2RY8,POU2AF1,RASSF5, RLTPR,SEMA4A,SEMA4D,SP140,SYVN1,WDFY4,ZNF831 |

| * Co-Expression network figures were drawn using R package igraph. Only the top 20 genes with the highest correlations were shown. Red circle: input gene, orange circle: cell metabolism gene, sky circle: other gene |
: Open all plots for all cancer types
| Top |
: Open all interacting genes' information including KEGG pathway for all interacting genes from DAVID
| Top |
| Pharmacological Information for NUP210 |
| There's no related Drug. |
| Top |
| Cross referenced IDs for NUP210 |
| * We obtained these cross-references from Uniprot database. It covers 150 different DBs, 18 categories. http://www.uniprot.org/help/cross_references_section |
: Open all cross reference information
|
Copyright © 2016-Present - The Univsersity of Texas Health Science Center at Houston @ |