|
|||||||||||||||||||||||||||||||||||||||||||||||||||||||||||||||||||||||||||||||||||||||||||||||||||||||||||||||||||||||||||||||||||||||||||||||||||||||||||||||||||||||||||||||||||||||||||||||||||||||||||||||||||||||||||||||||||||||||||||||||||||||||||||||||||||||||||||||||||||||||||||||||||||||||||||||||||||||||||||||||||||||||||||||||||||||||||||||||||||||||||||||||||||||||||||||||||||||||||||||
| |
| Phenotypic Information (metabolism pathway, cancer, disease, phenome) |
| |
| |
| Gene-Gene Network Information: Co-Expression Network, Interacting Genes & KEGG |
| |
|


| Gene Summary for PLCB1 |
| Basic gene info. | Gene symbol | PLCB1 |
| Gene name | phospholipase C, beta 1 (phosphoinositide-specific) | |
| Synonyms | EIEE12|PI-PLC|PLC-154|PLC-I|PLC154|PLCB1A|PLCB1B | |
| Cytomap | UCSC genome browser: 20p12 | |
| Genomic location | chr20 :8113295-8865547 | |
| Type of gene | protein-coding | |
| RefGenes | NM_015192.3, NM_182734.2, | |
| Ensembl id | ENSG00000182621 | |
| Description | 1-phosphatidyl-D-myo-inositol-4,5-bisphosphate1-phosphatidylinositol 4,5-bisphosphate phosphodiesterase beta-1PLC-beta-1inositoltrisphosphohydrolasemonophosphatidylinositol phosphodiesterasephosphoinositidase Cphospholipase C-Itriphosphoinositide p | |
| Modification date | 20141222 | |
| dbXrefs | MIM : 607120 | |
| HGNC : HGNC | ||
| Ensembl : ENSG00000182621 | ||
| HPRD : 06177 | ||
| Vega : OTTHUMG00000031849 | ||
| Protein | UniProt: Q9NQ66 go to UniProt's Cross Reference DB Table | |
| Expression | CleanEX: HS_PLCB1 | |
| BioGPS: 23236 | ||
| Gene Expression Atlas: ENSG00000182621 | ||
| The Human Protein Atlas: ENSG00000182621 | ||
| Pathway | NCI Pathway Interaction Database: PLCB1 | |
| KEGG: PLCB1 | ||
| REACTOME: PLCB1 | ||
| ConsensusPathDB | ||
| Pathway Commons: PLCB1 | ||
| Metabolism | MetaCyc: PLCB1 | |
| HUMANCyc: PLCB1 | ||
| Regulation | Ensembl's Regulation: ENSG00000182621 | |
| miRBase: chr20 :8,113,295-8,865,547 | ||
| TargetScan: NM_015192 | ||
| cisRED: ENSG00000182621 | ||
| Context | iHOP: PLCB1 | |
| cancer metabolism search in PubMed: PLCB1 | ||
| UCL Cancer Institute: PLCB1 | ||
| Assigned class in ccmGDB | B - This gene belongs to cancer gene. | |
| Top |
| Phenotypic Information for PLCB1(metabolism pathway, cancer, disease, phenome) |
| Cancer | CGAP: PLCB1 |
| Familial Cancer Database: PLCB1 | |
| * This gene is included in those cancer gene databases. |
|
|
|
|
|
| . | |||||||||||||||||||||||||||||||||||||||||||||||||||||||||||||||||||||||||||||||||||||||||||||||||||||||||||||||||||||||||||||||||||||||||||||||||||||||||||||||||||||||||||||||||||||||||||||||||||||||||||||||||||||||||||||||||||||||||||||||||||||||||||||||||||||||||||||||||||||||||||||||||||||||||||||||||||||||||||||||||||||||||||||||||||||||||||||||||||||||||||||||||||||||||||||||||||||||||
Oncogene 1 | Significant driver gene in | ||||||||||||||||||||||||||||||||||||||||||||||||||||||||||||||||||||||||||||||||||||||||||||||||||||||||||||||||||||||||||||||||||||||||||||||||||||||||||||||||||||||||||||||||||||||||||||||||||||||||||||||||||||||||||||||||||||||||||||||||||||||||||||||||||||||||||||||||||||||||||||||||||||||||||||||||||||||||||||||||||||||||||||||||||||||||||||||||||||||||||||||||||||||||||||||||||||||||||||||
| cf) number; DB name 1 Oncogene; http://nar.oxfordjournals.org/content/35/suppl_1/D721.long, 2 Tumor Suppressor gene; https://bioinfo.uth.edu/TSGene/, 3 Cancer Gene Census; http://www.nature.com/nrc/journal/v4/n3/abs/nrc1299.html, 4 CancerGenes; http://nar.oxfordjournals.org/content/35/suppl_1/D721.long, 5 Network of Cancer Gene; http://ncg.kcl.ac.uk/index.php, 1Therapeutic Vulnerabilities in Cancer; http://cbio.mskcc.org/cancergenomics/statius/ |
| KEGG_INOSITOL_PHOSPHATE_METABOLISM REACTOME_INTEGRATION_OF_ENERGY_METABOLISM | |
| OMIM | 607120; gene. 607120; gene. 613722; phenotype. 613722; phenotype. |
| Orphanet | 293181; Malignant migrating partial seizures of infancy. 293181; Malignant migrating partial seizures of infancy. 3451; West syndrome. 3451; West syndrome. |
| Disease | KEGG Disease: PLCB1 |
| MedGen: PLCB1 (Human Medical Genetics with Condition) | |
| ClinVar: PLCB1 | |
| Phenotype | MGI: PLCB1 (International Mouse Phenotyping Consortium) |
| PhenomicDB: PLCB1 | |
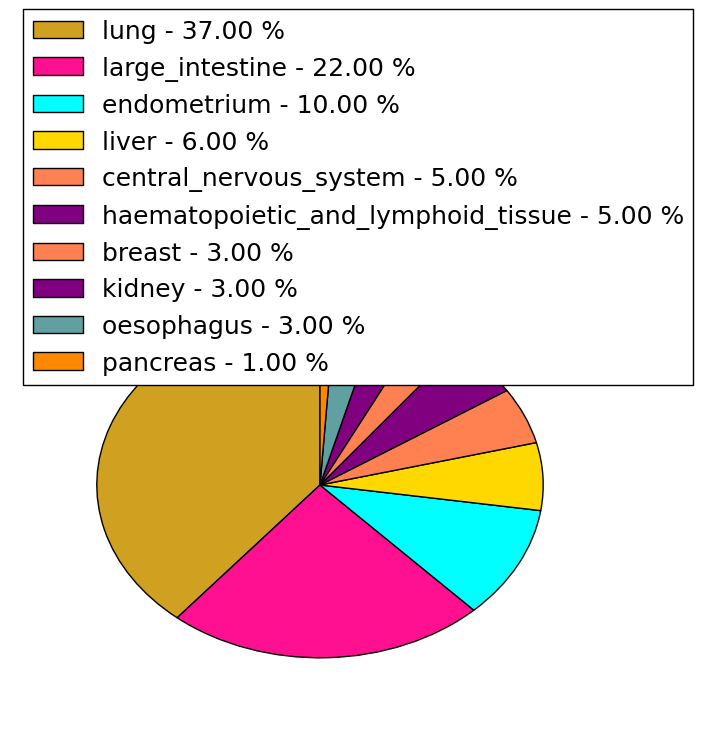
| Mutations for PLCB1 |
| * Under tables are showing count per each tissue to give us broad intuition about tissue specific mutation patterns.You can go to the detailed page for each mutation database's web site. |
| - Statistics for Tissue and Mutation type | Top |
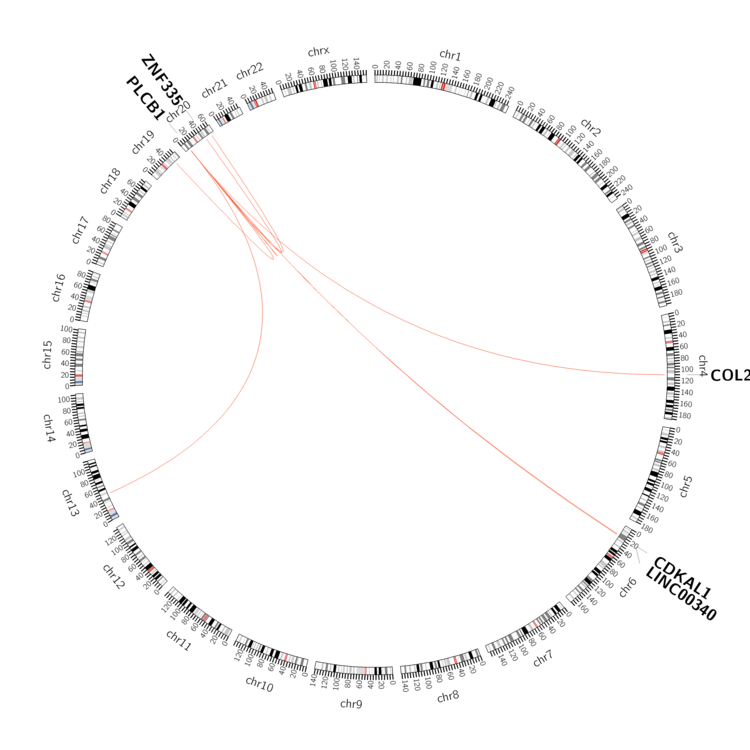 |
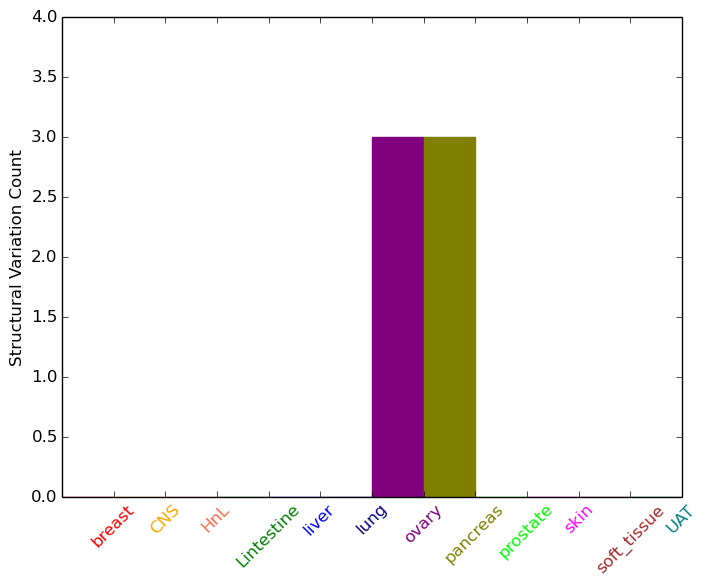
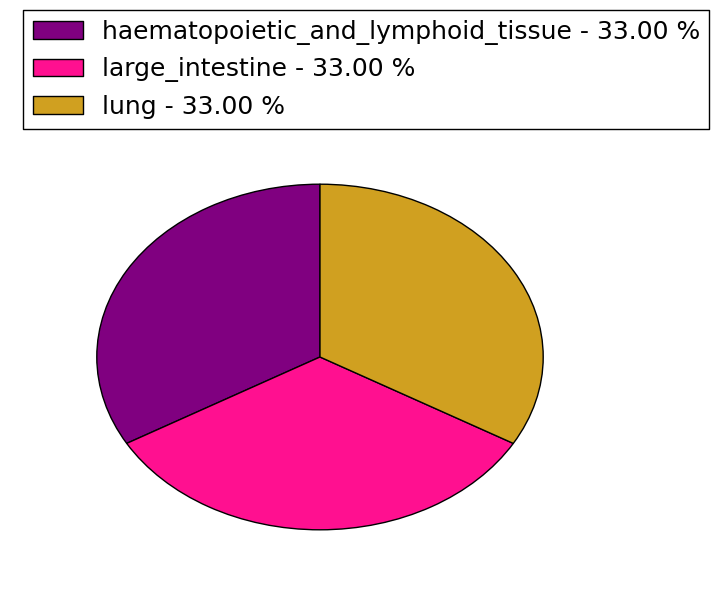
| - For Inter-chromosomal Variations |
| * Inter-chromosomal variantions includes 'interchromosomal amplicon to amplicon', 'interchromosomal amplicon to non-amplified dna', 'interchromosomal insertion', 'Interchromosomal unknown type'. |
 |
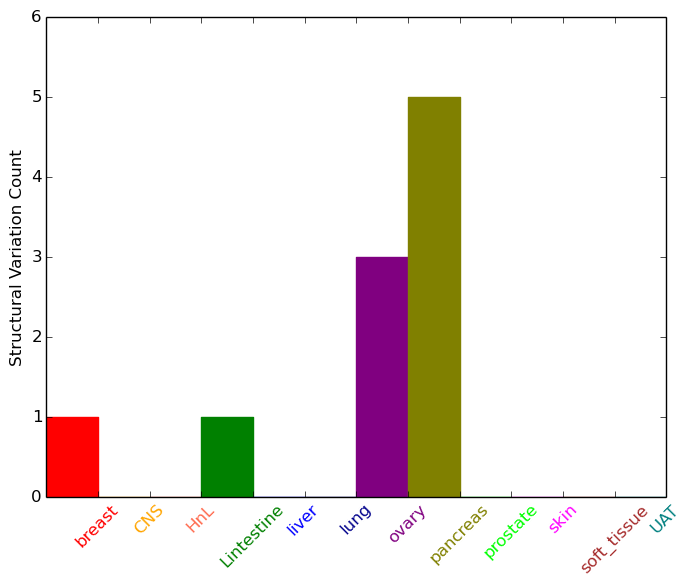
| - For Intra-chromosomal Variations |
| * Intra-chromosomal variantions includes 'intrachromosomal amplicon to amplicon', 'intrachromosomal amplicon to non-amplified dna', 'intrachromosomal deletion', 'intrachromosomal fold-back inversion', 'intrachromosomal inversion', 'intrachromosomal tandem duplication', 'Intrachromosomal unknown type', 'intrachromosomal with inverted orientation', 'intrachromosomal with non-inverted orientation'. |
 |
| Sample | Symbol_a | Chr_a | Start_a | End_a | Symbol_b | Chr_b | Start_b | End_b |
| breast | PLCB1 | chr20 | 8296860 | 8296860 | PLCB1 | chr20 | 8357007 | 8357007 |
| large_intestine | PLCB1 | chr20 | 8810913 | 8810913 | chr20 | 8882215 | 8882215 | |
| ovary | PLCB1 | chr20 | 8608069 | 8608089 | PLCB1 | chr20 | 8646243 | 8646263 |
| ovary | PLCB1 | chr20 | 8625349 | 8625369 | PLCB1 | chr20 | 8614037 | 8614057 |
| ovary | PLCB1 | chr20 | 8630133 | 8630333 | CDKAL1 | chr6 | 20668965 | 20669165 |
| ovary | PLCB1 | chr20 | 8757588 | 8757608 | PLCB1 | chr20 | 8735524 | 8735544 |
| pancreas | PLCB1 | chr20 | 8357110 | 8357130 | chr20 | 56389979 | 56389999 | |
| pancreas | PLCB1 | chr20 | 8469553 | 8469573 | PLCB1 | chr20 | 8534994 | 8535014 |
| pancreas | PLCB1 | chr20 | 8636339 | 8636359 | PLCB1 | chr20 | 8774028 | 8774048 |
| pancreas | PLCB1 | chr20 | 8726325 | 8726345 | ZNF335 | chr20 | 44589603 | 44589623 |
| pancreas | PLCB1 | chr20 | 8726326 | 8726346 | ZNF335 | chr20 | 44589603 | 44589623 |
| cf) Tissue number; Tissue name (1;Breast, 2;Central_nervous_system, 3;Haematopoietic_and_lymphoid_tissue, 4;Large_intestine, 5;Liver, 6;Lung, 7;Ovary, 8;Pancreas, 9;Prostate, 10;Skin, 11;Soft_tissue, 12;Upper_aerodigestive_tract) |
| * From mRNA Sanger sequences, Chitars2.0 arranged chimeric transcripts. This table shows PLCB1 related fusion information. |
| ID | Head Gene | Tail Gene | Accession | Gene_a | qStart_a | qEnd_a | Chromosome_a | tStart_a | tEnd_a | Gene_a | qStart_a | qEnd_a | Chromosome_a | tStart_a | tEnd_a |
| AA984410 | PLCB1 | 1 | 232 | 20 | 8630065 | 8639283 | NLGN2 | 232 | 251 | 17 | 7320966 | 7320985 | |
| BE835662 | PLCB1 | 4 | 266 | 20 | 8188789 | 8189060 | GTF2A1 | 265 | 366 | 14 | 81686939 | 81687040 | |
| BF954088 | ZSWIM4 | 149 | 176 | 19 | 13929041 | 13929072 | PLCB1 | 176 | 195 | 20 | 8226543 | 8226562 | |
| CV383659 | PLCB1 | 7 | 69 | 20 | 8629223 | 8629285 | PLCB1 | 64 | 317 | 20 | 8618801 | 8619050 | |
| Top |
| Mutation type/ Tissue ID | brca | cns | cerv | endome | haematopo | kidn | Lintest | liver | lung | ns | ovary | pancre | prost | skin | stoma | thyro | urina | |||
| Total # sample | 9 | 2 | 2 | 8 | 10 | 5 | 5 | 1 | 3 | |||||||||||
| GAIN (# sample) | 8 | 2 | 1 | 6 | 10 | 5 | 5 | 1 | 3 | |||||||||||
| LOSS (# sample) | 1 | 1 | 2 |
| cf) Tissue ID; Tissue type (1; Breast, 2; Central_nervous_system, 3; Cervix, 4; Endometrium, 5; Haematopoietic_and_lymphoid_tissue, 6; Kidney, 7; Large_intestine, 8; Liver, 9; Lung, 10; NS, 11; Ovary, 12; Pancreas, 13; Prostate, 14; Skin, 15; Stomach, 16; Thyroid, 17; Urinary_tract) |
| Top |
|
 |
| Top |
| Stat. for Non-Synonymous SNVs (# total SNVs=155) | (# total SNVs=58) |
 |  |
(# total SNVs=3) | (# total SNVs=0) |
 |
| Top |
| * When you move the cursor on each content, you can see more deailed mutation information on the Tooltip. Those are primary_site,primary_histology,mutation(aa),pubmedID. |
| GRCh37 position | Mutation(aa) | Unique sampleID count |
| chr20:8862337-8862337 | p.F1164L | 5 |
| chr20:8719917-8719917 | p.P740S | 4 |
| chr20:8628584-8628584 | p.R168C | 4 |
| chr20:8755294-8755294 | p.Q1013H | 4 |
| chr20:8862495-8862495 | p.*1217* | 4 |
| chr20:8678311-8678311 | p.R350C | 3 |
| chr20:8709699-8709699 | p.Y589S | 3 |
| chr20:8717814-8717814 | p.E728V | 3 |
| chr20:8721032-8721032 | p.L784V | 3 |
| chr20:8628581-8628581 | p.G167R | 3 |
| Top |
|
 |
| Point Mutation/ Tissue ID | 1 | 2 | 3 | 4 | 5 | 6 | 7 | 8 | 9 | 10 | 11 | 12 | 13 | 14 | 15 | 16 | 17 | 18 | 19 | 20 |
| # sample | 5 | 4 | 30 | 1 | 14 | 1 | 2 | 2 | 39 | 13 | 6 | 1 | 1 | 43 | 18 | 15 | ||||
| # mutation | 5 | 4 | 28 | 1 | 14 | 1 | 2 | 2 | 42 | 14 | 6 | 1 | 1 | 62 | 21 | 14 | ||||
| nonsynonymous SNV | 4 | 3 | 18 | 12 | 1 | 2 | 34 | 9 | 6 | 43 | 13 | 7 | ||||||||
| synonymous SNV | 1 | 1 | 10 | 1 | 2 | 2 | 8 | 5 | 1 | 1 | 19 | 8 | 8 |
| cf) Tissue ID; Tissue type (1; BLCA[Bladder Urothelial Carcinoma], 2; BRCA[Breast invasive carcinoma], 3; CESC[Cervical squamous cell carcinoma and endocervical adenocarcinoma], 4; COAD[Colon adenocarcinoma], 5; GBM[Glioblastoma multiforme], 6; Glioma Low Grade, 7; HNSC[Head and Neck squamous cell carcinoma], 8; KICH[Kidney Chromophobe], 9; KIRC[Kidney renal clear cell carcinoma], 10; KIRP[Kidney renal papillary cell carcinoma], 11; LAML[Acute Myeloid Leukemia], 12; LUAD[Lung adenocarcinoma], 13; LUSC[Lung squamous cell carcinoma], 14; OV[Ovarian serous cystadenocarcinoma ], 15; PAAD[Pancreatic adenocarcinoma], 16; PRAD[Prostate adenocarcinoma], 17; SKCM[Skin Cutaneous Melanoma], 18:STAD[Stomach adenocarcinoma], 19:THCA[Thyroid carcinoma], 20:UCEC[Uterine Corpus Endometrial Carcinoma]) |
| Top |
| * We represented just top 10 SNVs. When you move the cursor on each content, you can see more deailed mutation information on the Tooltip. Those are primary_site, primary_histology, mutation(aa), pubmedID. |
| Genomic Position | Mutation(aa) | Unique sampleID count |
| chr20:8862337 | p.F1164F | 5 |
| chr20:8689378 | p.Q1050R,PLCB1 | 3 |
| chr20:8769133 | p.S410L,PLCB1 | 3 |
| chr20:8678311 | p.F326L,PLCB1 | 2 |
| chr20:8608996 | p.E728V,PLCB1 | 2 |
| chr20:8628584 | p.S330S,PLCB1 | 2 |
| chr20:8717814 | p.P223H,PLCB1 | 2 |
| chr20:8698409 | p.A425V,PLCB1 | 2 |
| chr20:8637904 | p.R350C,PLCB1 | 2 |
| chr20:8630046 | p.P1158H | 2 |
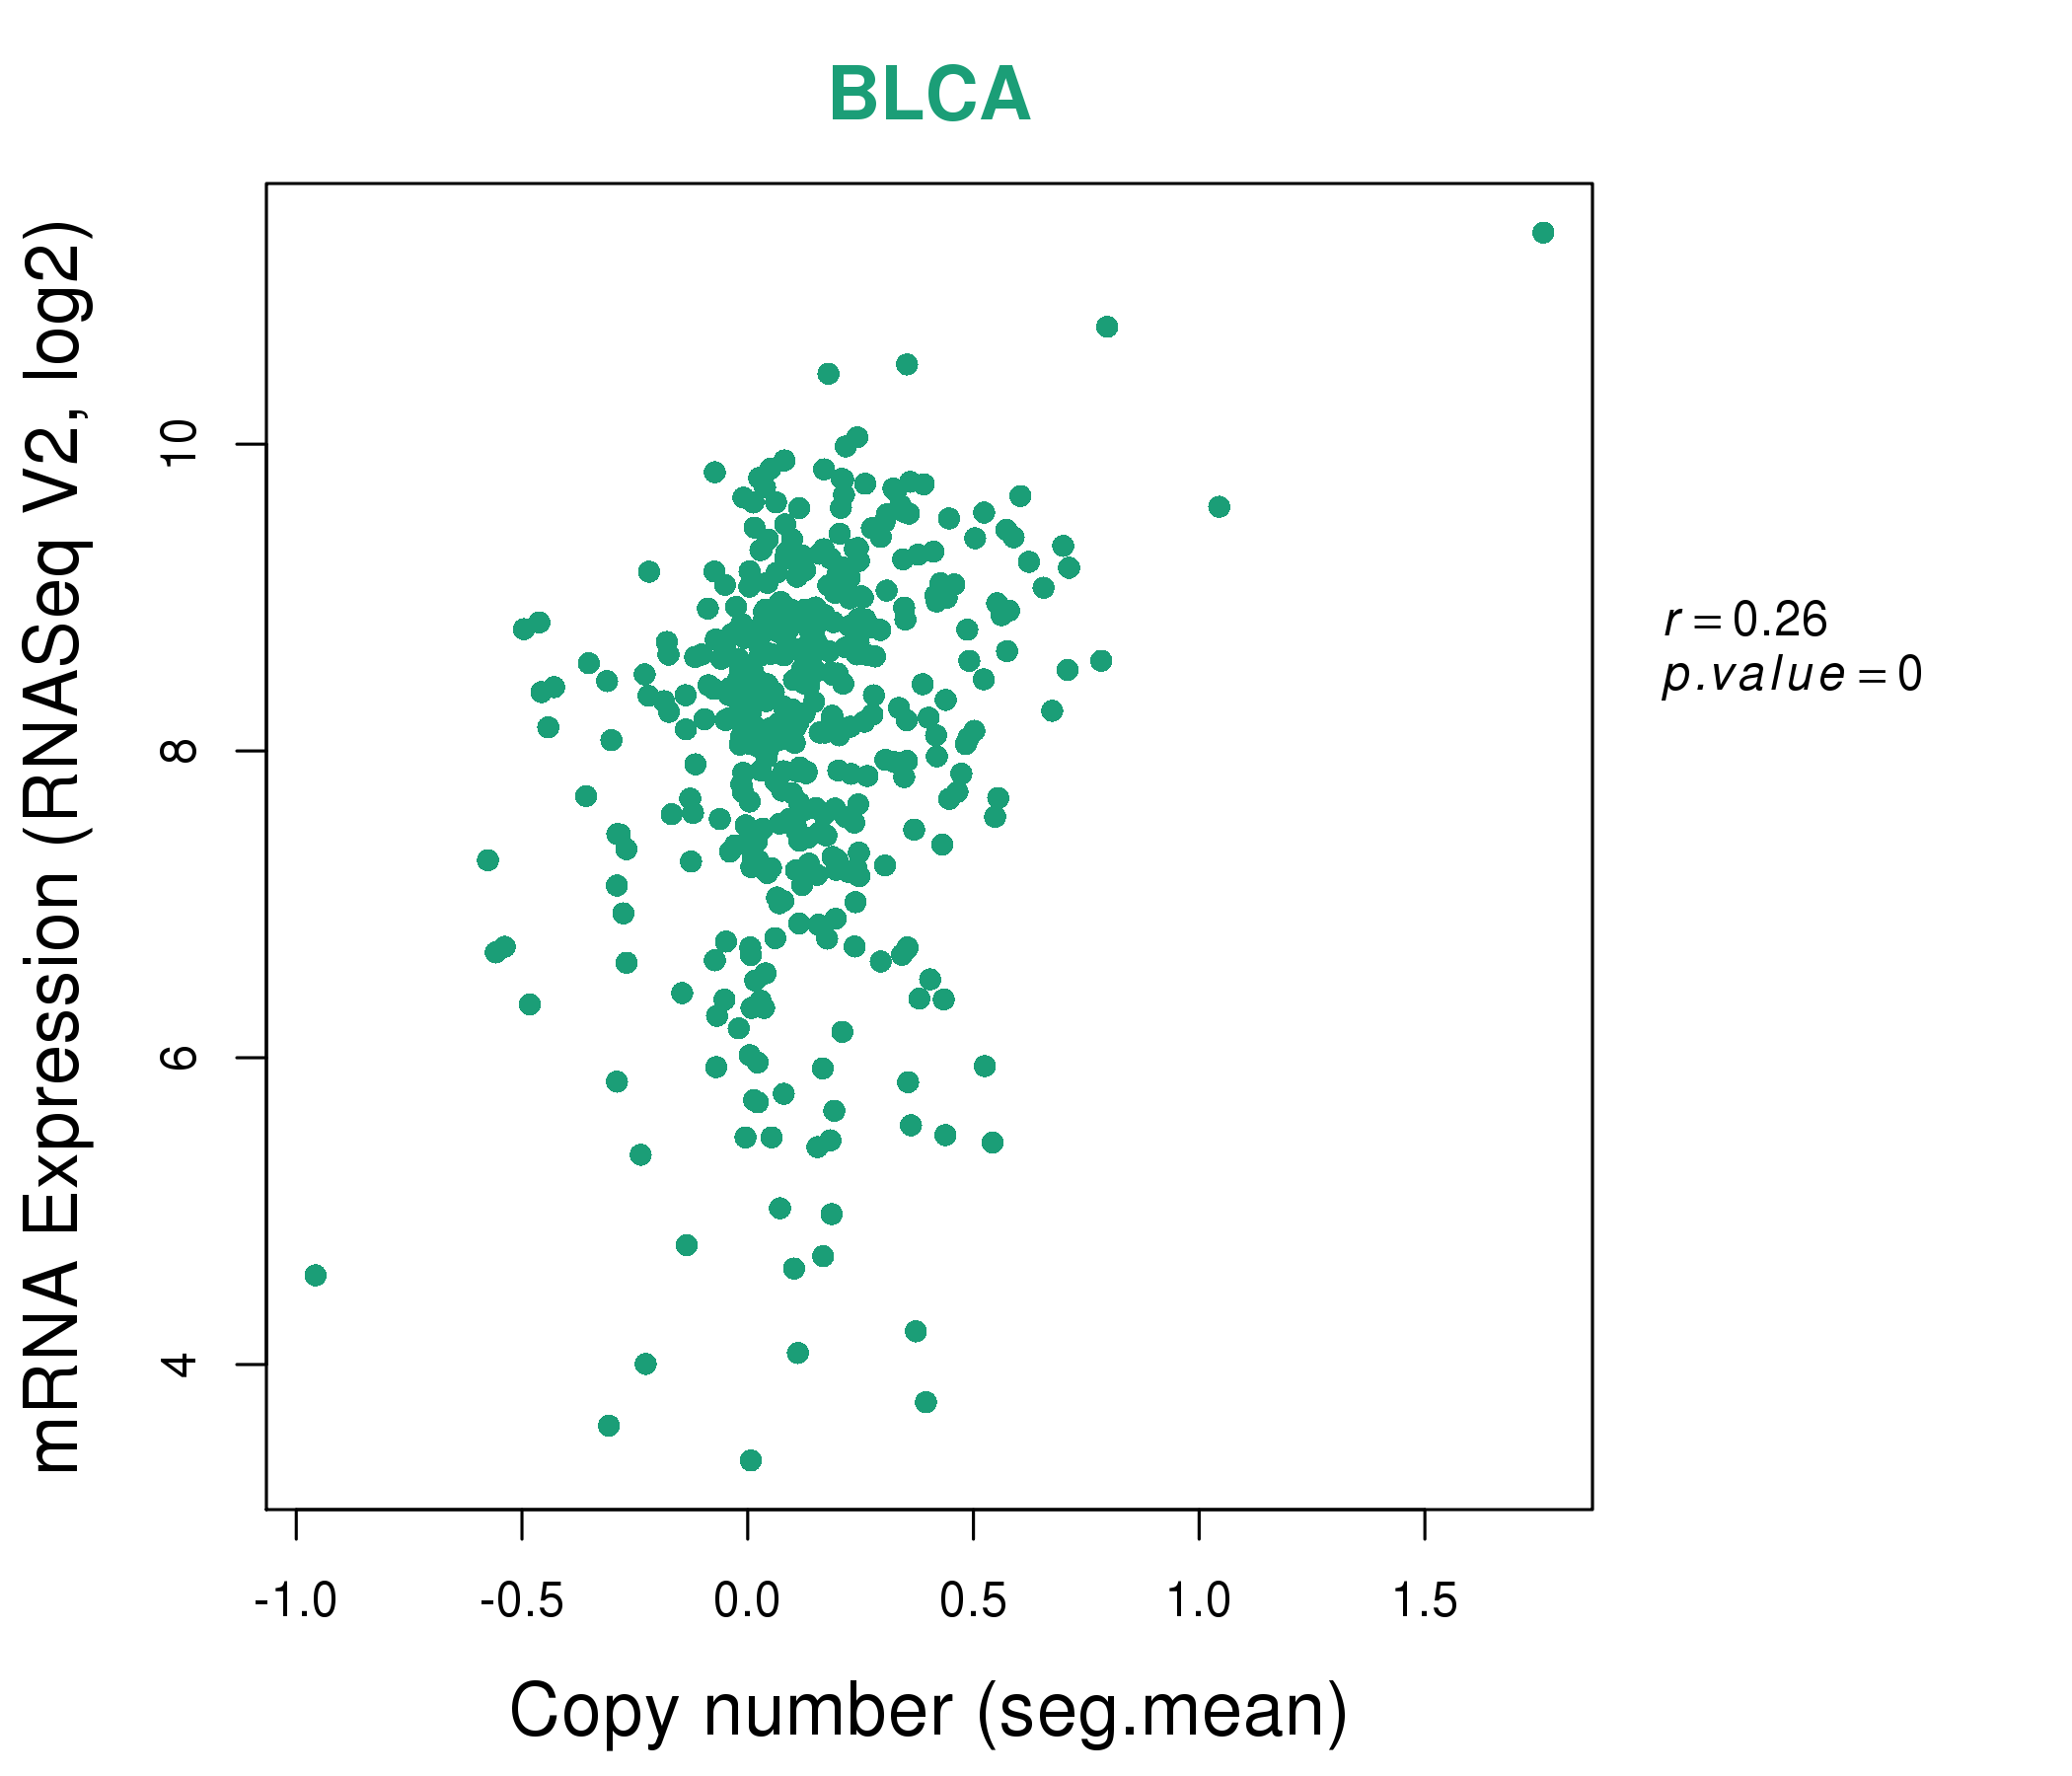
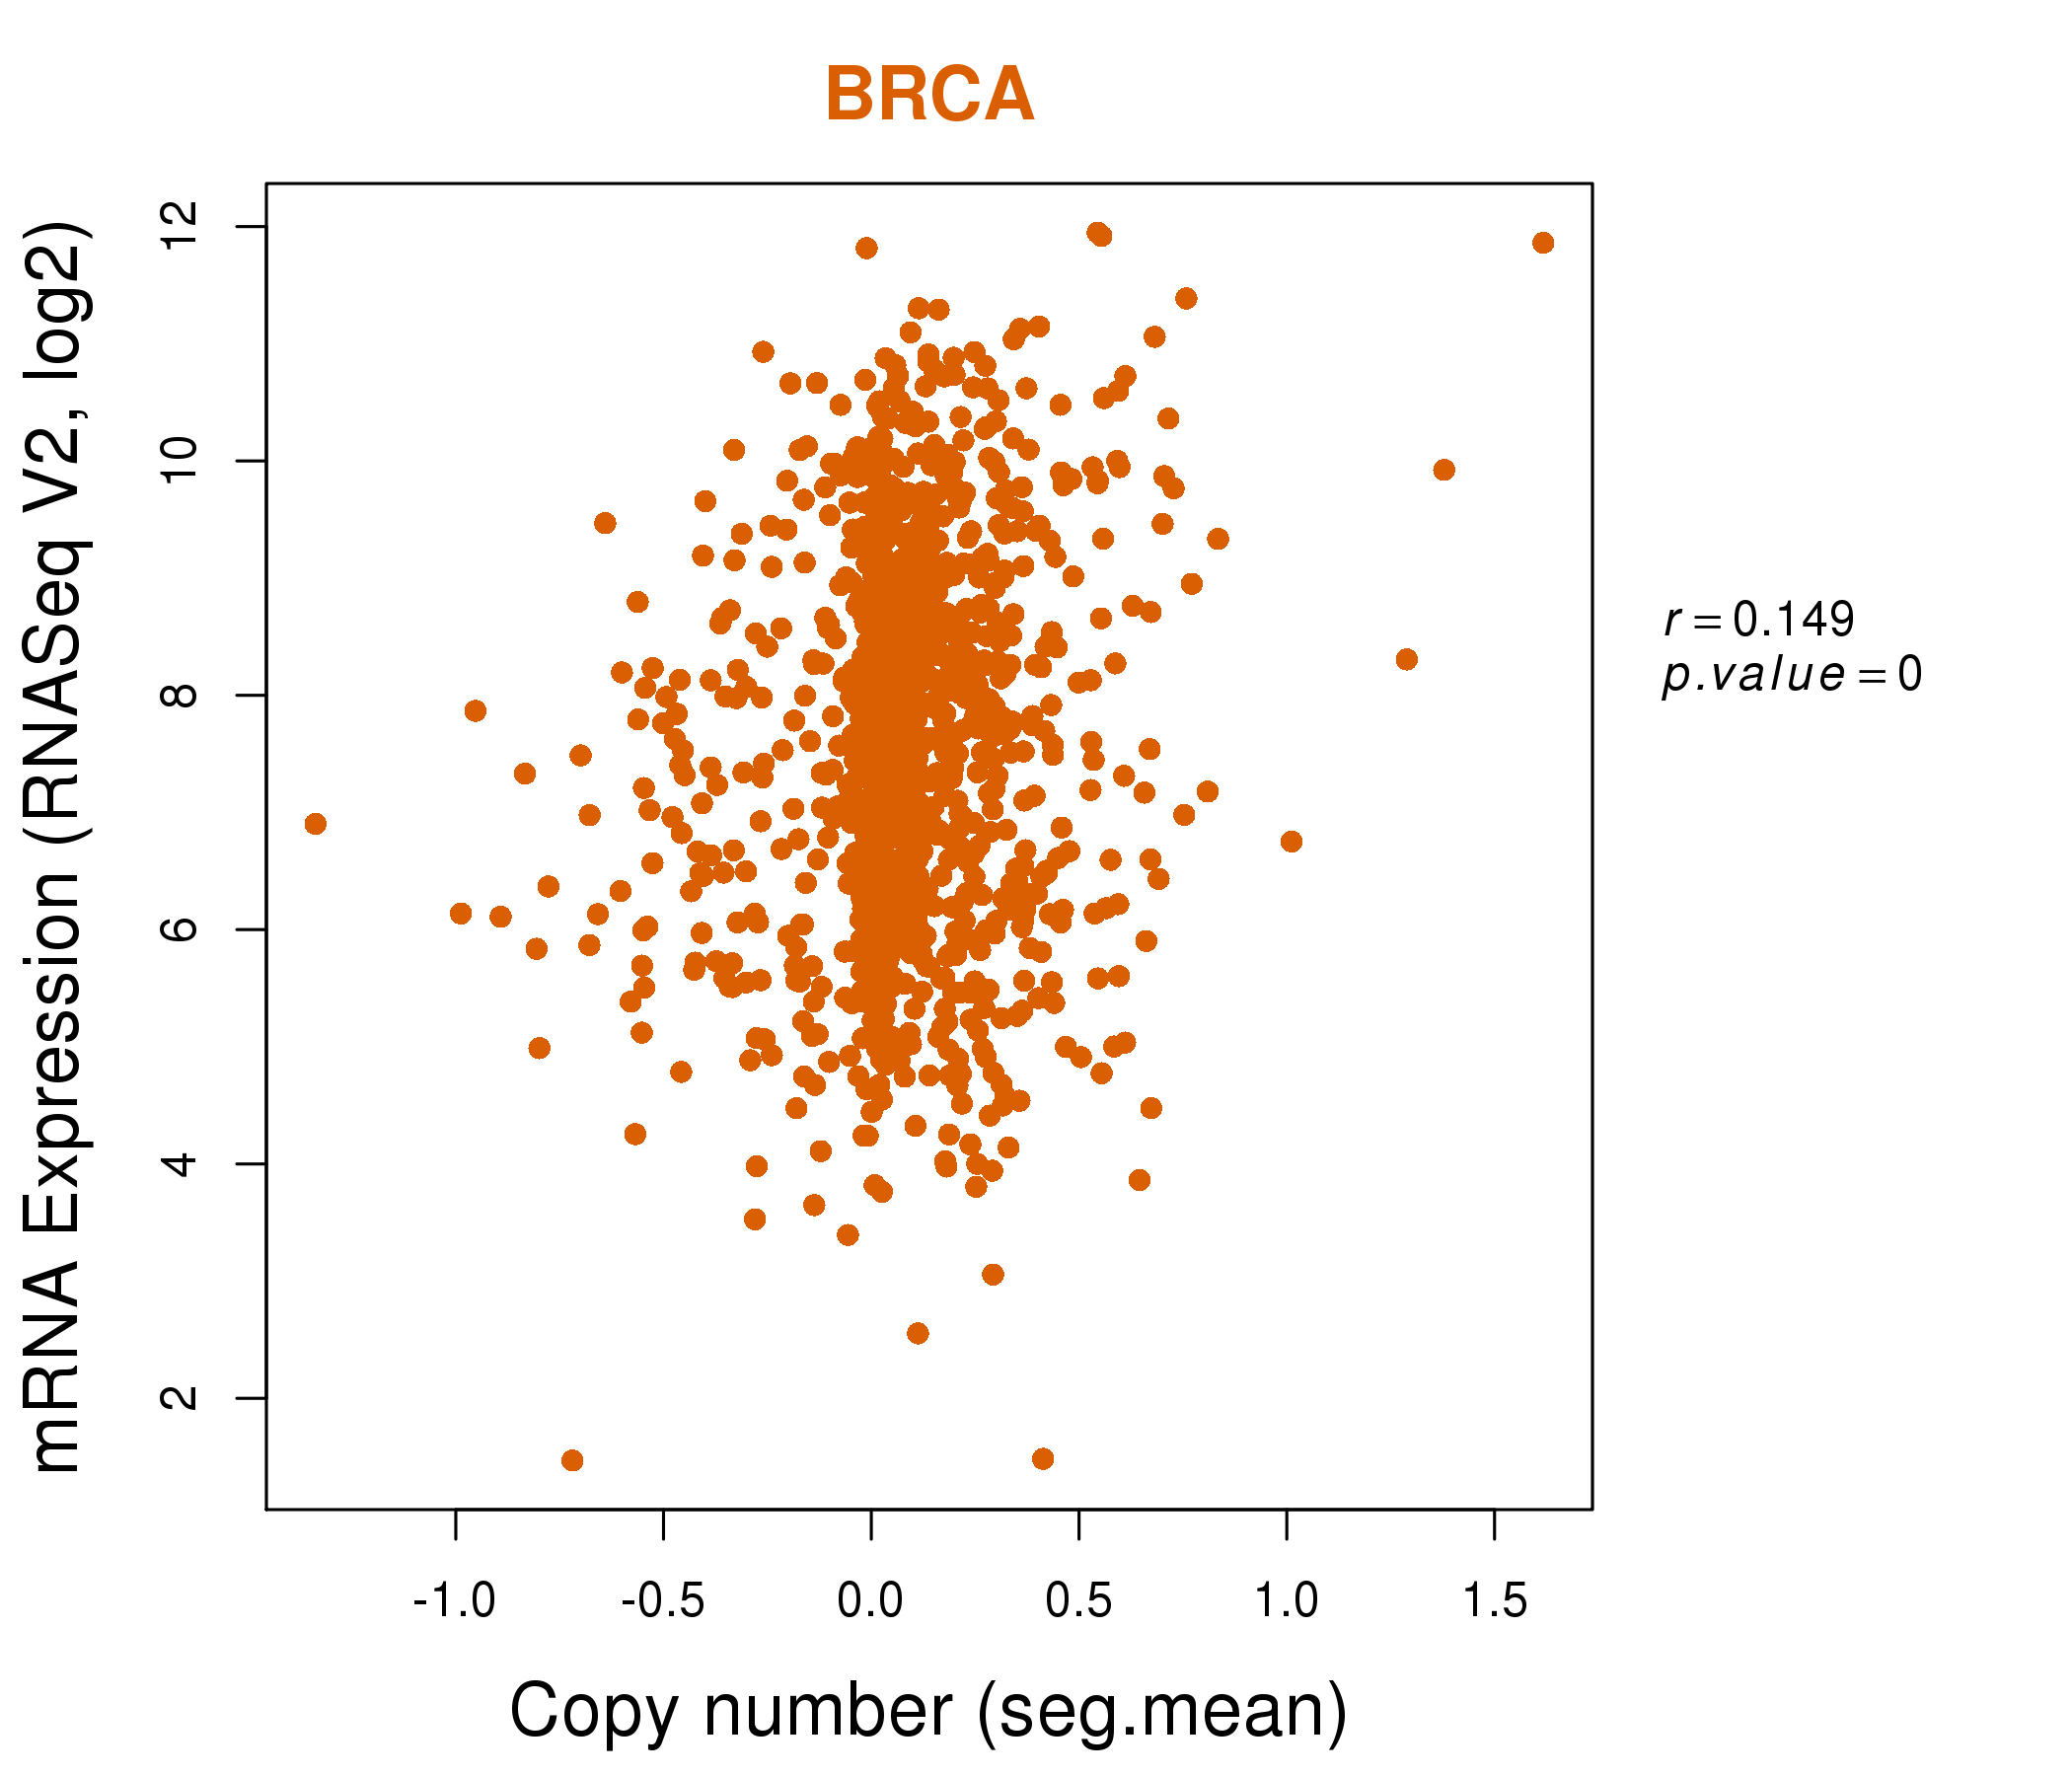
| * Copy number data were extracted from TCGA using R package TCGA-Assembler. The URLs of all public data files on TCGA DCC data server were gathered on Jan-05-2015. Function ProcessCNAData in TCGA-Assembler package was used to obtain gene-level copy number value which is calculated as the average copy number of the genomic region of a gene. |
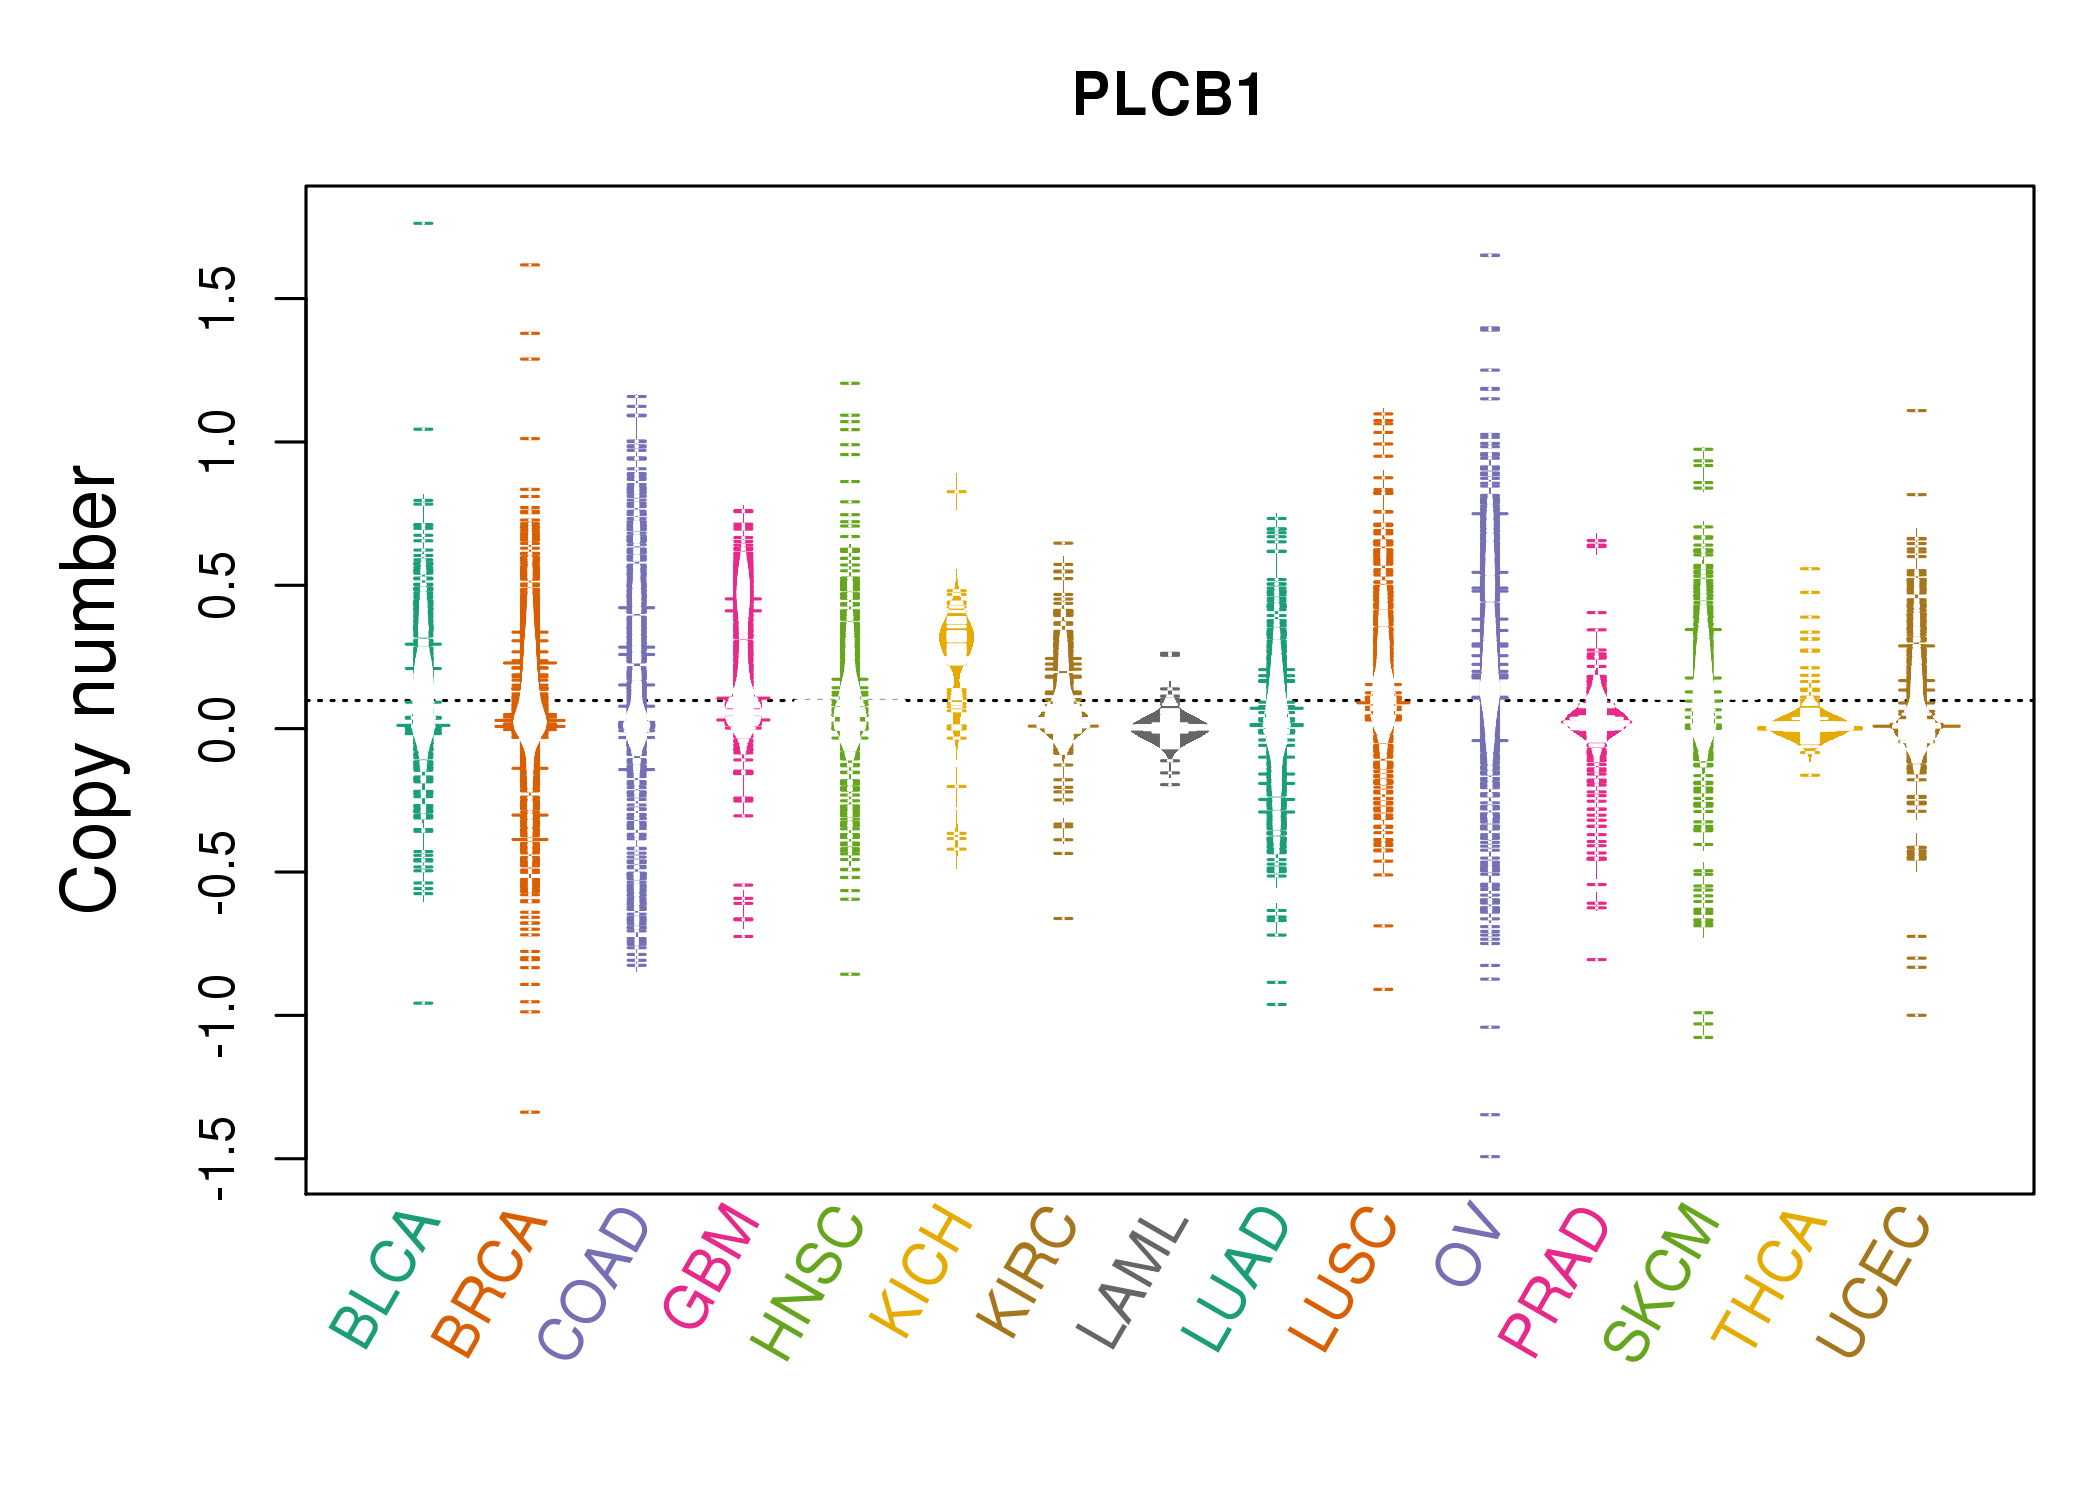 |
| cf) Tissue ID[Tissue type]: BLCA[Bladder Urothelial Carcinoma], BRCA[Breast invasive carcinoma], CESC[Cervical squamous cell carcinoma and endocervical adenocarcinoma], COAD[Colon adenocarcinoma], GBM[Glioblastoma multiforme], Glioma Low Grade, HNSC[Head and Neck squamous cell carcinoma], KICH[Kidney Chromophobe], KIRC[Kidney renal clear cell carcinoma], KIRP[Kidney renal papillary cell carcinoma], LAML[Acute Myeloid Leukemia], LUAD[Lung adenocarcinoma], LUSC[Lung squamous cell carcinoma], OV[Ovarian serous cystadenocarcinoma ], PAAD[Pancreatic adenocarcinoma], PRAD[Prostate adenocarcinoma], SKCM[Skin Cutaneous Melanoma], STAD[Stomach adenocarcinoma], THCA[Thyroid carcinoma], UCEC[Uterine Corpus Endometrial Carcinoma] |
| Top |
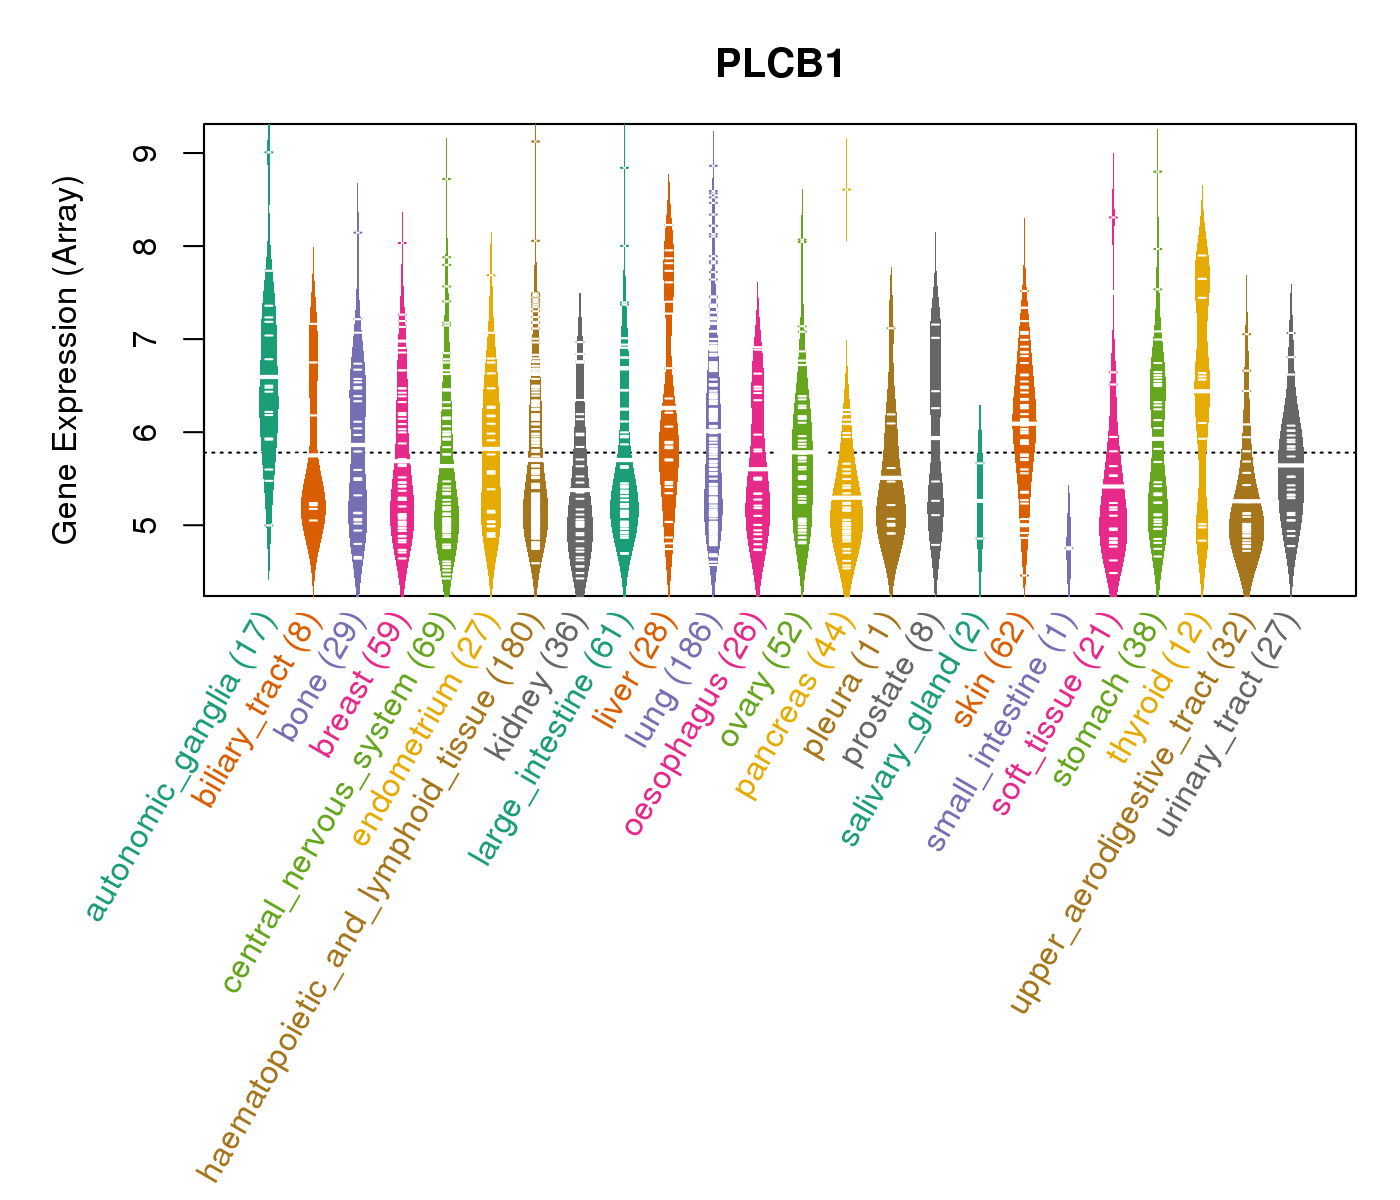
| Gene Expression for PLCB1 |
| * CCLE gene expression data were extracted from CCLE_Expression_Entrez_2012-10-18.res: Gene-centric RMA-normalized mRNA expression data. |
 |
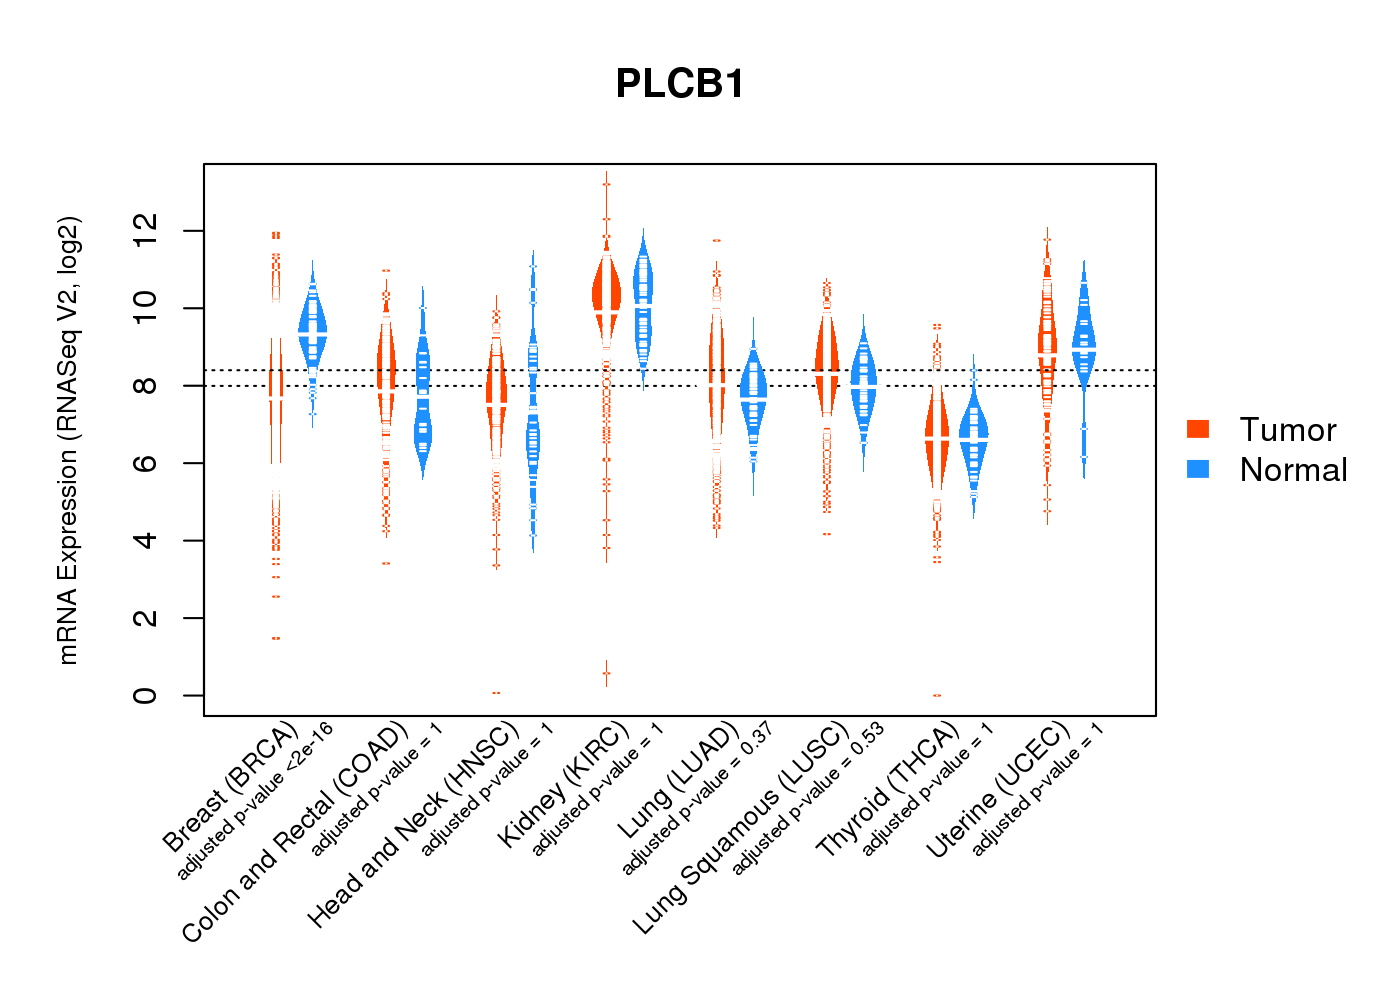
| * Normalized gene expression data of RNASeqV2 was extracted from TCGA using R package TCGA-Assembler. The URLs of all public data files on TCGA DCC data server were gathered at Jan-05-2015. Only eight cancer types have enough normal control samples for differential expression analysis. (t test, adjusted p<0.05 (using Benjamini-Hochberg FDR)) |
 |
| Top |
| * This plots show the correlation between CNV and gene expression. |
: Open all plots for all cancer types
 |
|
 |
|

| Top |
| Gene-Gene Network Information |
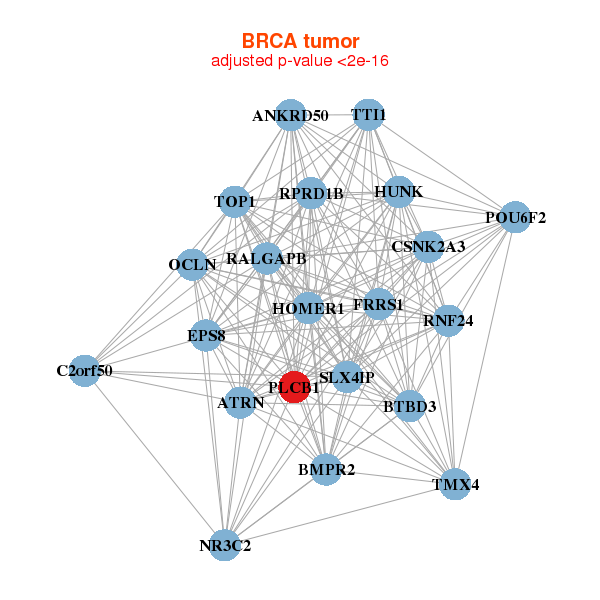
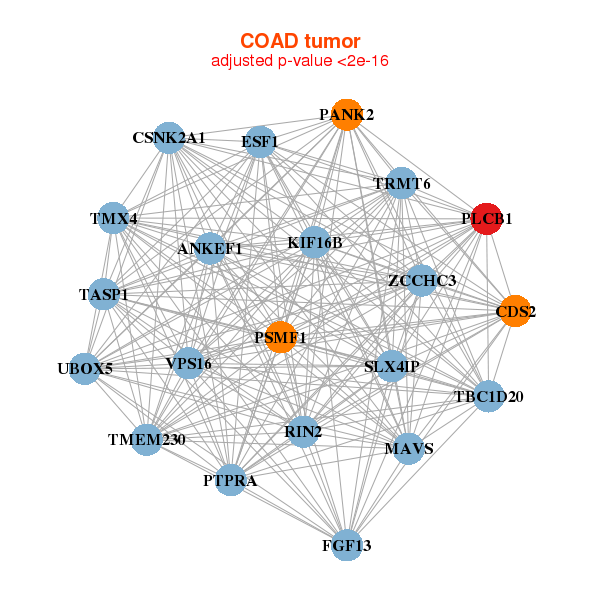
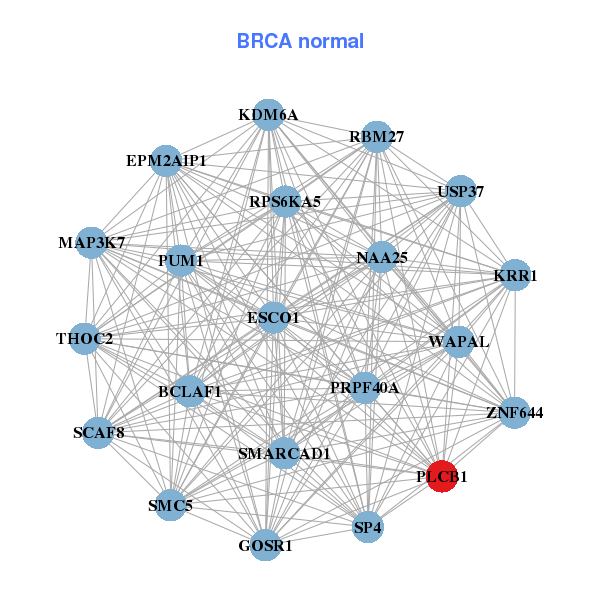
| * Co-Expression network figures were drawn using R package igraph. Only the top 20 genes with the highest correlations were shown. Red circle: input gene, orange circle: cell metabolism gene, sky circle: other gene |
: Open all plots for all cancer types
 |
| ||||
| ANKRD50,ATRN,BMPR2,BTBD3,SLX4IP,C2orf50,CSNK2A3, EPS8,FRRS1,HOMER1,HUNK,TTI1,NR3C2,OCLN, PLCB1,POU6F2,RALGAPB,RNF24,RPRD1B,TMX4,TOP1 | BCLAF1,EPM2AIP1,ESCO1,GOSR1,KDM6A,KRR1,MAP3K7, NAA25,PLCB1,PRPF40A,PUM1,SCAF8,RBM27,RPS6KA5, SMARCAD1,SMC5,SP4,THOC2,USP37,WAPAL,ZNF644 | ||||
 |
| ||||
| ANKEF1,TMEM230,SLX4IP,CDS2,CSNK2A1,ESF1,FGF13, KIF16B,MAVS,PANK2,PLCB1,PSMF1,PTPRA,RIN2, TASP1,TBC1D20,TMX4,TRMT6,UBOX5,VPS16,ZCCHC3 | C16orf45,FAXC,CLIP4,DIXDC1,DPYSL3,DZIP1,EHBP1, EPM2A,GPM6A,NECAB1,NEGR1,PLCB1,RAB11FIP2,RBPMS2, RHOJ,SCD5,SDPR,SMARCA1,SPARCL1,STON1,ZAK |
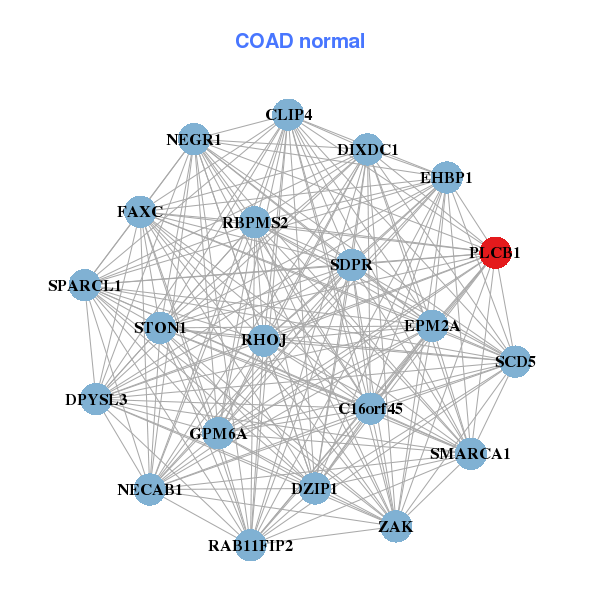
| * Co-Expression network figures were drawn using R package igraph. Only the top 20 genes with the highest correlations were shown. Red circle: input gene, orange circle: cell metabolism gene, sky circle: other gene |
: Open all plots for all cancer types
| Top |
: Open all interacting genes' information including KEGG pathway for all interacting genes from DAVID
| Top |
| Pharmacological Information for PLCB1 |
| DB Category | DB Name | DB's ID and Url link |
| Chemistry | BindingDB | Q9NQ66; -. |
| Chemistry | ChEMBL | CHEMBL4034; -. |
| Chemistry | BindingDB | Q9NQ66; -. |
| Chemistry | ChEMBL | CHEMBL4034; -. |
| Organism-specific databases | PharmGKB | PA33384; -. |
| Organism-specific databases | PharmGKB | PA33384; -. |
| Organism-specific databases | CTD | 23236; -. |
| Organism-specific databases | CTD | 23236; -. |
| * Gene Centered Interaction Network. |
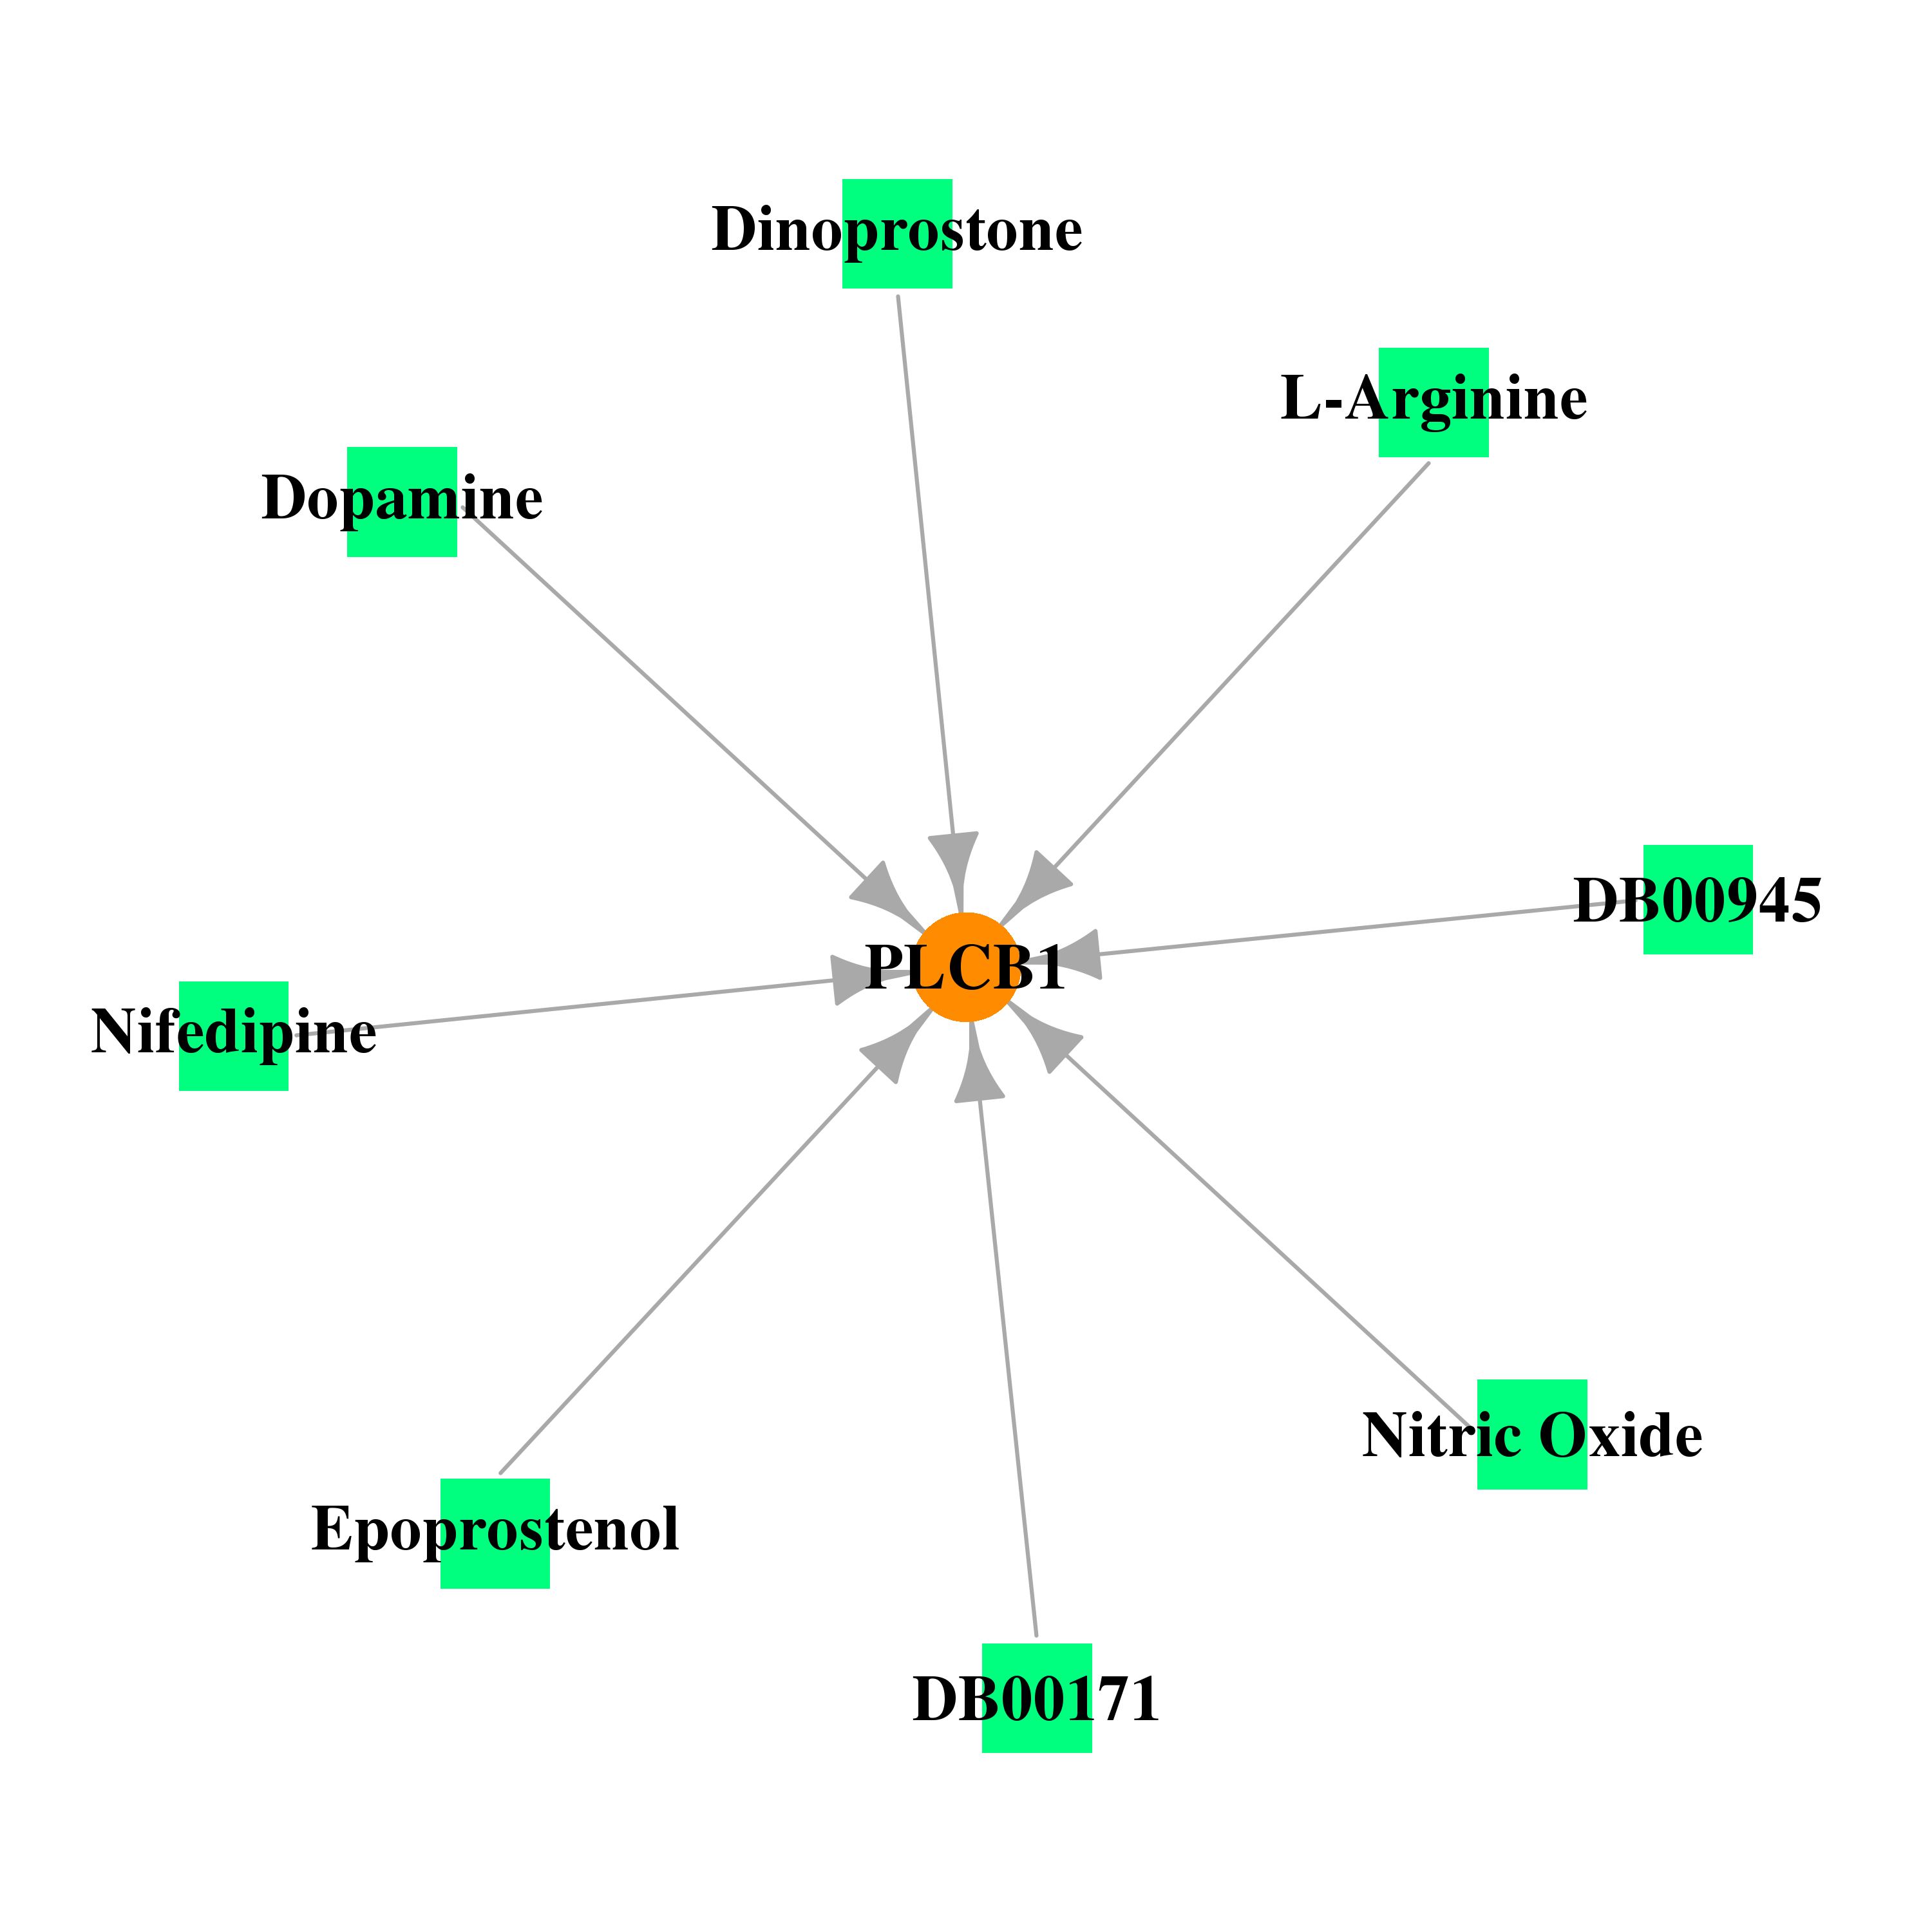 |
| * Drug Centered Interaction Network. |
| DrugBank ID | Target Name | Drug Groups | Generic Name | Drug Centered Network | Drug Structure |
| DB00945 | phospholipase C, beta 1 (phosphoinositide-specific) | approved | Acetylsalicylic acid | 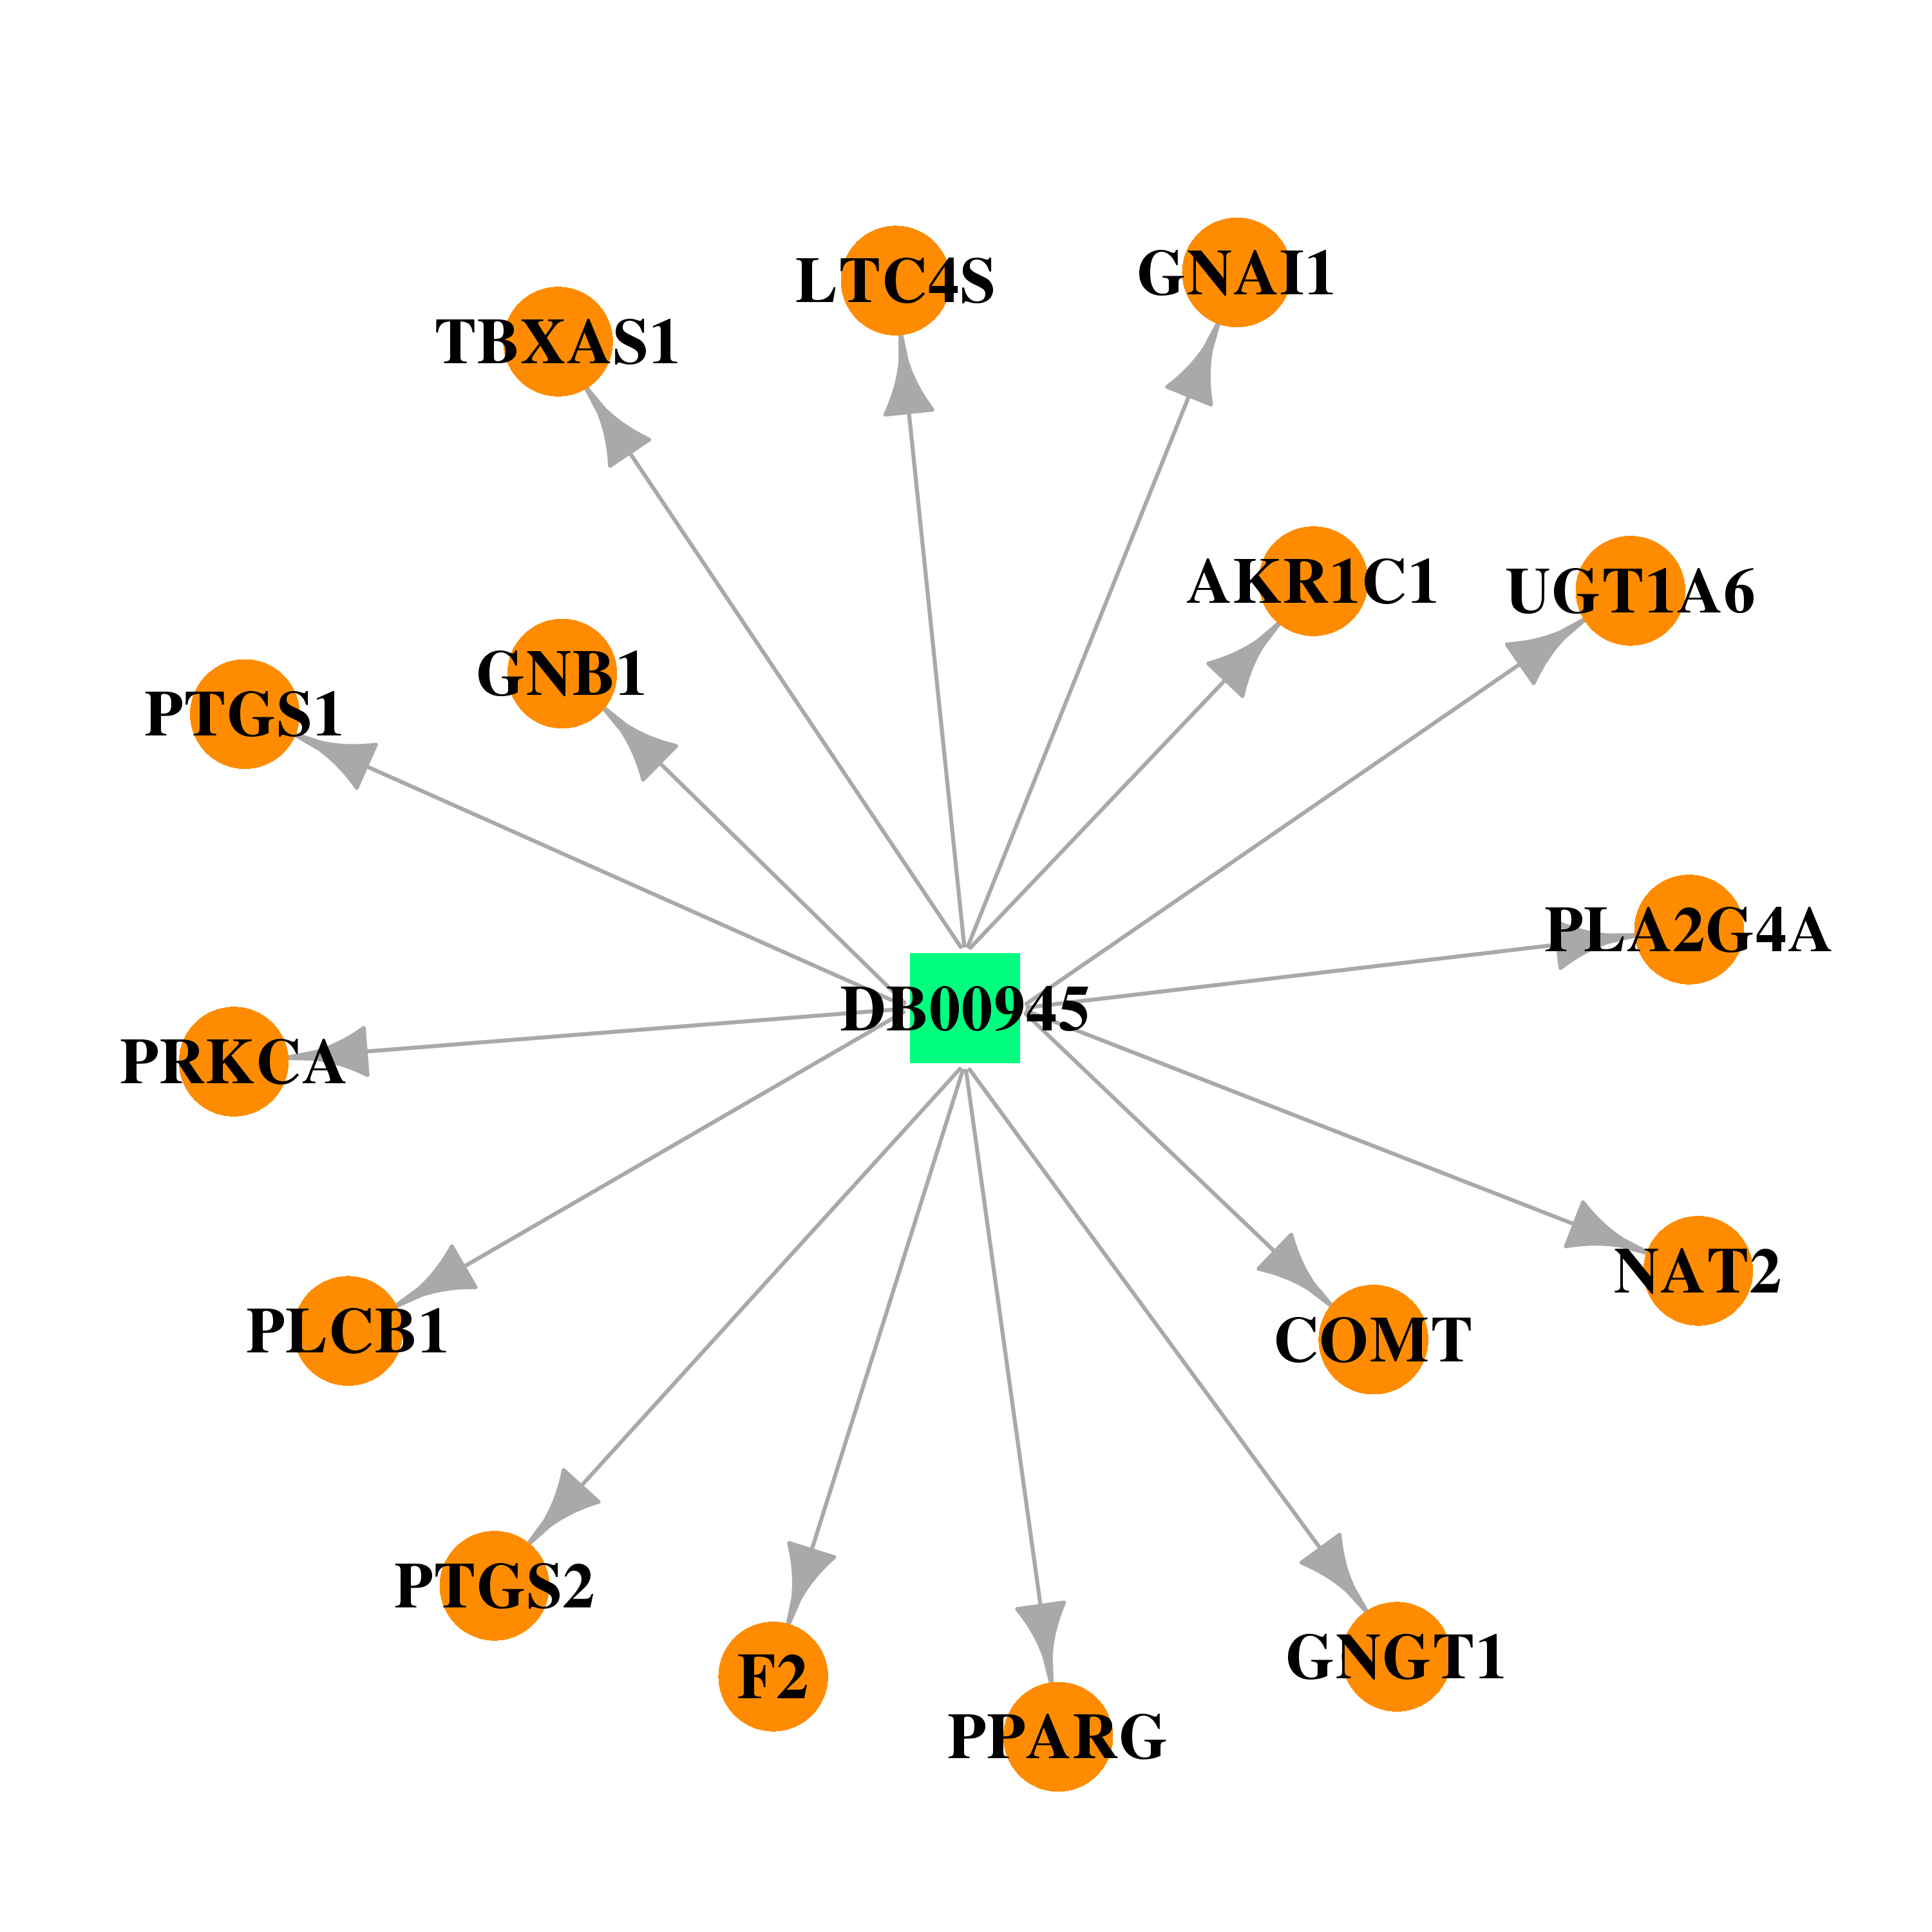 | 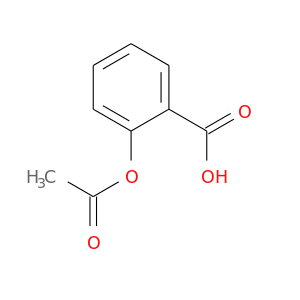 |
| DB00125 | phospholipase C, beta 1 (phosphoinositide-specific) | approved; nutraceutical | L-Arginine |  |  |
| DB00435 | phospholipase C, beta 1 (phosphoinositide-specific) | approved | Nitric Oxide | 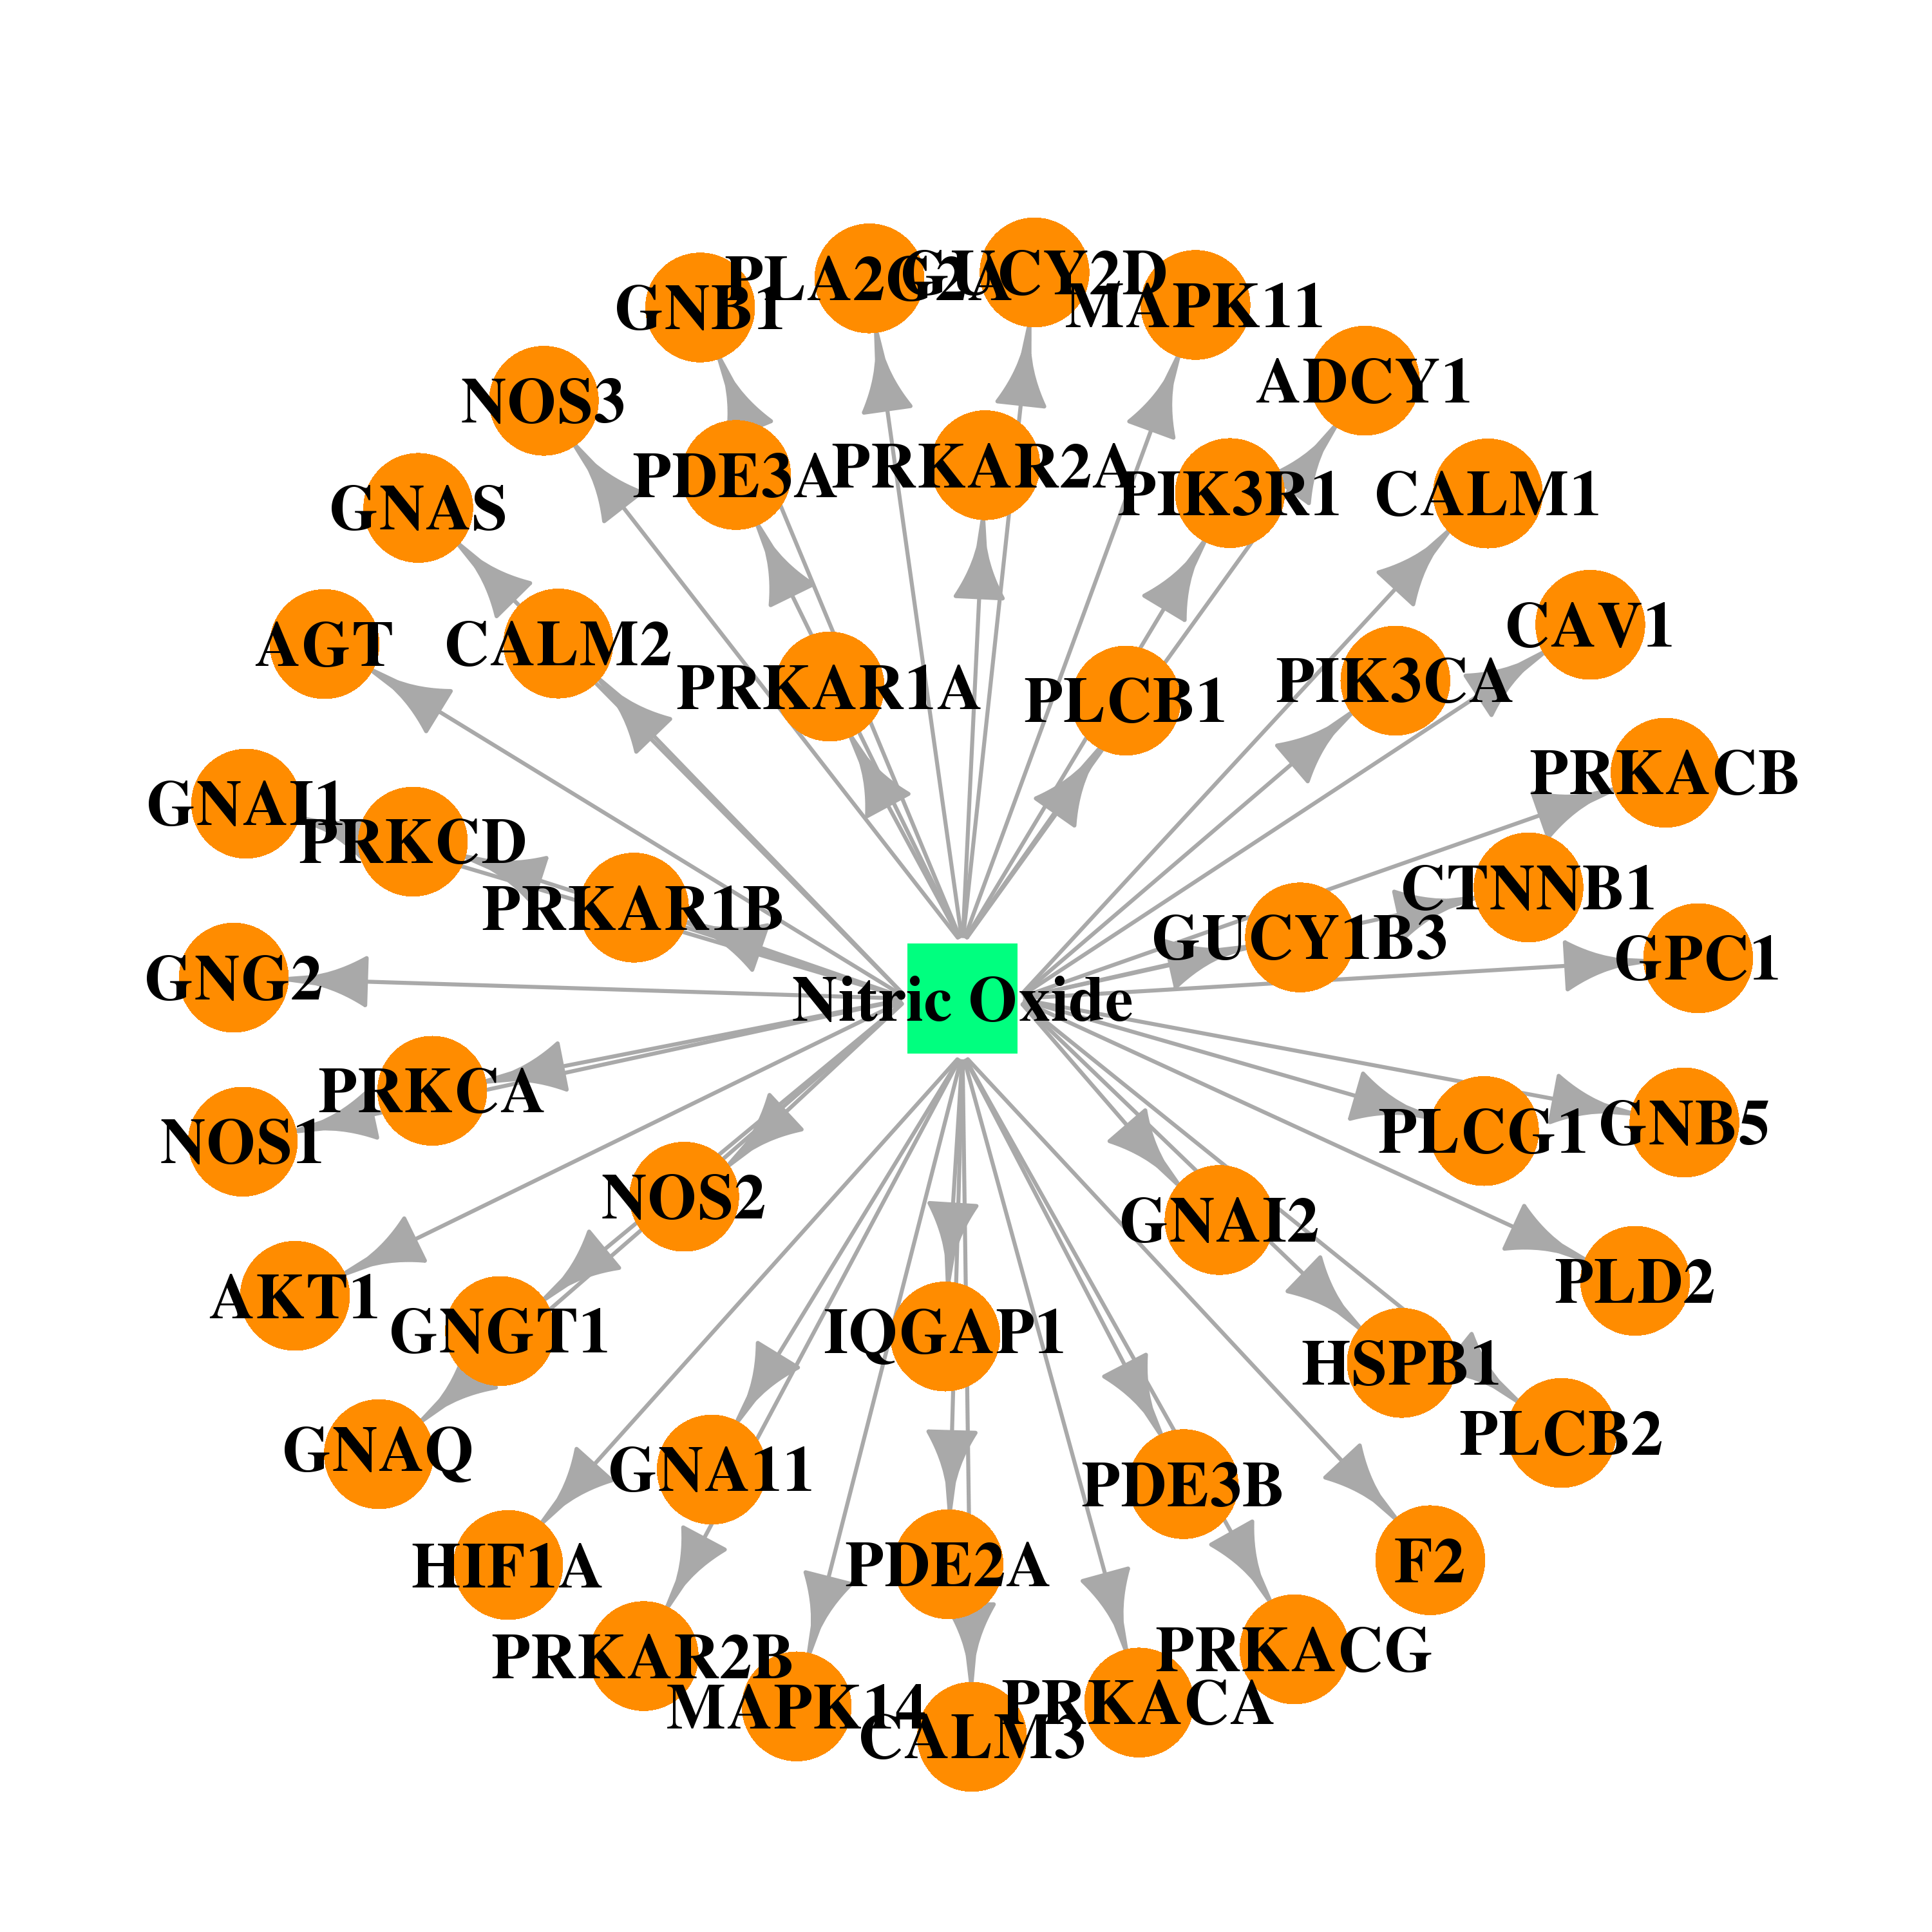 |  |
| DB00171 | phospholipase C, beta 1 (phosphoinositide-specific) | approved; nutraceutical | Adenosine triphosphate |  |  |
| DB00988 | phospholipase C, beta 1 (phosphoinositide-specific) | approved | Dopamine | 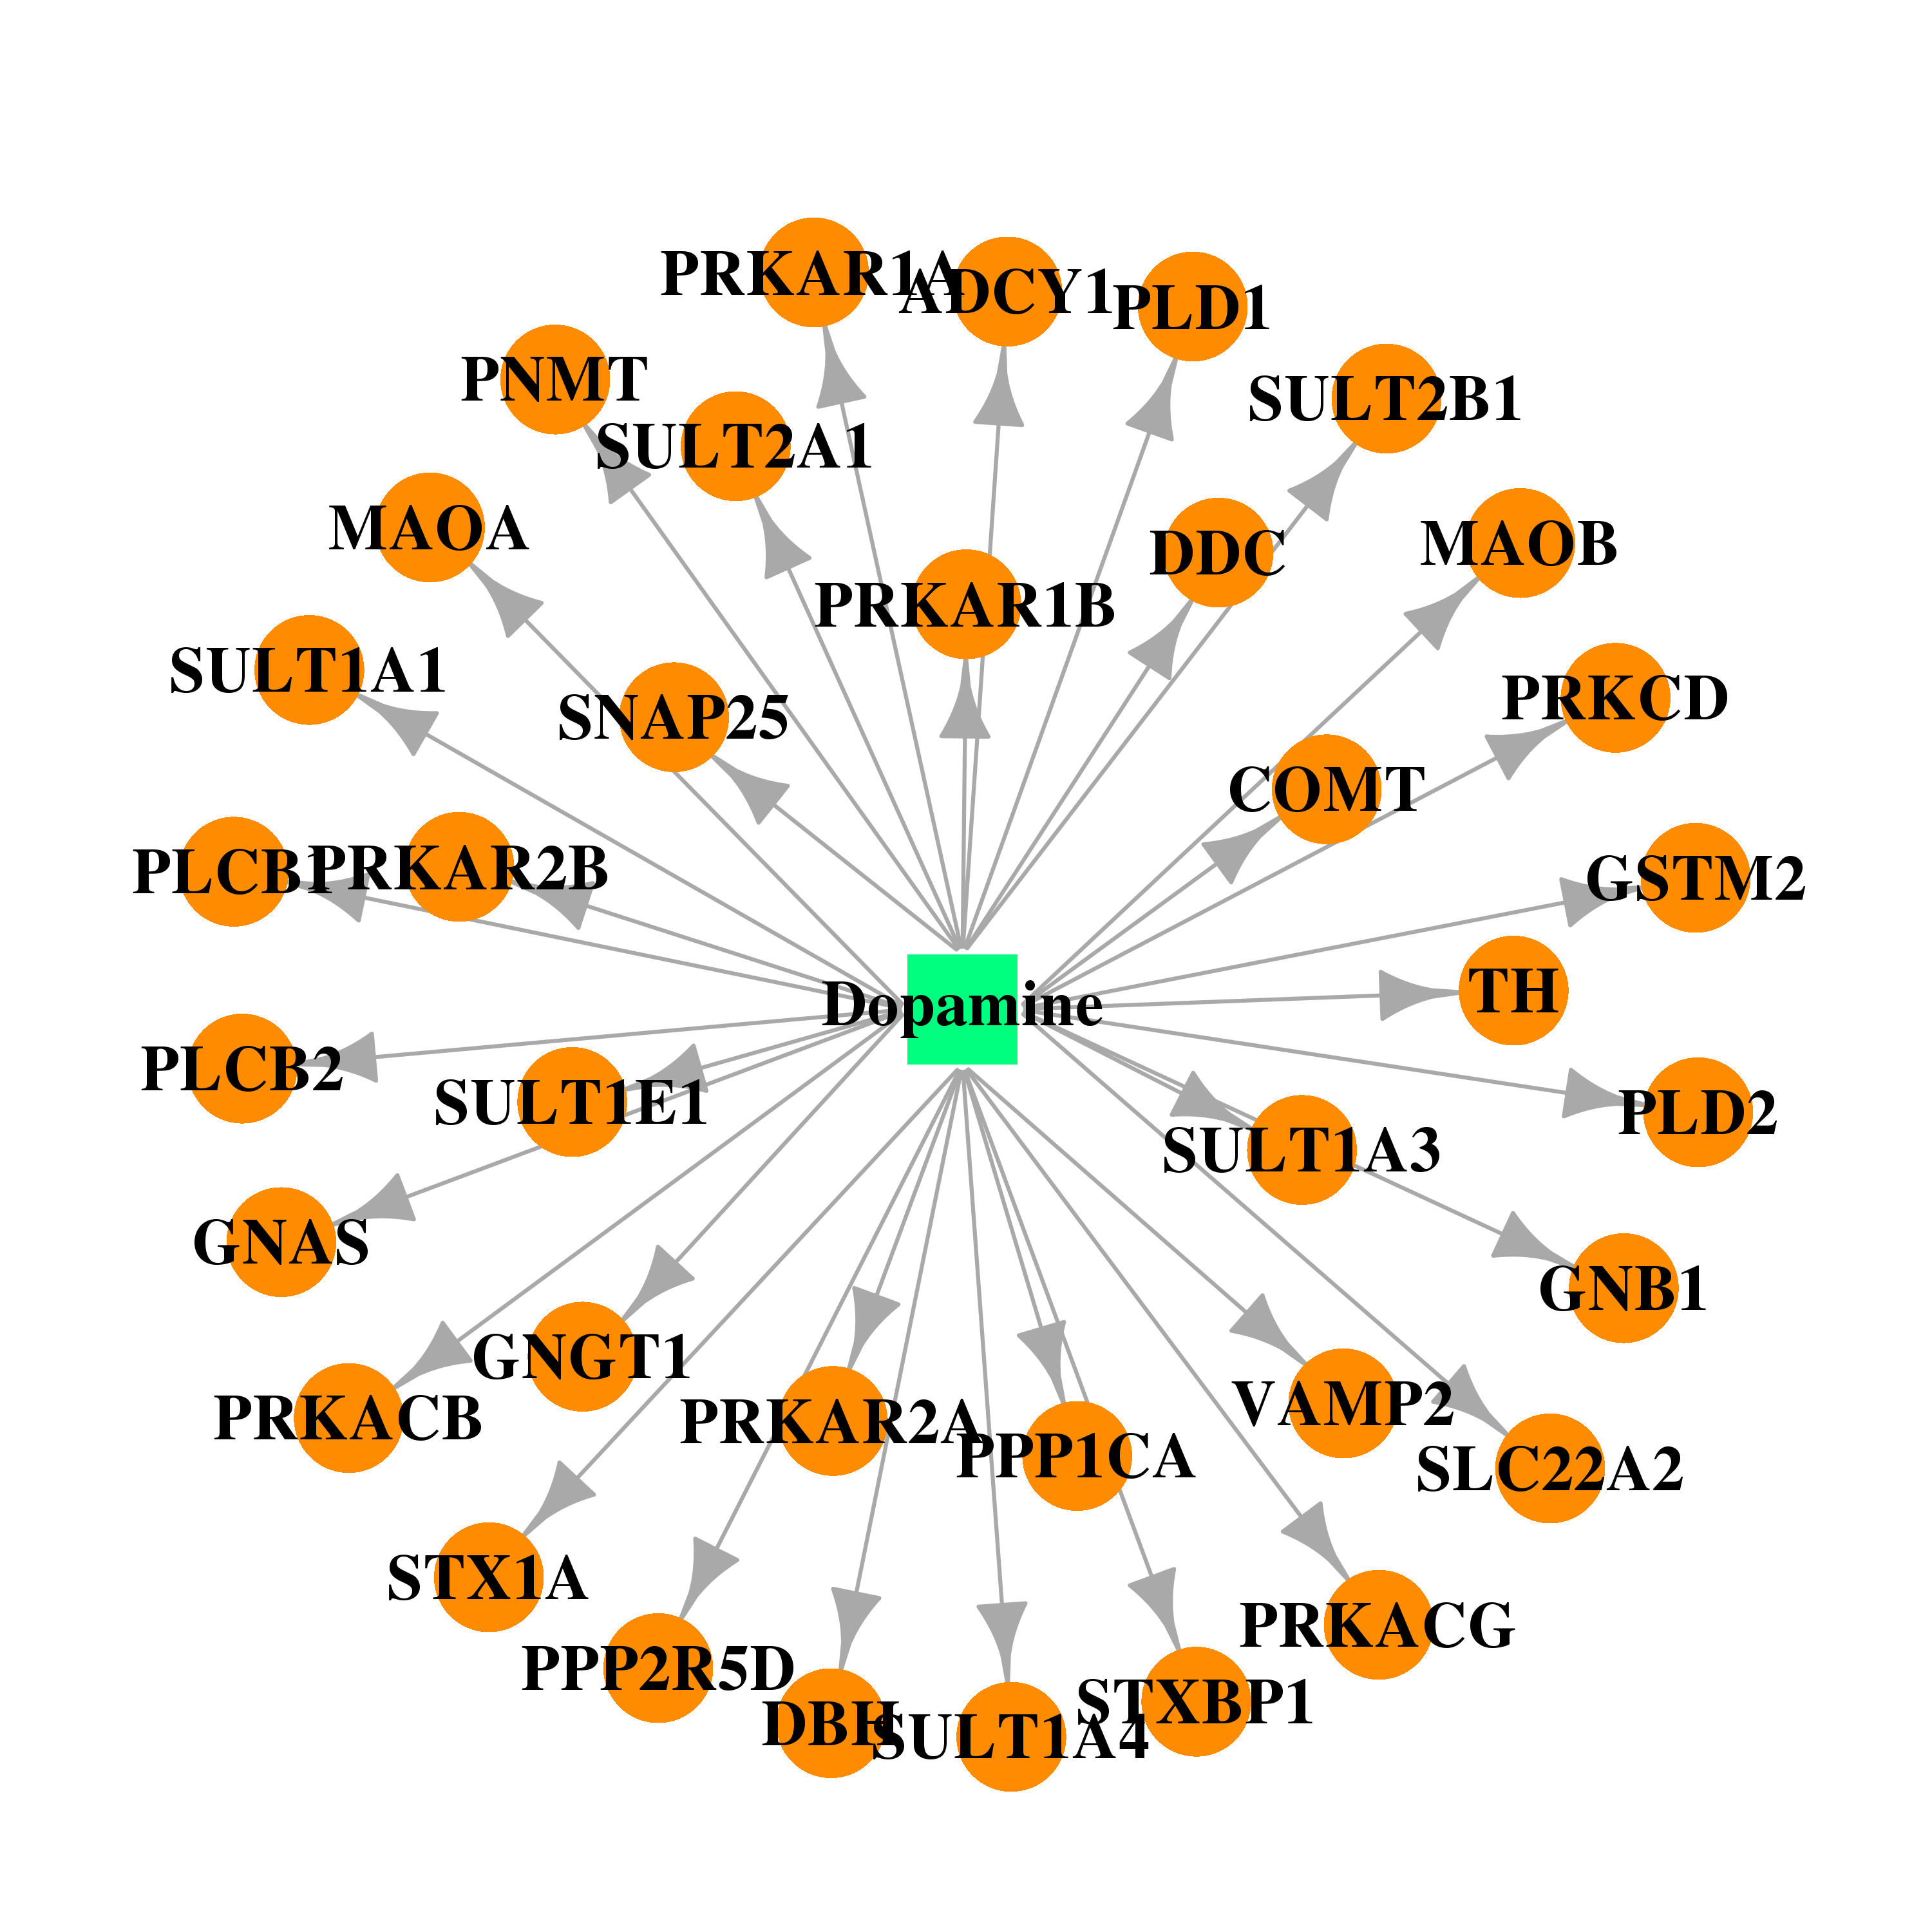 |  |
| DB00917 | phospholipase C, beta 1 (phosphoinositide-specific) | approved | Dinoprostone | 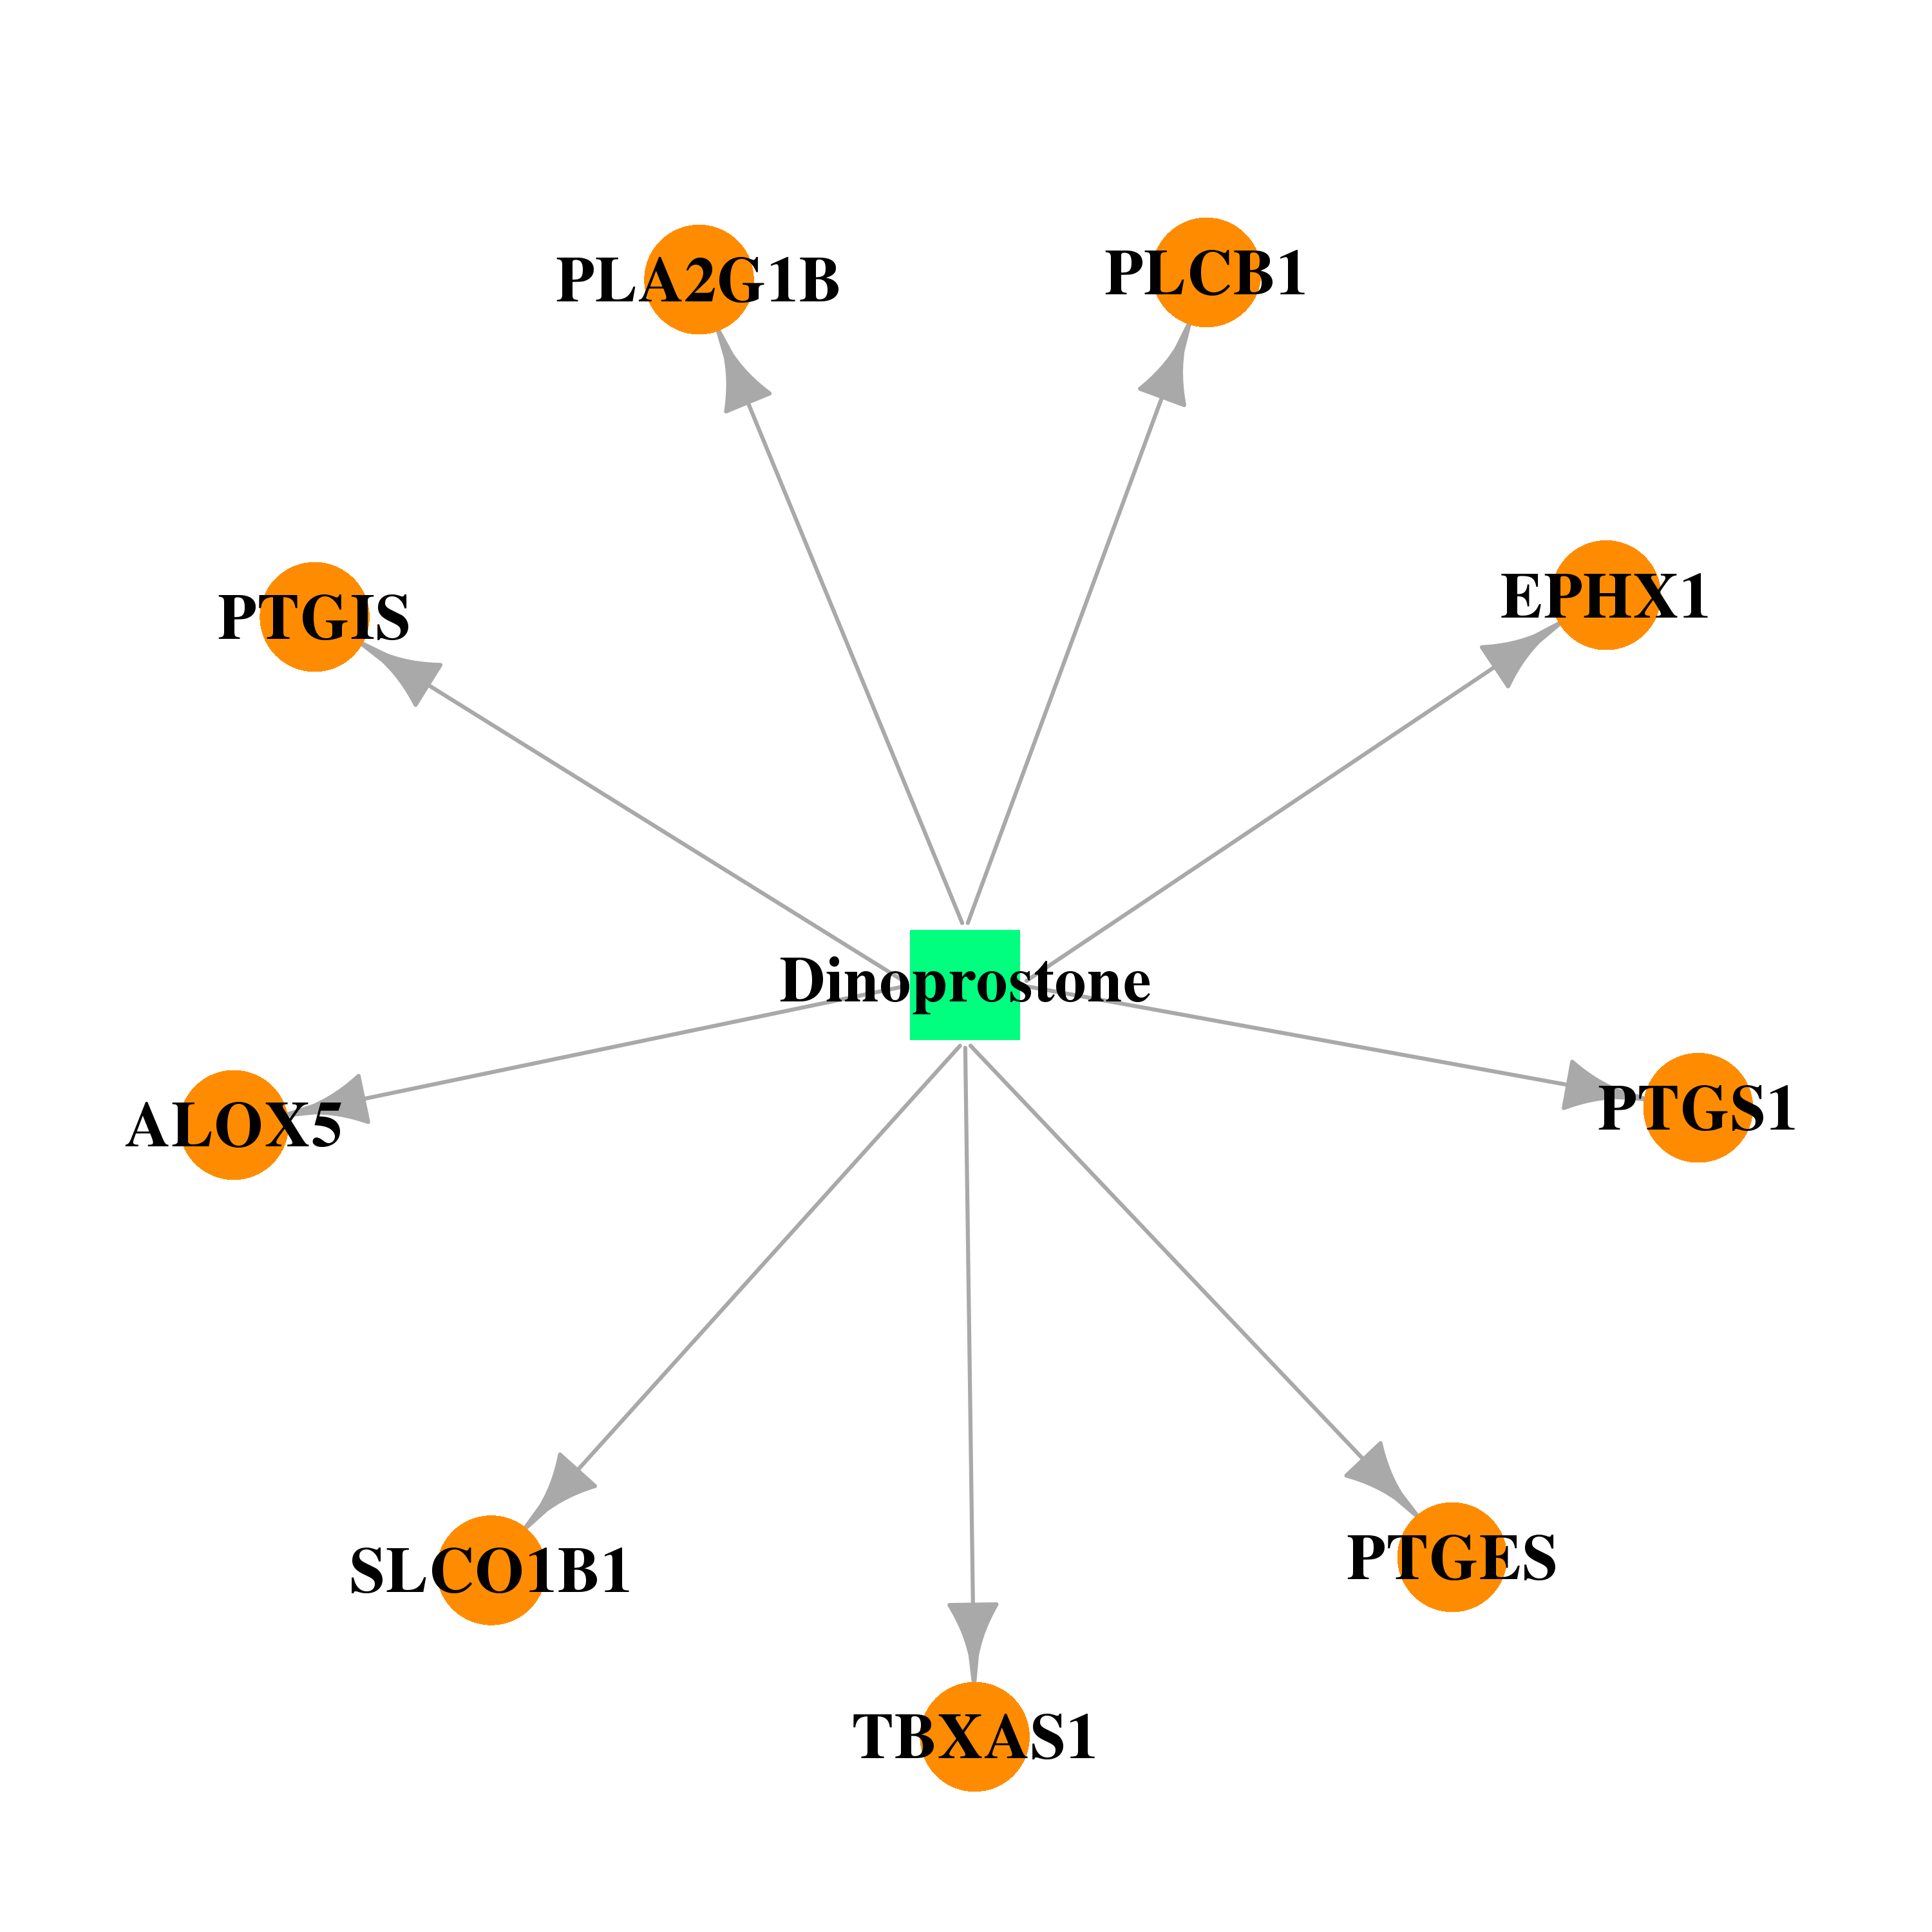 |  |
| DB01240 | phospholipase C, beta 1 (phosphoinositide-specific) | approved | Epoprostenol | 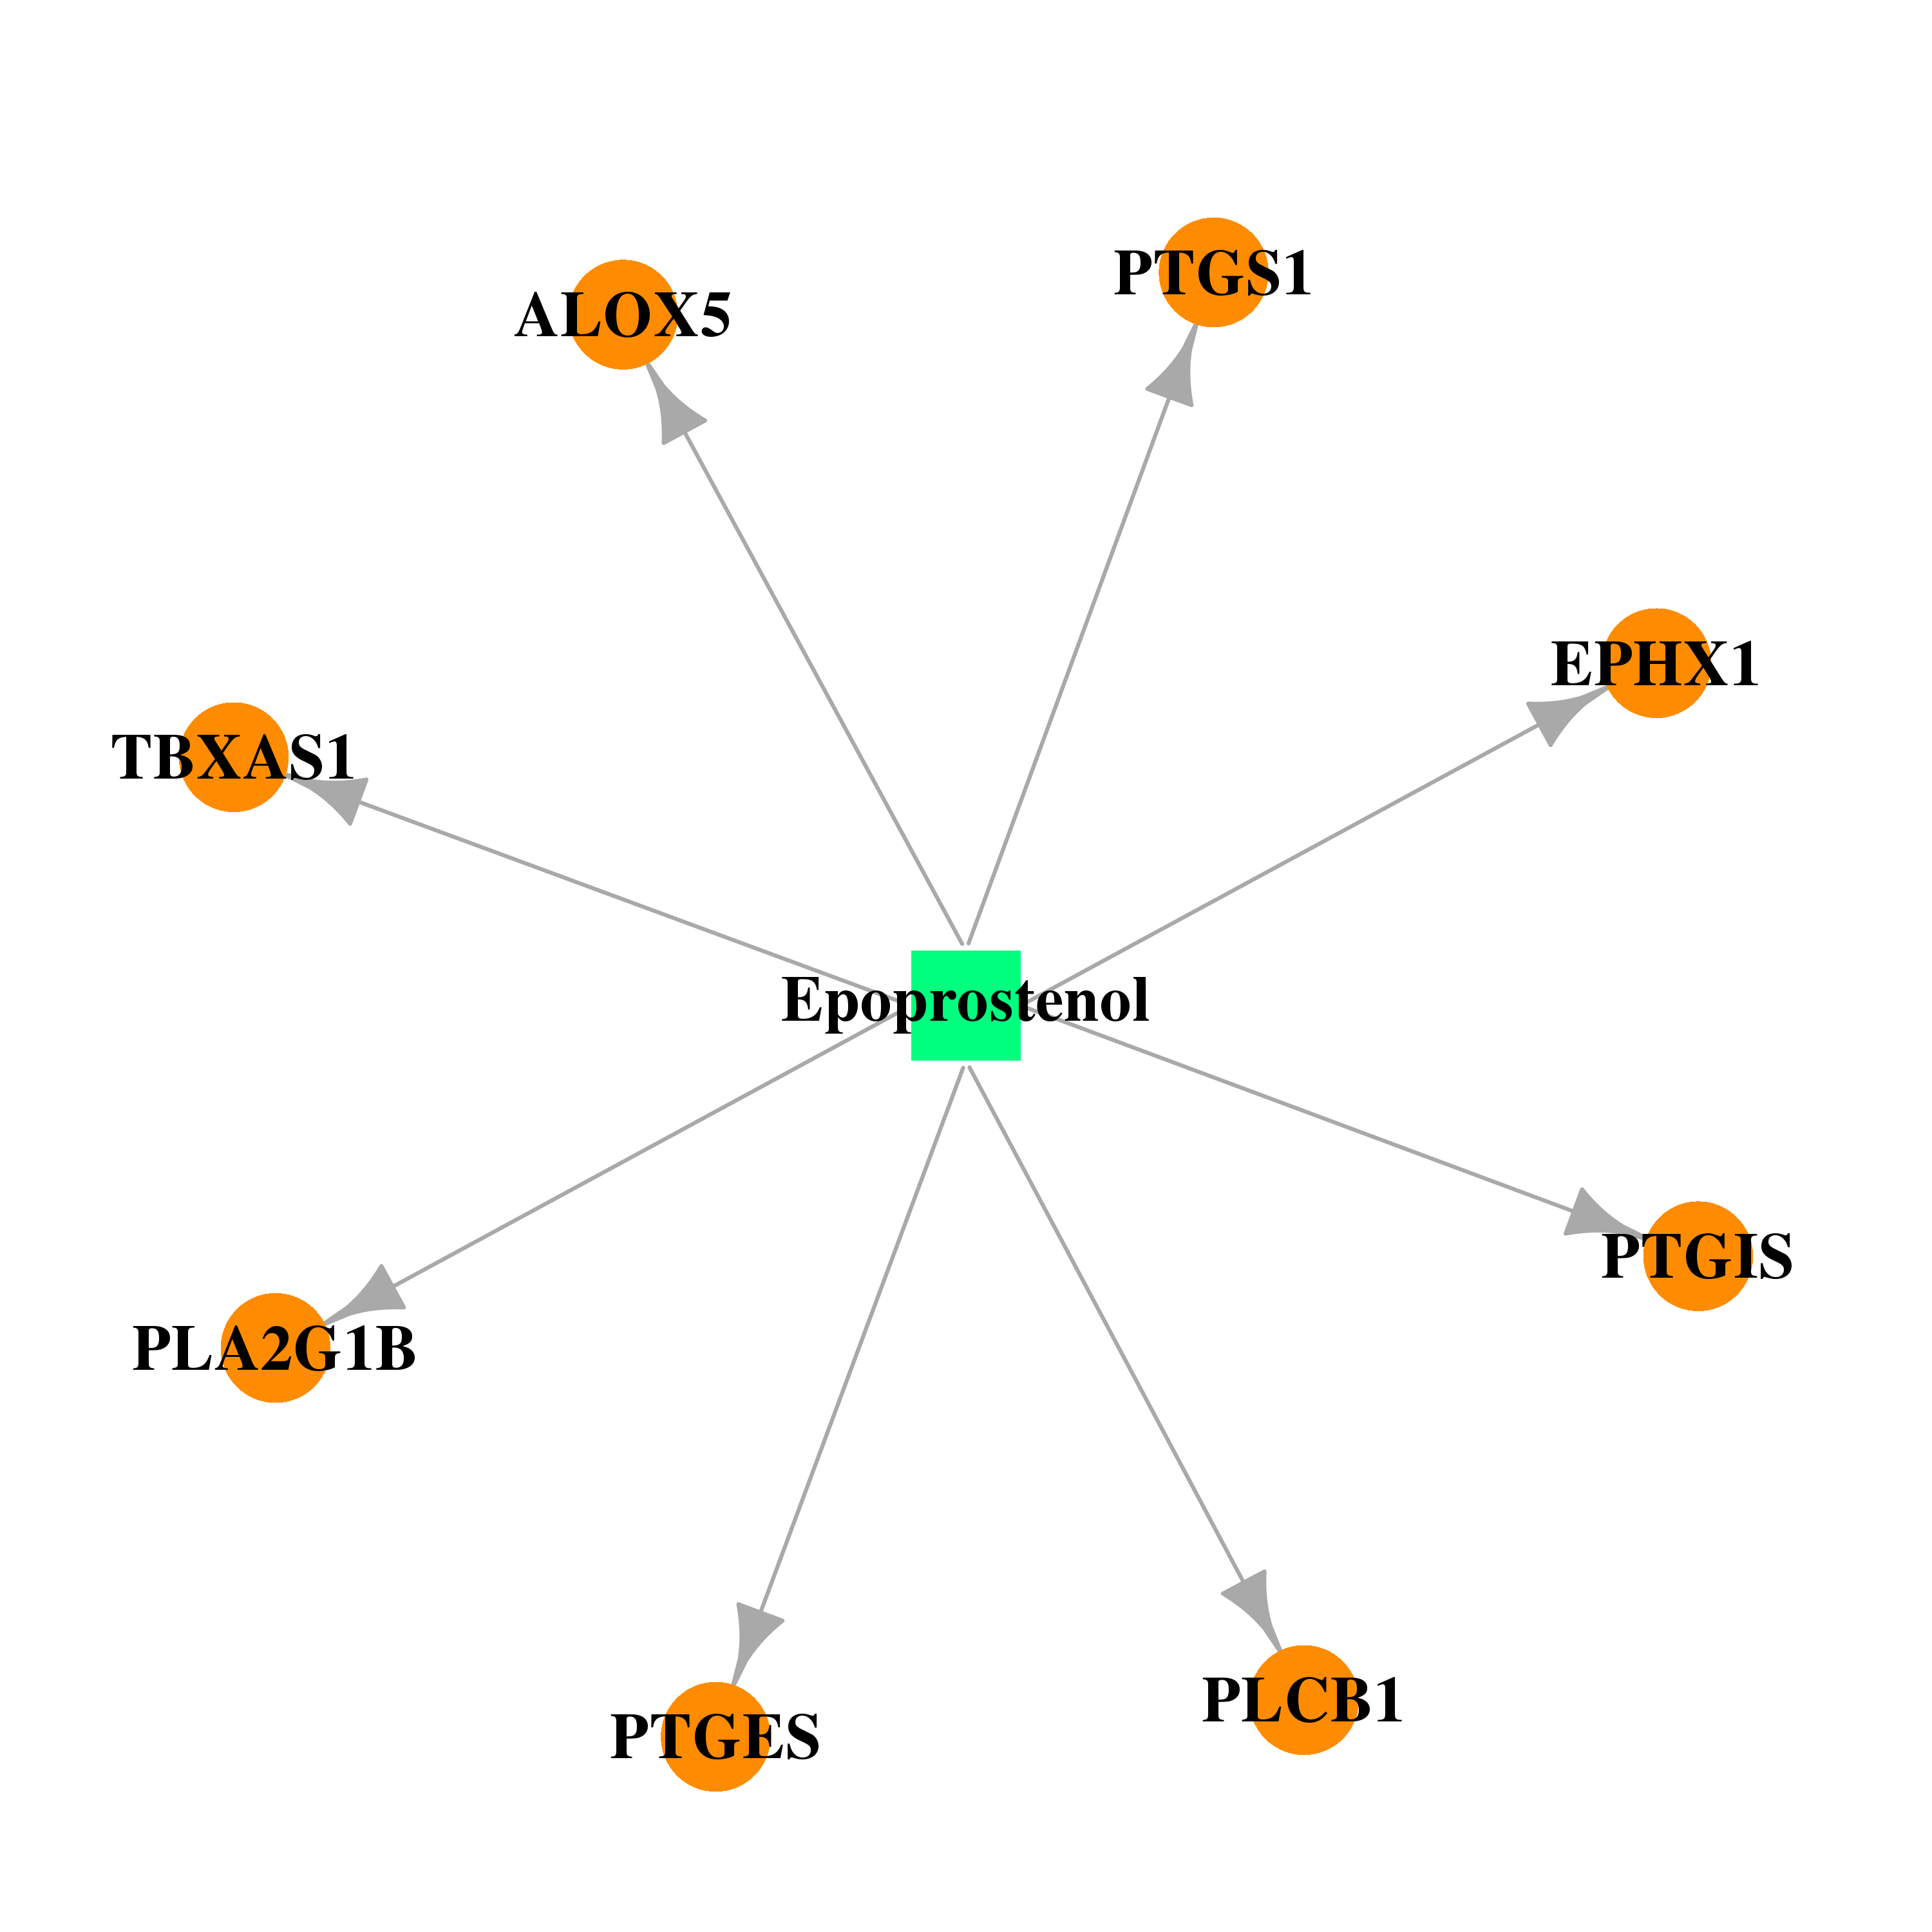 |  |
| DB01115 | phospholipase C, beta 1 (phosphoinositide-specific) | approved | Nifedipine | 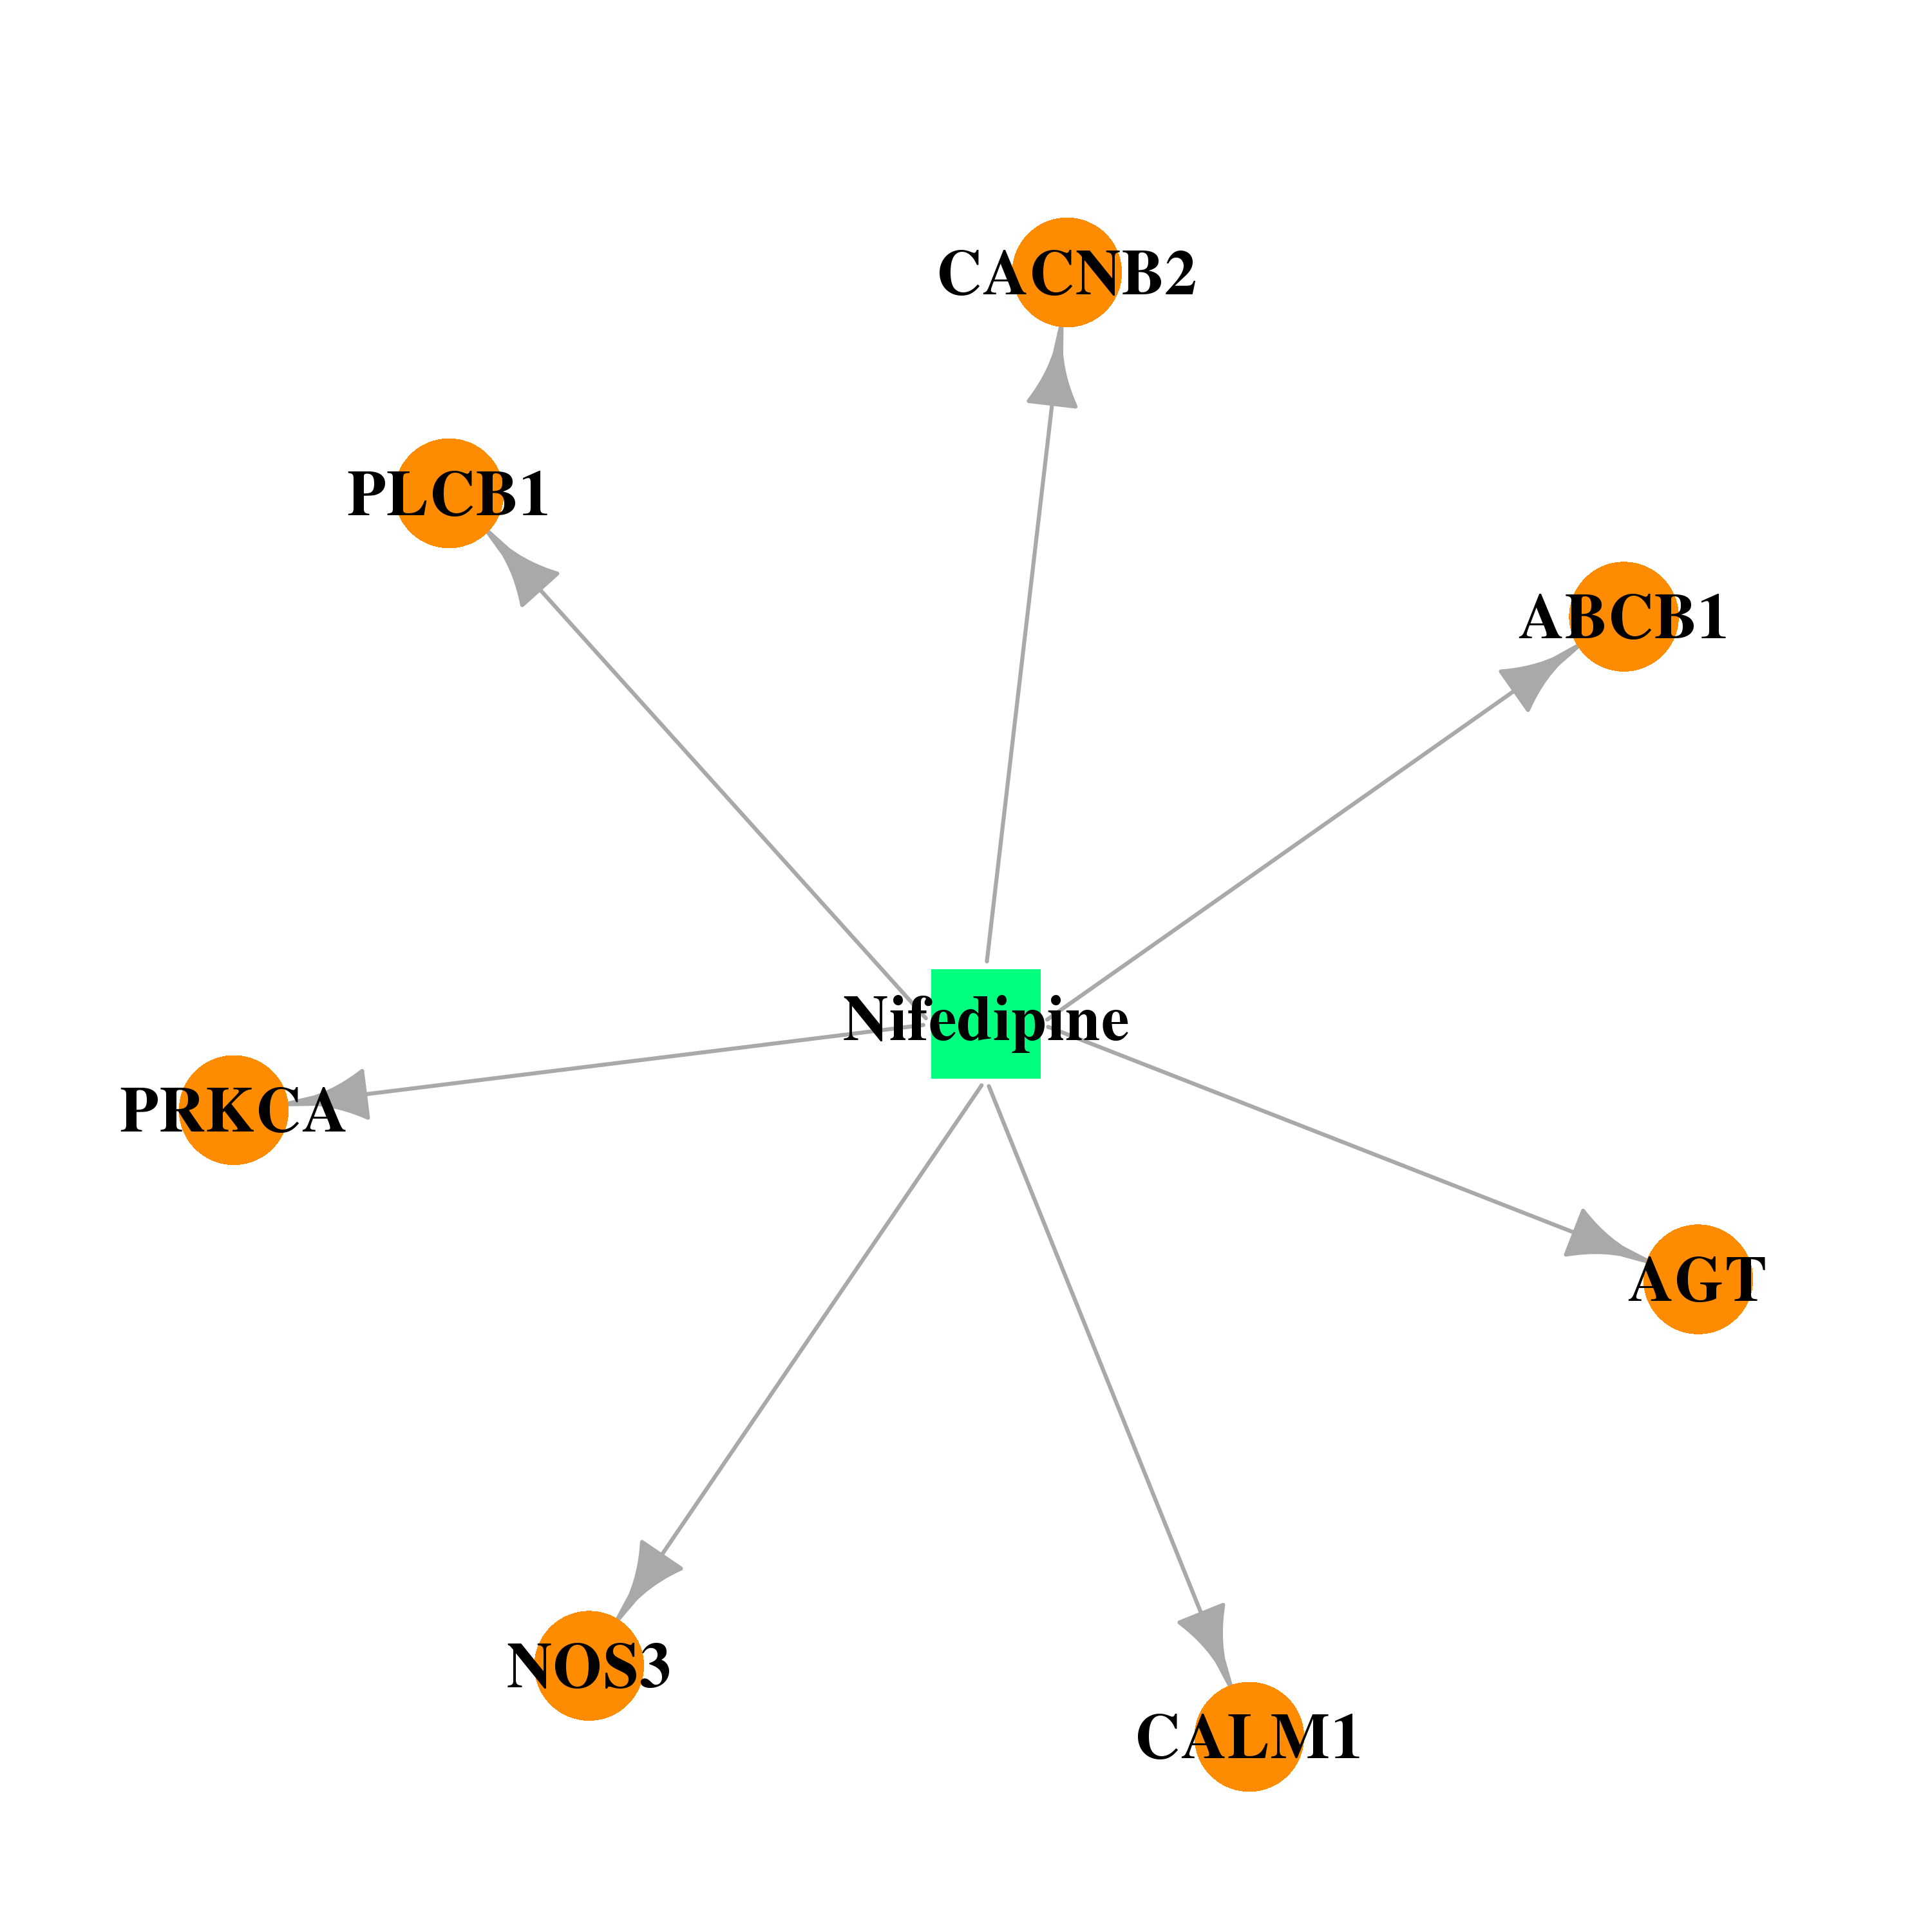 |  |
| Top |
| Cross referenced IDs for PLCB1 |
| * We obtained these cross-references from Uniprot database. It covers 150 different DBs, 18 categories. http://www.uniprot.org/help/cross_references_section |
: Open all cross reference information
|
Copyright © 2016-Present - The Univsersity of Texas Health Science Center at Houston @ |