|
||||||||||||||||||||
| |
| Phenotypic Information (metabolism pathway, cancer, disease, phenome) |
| |
| |
| Gene-Gene Network Information: Co-Expression Network, Interacting Genes & KEGG |
| |
|


| Gene Summary for FMO2 |
| Top |
| Phenotypic Information for FMO2(metabolism pathway, cancer, disease, phenome) |
| Cancer | CGAP: FMO2 |
| Familial Cancer Database: FMO2 | |
| * This gene is included in those cancer gene databases. |
|
|
|
|
|
|
| ||||||||||||||
Oncogene 1 | Significant driver gene in | |||||||||||||||||||
| cf) number; DB name 1 Oncogene; http://nar.oxfordjournals.org/content/35/suppl_1/D721.long, 2 Tumor Suppressor gene; https://bioinfo.uth.edu/TSGene/, 3 Cancer Gene Census; http://www.nature.com/nrc/journal/v4/n3/abs/nrc1299.html, 4 CancerGenes; http://nar.oxfordjournals.org/content/35/suppl_1/D721.long, 5 Network of Cancer Gene; http://ncg.kcl.ac.uk/index.php, 1Therapeutic Vulnerabilities in Cancer; http://cbio.mskcc.org/cancergenomics/statius/ |
| KEGG_DRUG_METABOLISM_CYTOCHROME_P450 | |
| OMIM | |
| Orphanet | |
| Disease | KEGG Disease: FMO2 |
| MedGen: FMO2 (Human Medical Genetics with Condition) | |
| ClinVar: FMO2 | |
| Phenotype | MGI: FMO2 (International Mouse Phenotyping Consortium) |
| PhenomicDB: FMO2 | |
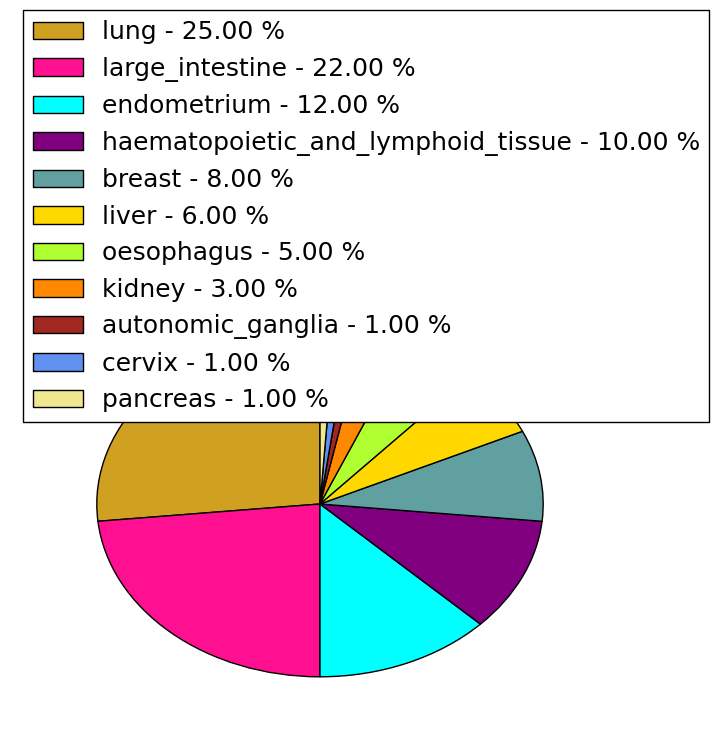
| Mutations for FMO2 |
| * Under tables are showing count per each tissue to give us broad intuition about tissue specific mutation patterns.You can go to the detailed page for each mutation database's web site. |
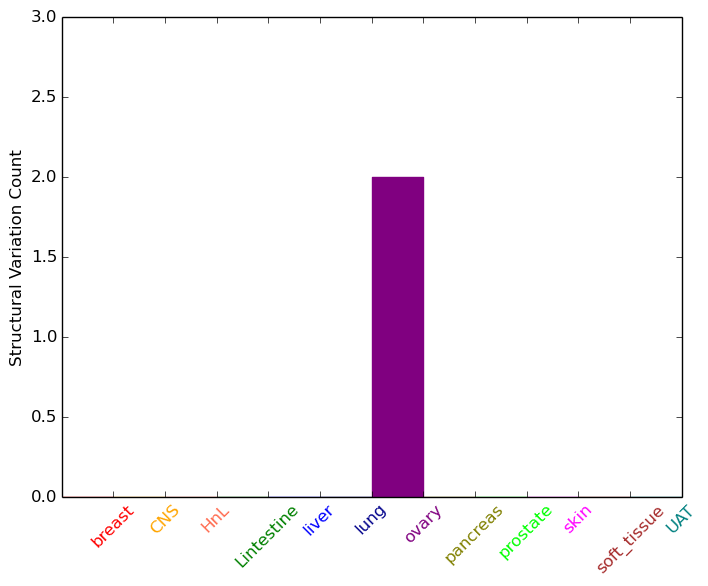
| - Statistics for Tissue and Mutation type | Top |
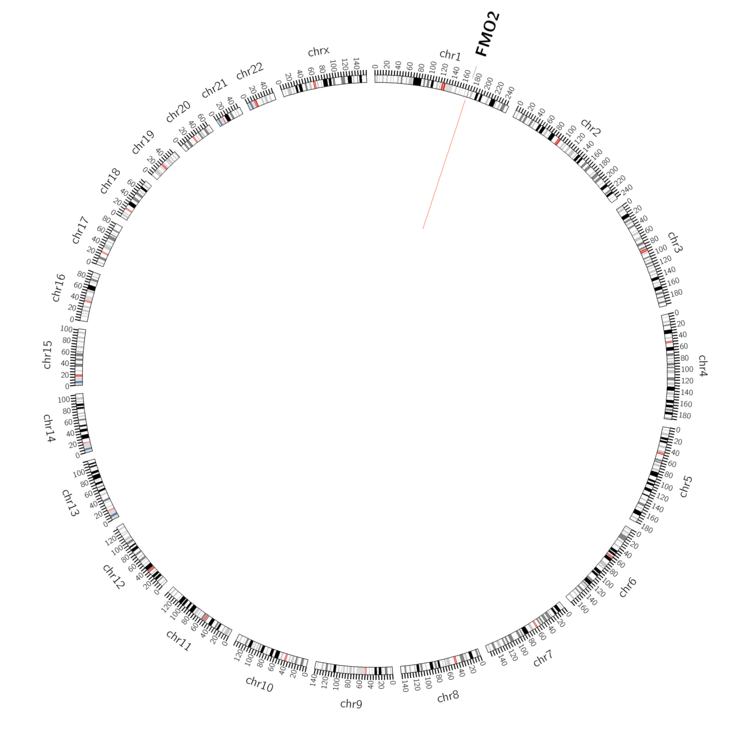 |
| - For Inter-chromosomal Variations |
| There's no inter-chromosomal structural variation. |
| - For Intra-chromosomal Variations |
| * Intra-chromosomal variantions includes 'intrachromosomal amplicon to amplicon', 'intrachromosomal amplicon to non-amplified dna', 'intrachromosomal deletion', 'intrachromosomal fold-back inversion', 'intrachromosomal inversion', 'intrachromosomal tandem duplication', 'Intrachromosomal unknown type', 'intrachromosomal with inverted orientation', 'intrachromosomal with non-inverted orientation'. |
 |
| Sample | Symbol_a | Chr_a | Start_a | End_a | Symbol_b | Chr_b | Start_b | End_b |
| ovary | FMO2 | chr1 | 171168726 | 171168746 | chr1 | 171133352 | 171133372 | |
| ovary | FMO2 | chr1 | 171168726 | 171168746 | chr1 | 171133354 | 171133374 |
| cf) Tissue number; Tissue name (1;Breast, 2;Central_nervous_system, 3;Haematopoietic_and_lymphoid_tissue, 4;Large_intestine, 5;Liver, 6;Lung, 7;Ovary, 8;Pancreas, 9;Prostate, 10;Skin, 11;Soft_tissue, 12;Upper_aerodigestive_tract) |
| * From mRNA Sanger sequences, Chitars2.0 arranged chimeric transcripts. This table shows FMO2 related fusion information. |
| ID | Head Gene | Tail Gene | Accession | Gene_a | qStart_a | qEnd_a | Chromosome_a | tStart_a | tEnd_a | Gene_a | qStart_a | qEnd_a | Chromosome_a | tStart_a | tEnd_a |
| AI452615 | FMO2 | 1 | 181 | 1 | 171174640 | 171176903 | FMO2 | 178 | 494 | 1 | 171173038 | 171174568 | |
| Top |
| There's no copy number variation information in COSMIC data for this gene. |
| Top |
|
 |
| Top |
| Stat. for Non-Synonymous SNVs (# total SNVs=58) | (# total SNVs=10) |
 |  |
(# total SNVs=1) | (# total SNVs=1) |
 |  |
| Top |
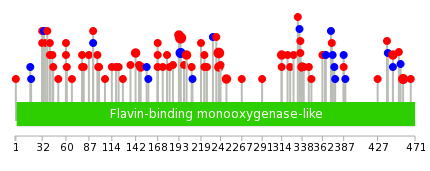
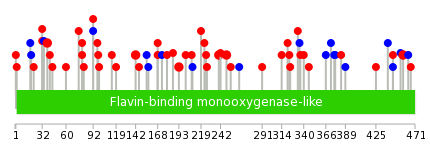
| * When you move the cursor on each content, you can see more deailed mutation information on the Tooltip. Those are primary_site,primary_histology,mutation(aa),pubmedID. |
| GRCh37 position | Mutation(aa) | Unique sampleID count |
| chr1:171168584-171168584 | p.S195L | 5 |
| chr1:171173094-171173094 | p.R240C | 4 |
| chr1:171178045-171178045 | p.P457S | 3 |
| chr1:171168585-171168585 | p.S195S | 3 |
| chr1:171168604-171168604 | p.E202K | 3 |
| chr1:171174602-171174602 | p.L338I | 2 |
| chr1:171165890-171165890 | p.A142T | 2 |
| chr1:171168578-171168578 | p.G193E | 2 |
| chr1:171174531-171174531 | p.E314G | 2 |
| chr1:171162520-171162520 | p.T60N | 2 |
| Top |
|
 |
| Point Mutation/ Tissue ID | 1 | 2 | 3 | 4 | 5 | 6 | 7 | 8 | 9 | 10 | 11 | 12 | 13 | 14 | 15 | 16 | 17 | 18 | 19 | 20 |
| # sample | 5 | 3 | 1 | 6 | 4 | 1 | 1 | 9 | 3 | 1 | 18 | 5 | 8 | |||||||
| # mutation | 5 | 3 | 1 | 8 | 4 | 1 | 1 | 9 | 3 | 1 | 22 | 5 | 9 | |||||||
| nonsynonymous SNV | 5 | 2 | 1 | 6 | 3 | 1 | 1 | 8 | 3 | 1 | 12 | 4 | 7 | |||||||
| synonymous SNV | 1 | 2 | 1 | 1 | 10 | 1 | 2 |
| cf) Tissue ID; Tissue type (1; BLCA[Bladder Urothelial Carcinoma], 2; BRCA[Breast invasive carcinoma], 3; CESC[Cervical squamous cell carcinoma and endocervical adenocarcinoma], 4; COAD[Colon adenocarcinoma], 5; GBM[Glioblastoma multiforme], 6; Glioma Low Grade, 7; HNSC[Head and Neck squamous cell carcinoma], 8; KICH[Kidney Chromophobe], 9; KIRC[Kidney renal clear cell carcinoma], 10; KIRP[Kidney renal papillary cell carcinoma], 11; LAML[Acute Myeloid Leukemia], 12; LUAD[Lung adenocarcinoma], 13; LUSC[Lung squamous cell carcinoma], 14; OV[Ovarian serous cystadenocarcinoma ], 15; PAAD[Pancreatic adenocarcinoma], 16; PRAD[Prostate adenocarcinoma], 17; SKCM[Skin Cutaneous Melanoma], 18:STAD[Stomach adenocarcinoma], 19:THCA[Thyroid carcinoma], 20:UCEC[Uterine Corpus Endometrial Carcinoma]) |
| Top |
| * We represented just top 10 SNVs. When you move the cursor on each content, you can see more deailed mutation information on the Tooltip. Those are primary_site, primary_histology, mutation(aa), pubmedID. |
| Genomic Position | Mutation(aa) | Unique sampleID count |
| chr1:171173122 | p.G193E | 2 |
| chr1:171168578 | p.P457S | 2 |
| chr1:171165890 | p.A142T | 2 |
| chr1:171178045 | p.G38E | 2 |
| chr1:171154965 | p.R240C | 2 |
| chr1:171173094 | p.R249Q | 2 |
| chr1:171162636 | p.L439L | 1 |
| chr1:171174596 | p.P79L | 1 |
| chr1:171168556 | p.P179L | 1 |
| chr1:171178010 | p.E314K | 1 |
| * Copy number data were extracted from TCGA using R package TCGA-Assembler. The URLs of all public data files on TCGA DCC data server were gathered on Jan-05-2015. Function ProcessCNAData in TCGA-Assembler package was used to obtain gene-level copy number value which is calculated as the average copy number of the genomic region of a gene. |
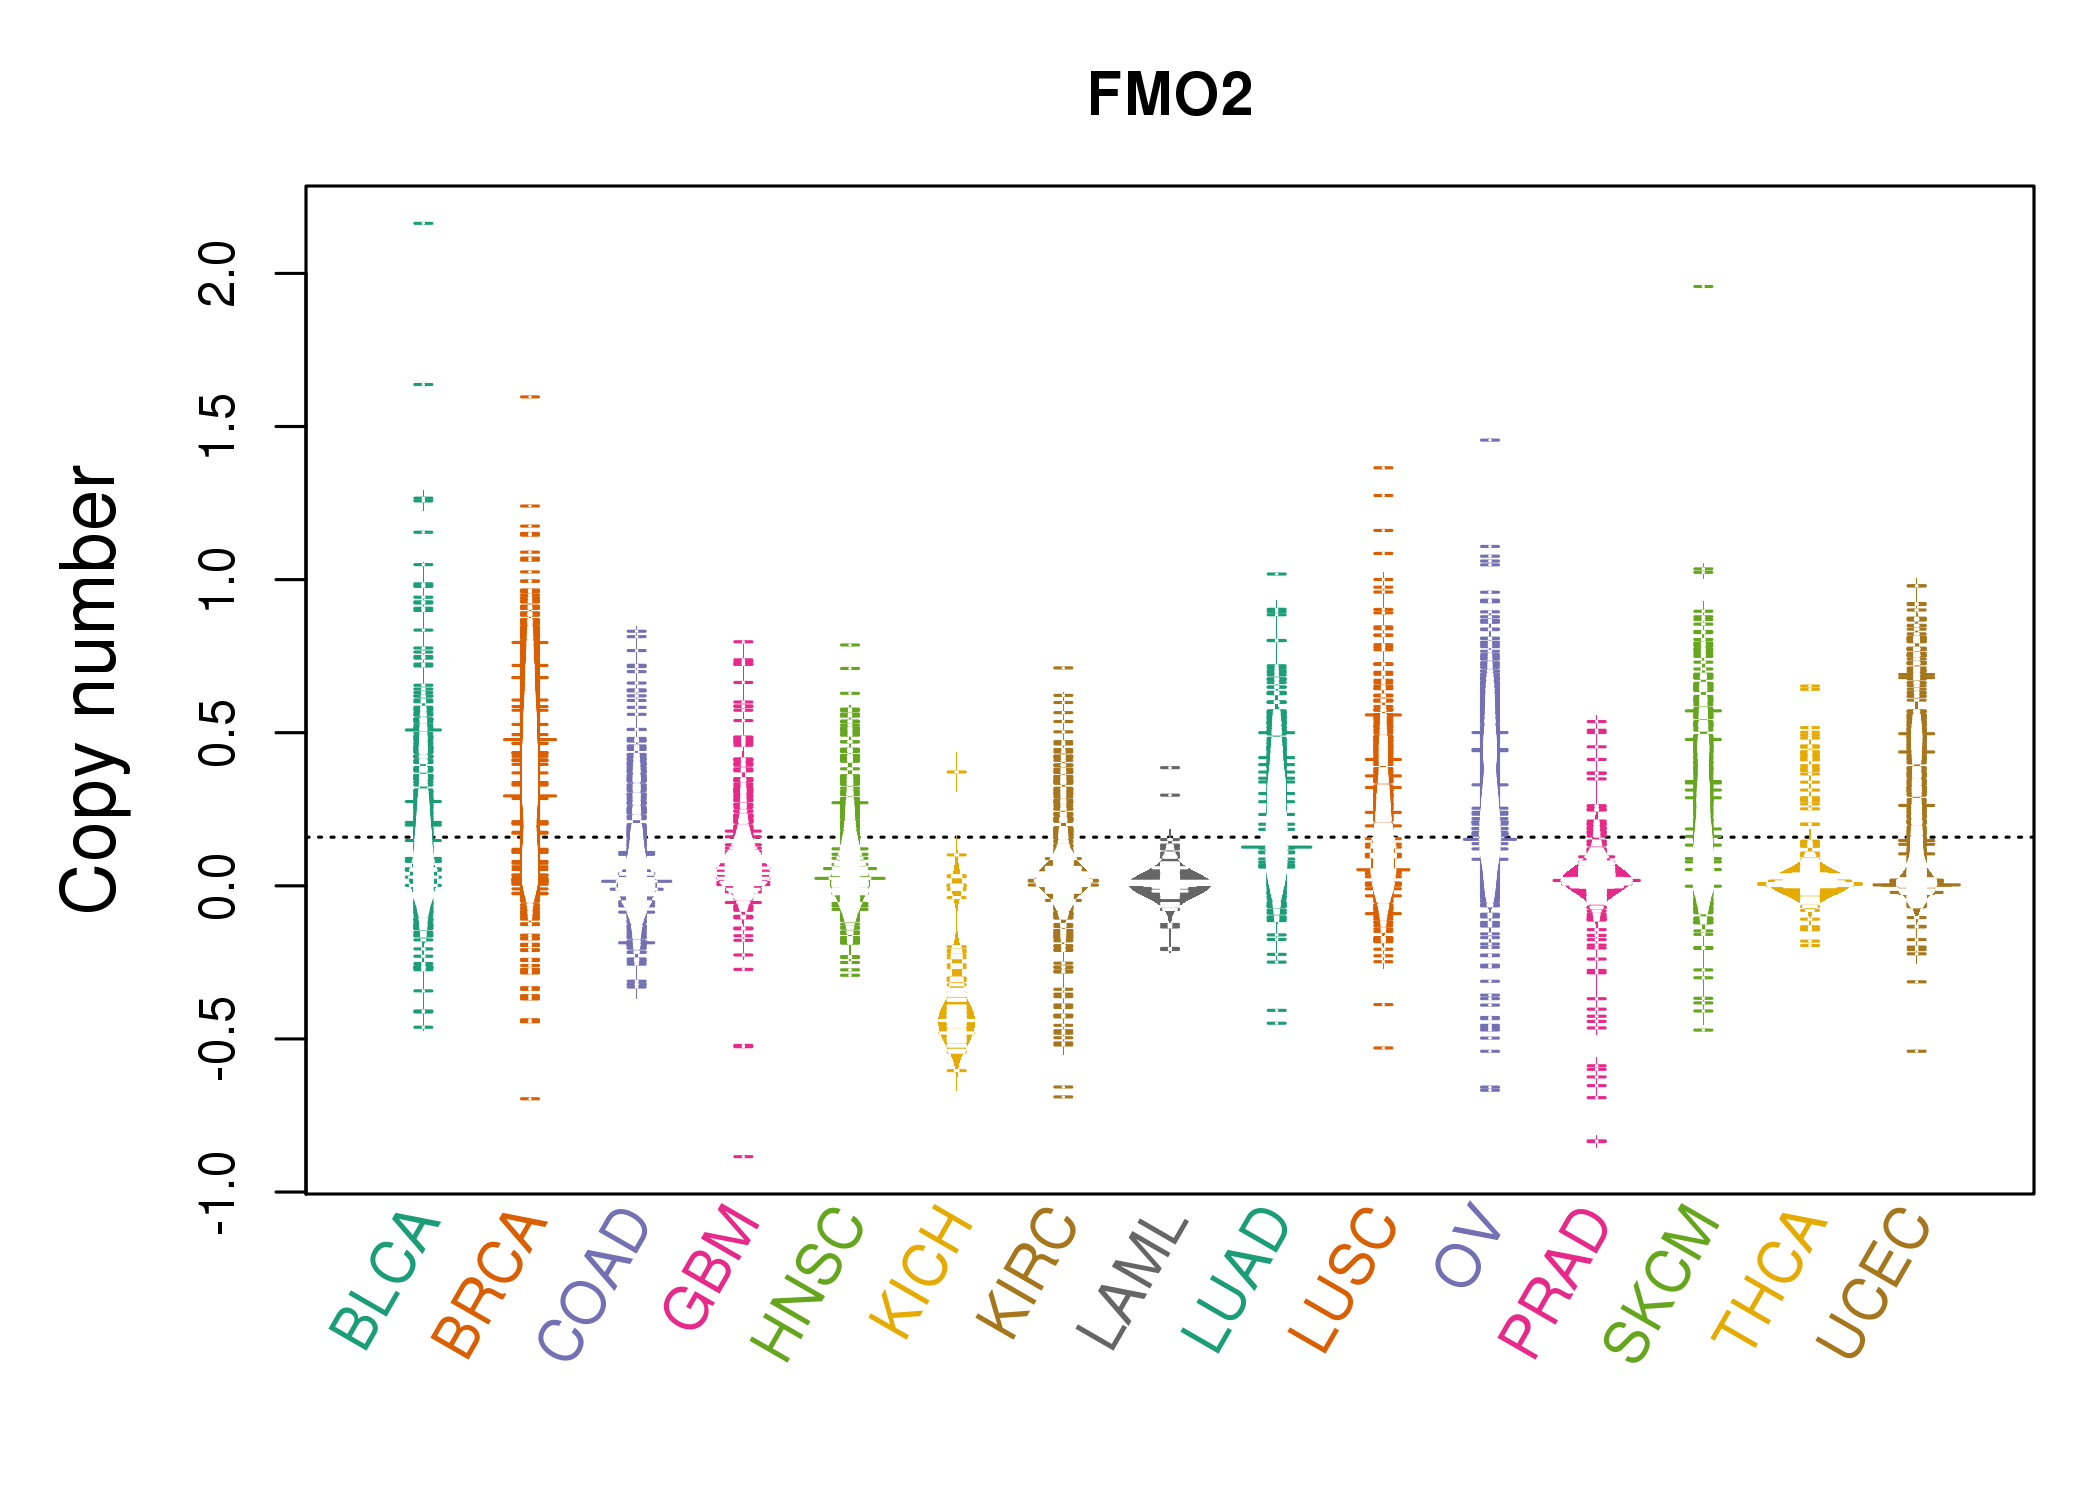 |
| cf) Tissue ID[Tissue type]: BLCA[Bladder Urothelial Carcinoma], BRCA[Breast invasive carcinoma], CESC[Cervical squamous cell carcinoma and endocervical adenocarcinoma], COAD[Colon adenocarcinoma], GBM[Glioblastoma multiforme], Glioma Low Grade, HNSC[Head and Neck squamous cell carcinoma], KICH[Kidney Chromophobe], KIRC[Kidney renal clear cell carcinoma], KIRP[Kidney renal papillary cell carcinoma], LAML[Acute Myeloid Leukemia], LUAD[Lung adenocarcinoma], LUSC[Lung squamous cell carcinoma], OV[Ovarian serous cystadenocarcinoma ], PAAD[Pancreatic adenocarcinoma], PRAD[Prostate adenocarcinoma], SKCM[Skin Cutaneous Melanoma], STAD[Stomach adenocarcinoma], THCA[Thyroid carcinoma], UCEC[Uterine Corpus Endometrial Carcinoma] |
| Top |
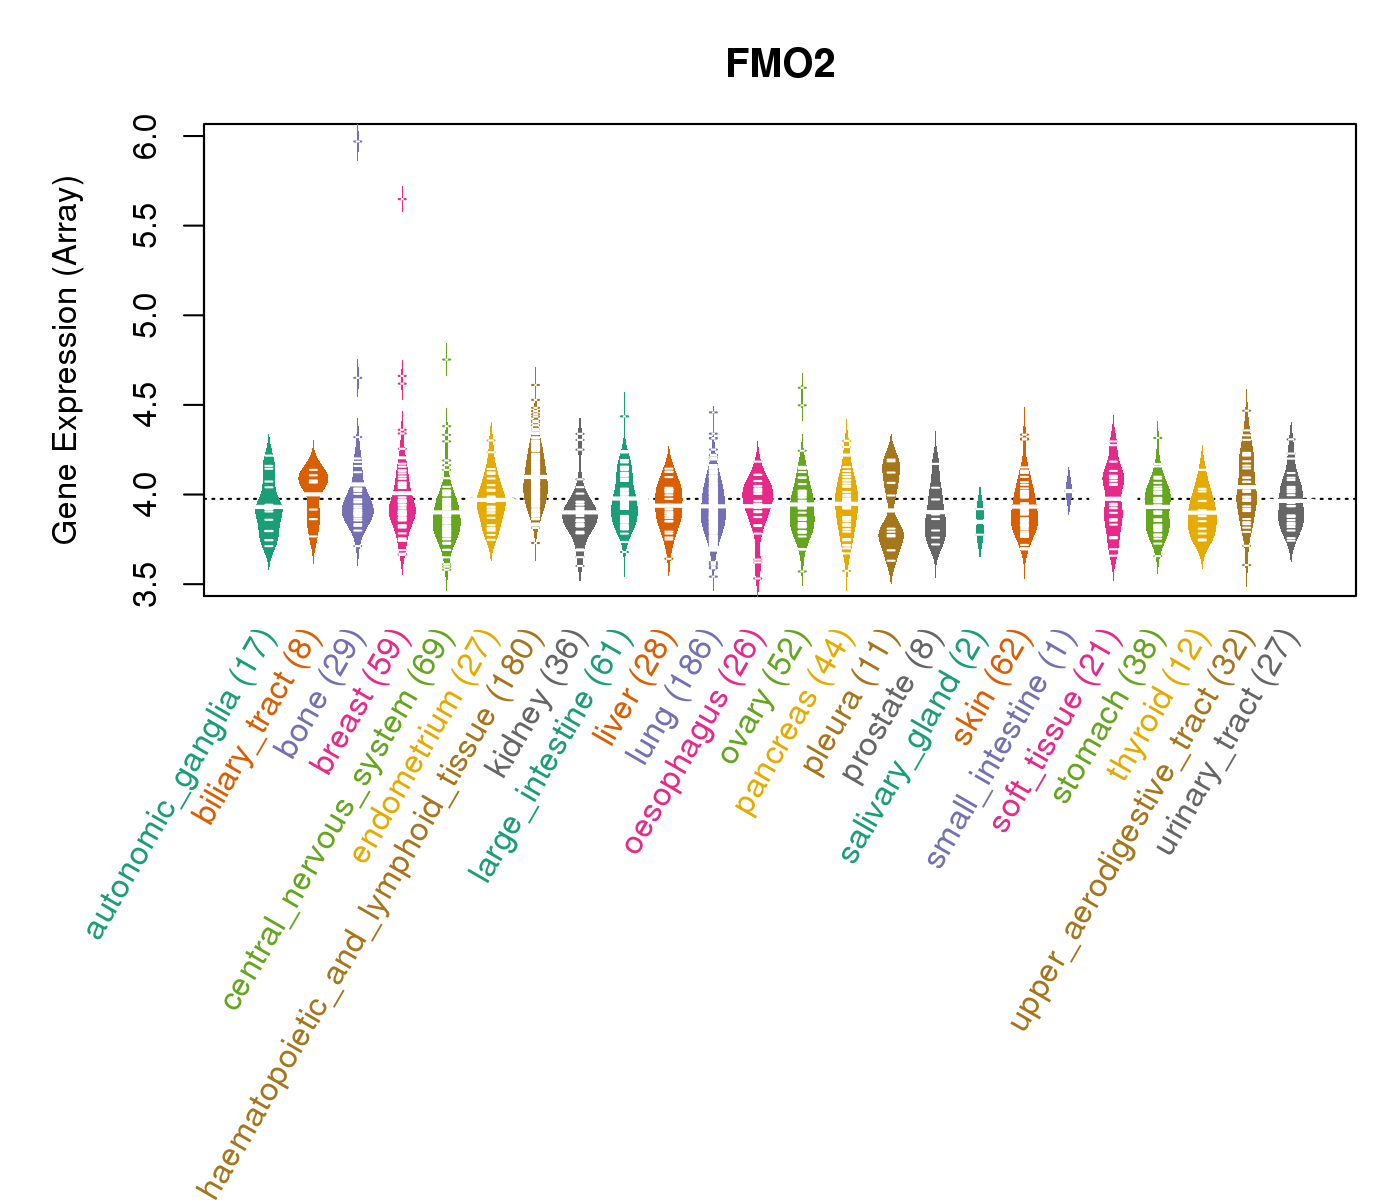
| Gene Expression for FMO2 |
| * CCLE gene expression data were extracted from CCLE_Expression_Entrez_2012-10-18.res: Gene-centric RMA-normalized mRNA expression data. |
 |
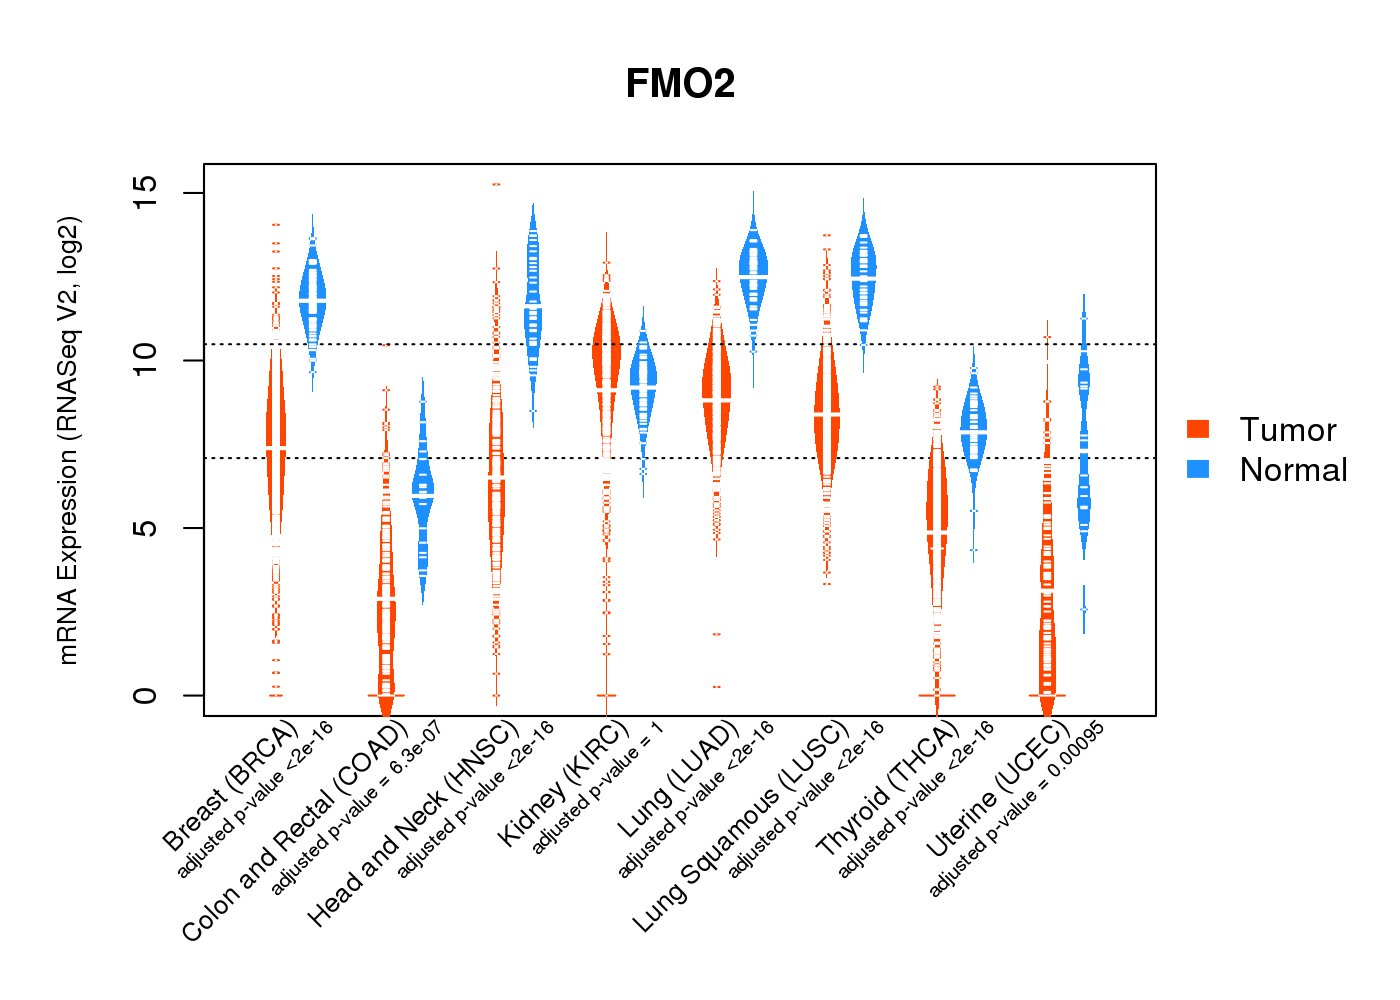
| * Normalized gene expression data of RNASeqV2 was extracted from TCGA using R package TCGA-Assembler. The URLs of all public data files on TCGA DCC data server were gathered at Jan-05-2015. Only eight cancer types have enough normal control samples for differential expression analysis. (t test, adjusted p<0.05 (using Benjamini-Hochberg FDR)) |
 |
| Top |
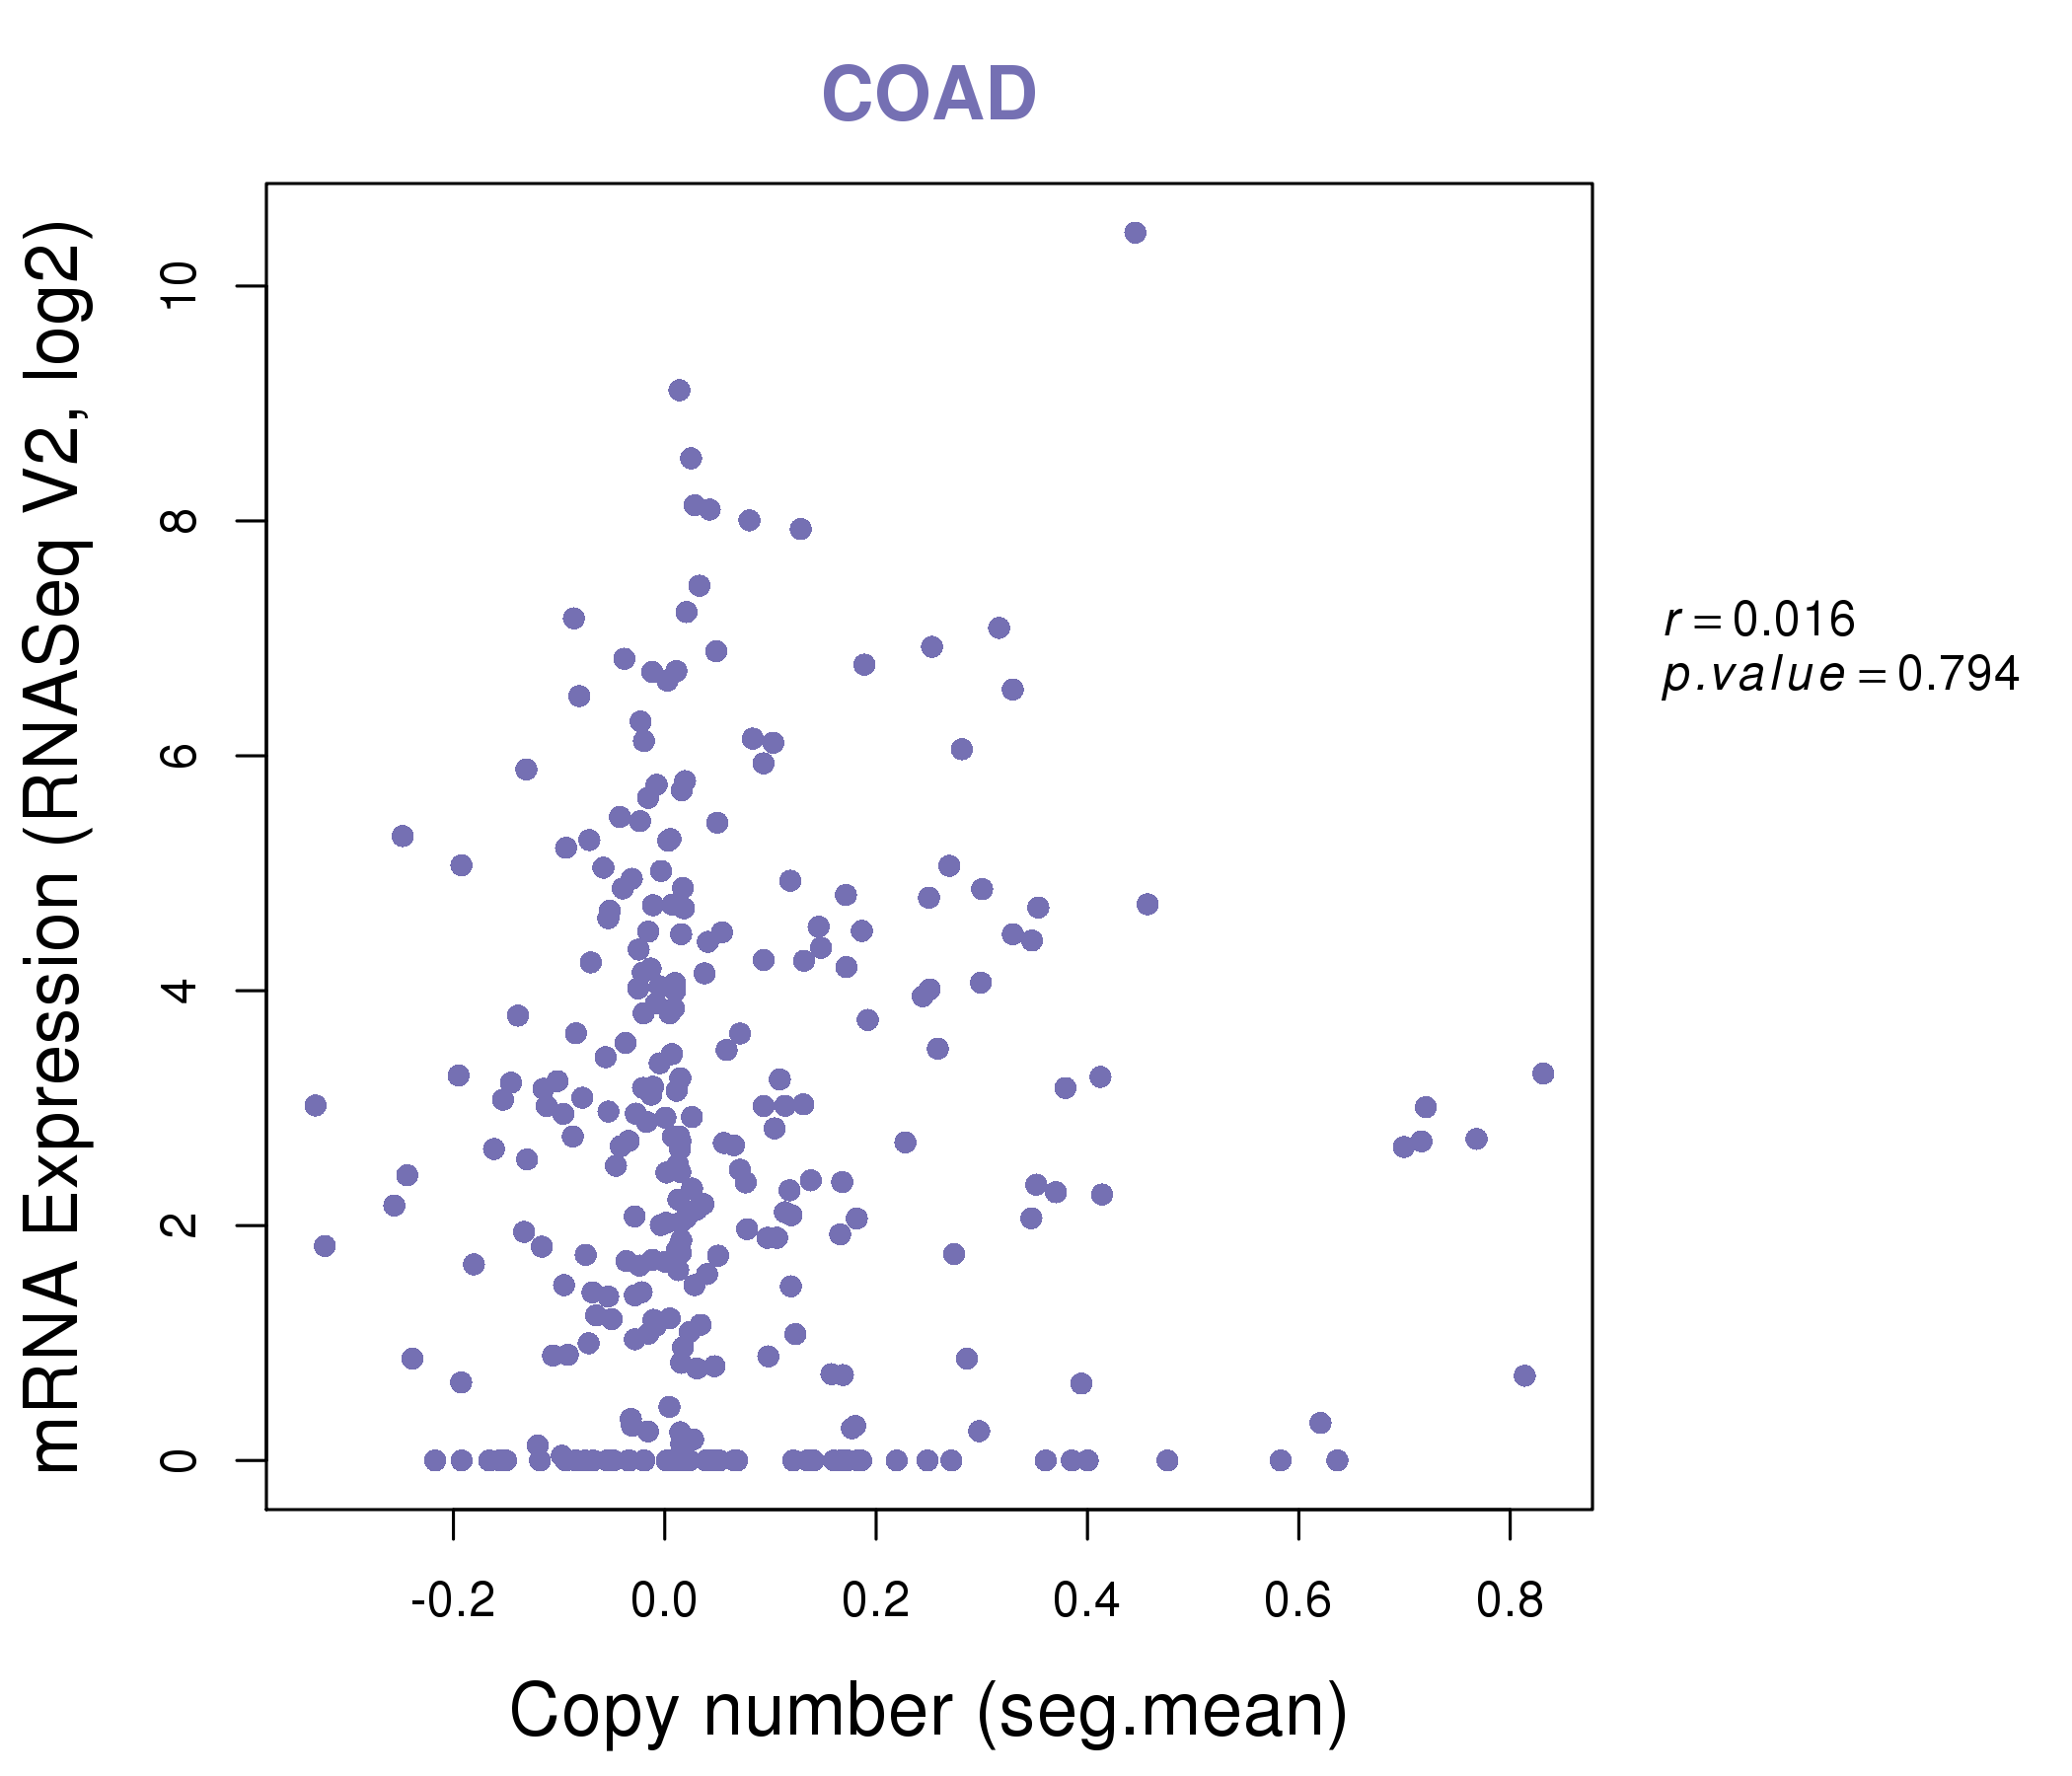
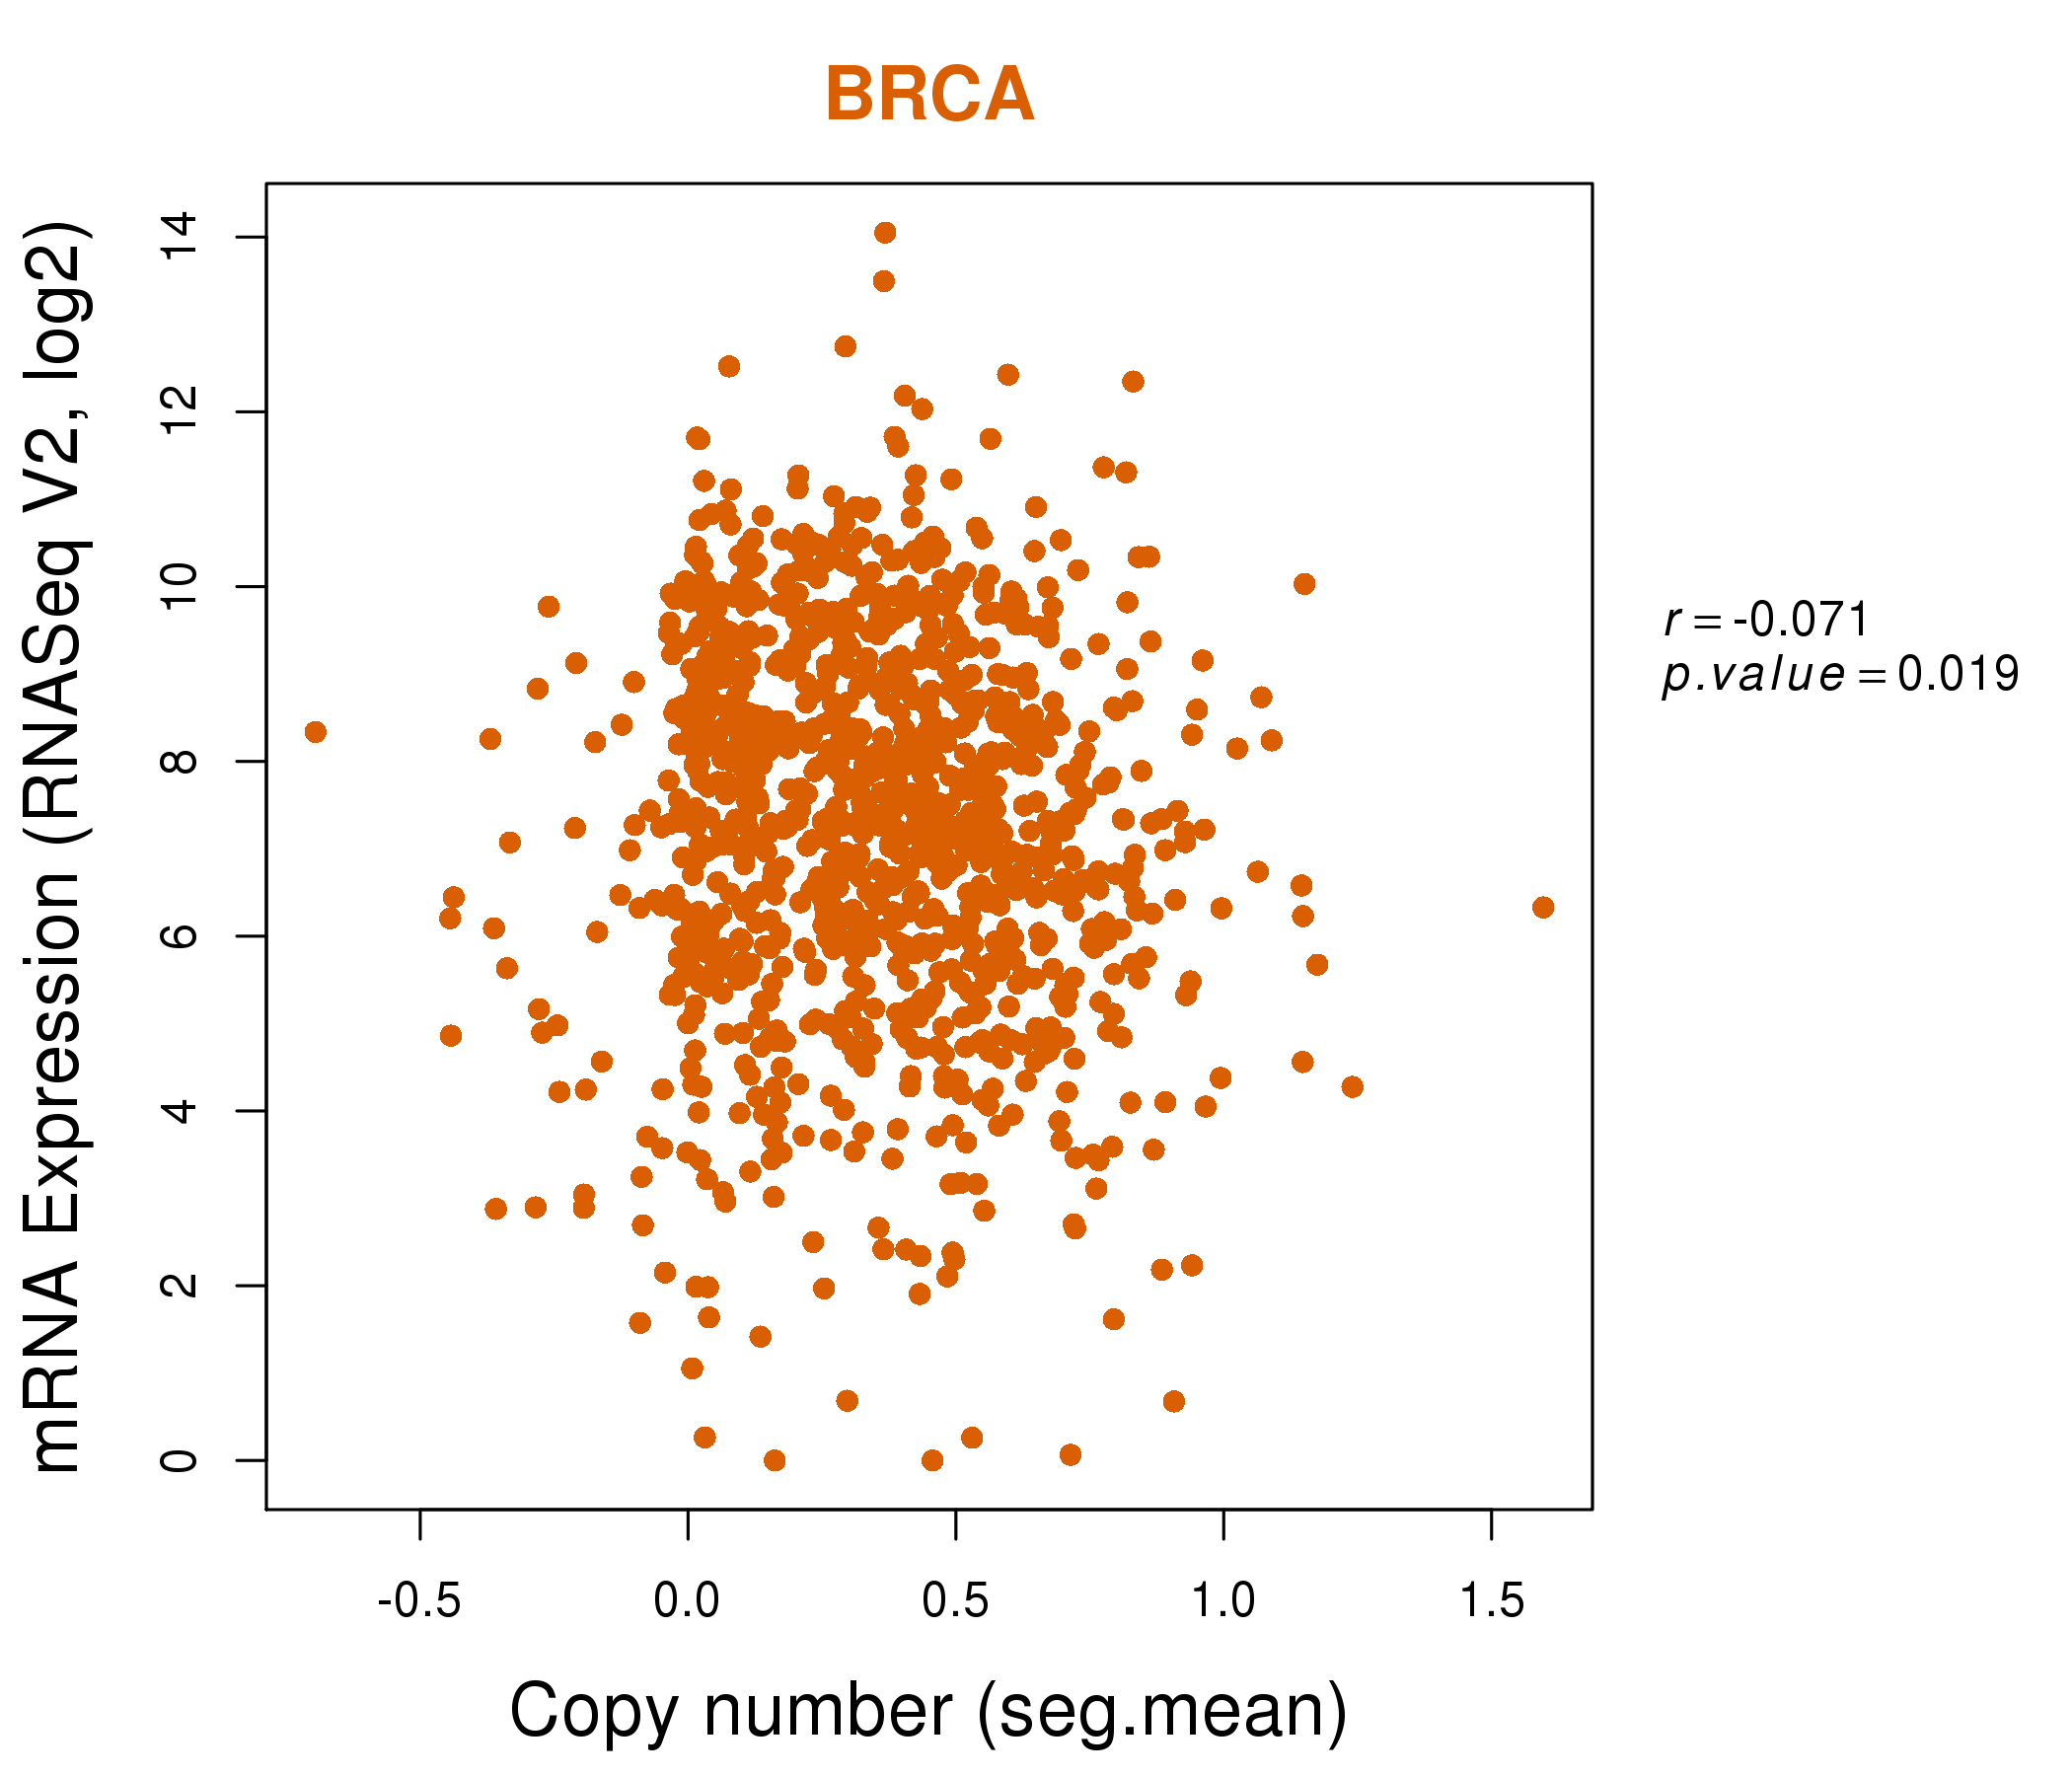
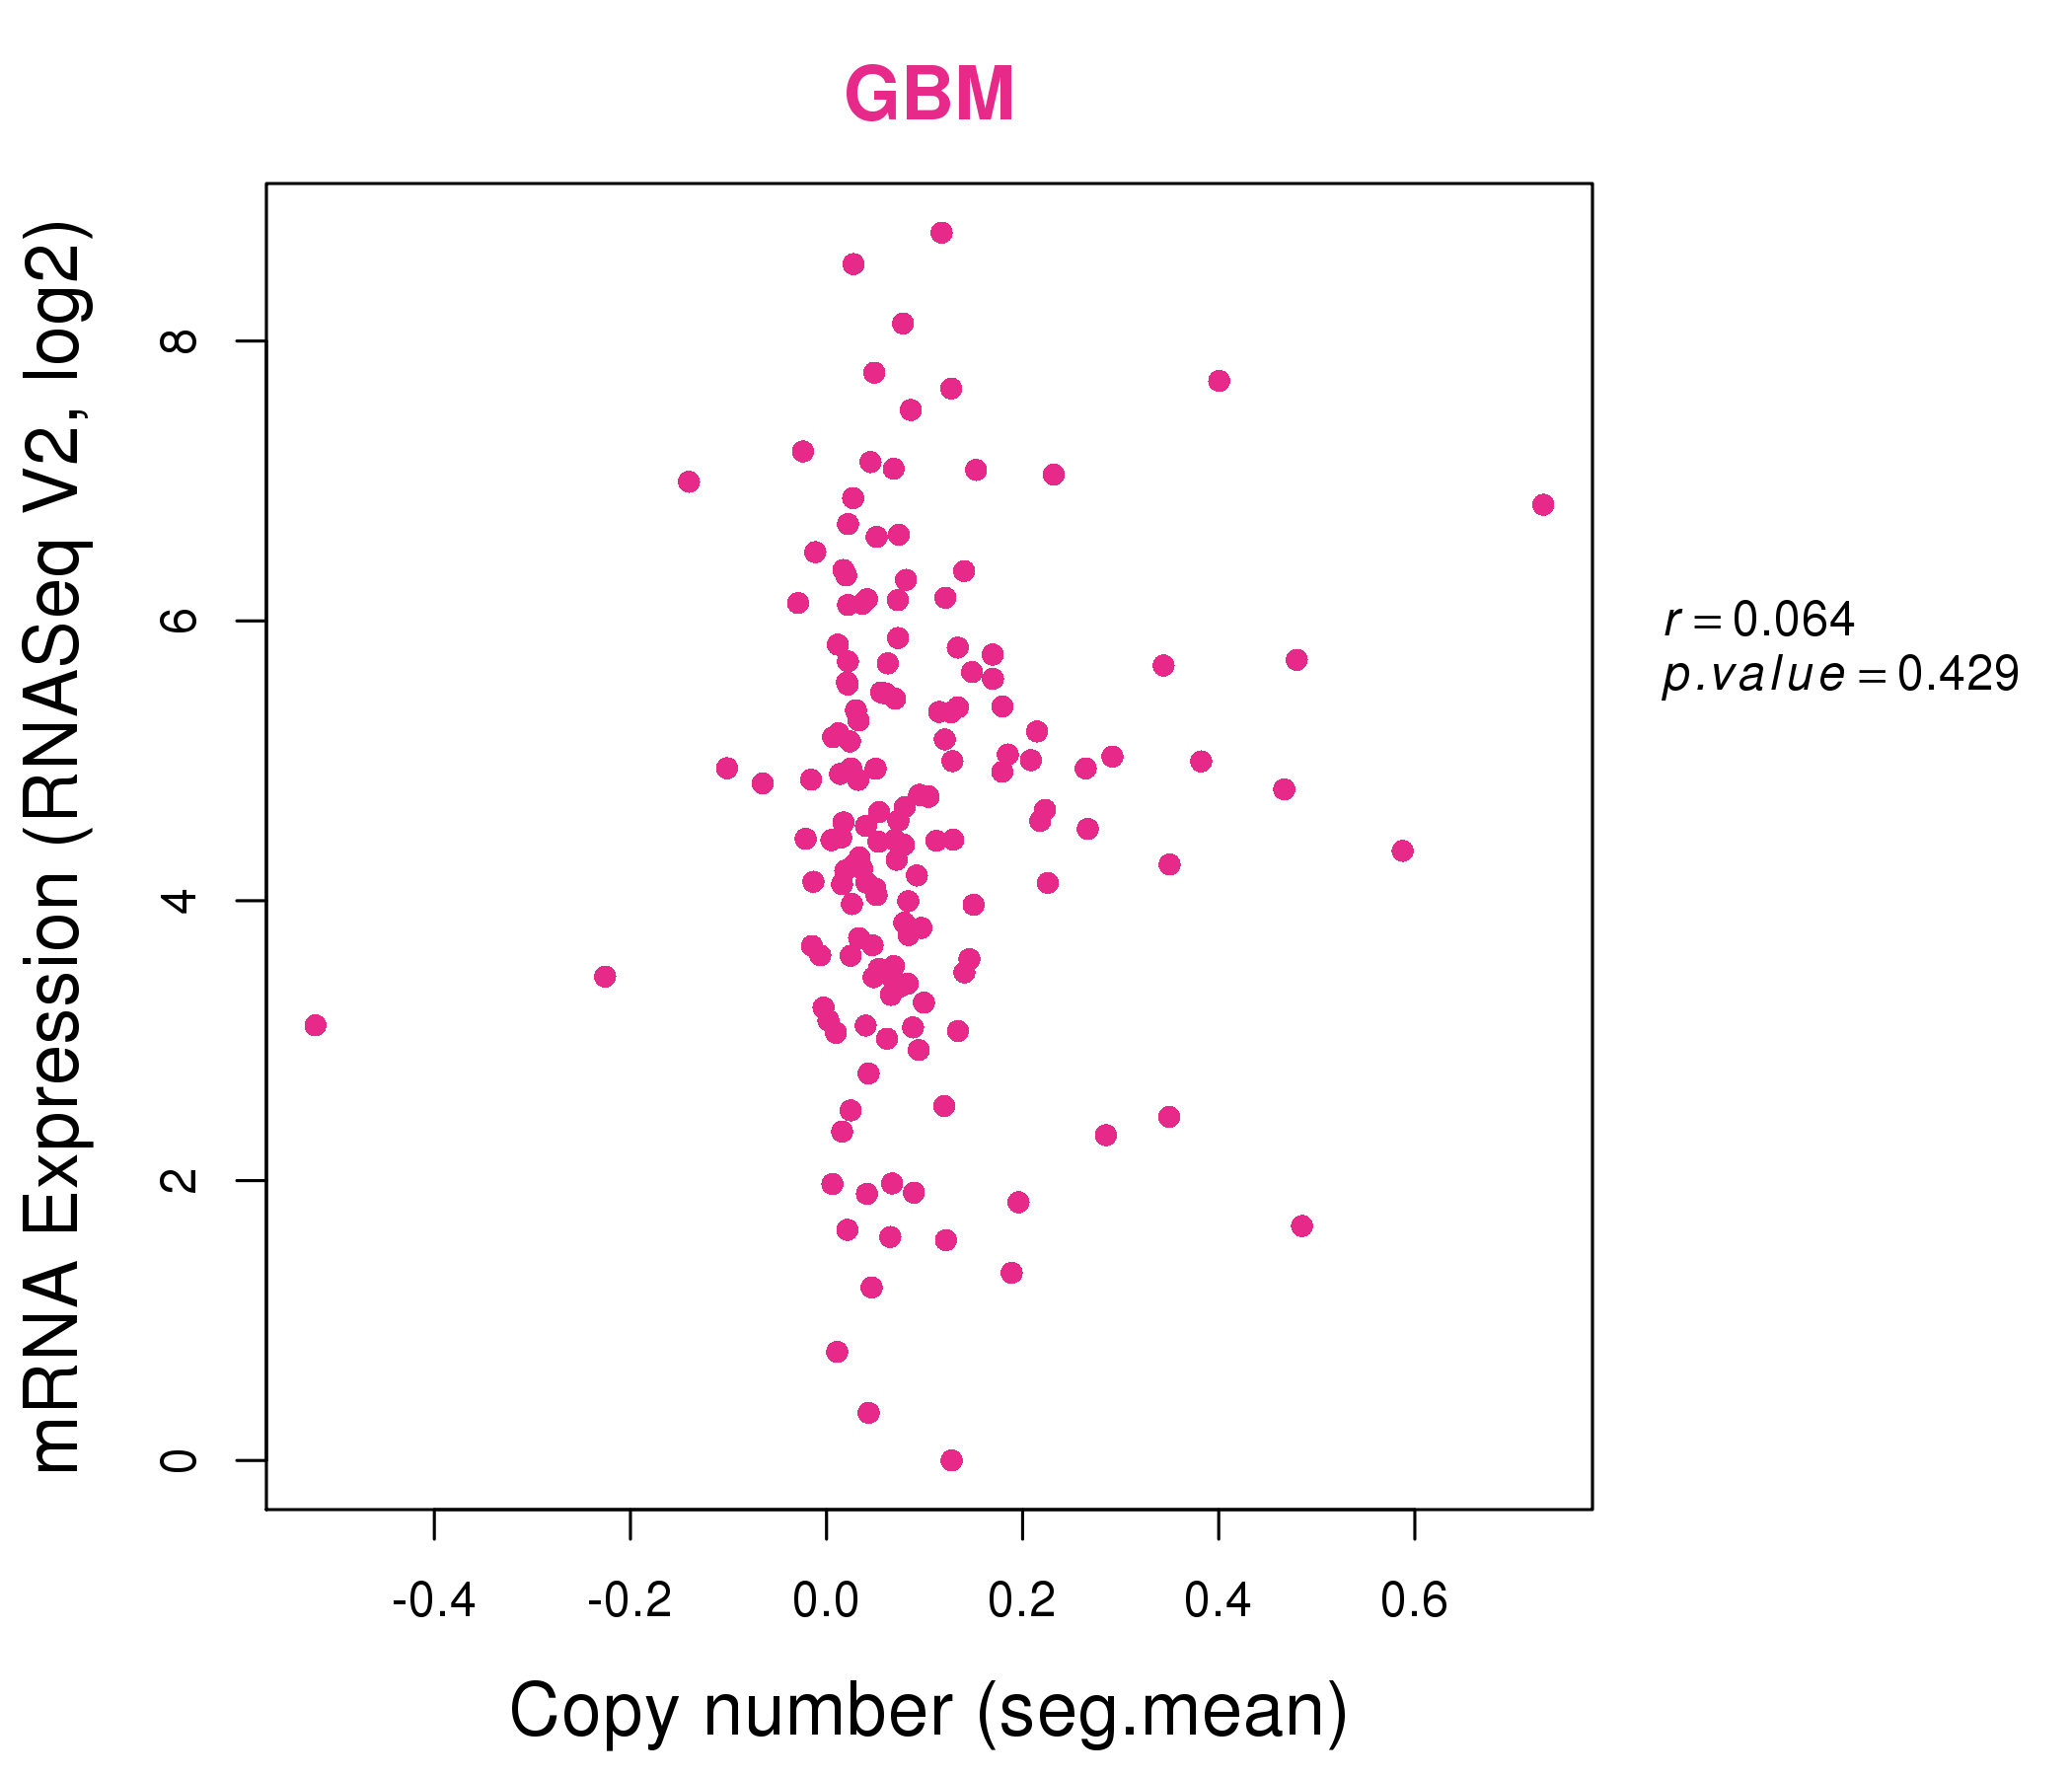
| * This plots show the correlation between CNV and gene expression. |
: Open all plots for all cancer types
 |
|
 |
|
| Top |
| Gene-Gene Network Information |
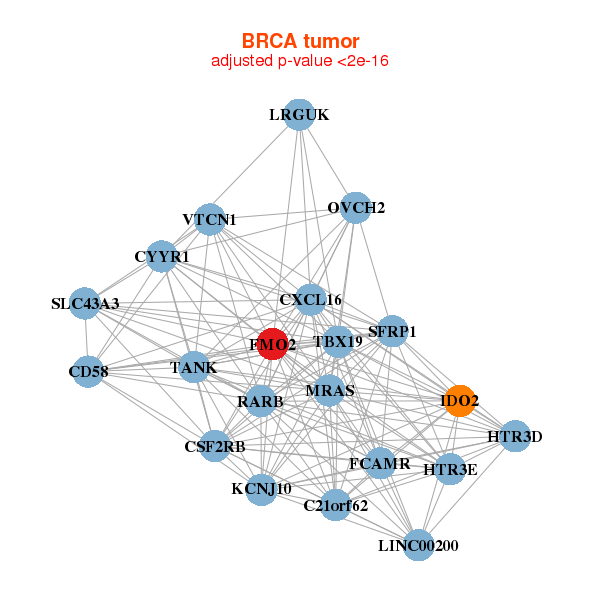
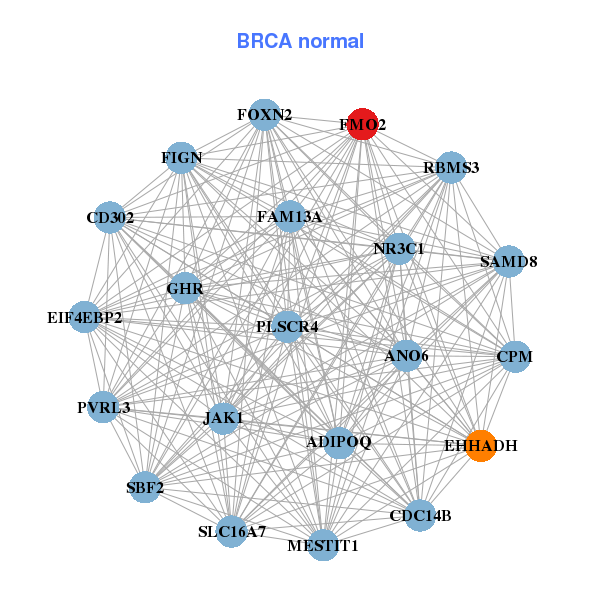
| * Co-Expression network figures were drawn using R package igraph. Only the top 20 genes with the highest correlations were shown. Red circle: input gene, orange circle: cell metabolism gene, sky circle: other gene |
: Open all plots for all cancer types
 |
| ||||
| C21orf62,CD58,CSF2RB,CXCL16,CYYR1,FCAMR,FMO2, HTR3D,HTR3E,IDO2,KCNJ10,LRGUK,MRAS,LINC00200, OVCH2,RARB,SFRP1,SLC43A3,TANK,TBX19,VTCN1 | ADIPOQ,ANO6,CD302,CDC14B,CPM,EHHADH,EIF4EBP2, FAM13A,FIGN,FMO2,FOXN2,GHR,JAK1,MESTIT1, NR3C1,PLSCR4,PVRL3,RBMS3,SAMD8,SBF2,SLC16A7 | ||||
 |
| ||||
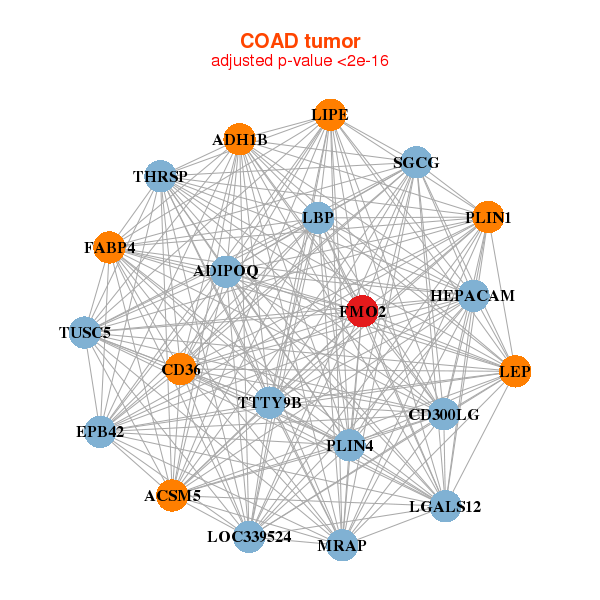
| ACSM5,ADH1B,ADIPOQ,CD300LG,CD36,EPB42,FABP4, FMO2,HEPACAM,LBP,LEP,LGALS12,LIPE,LOC339524, MRAP,PLIN1,PLIN4,SGCG,THRSP,TTTY9B,TUSC5 | ADH1B,AGTR1,AMPH,C11orf70,CRISPLD1,FGF1,FMO2, GPR176,KERA,LHFP,LRFN5,LYVE1,NXPH3,PPAPDC1A, RBP7,RFTN2,SGCA,SNCG,TG,TMIE,TPH2 |
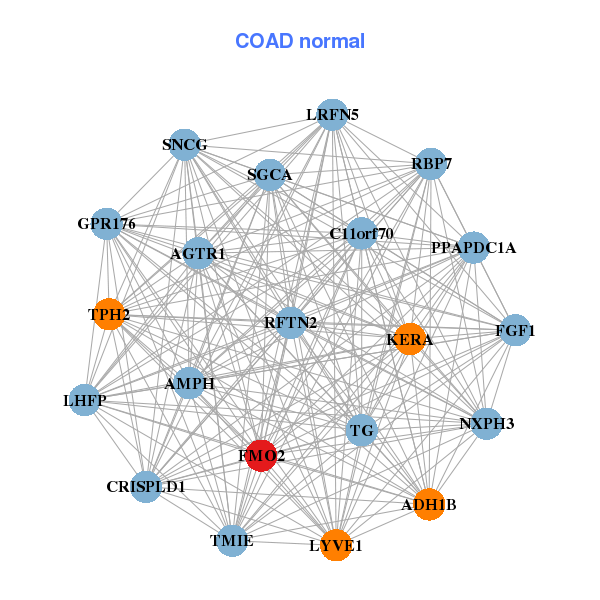
| * Co-Expression network figures were drawn using R package igraph. Only the top 20 genes with the highest correlations were shown. Red circle: input gene, orange circle: cell metabolism gene, sky circle: other gene |
: Open all plots for all cancer types
| Top |
: Open all interacting genes' information including KEGG pathway for all interacting genes from DAVID
| Top |
| Pharmacological Information for FMO2 |
| DB Category | DB Name | DB's ID and Url link |
| * Gene Centered Interaction Network. |
 |
| * Drug Centered Interaction Network. |
| DrugBank ID | Target Name | Drug Groups | Generic Name | Drug Centered Network | Drug Structure |
| DB00675 | flavin containing monooxygenase 2 (non-functional) | approved | Tamoxifen |  |  |
| Top |
| Cross referenced IDs for FMO2 |
| * We obtained these cross-references from Uniprot database. It covers 150 different DBs, 18 categories. http://www.uniprot.org/help/cross_references_section |
: Open all cross reference information
|
Copyright © 2016-Present - The Univsersity of Texas Health Science Center at Houston @ |