|
|||||||||||||||||||||||||||||||||||||||||||||||||||||||||||||||||||||||||||||||||||||||||||||||||||||||||||||||||||||||||||||||||||||||||||||||||||||||||||||||||||||||||||||||||||||||||||||||||||||||||||||||||||||||||||||||||||||||||||||||||||||||||||||||||||||||||||||||||||||||||||||||||||||||||||||||||||||||||||||||||||||||||||||||||||||||||
| |
| Phenotypic Information (metabolism pathway, cancer, disease, phenome) |
| |
| |
| Gene-Gene Network Information: Co-Expression Network, Interacting Genes & KEGG |
| |
|


| Gene Summary for FMO3 |
| Basic gene info. | Gene symbol | FMO3 |
| Gene name | flavin containing monooxygenase 3 | |
| Synonyms | FMOII|TMAU|dJ127D3.1 | |
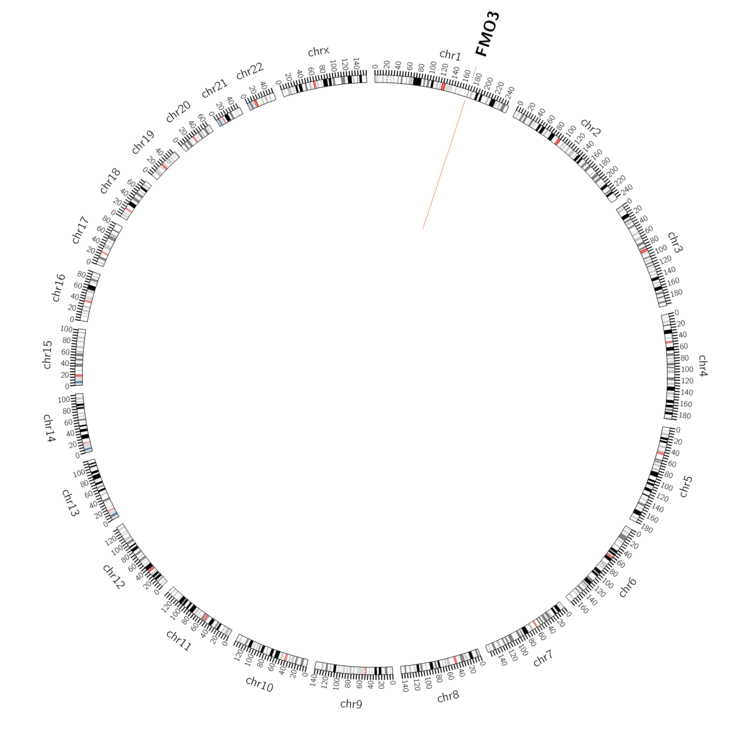
| Cytomap | UCSC genome browser: 1q24.3 | |
| Genomic location | chr1 :171060017-171086959 | |
| Type of gene | protein-coding | |
| RefGenes | NM_001002294.2, NM_006894.5, | |
| Ensembl id | ENSG00000007933 | |
| Description | FMO 3FMO IIFMO form 2dimethylaniline monooxygenase [N-oxide-forming] 3dimethylaniline oxidase 3hepatic flavin-containing monooxygenase 3hepatic flavin-containing monooxygenase-3trimethylamine monooxygenase | |
| Modification date | 20141219 | |
| dbXrefs | MIM : 136132 | |
| HGNC : HGNC | ||
| Ensembl : ENSG00000007933 | ||
| HPRD : 00633 | ||
| Vega : OTTHUMG00000035505 | ||
| Protein | UniProt: go to UniProt's Cross Reference DB Table | |
| Expression | CleanEX: HS_FMO3 | |
| BioGPS: 2328 | ||
| Gene Expression Atlas: ENSG00000007933 | ||
| The Human Protein Atlas: ENSG00000007933 | ||
| Pathway | NCI Pathway Interaction Database: FMO3 | |
| KEGG: FMO3 | ||
| REACTOME: FMO3 | ||
| ConsensusPathDB | ||
| Pathway Commons: FMO3 | ||
| Metabolism | MetaCyc: FMO3 | |
| HUMANCyc: FMO3 | ||
| Regulation | Ensembl's Regulation: ENSG00000007933 | |
| miRBase: chr1 :171,060,017-171,086,959 | ||
| TargetScan: NM_001002294 | ||
| cisRED: ENSG00000007933 | ||
| Context | iHOP: FMO3 | |
| cancer metabolism search in PubMed: FMO3 | ||
| UCL Cancer Institute: FMO3 | ||
| Assigned class in ccmGDB | C | |
| Top |
| Phenotypic Information for FMO3(metabolism pathway, cancer, disease, phenome) |
| Cancer | CGAP: FMO3 |
| Familial Cancer Database: FMO3 | |
| * This gene is included in those cancer gene databases. |
|
|
|
|
|
|
| |||||||||||||||||||||||||||||||||||||||||||||||||||||||||||||||||||||||||||||||||||||||||||||||||||||||||||||||||||||||||||||||||||||||||||||||||||||||||||||||||||||||||||||||||||||||||||||||||||||||||||||||||||||||||||||||||||||||||||||||||||||||||||||||||||||||||||||||||||||||||||||||||||||||||||||||||||||||||||||||||||||||||||||||||||
Oncogene 1 | Significant driver gene in | ||||||||||||||||||||||||||||||||||||||||||||||||||||||||||||||||||||||||||||||||||||||||||||||||||||||||||||||||||||||||||||||||||||||||||||||||||||||||||||||||||||||||||||||||||||||||||||||||||||||||||||||||||||||||||||||||||||||||||||||||||||||||||||||||||||||||||||||||||||||||||||||||||||||||||||||||||||||||||||||||||||||||||||||||||||||||
| cf) number; DB name 1 Oncogene; http://nar.oxfordjournals.org/content/35/suppl_1/D721.long, 2 Tumor Suppressor gene; https://bioinfo.uth.edu/TSGene/, 3 Cancer Gene Census; http://www.nature.com/nrc/journal/v4/n3/abs/nrc1299.html, 4 CancerGenes; http://nar.oxfordjournals.org/content/35/suppl_1/D721.long, 5 Network of Cancer Gene; http://ncg.kcl.ac.uk/index.php, 1Therapeutic Vulnerabilities in Cancer; http://cbio.mskcc.org/cancergenomics/statius/ |
| KEGG_DRUG_METABOLISM_CYTOCHROME_P450 | |
| OMIM | |
| Orphanet | |
| Disease | KEGG Disease: FMO3 |
| MedGen: FMO3 (Human Medical Genetics with Condition) | |
| ClinVar: FMO3 | |
| Phenotype | MGI: FMO3 (International Mouse Phenotyping Consortium) |
| PhenomicDB: FMO3 | |
| Mutations for FMO3 |
| * Under tables are showing count per each tissue to give us broad intuition about tissue specific mutation patterns.You can go to the detailed page for each mutation database's web site. |
| - Statistics for Tissue and Mutation type | Top |
 |
| - For Inter-chromosomal Variations |
| There's no inter-chromosomal structural variation. |
| - For Intra-chromosomal Variations |
| * Intra-chromosomal variantions includes 'intrachromosomal amplicon to amplicon', 'intrachromosomal amplicon to non-amplified dna', 'intrachromosomal deletion', 'intrachromosomal fold-back inversion', 'intrachromosomal inversion', 'intrachromosomal tandem duplication', 'Intrachromosomal unknown type', 'intrachromosomal with inverted orientation', 'intrachromosomal with non-inverted orientation'. |
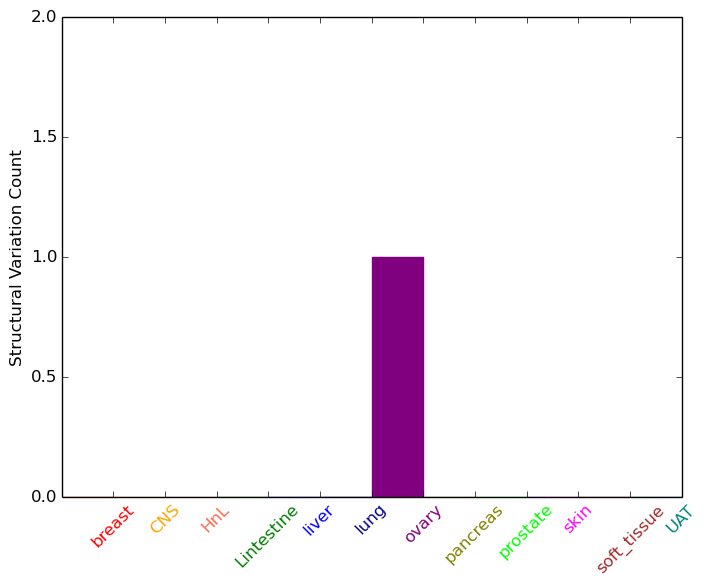 |
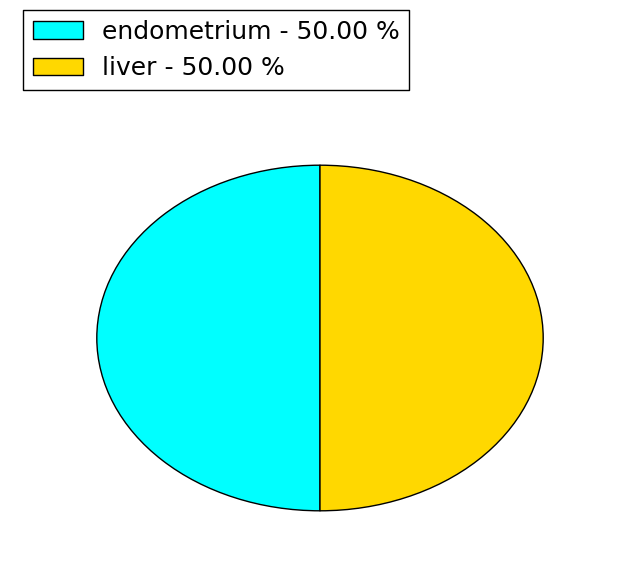
| Sample | Symbol_a | Chr_a | Start_a | End_a | Symbol_b | Chr_b | Start_b | End_b |
| ovary | FMO3 | chr1 | 171080316 | 171080336 | FMO3 | chr1 | 171077139 | 171077159 |
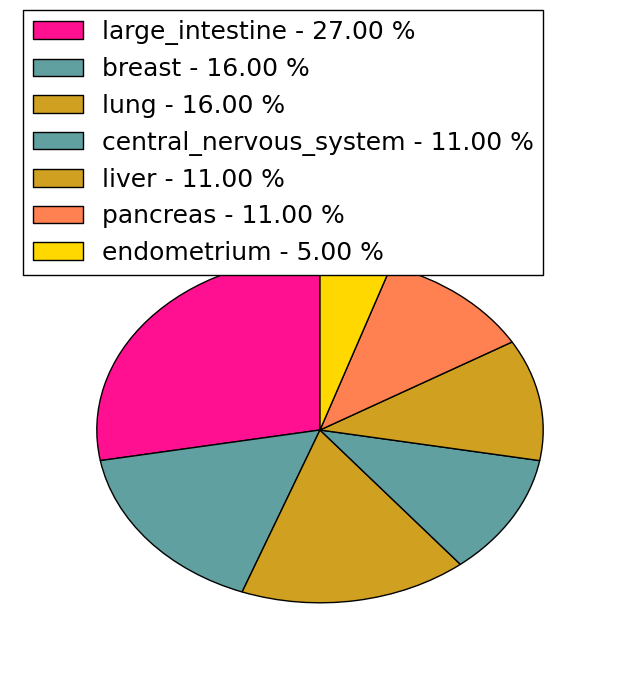
| cf) Tissue number; Tissue name (1;Breast, 2;Central_nervous_system, 3;Haematopoietic_and_lymphoid_tissue, 4;Large_intestine, 5;Liver, 6;Lung, 7;Ovary, 8;Pancreas, 9;Prostate, 10;Skin, 11;Soft_tissue, 12;Upper_aerodigestive_tract) |
| * From mRNA Sanger sequences, Chitars2.0 arranged chimeric transcripts. This table shows FMO3 related fusion information. |
| ID | Head Gene | Tail Gene | Accession | Gene_a | qStart_a | qEnd_a | Chromosome_a | tStart_a | tEnd_a | Gene_a | qStart_a | qEnd_a | Chromosome_a | tStart_a | tEnd_a |
| Top |
| Mutation type/ Tissue ID | brca | cns | cerv | endome | haematopo | kidn | Lintest | liver | lung | ns | ovary | pancre | prost | skin | stoma | thyro | urina | |||
| Total # sample | 2 | |||||||||||||||||||
| GAIN (# sample) | 2 | |||||||||||||||||||
| LOSS (# sample) |
| cf) Tissue ID; Tissue type (1; Breast, 2; Central_nervous_system, 3; Cervix, 4; Endometrium, 5; Haematopoietic_and_lymphoid_tissue, 6; Kidney, 7; Large_intestine, 8; Liver, 9; Lung, 10; NS, 11; Ovary, 12; Pancreas, 13; Prostate, 14; Skin, 15; Stomach, 16; Thyroid, 17; Urinary_tract) |
| Top |
|
 |
| Top |
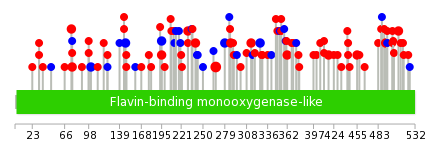
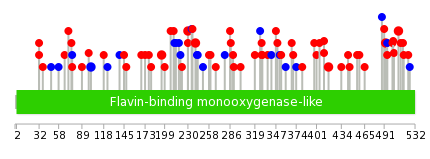
| Stat. for Non-Synonymous SNVs (# total SNVs=54) | (# total SNVs=18) |
 |  |
(# total SNVs=2) | (# total SNVs=0) |
 |
| Top |
| * When you move the cursor on each content, you can see more deailed mutation information on the Tooltip. Those are primary_site,primary_histology,mutation(aa),pubmedID. |
| GRCh37 position | Mutation(aa) | Unique sampleID count |
| chr1:171080110-171080110 | p.E267K | 4 |
| chr1:171086461-171086461 | p.S493* | 3 |
| chr1:171086487-171086487 | p.V502I | 2 |
| chr1:171085395-171085395 | p.E411Q | 2 |
| chr1:171083178-171083178 | p.E287K | 2 |
| chr1:171080030-171080030 | p.G240E | 2 |
| chr1:171085413-171085413 | p.R417C | 2 |
| chr1:171073016-171073016 | p.P75S | 2 |
| chr1:171083403-171083403 | p.E362Q | 2 |
| chr1:171073019-171073019 | p.D76N | 2 |
| Top |
|
 |
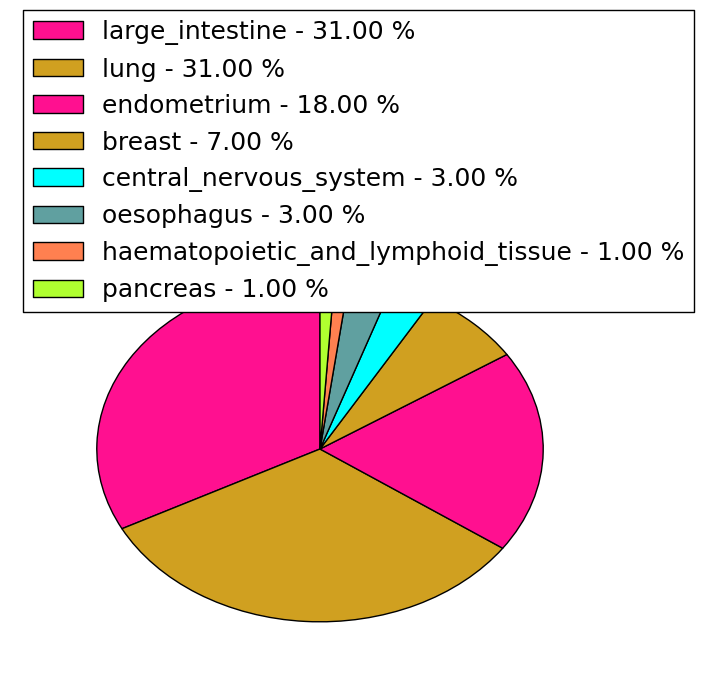
| Point Mutation/ Tissue ID | 1 | 2 | 3 | 4 | 5 | 6 | 7 | 8 | 9 | 10 | 11 | 12 | 13 | 14 | 15 | 16 | 17 | 18 | 19 | 20 |
| # sample | 6 | 1 | 14 | 3 | 3 | 1 | 7 | 3 | 24 | 7 | 1 | 7 | ||||||||
| # mutation | 6 | 1 | 17 | 3 | 3 | 1 | 7 | 4 | 30 | 7 | 1 | 10 | ||||||||
| nonsynonymous SNV | 5 | 14 | 2 | 3 | 6 | 3 | 18 | 6 | 1 | 9 | ||||||||||
| synonymous SNV | 1 | 1 | 3 | 1 | 1 | 1 | 1 | 12 | 1 | 1 |
| cf) Tissue ID; Tissue type (1; BLCA[Bladder Urothelial Carcinoma], 2; BRCA[Breast invasive carcinoma], 3; CESC[Cervical squamous cell carcinoma and endocervical adenocarcinoma], 4; COAD[Colon adenocarcinoma], 5; GBM[Glioblastoma multiforme], 6; Glioma Low Grade, 7; HNSC[Head and Neck squamous cell carcinoma], 8; KICH[Kidney Chromophobe], 9; KIRC[Kidney renal clear cell carcinoma], 10; KIRP[Kidney renal papillary cell carcinoma], 11; LAML[Acute Myeloid Leukemia], 12; LUAD[Lung adenocarcinoma], 13; LUSC[Lung squamous cell carcinoma], 14; OV[Ovarian serous cystadenocarcinoma ], 15; PAAD[Pancreatic adenocarcinoma], 16; PRAD[Prostate adenocarcinoma], 17; SKCM[Skin Cutaneous Melanoma], 18:STAD[Stomach adenocarcinoma], 19:THCA[Thyroid carcinoma], 20:UCEC[Uterine Corpus Endometrial Carcinoma]) |
| Top |
| * We represented just top 10 SNVs. When you move the cursor on each content, you can see more deailed mutation information on the Tooltip. Those are primary_site, primary_histology, mutation(aa), pubmedID. |
| Genomic Position | Mutation(aa) | Unique sampleID count |
| chr1:171080030 | p.G240E,FMO3 | 2 |
| chr1:171085413 | p.R417C,FMO3 | 2 |
| chr1:171083302 | p.S195L,FMO3 | 2 |
| chr1:171086513 | p.S493L,FMO3 | 2 |
| chr1:171079999 | p.L101L,FMO3 | 2 |
| chr1:171077319 | p.P230S,FMO3 | 2 |
| chr1:171073096 | p.F510L,FMO3 | 2 |
| chr1:171086461 | p.A328E,FMO3 | 2 |
| chr1:171085395 | p.E411K,FMO3 | 2 |
| chr1:171077354 | p.H513Y,FMO3 | 1 |
| * Copy number data were extracted from TCGA using R package TCGA-Assembler. The URLs of all public data files on TCGA DCC data server were gathered on Jan-05-2015. Function ProcessCNAData in TCGA-Assembler package was used to obtain gene-level copy number value which is calculated as the average copy number of the genomic region of a gene. |
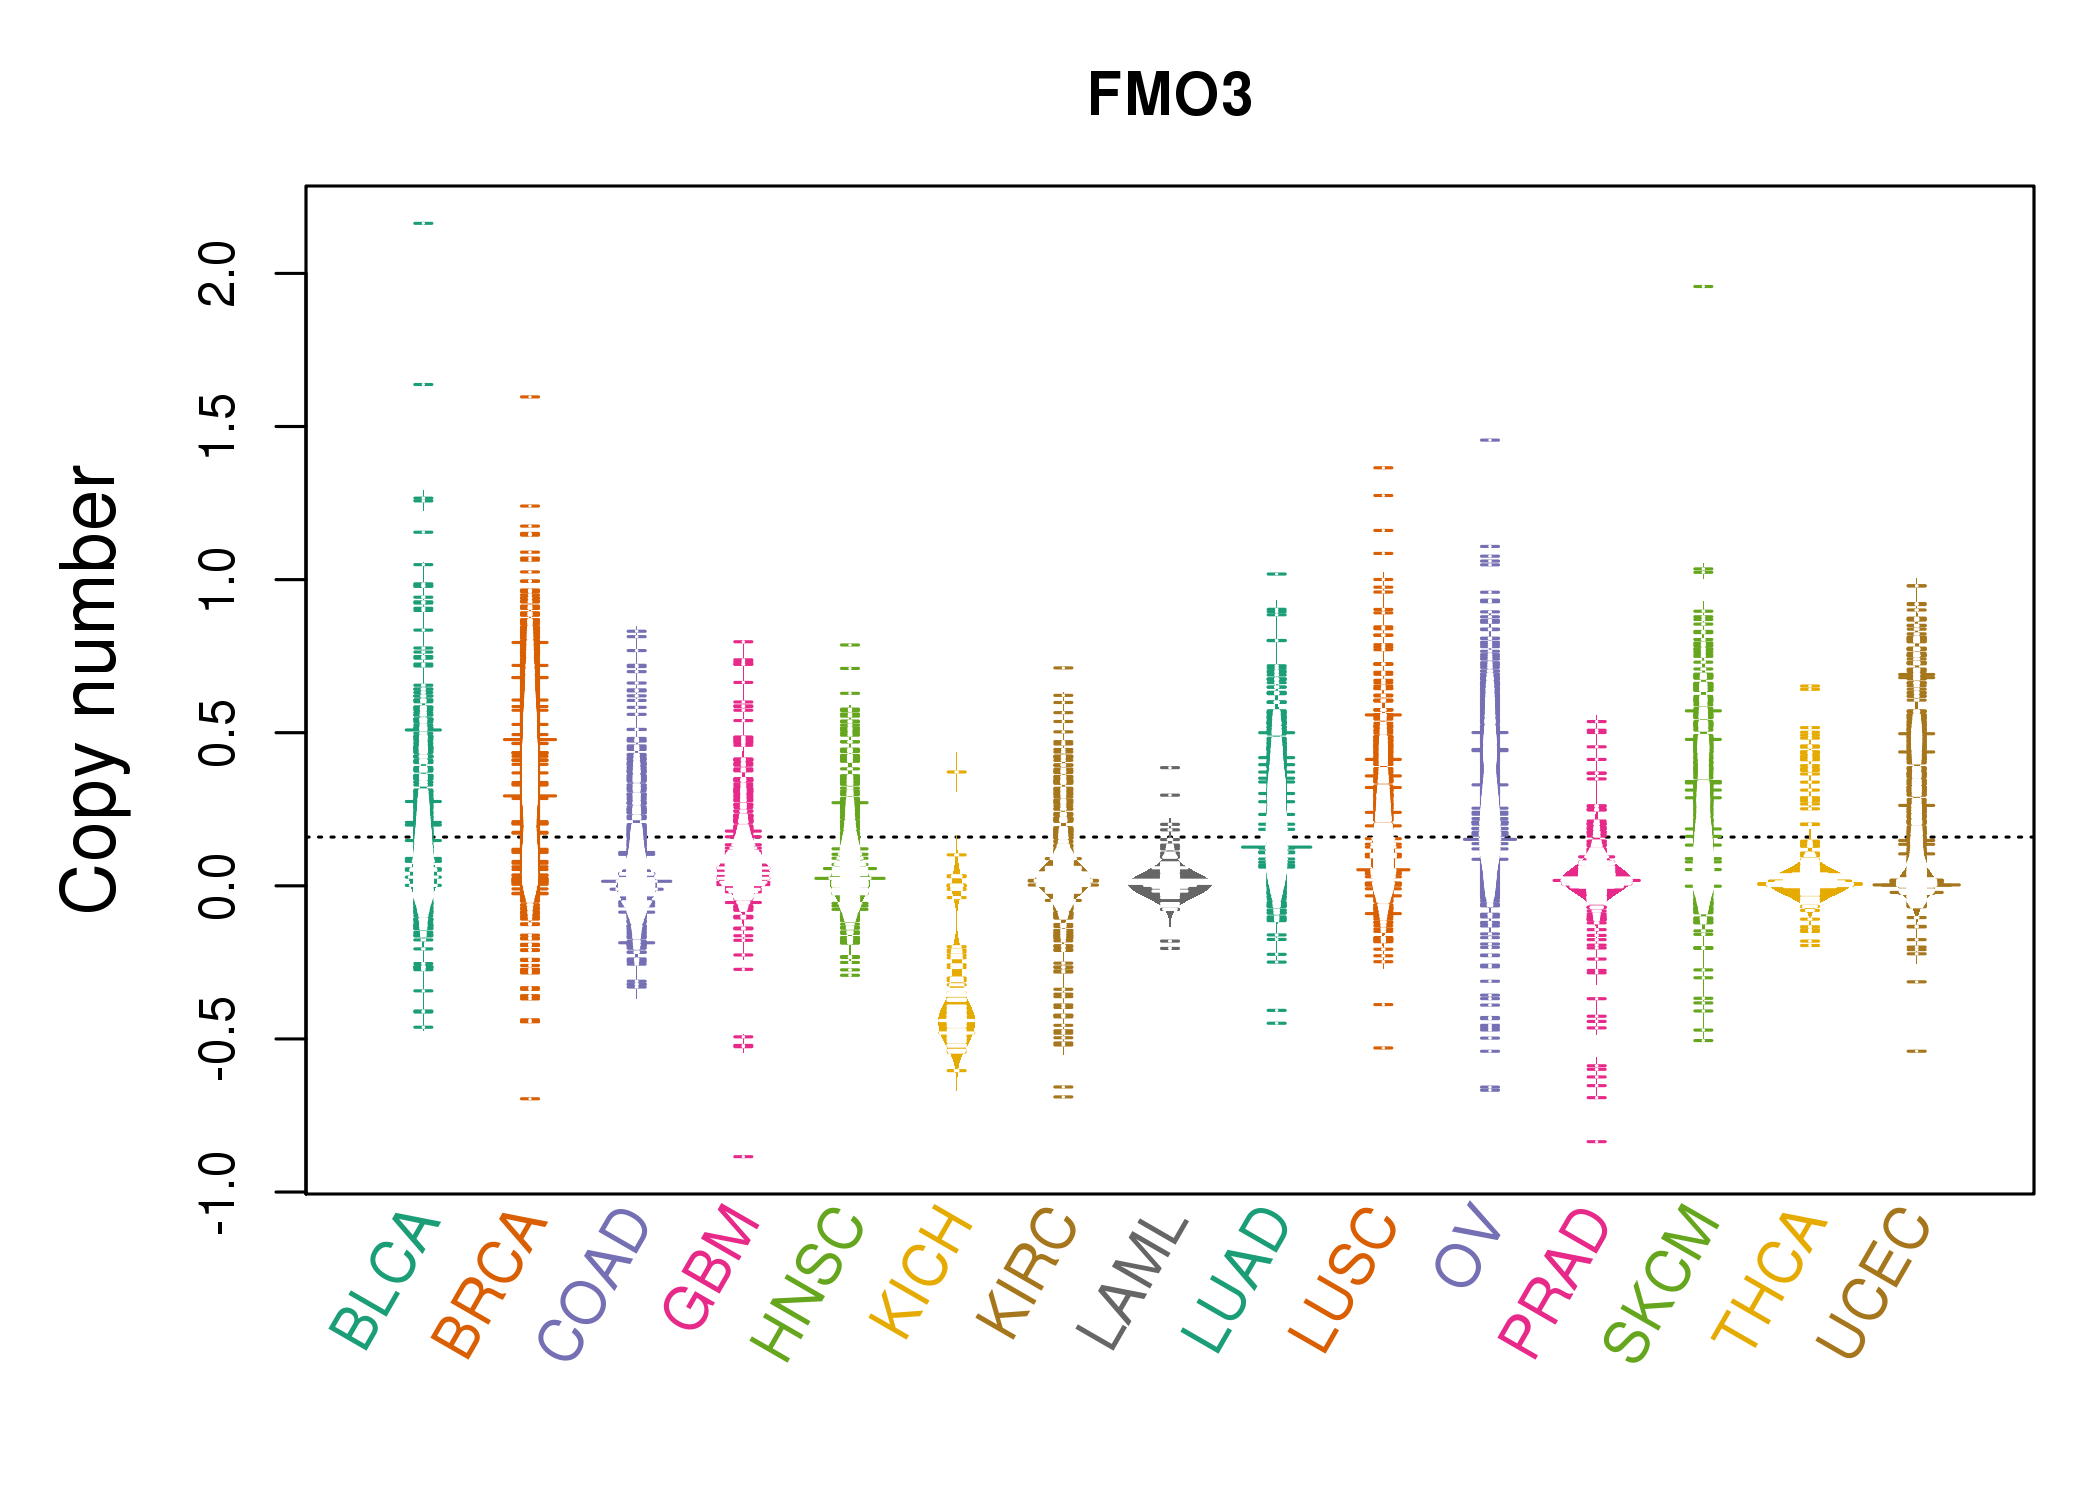 |
| cf) Tissue ID[Tissue type]: BLCA[Bladder Urothelial Carcinoma], BRCA[Breast invasive carcinoma], CESC[Cervical squamous cell carcinoma and endocervical adenocarcinoma], COAD[Colon adenocarcinoma], GBM[Glioblastoma multiforme], Glioma Low Grade, HNSC[Head and Neck squamous cell carcinoma], KICH[Kidney Chromophobe], KIRC[Kidney renal clear cell carcinoma], KIRP[Kidney renal papillary cell carcinoma], LAML[Acute Myeloid Leukemia], LUAD[Lung adenocarcinoma], LUSC[Lung squamous cell carcinoma], OV[Ovarian serous cystadenocarcinoma ], PAAD[Pancreatic adenocarcinoma], PRAD[Prostate adenocarcinoma], SKCM[Skin Cutaneous Melanoma], STAD[Stomach adenocarcinoma], THCA[Thyroid carcinoma], UCEC[Uterine Corpus Endometrial Carcinoma] |
| Top |
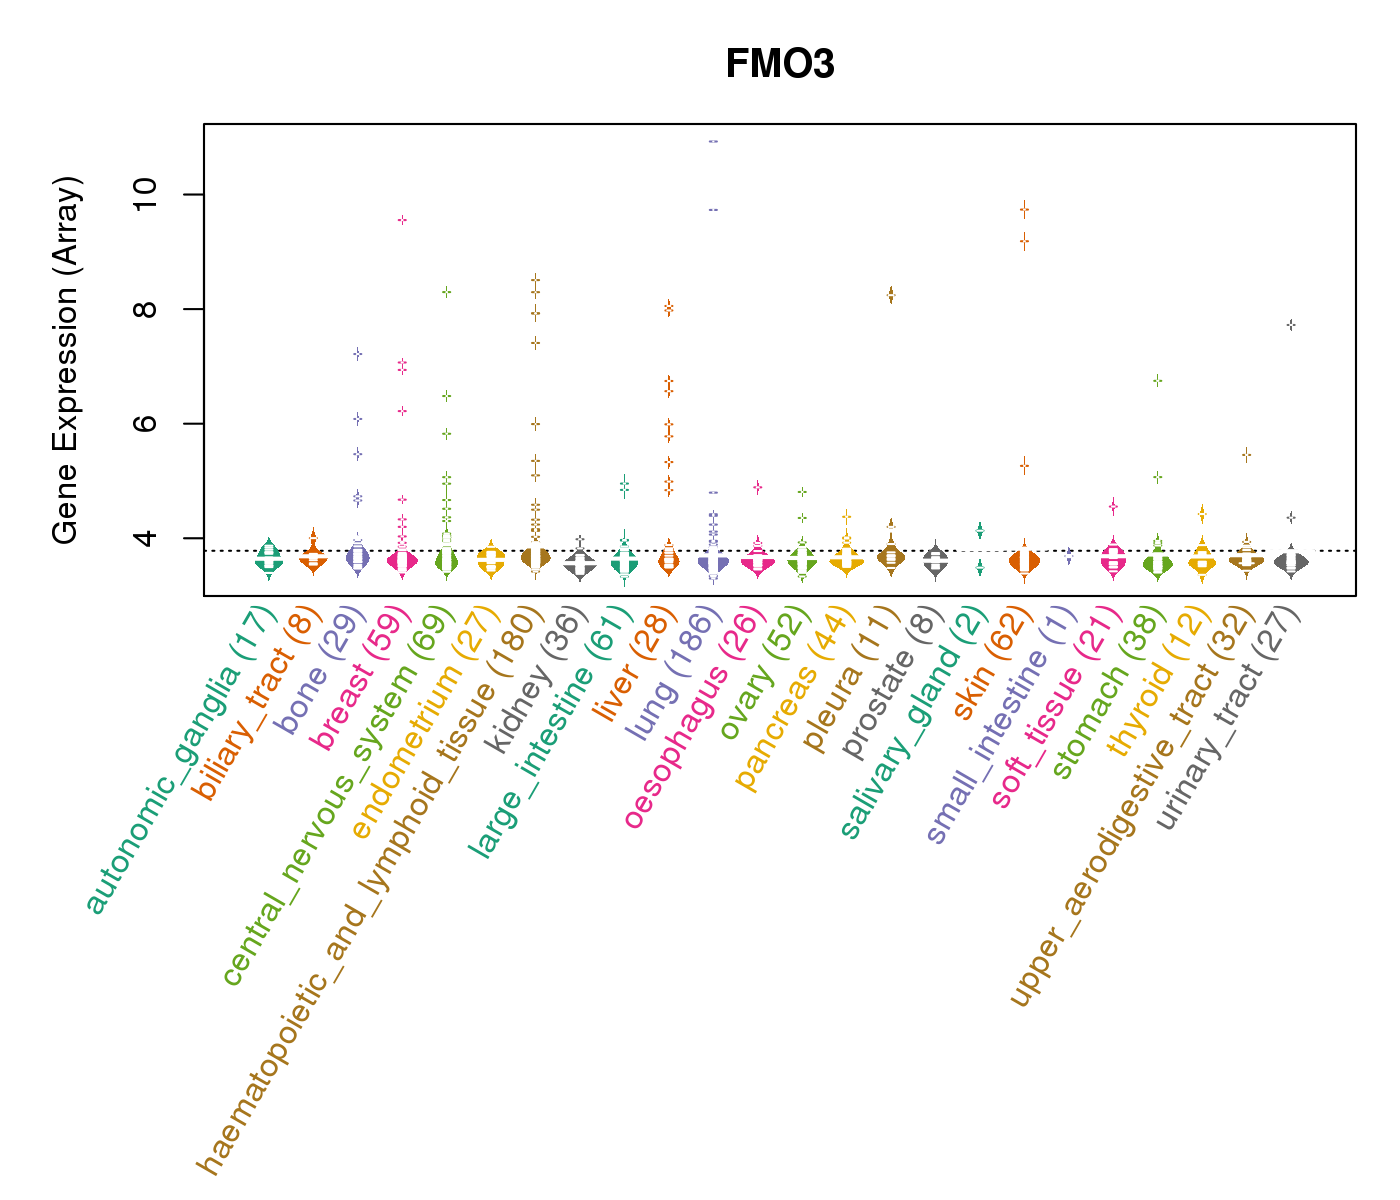
| Gene Expression for FMO3 |
| * CCLE gene expression data were extracted from CCLE_Expression_Entrez_2012-10-18.res: Gene-centric RMA-normalized mRNA expression data. |
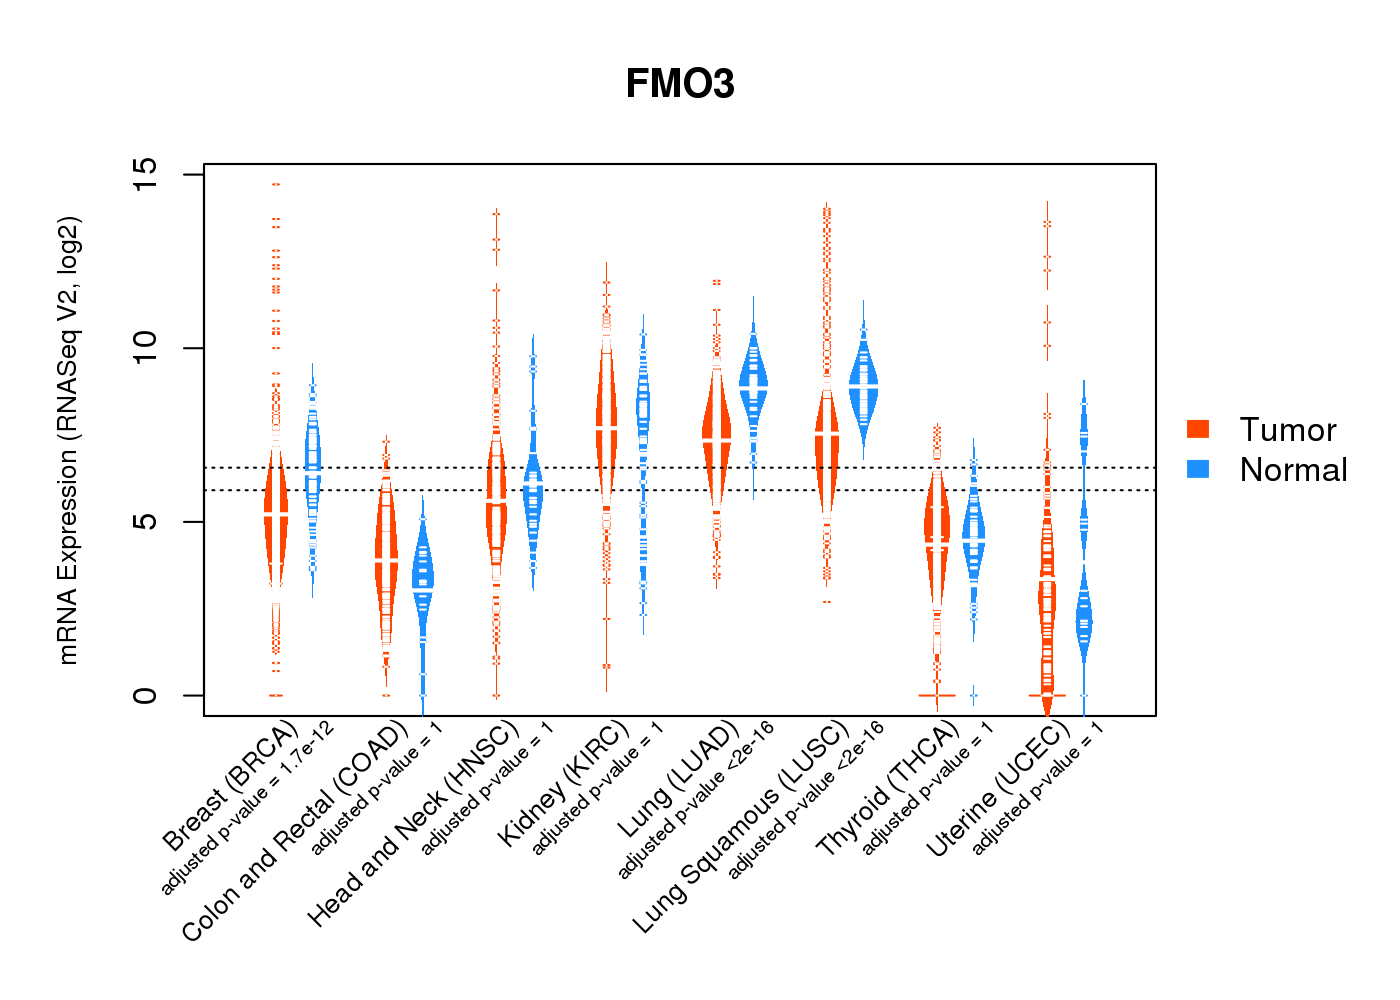
 |
| * Normalized gene expression data of RNASeqV2 was extracted from TCGA using R package TCGA-Assembler. The URLs of all public data files on TCGA DCC data server were gathered at Jan-05-2015. Only eight cancer types have enough normal control samples for differential expression analysis. (t test, adjusted p<0.05 (using Benjamini-Hochberg FDR)) |
 |
| Top |
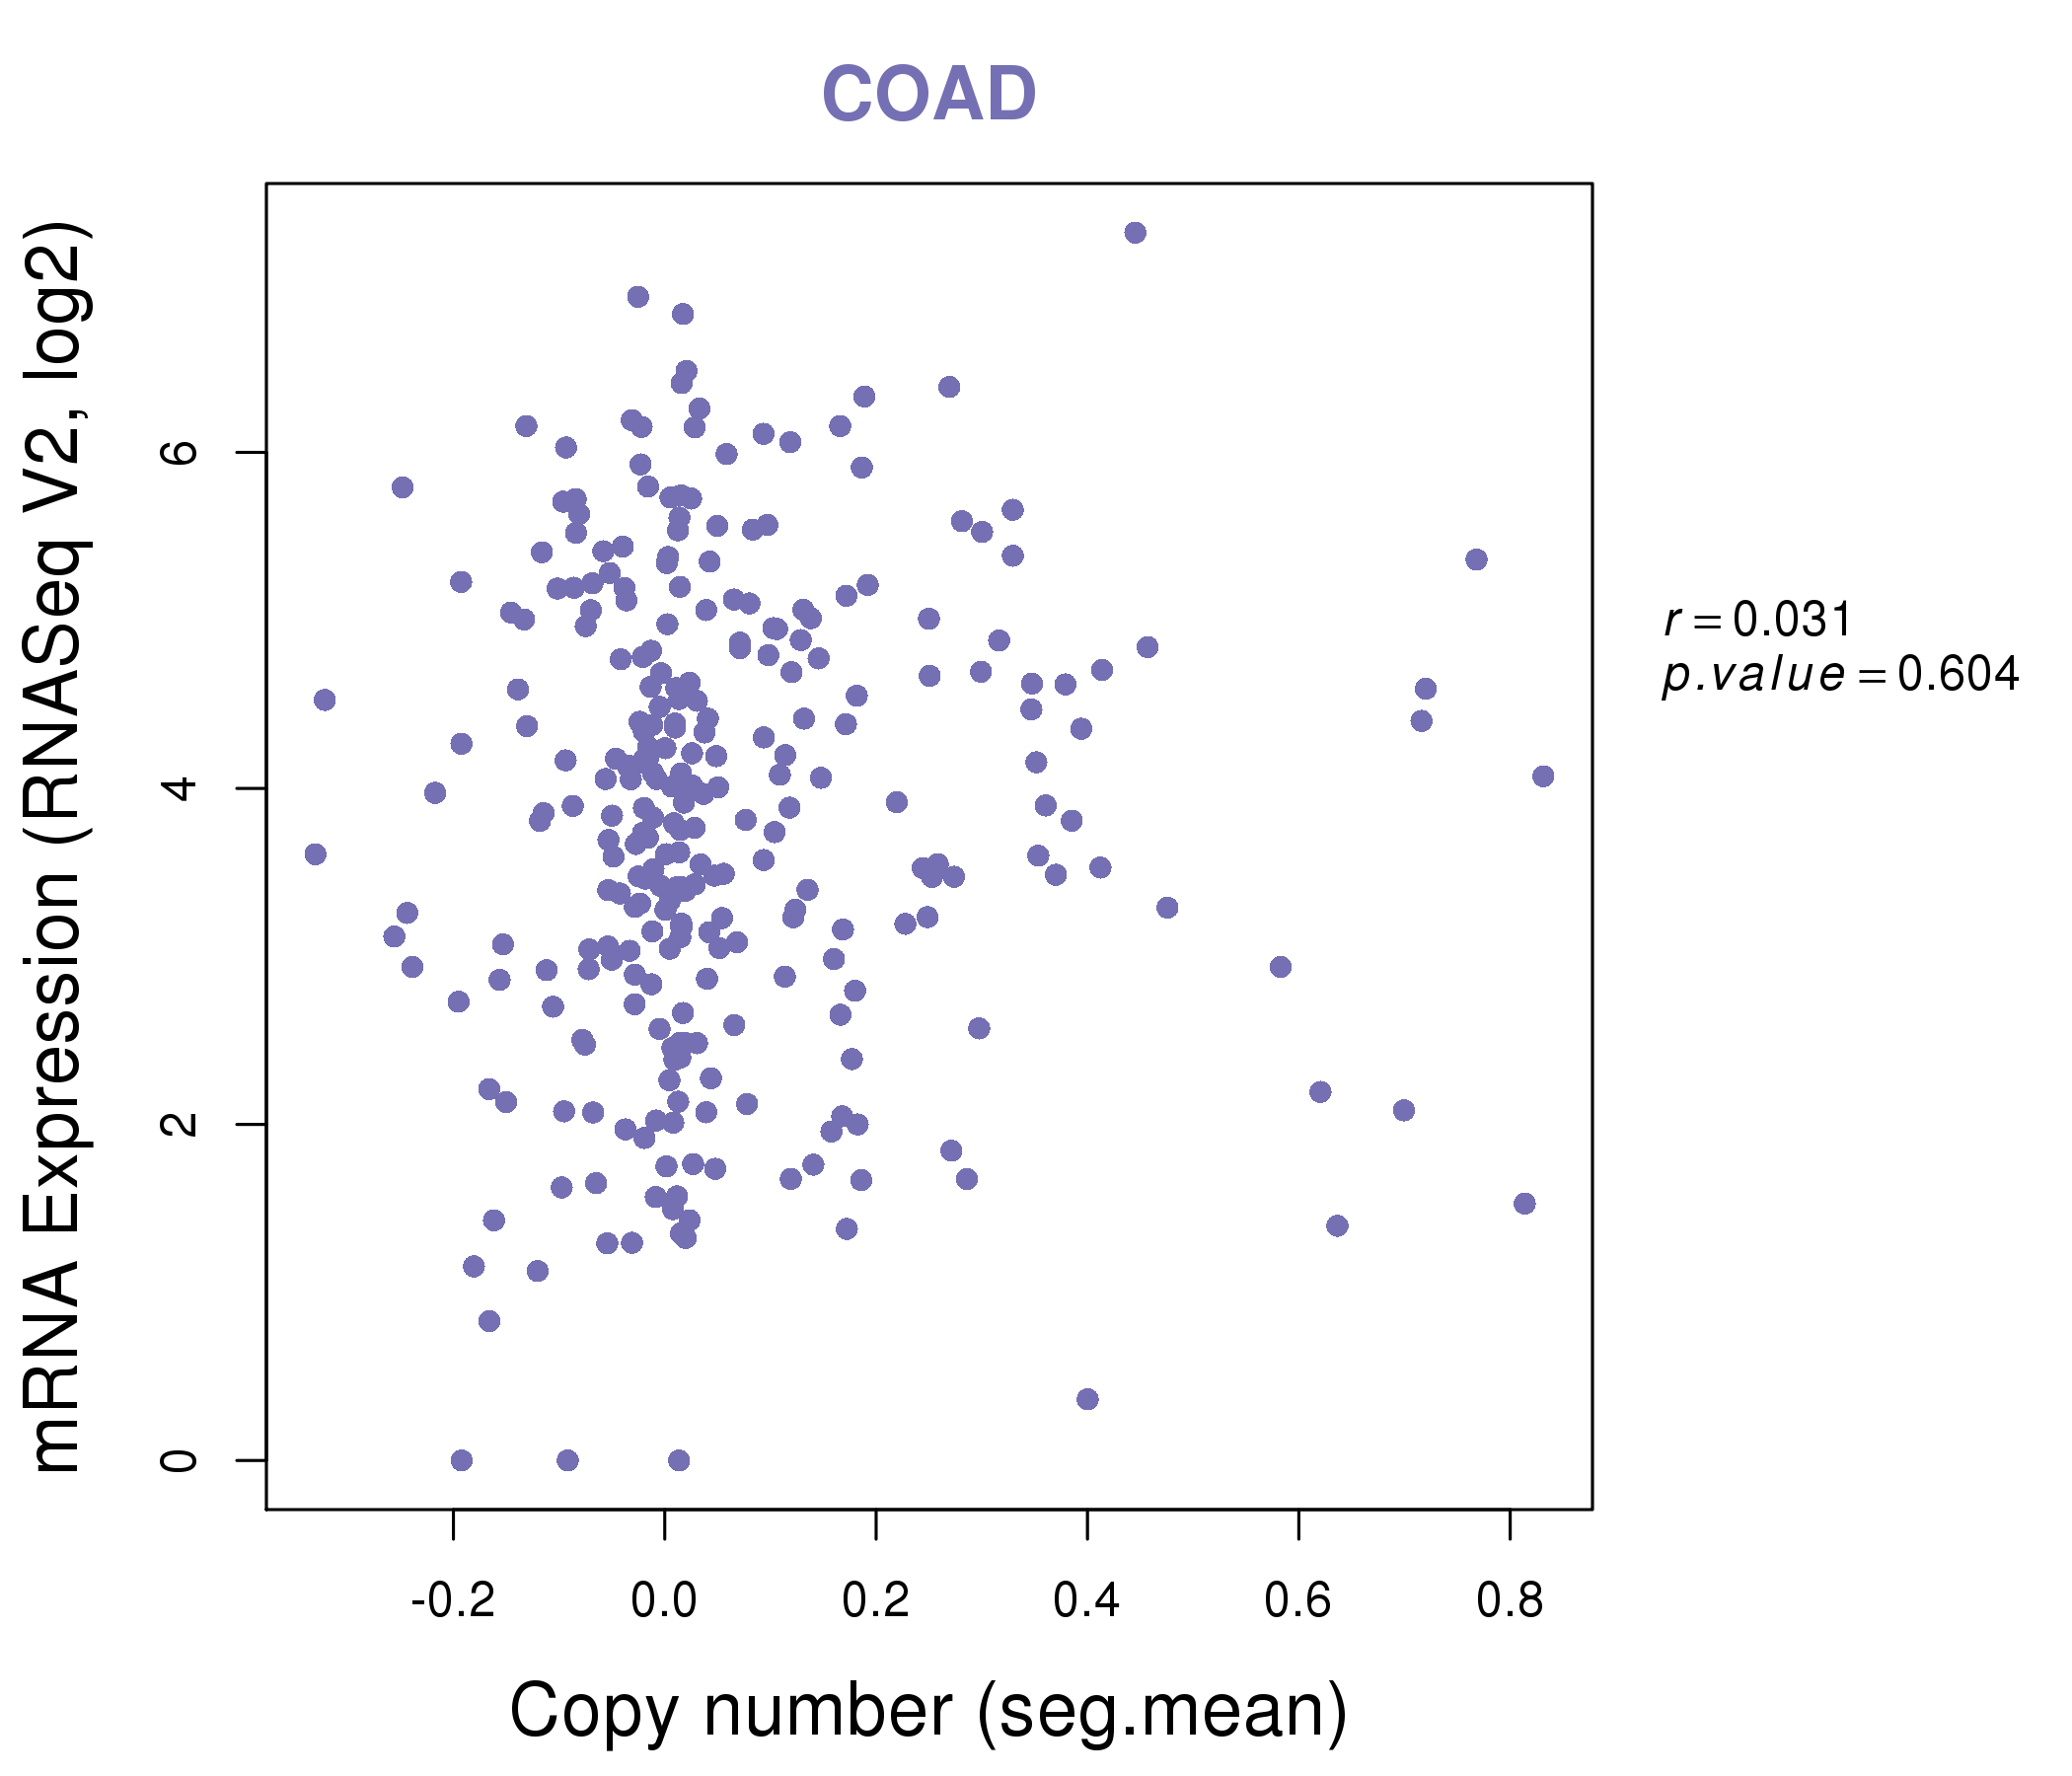
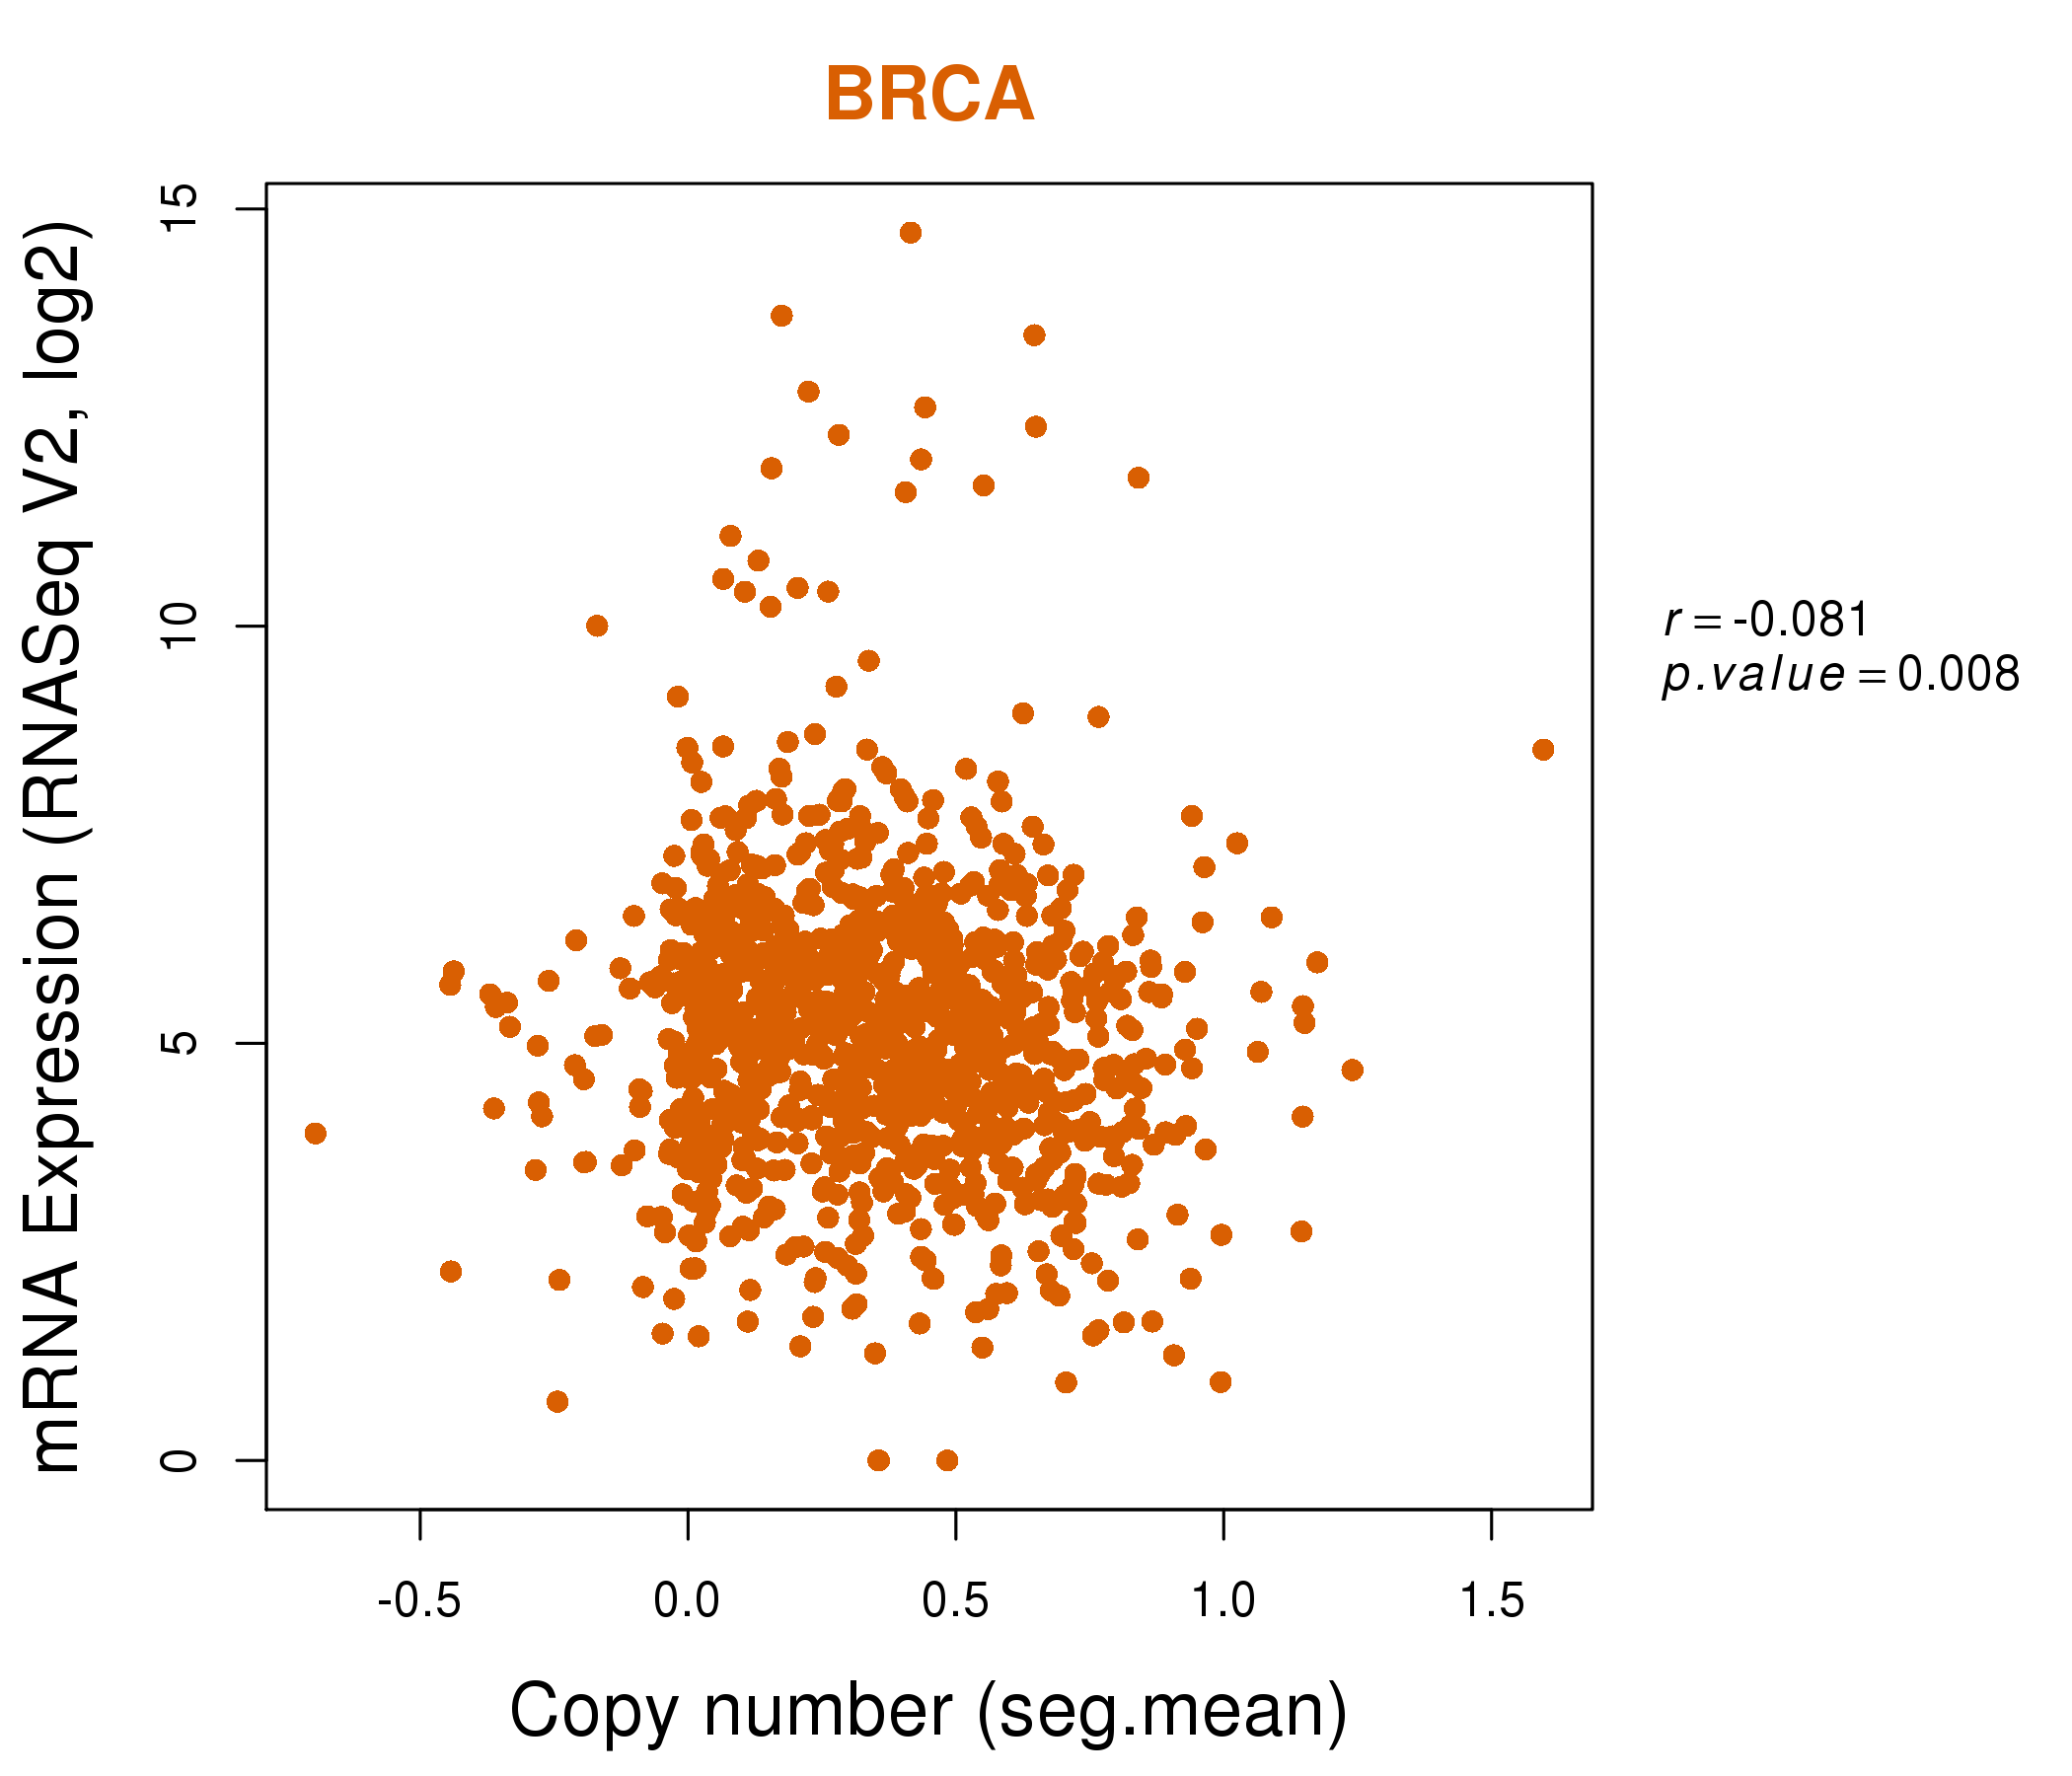
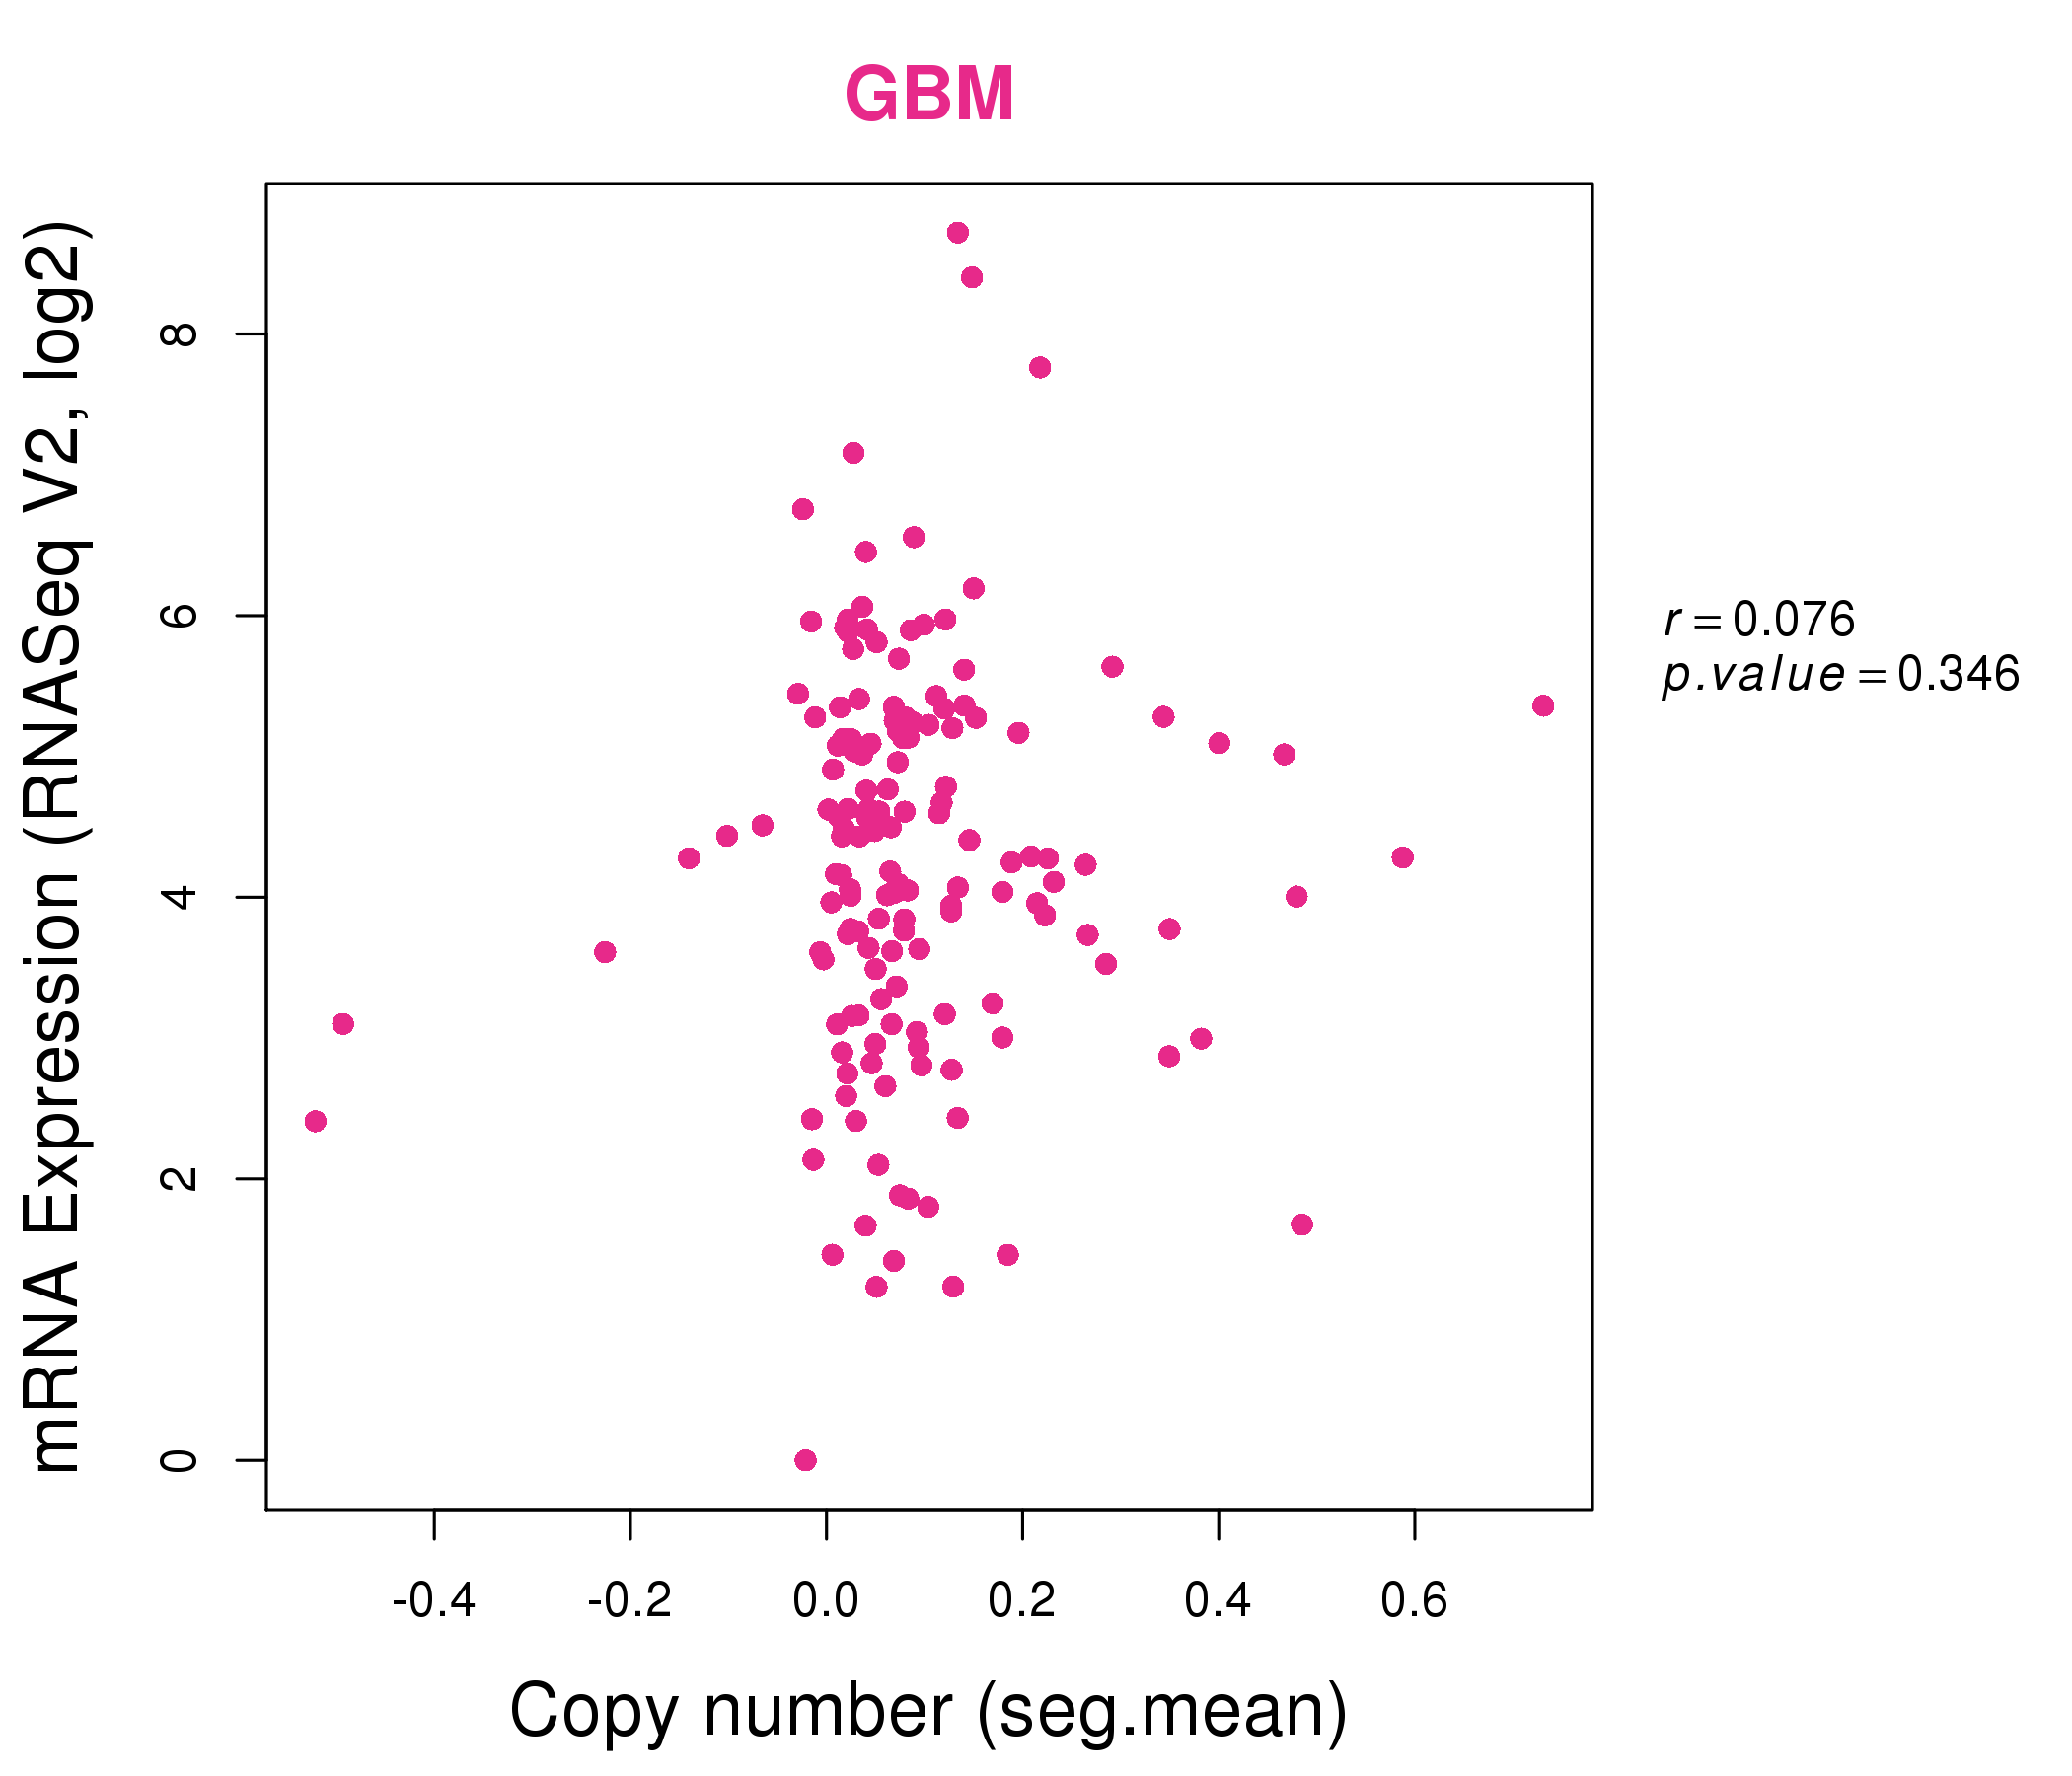
| * This plots show the correlation between CNV and gene expression. |
: Open all plots for all cancer types
 |
|
 |
|
| Top |
| Gene-Gene Network Information |
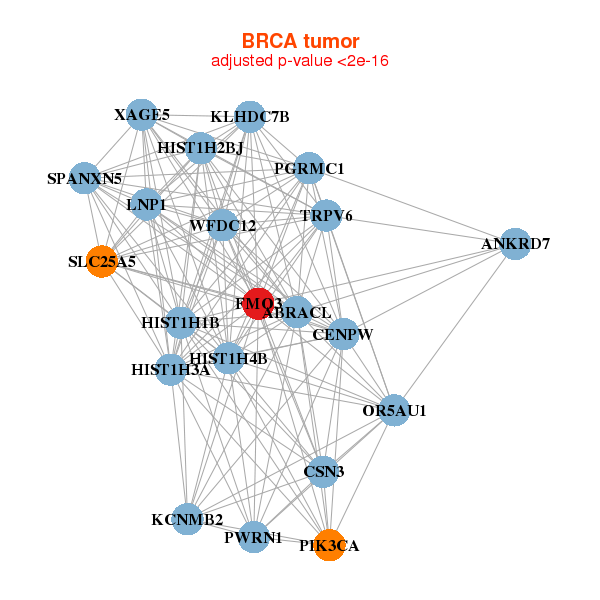
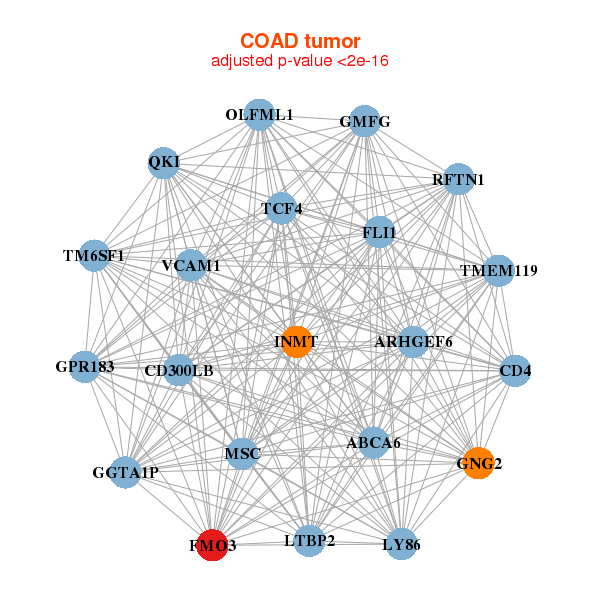
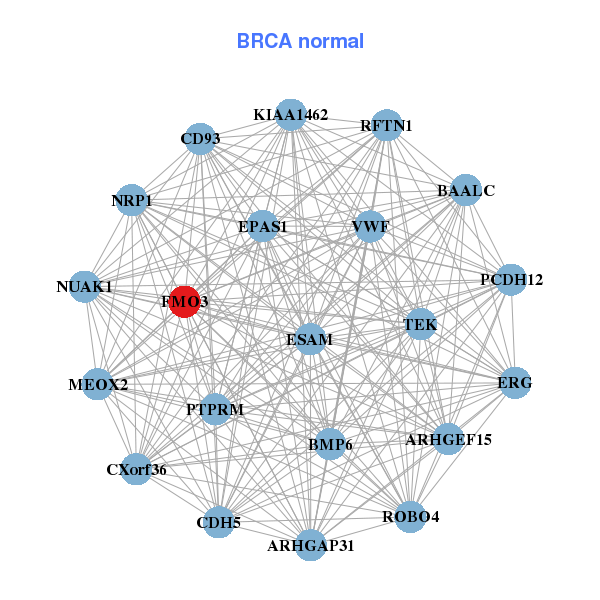
| * Co-Expression network figures were drawn using R package igraph. Only the top 20 genes with the highest correlations were shown. Red circle: input gene, orange circle: cell metabolism gene, sky circle: other gene |
: Open all plots for all cancer types
 |
| ||||
| ANKRD7,ABRACL,CENPW,CSN3,FMO3,HIST1H1B,HIST1H2BJ, HIST1H3A,HIST1H4B,KCNMB2,KLHDC7B,LNP1,OR5AU1,PGRMC1, PIK3CA,PWRN1,SLC25A5,SPANXN5,TRPV6,WFDC12,XAGE5 | ARHGAP31,ARHGEF15,BAALC,BMP6,CD93,CDH5,CXorf36, EPAS1,ERG,ESAM,FMO3,KIAA1462,MEOX2,NRP1, NUAK1,PCDH12,PTPRM,RFTN1,ROBO4,TEK,VWF | ||||
 |
| ||||
| ABCA6,ARHGEF6,CD300LB,CD4,FLI1,FMO3,GGTA1P, GMFG,GNG2,GPR183,INMT,LTBP2,LY86,MSC, OLFML1,QKI,RFTN1,TCF4,TM6SF1,TMEM119,VCAM1 | ANKRD1,CNN3,DUSP21,FMO3,GLUD2,GPC3,GULP1, HAR1A,HSPA6,IAPP,LOC645166,LOC654342,P2RY14,PCCB, PSG1,RB1,RGS18,SNAPC5,TNNT1,VCY,XKR3 |
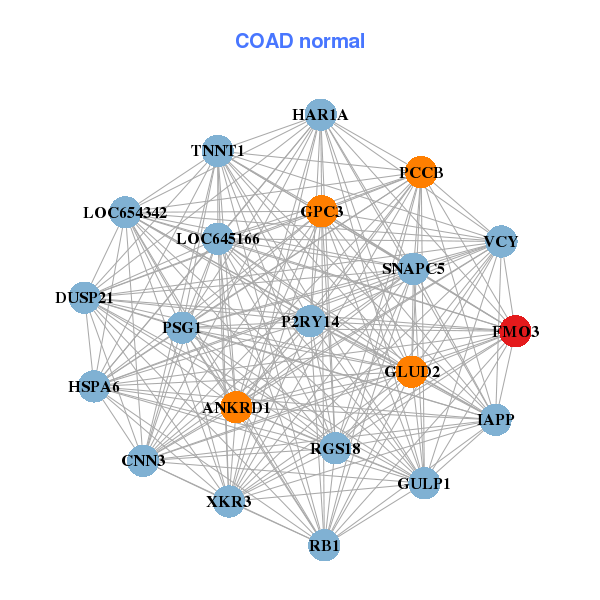
| * Co-Expression network figures were drawn using R package igraph. Only the top 20 genes with the highest correlations were shown. Red circle: input gene, orange circle: cell metabolism gene, sky circle: other gene |
: Open all plots for all cancer types
| Top |
: Open all interacting genes' information including KEGG pathway for all interacting genes from DAVID
| Top |
| Pharmacological Information for FMO3 |
| DB Category | DB Name | DB's ID and Url link |
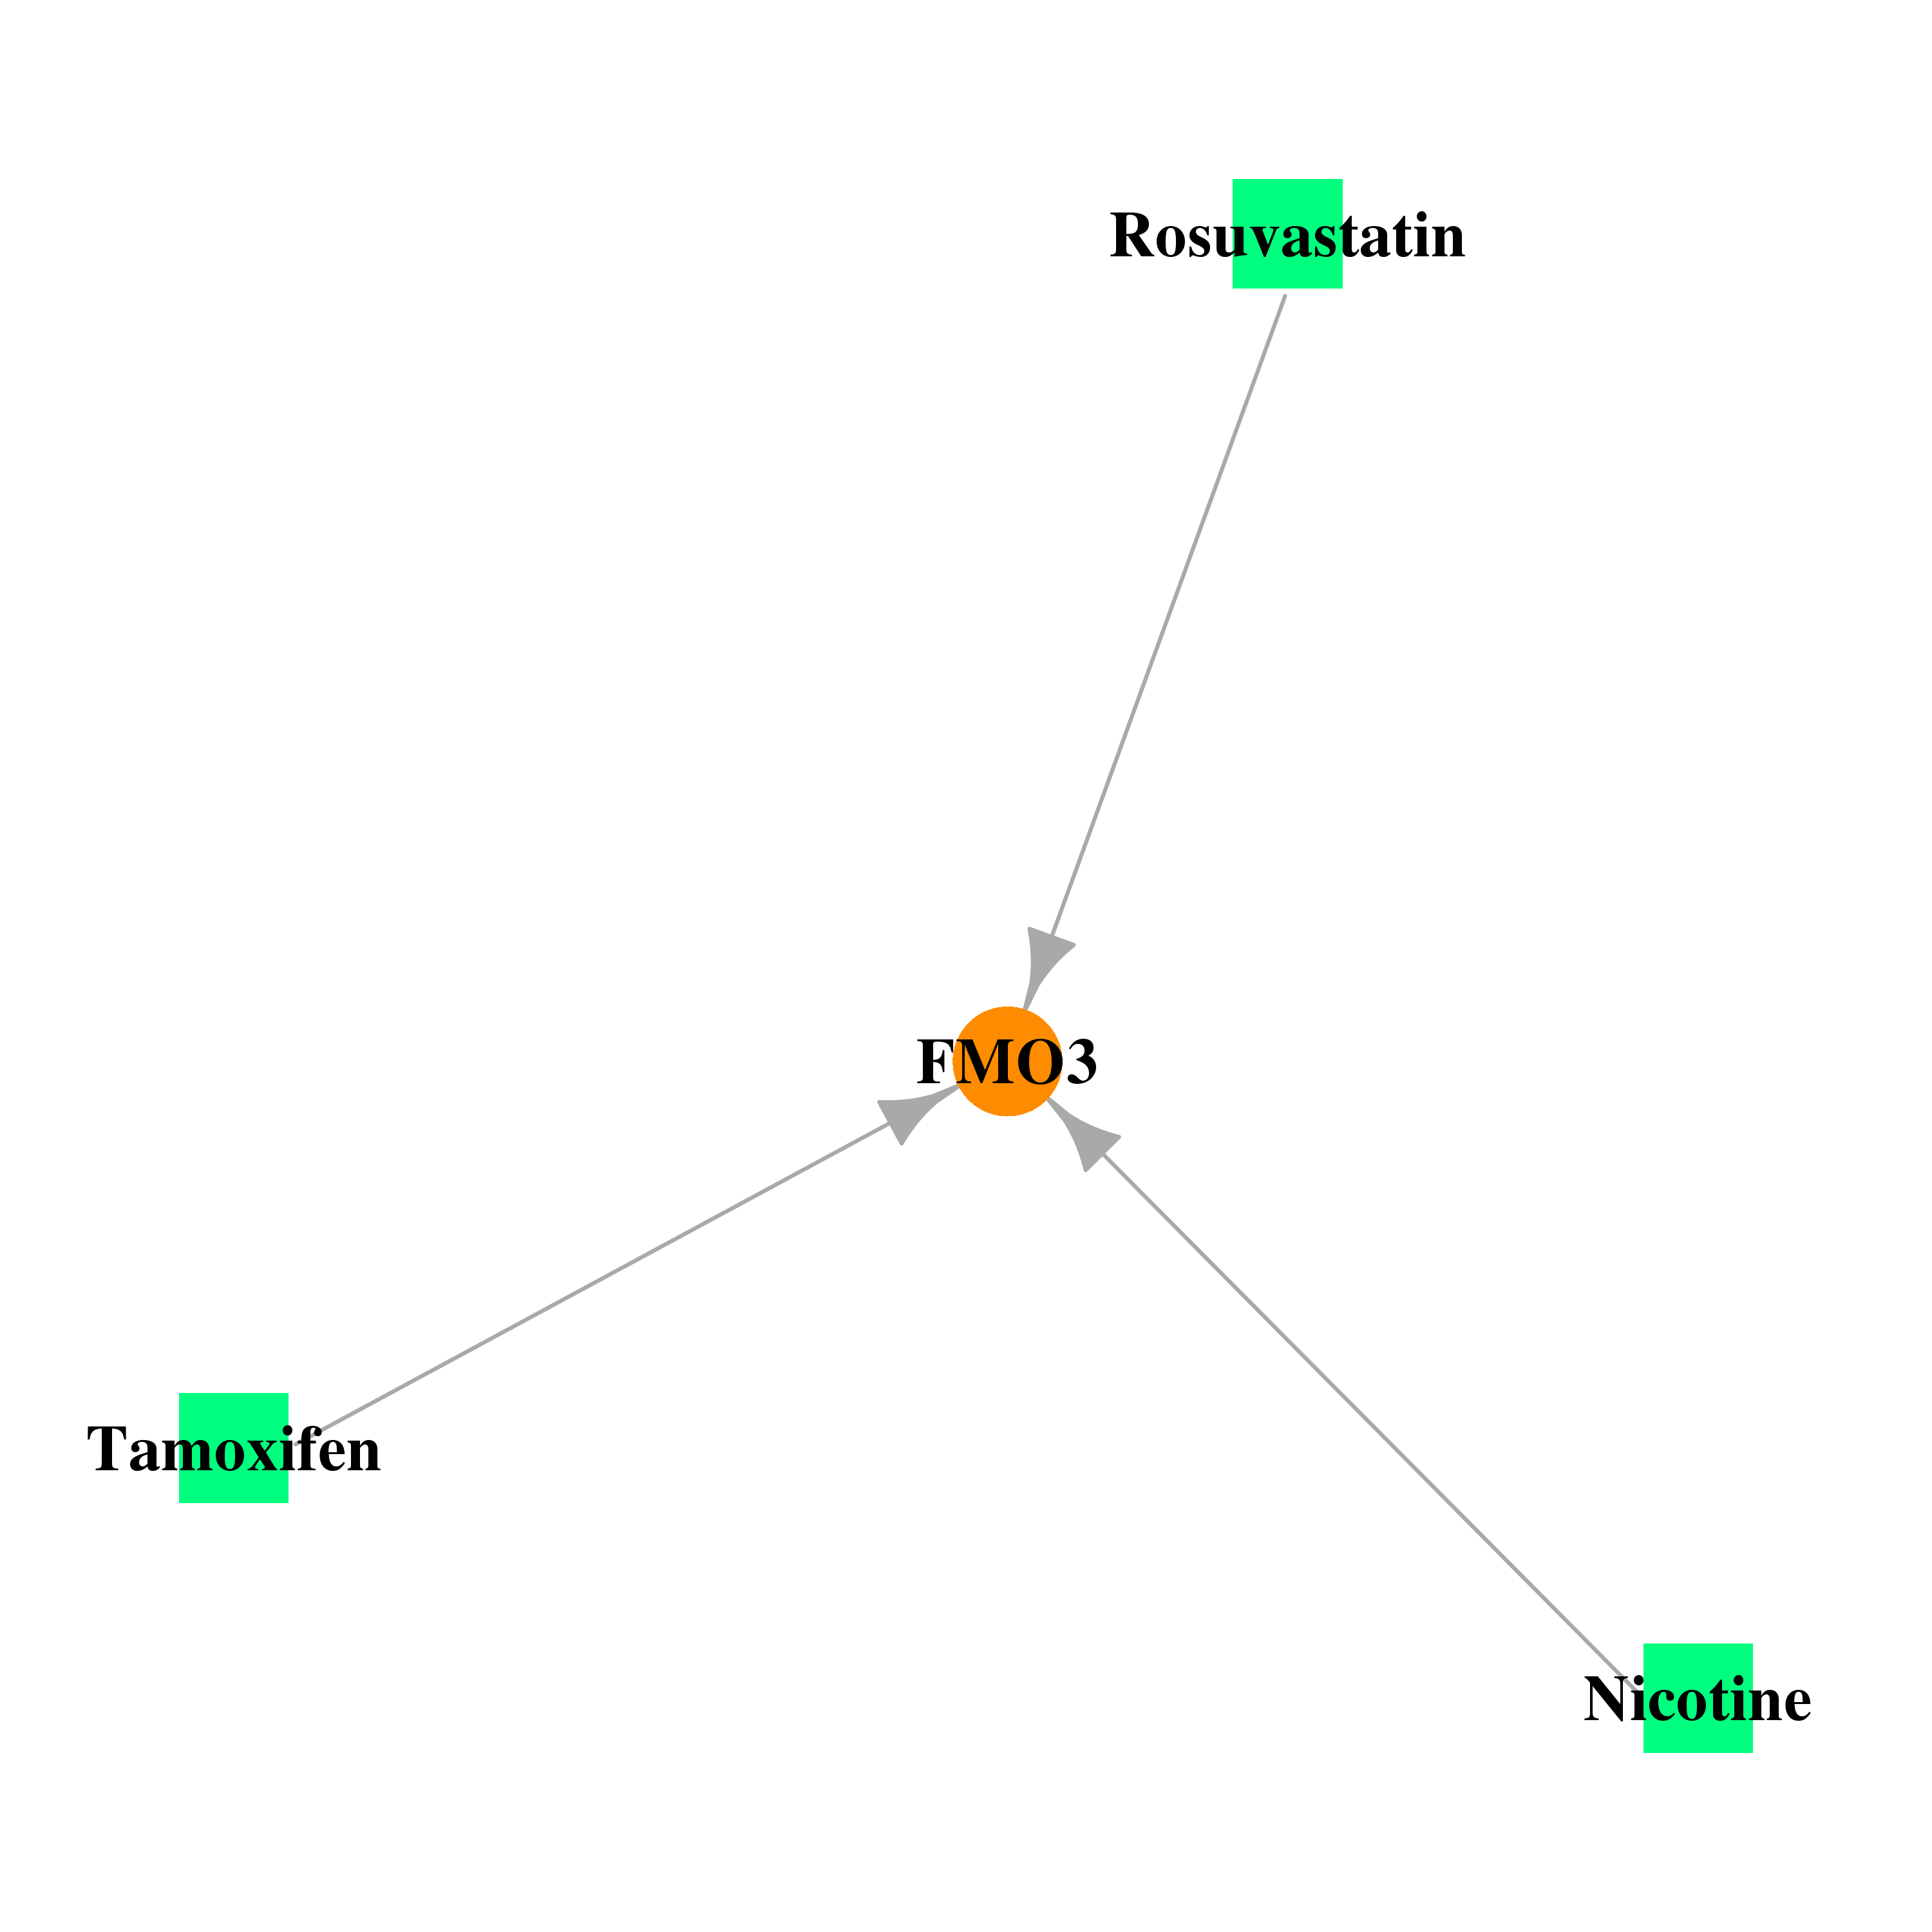
| * Gene Centered Interaction Network. |
 |
| * Drug Centered Interaction Network. |
| DrugBank ID | Target Name | Drug Groups | Generic Name | Drug Centered Network | Drug Structure |
| DB00184 | flavin containing monooxygenase 3 | approved | Nicotine |  | 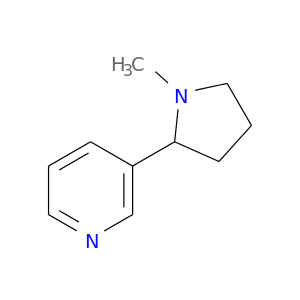 |
| DB01098 | flavin containing monooxygenase 3 | approved | Rosuvastatin | 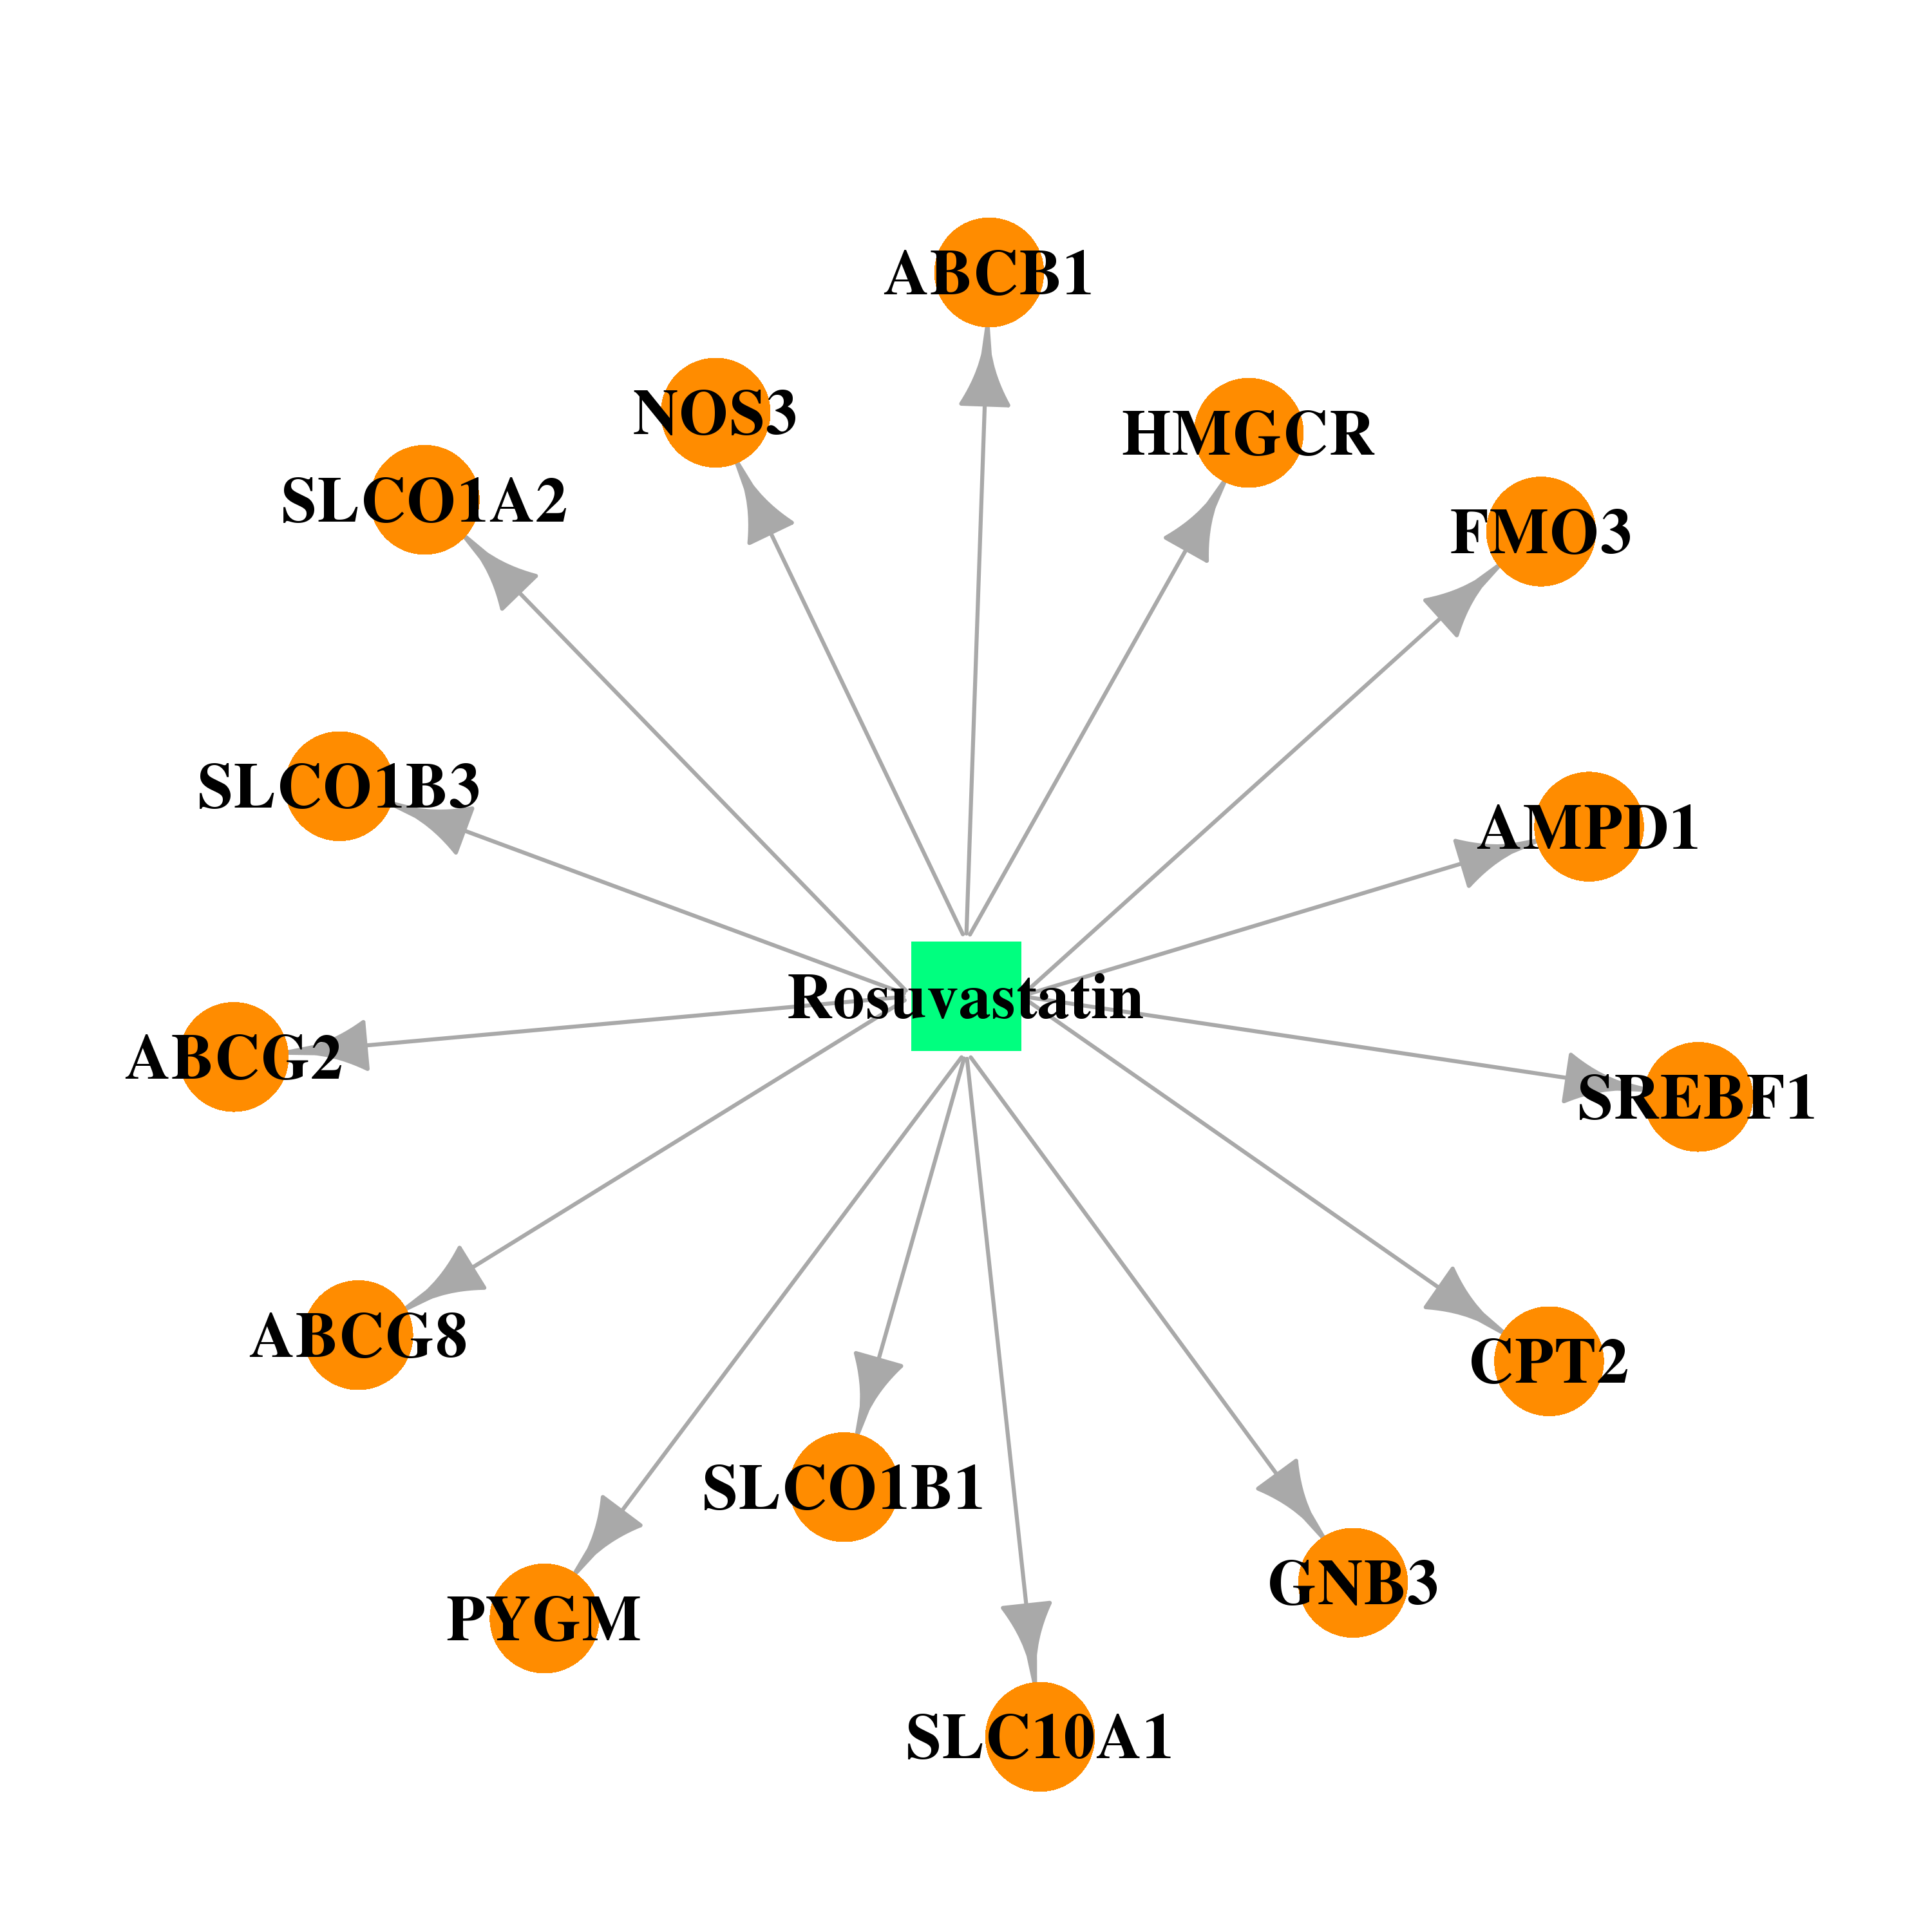 |  |
| DB00675 | flavin containing monooxygenase 3 | approved | Tamoxifen |  |  |
| Top |
| Cross referenced IDs for FMO3 |
| * We obtained these cross-references from Uniprot database. It covers 150 different DBs, 18 categories. http://www.uniprot.org/help/cross_references_section |
: Open all cross reference information
|
Copyright © 2016-Present - The Univsersity of Texas Health Science Center at Houston @ |