|
||||||||||||||||||||
| |
| Phenotypic Information (metabolism pathway, cancer, disease, phenome) |
| |
| |
| Gene-Gene Network Information: Co-Expression Network, Interacting Genes & KEGG |
| |
|


| Gene Summary for SMG6 |
| Top |
| Phenotypic Information for SMG6(metabolism pathway, cancer, disease, phenome) |
| Cancer | CGAP: SMG6 |
| Familial Cancer Database: SMG6 | |
| * This gene is included in those cancer gene databases. |
|
|
|
|
|
| . | ||||||||||||||
Oncogene 1 | Significant driver gene in | |||||||||||||||||||
| cf) number; DB name 1 Oncogene; http://nar.oxfordjournals.org/content/35/suppl_1/D721.long, 2 Tumor Suppressor gene; https://bioinfo.uth.edu/TSGene/, 3 Cancer Gene Census; http://www.nature.com/nrc/journal/v4/n3/abs/nrc1299.html, 4 CancerGenes; http://nar.oxfordjournals.org/content/35/suppl_1/D721.long, 5 Network of Cancer Gene; http://ncg.kcl.ac.uk/index.php, 1Therapeutic Vulnerabilities in Cancer; http://cbio.mskcc.org/cancergenomics/statius/ |
| REACTOME_METABOLISM_OF_MRNA REACTOME_METABOLISM_OF_RNA | |
| OMIM | |
| Orphanet | |
| Disease | KEGG Disease: SMG6 |
| MedGen: SMG6 (Human Medical Genetics with Condition) | |
| ClinVar: SMG6 | |
| Phenotype | MGI: SMG6 (International Mouse Phenotyping Consortium) |
| PhenomicDB: SMG6 | |
| Mutations for SMG6 |
| * Under tables are showing count per each tissue to give us broad intuition about tissue specific mutation patterns.You can go to the detailed page for each mutation database's web site. |
| - Statistics for Tissue and Mutation type | Top |
 |
| - For Inter-chromosomal Variations |
| There's no inter-chromosomal structural variation. |
| - For Intra-chromosomal Variations |
| There's no intra-chromosomal structural variation. |
| Sample | Symbol_a | Chr_a | Start_a | End_a | Symbol_b | Chr_b | Start_b | End_b |
| cf) Tissue number; Tissue name (1;Breast, 2;Central_nervous_system, 3;Haematopoietic_and_lymphoid_tissue, 4;Large_intestine, 5;Liver, 6;Lung, 7;Ovary, 8;Pancreas, 9;Prostate, 10;Skin, 11;Soft_tissue, 12;Upper_aerodigestive_tract) |
| * From mRNA Sanger sequences, Chitars2.0 arranged chimeric transcripts. This table shows SMG6 related fusion information. |
| ID | Head Gene | Tail Gene | Accession | Gene_a | qStart_a | qEnd_a | Chromosome_a | tStart_a | tEnd_a | Gene_a | qStart_a | qEnd_a | Chromosome_a | tStart_a | tEnd_a |
| DA746032 | ZFP36L1 | 1 | 118 | 14 | 69261839 | 69261956 | SMG6 | 116 | 563 | 17 | 1968369 | 1972227 | |
| BP250136 | NPIPB7 | 1 | 382 | 16 | 28548976 | 28550333 | SMG6 | 377 | 592 | 17 | 2057997 | 2058212 | |
| BP223879 | SMG6 | 1 | 147 | 17 | 2113443 | 2113589 | DSG2 | 147 | 661 | 18 | 29111160 | 29118801 | |
| BE837736 | SMG6 | 1 | 292 | 17 | 2115708 | 2115998 | ITFG2 | 284 | 483 | 12 | 2933402 | 2933601 | |
| BF733944 | SMG6 | 14 | 229 | 17 | 2203163 | 2203379 | TNRC6A | 214 | 309 | 16 | 24802394 | 24802489 | |
| Top |
| There's no copy number variation information in COSMIC data for this gene. |
| Top |
|
 |
| Top |
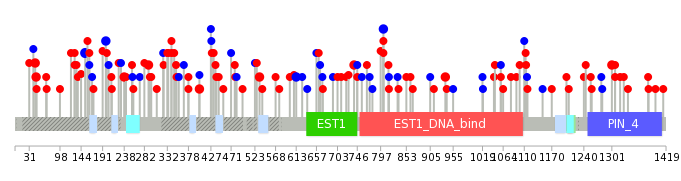
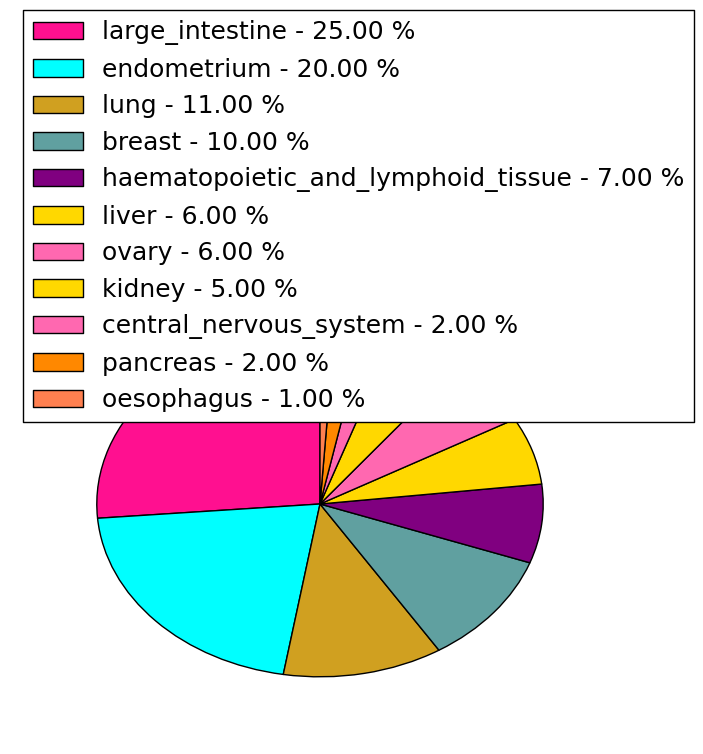
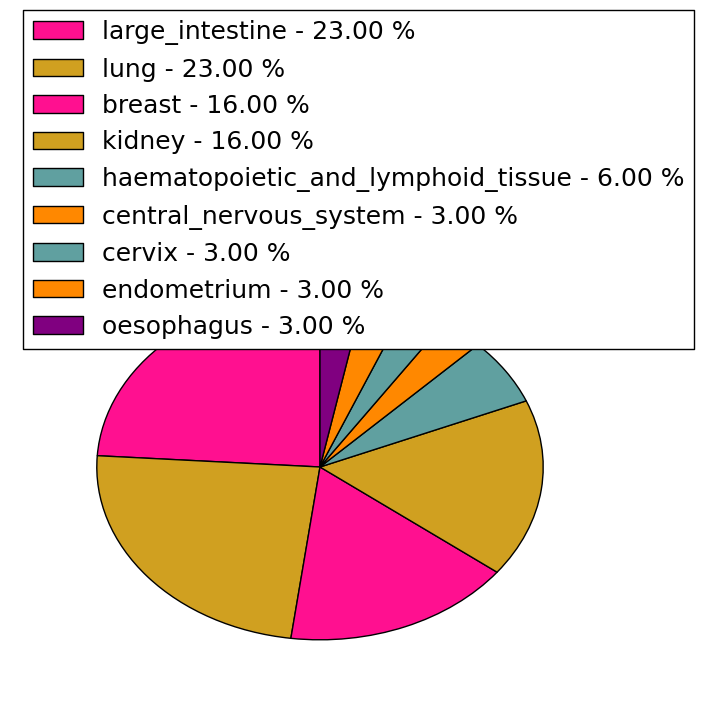
| Stat. for Non-Synonymous SNVs (# total SNVs=89) | (# total SNVs=30) |
 |  |
(# total SNVs=1) | (# total SNVs=0) |
 |
| Top |
| * When you move the cursor on each content, you can see more deailed mutation information on the Tooltip. Those are primary_site,primary_histology,mutation(aa),pubmedID. |
| GRCh37 position | Mutation(aa) | Unique sampleID count |
| chr17:2203200-2203200 | p.Q283* | 3 |
| chr17:2203453-2203453 | p.A198A | 2 |
| chr17:2202449-2202449 | p.G533D | 2 |
| chr17:2139842-2139842 | p.R938H | 2 |
| chr17:2186958-2186958 | p.K803K | 2 |
| chr17:2196207-2196207 | p.R739Q | 2 |
| chr17:1989033-1989033 | p.R1174* | 2 |
| chr17:2203334-2203334 | p.P238L | 2 |
| chr17:1968908-1968908 | p.R1301C | 2 |
| chr17:2202208-2202208 | p.A613A | 2 |
| Top |
|
 |
| Point Mutation/ Tissue ID | 1 | 2 | 3 | 4 | 5 | 6 | 7 | 8 | 9 | 10 | 11 | 12 | 13 | 14 | 15 | 16 | 17 | 18 | 19 | 20 |
| # sample | 2 | 1 | 3 | 15 | 3 | 5 | 7 | 6 | 1 | 1 | 7 | 15 | 1 | 11 | ||||||
| # mutation | 2 | 1 | 3 | 16 | 3 | 5 | 7 | 6 | 1 | 1 | 8 | 16 | 1 | 15 | ||||||
| nonsynonymous SNV | 1 | 1 | 1 | 13 | 3 | 3 | 6 | 5 | 1 | 5 | 8 | 14 | ||||||||
| synonymous SNV | 1 | 2 | 3 | 2 | 1 | 1 | 1 | 3 | 8 | 1 | 1 |
| cf) Tissue ID; Tissue type (1; BLCA[Bladder Urothelial Carcinoma], 2; BRCA[Breast invasive carcinoma], 3; CESC[Cervical squamous cell carcinoma and endocervical adenocarcinoma], 4; COAD[Colon adenocarcinoma], 5; GBM[Glioblastoma multiforme], 6; Glioma Low Grade, 7; HNSC[Head and Neck squamous cell carcinoma], 8; KICH[Kidney Chromophobe], 9; KIRC[Kidney renal clear cell carcinoma], 10; KIRP[Kidney renal papillary cell carcinoma], 11; LAML[Acute Myeloid Leukemia], 12; LUAD[Lung adenocarcinoma], 13; LUSC[Lung squamous cell carcinoma], 14; OV[Ovarian serous cystadenocarcinoma ], 15; PAAD[Pancreatic adenocarcinoma], 16; PRAD[Prostate adenocarcinoma], 17; SKCM[Skin Cutaneous Melanoma], 18:STAD[Stomach adenocarcinoma], 19:THCA[Thyroid carcinoma], 20:UCEC[Uterine Corpus Endometrial Carcinoma]) |
| Top |
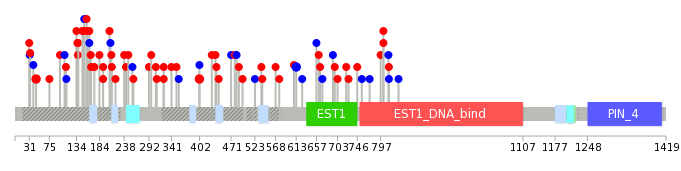
| * We represented just top 10 SNVs. When you move the cursor on each content, you can see more deailed mutation information on the Tooltip. Those are primary_site, primary_histology, mutation(aa), pubmedID. |
| Genomic Position | Mutation(aa) | Unique sampleID count |
| chr17:2202843 | p.A613A | 2 |
| chr17:2203910 | p.R402W | 2 |
| chr17:2202208 | p.R46H | 2 |
| chr17:2186960 | p.T208T,SMG6 | 1 |
| chr17:1972142 | p.R815W | 1 |
| chr17:2201202 | p.Q657Q | 1 |
| chr17:2203416 | p.G437V | 1 |
| chr17:2089982 | p.A192V | 1 |
| chr17:2202561 | p.E206V,SMG6 | 1 |
| chr17:2203823 | p.K814K | 1 |
| * Copy number data were extracted from TCGA using R package TCGA-Assembler. The URLs of all public data files on TCGA DCC data server were gathered on Jan-05-2015. Function ProcessCNAData in TCGA-Assembler package was used to obtain gene-level copy number value which is calculated as the average copy number of the genomic region of a gene. |
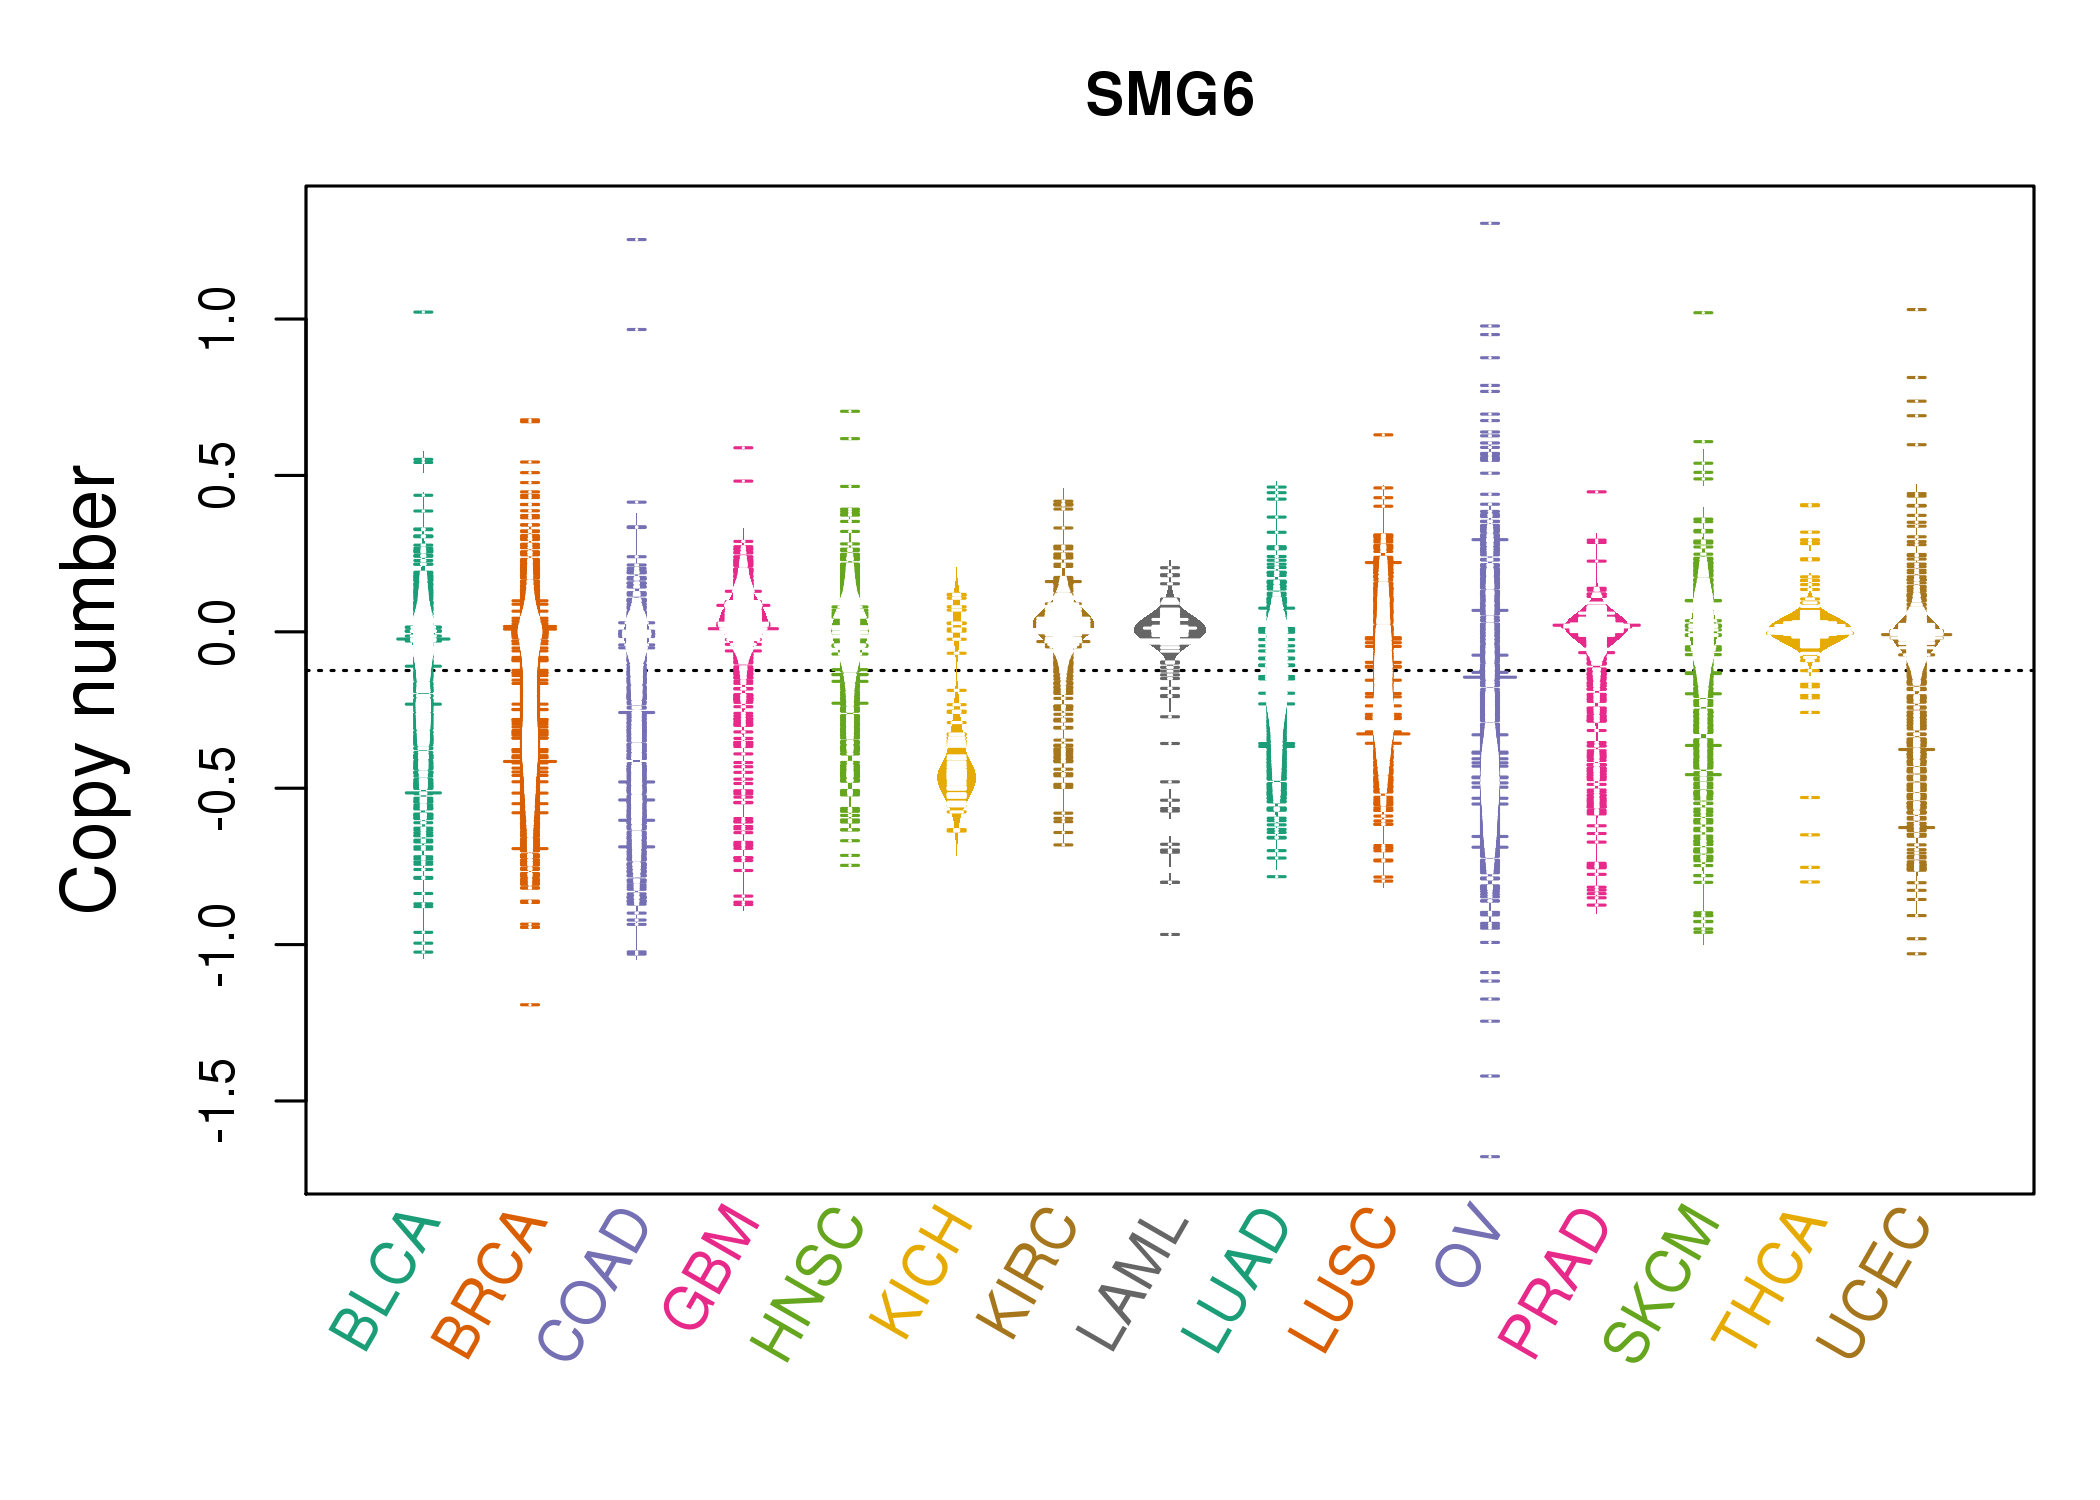 |
| cf) Tissue ID[Tissue type]: BLCA[Bladder Urothelial Carcinoma], BRCA[Breast invasive carcinoma], CESC[Cervical squamous cell carcinoma and endocervical adenocarcinoma], COAD[Colon adenocarcinoma], GBM[Glioblastoma multiforme], Glioma Low Grade, HNSC[Head and Neck squamous cell carcinoma], KICH[Kidney Chromophobe], KIRC[Kidney renal clear cell carcinoma], KIRP[Kidney renal papillary cell carcinoma], LAML[Acute Myeloid Leukemia], LUAD[Lung adenocarcinoma], LUSC[Lung squamous cell carcinoma], OV[Ovarian serous cystadenocarcinoma ], PAAD[Pancreatic adenocarcinoma], PRAD[Prostate adenocarcinoma], SKCM[Skin Cutaneous Melanoma], STAD[Stomach adenocarcinoma], THCA[Thyroid carcinoma], UCEC[Uterine Corpus Endometrial Carcinoma] |
| Top |
| Gene Expression for SMG6 |
| * CCLE gene expression data were extracted from CCLE_Expression_Entrez_2012-10-18.res: Gene-centric RMA-normalized mRNA expression data. |
 |
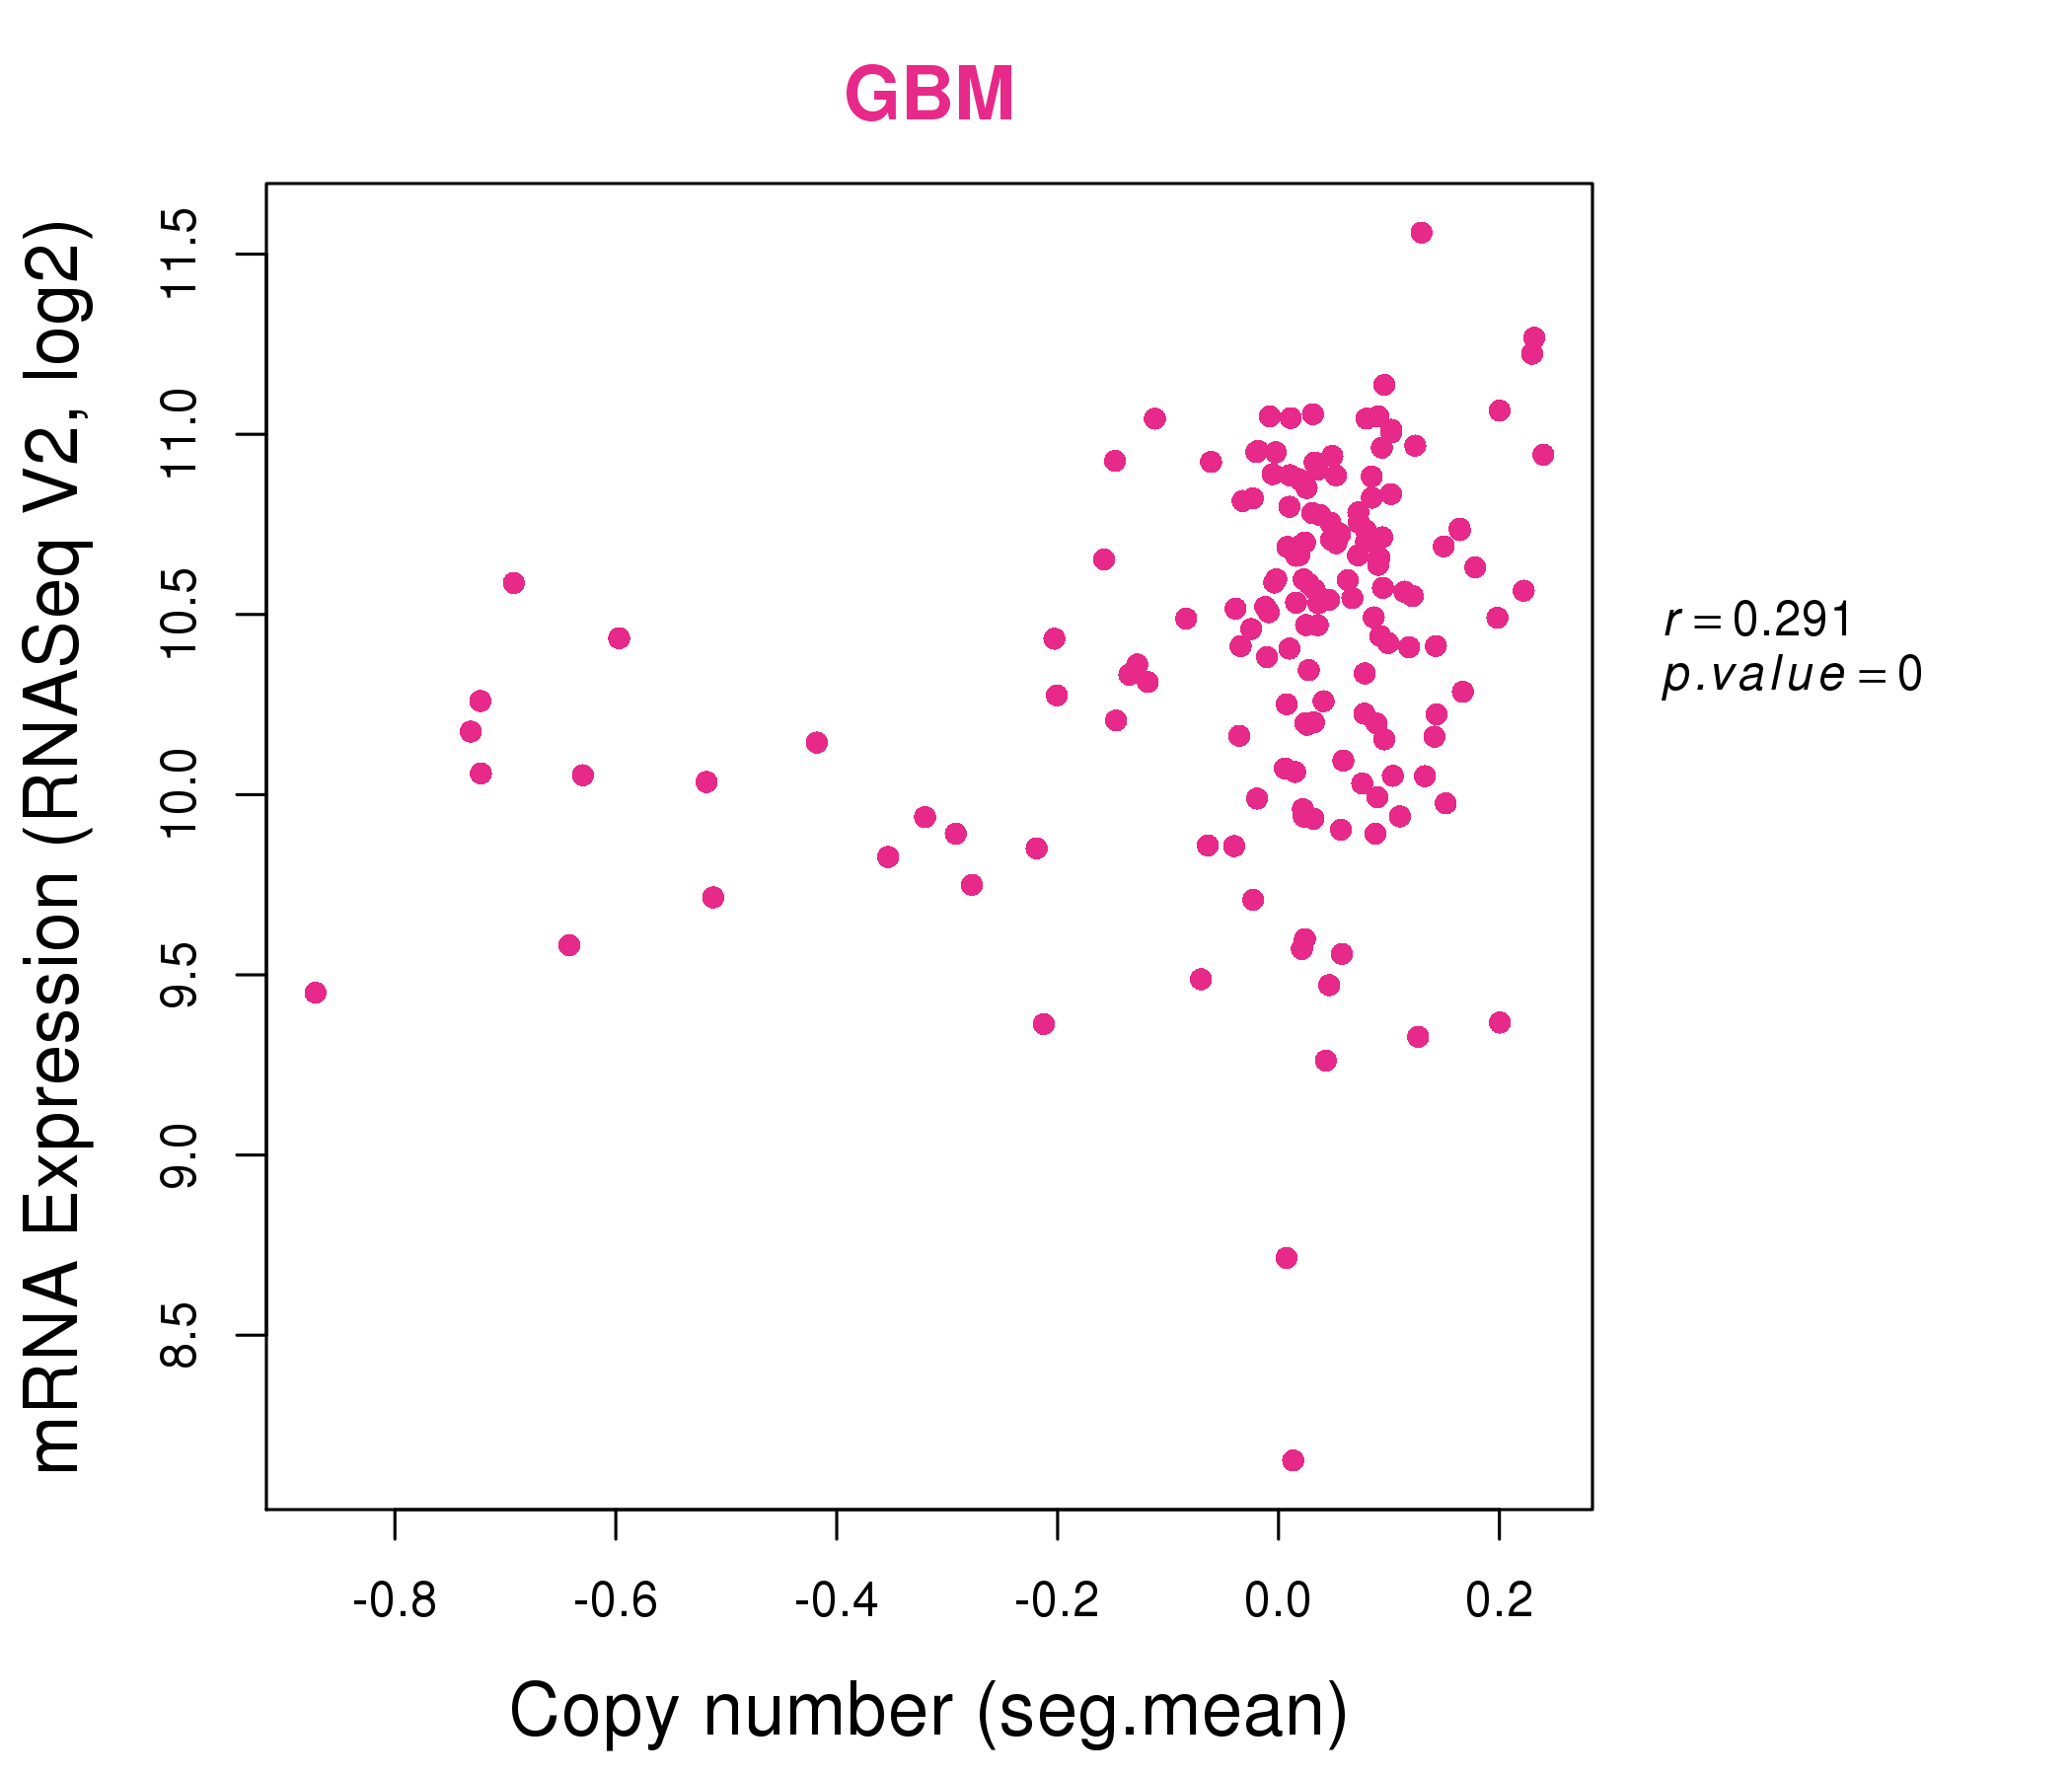
| * Normalized gene expression data of RNASeqV2 was extracted from TCGA using R package TCGA-Assembler. The URLs of all public data files on TCGA DCC data server were gathered at Jan-05-2015. Only eight cancer types have enough normal control samples for differential expression analysis. (t test, adjusted p<0.05 (using Benjamini-Hochberg FDR)) |
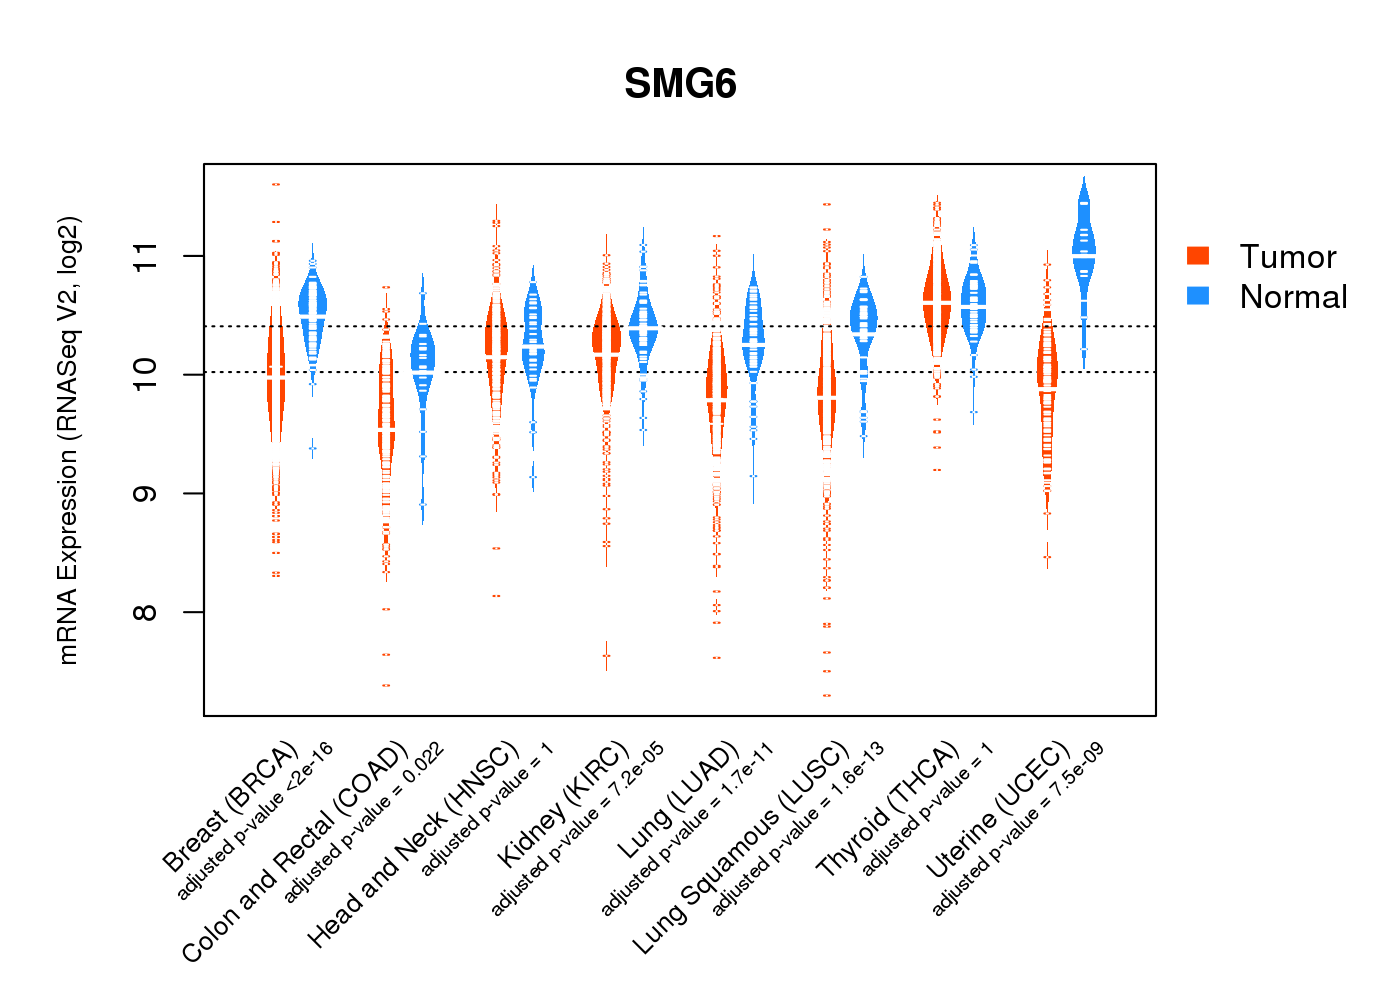 |
| Top |
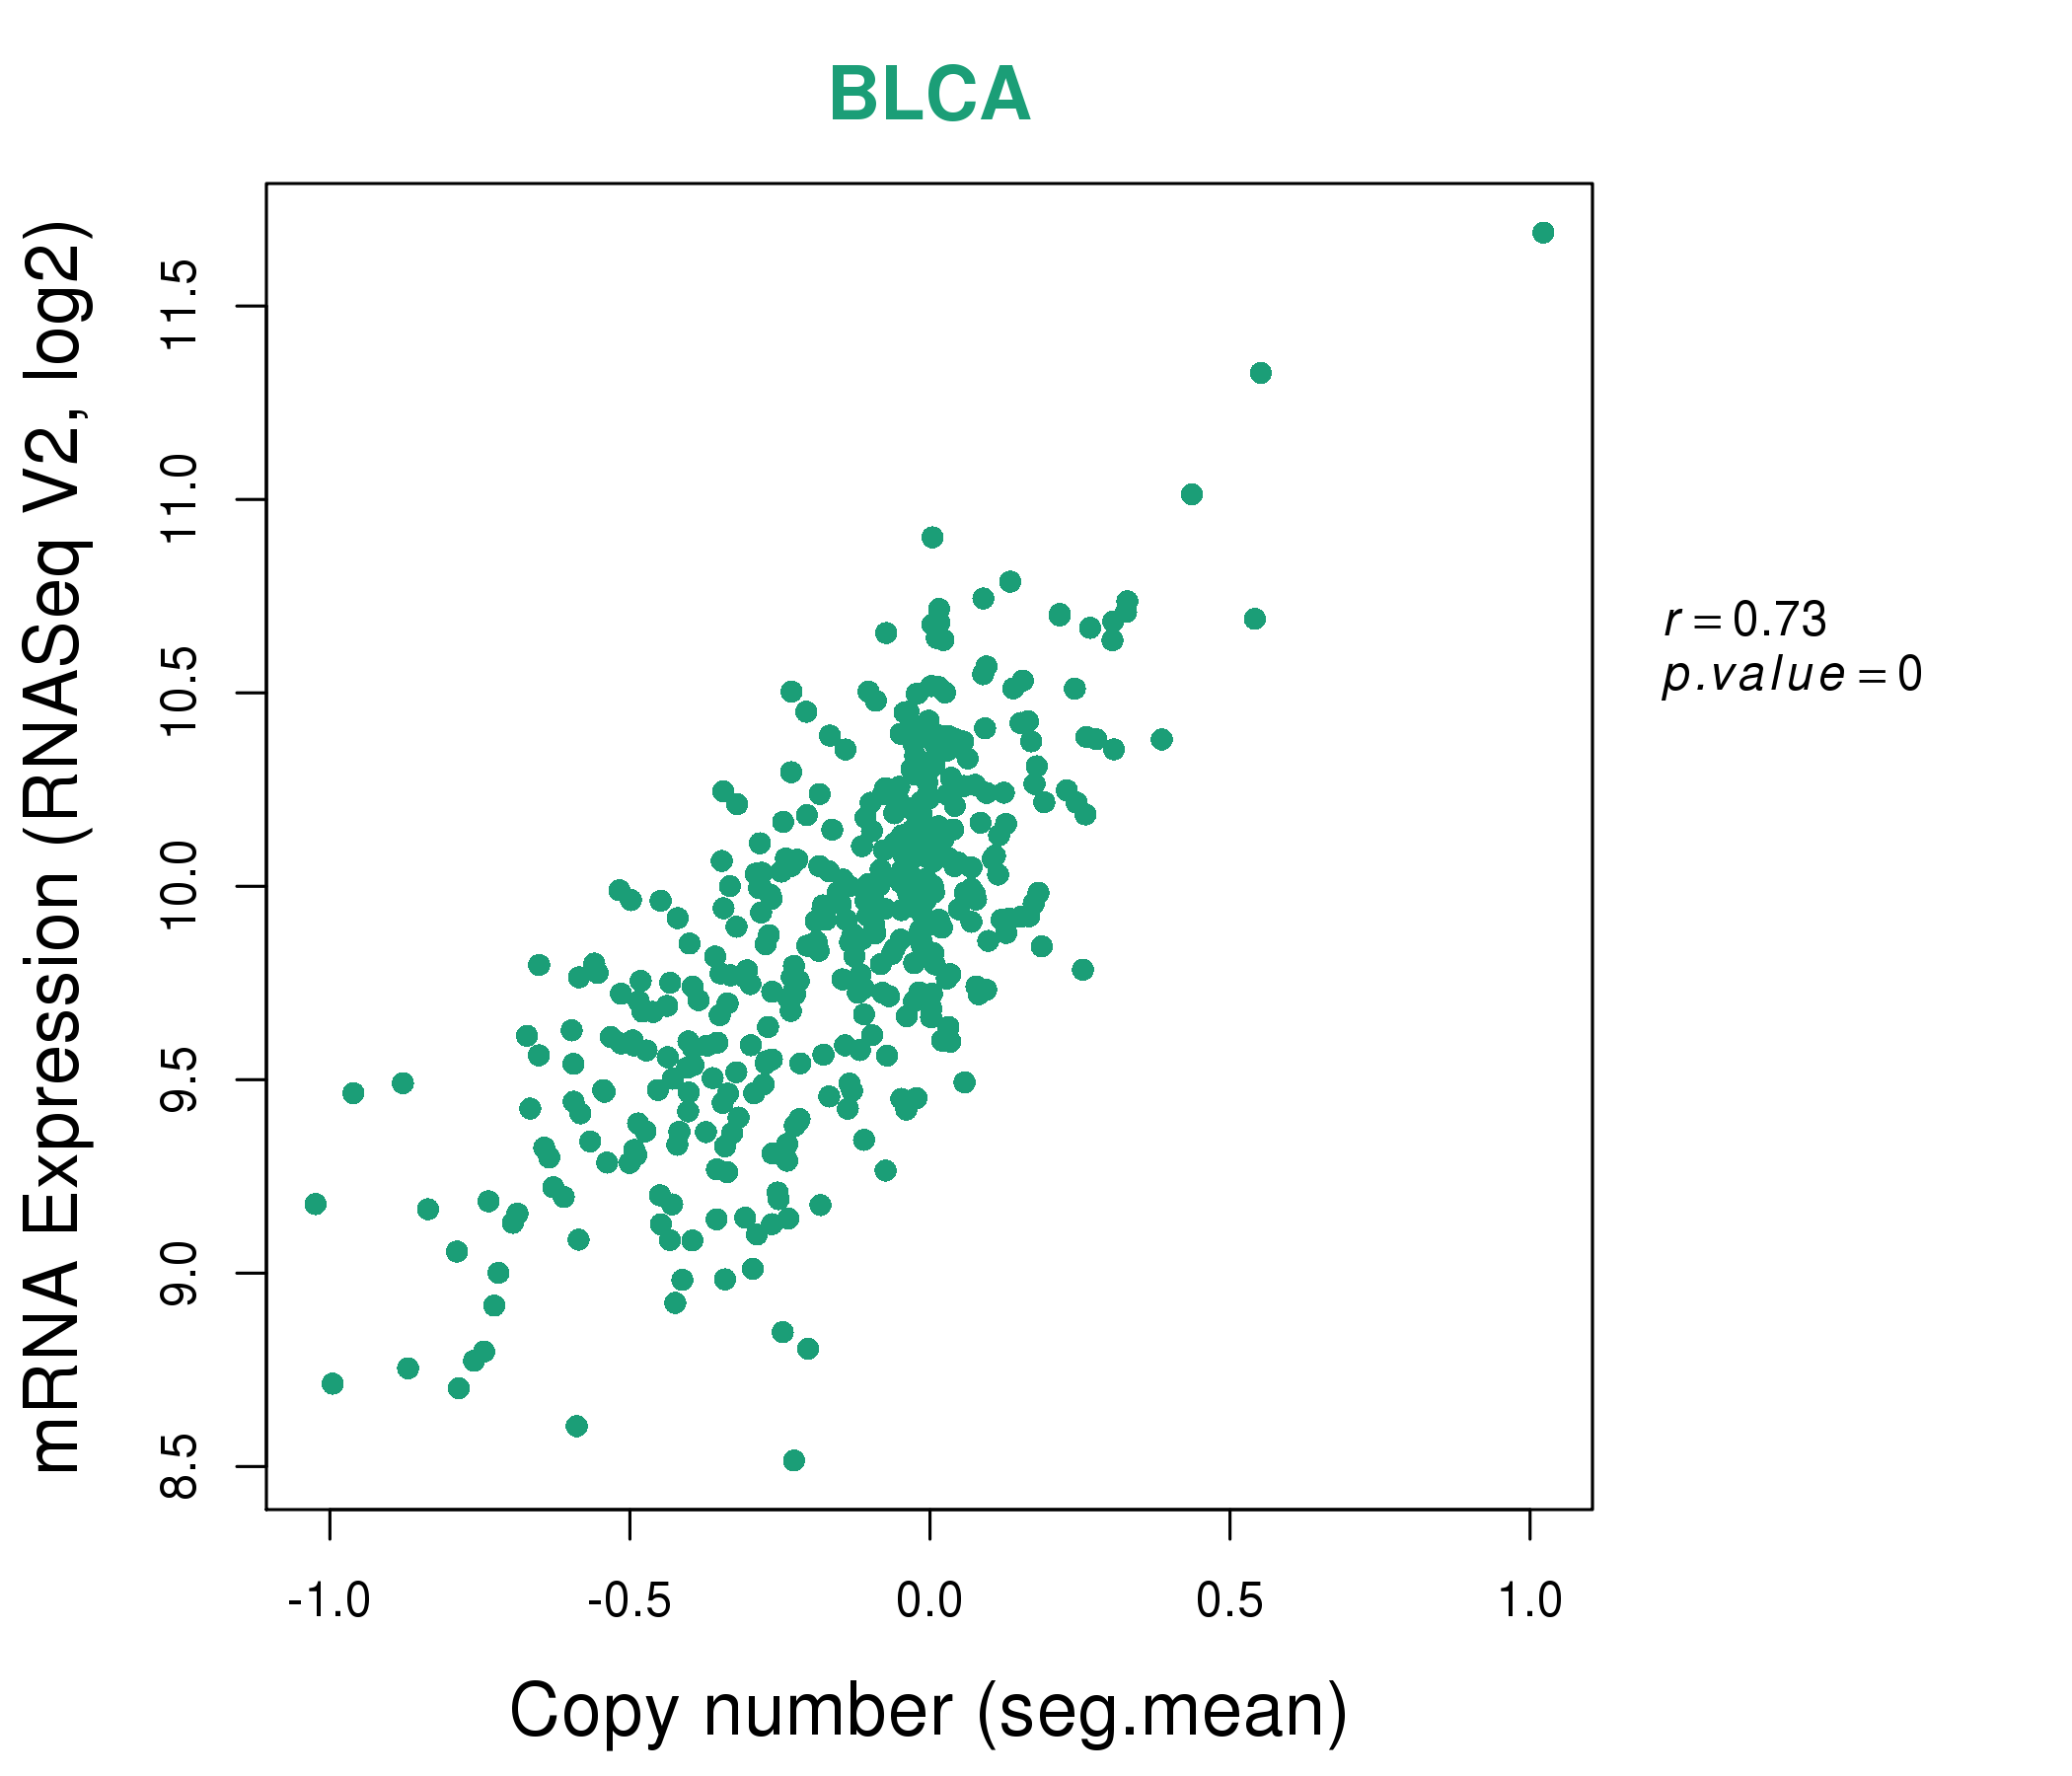
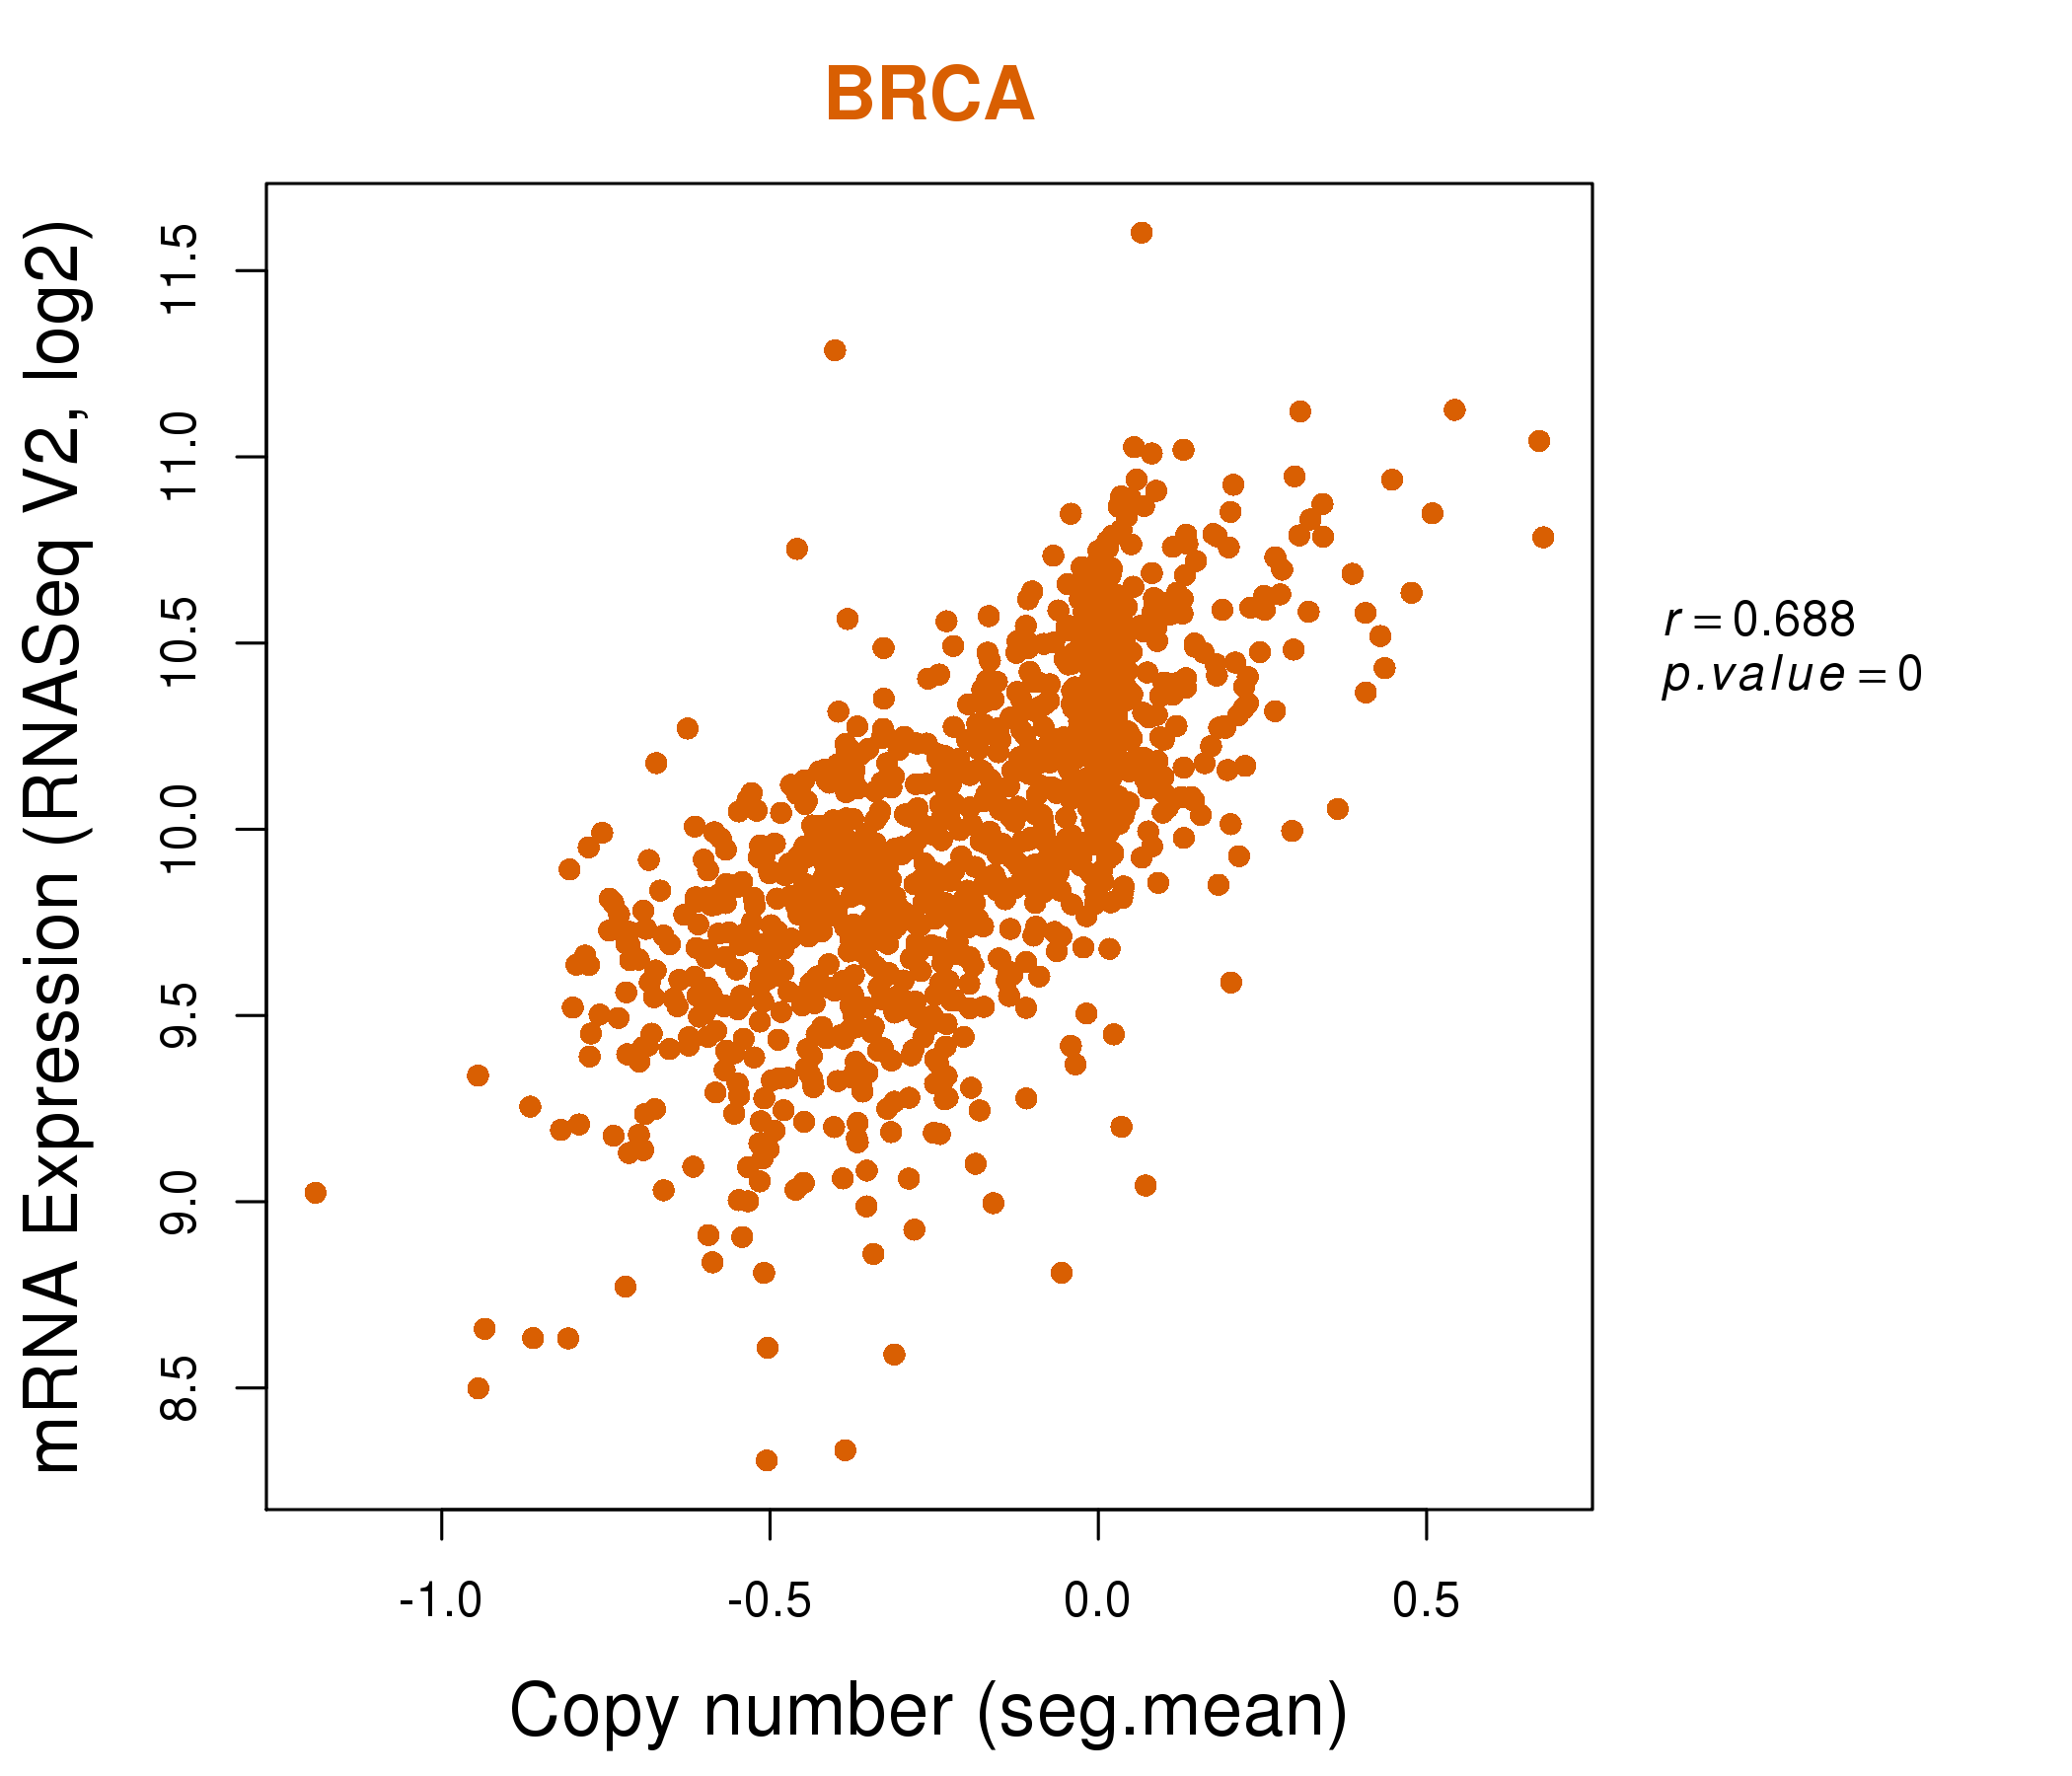
| * This plots show the correlation between CNV and gene expression. |
: Open all plots for all cancer types
 |
|
 |
|
| Top |
| Gene-Gene Network Information |
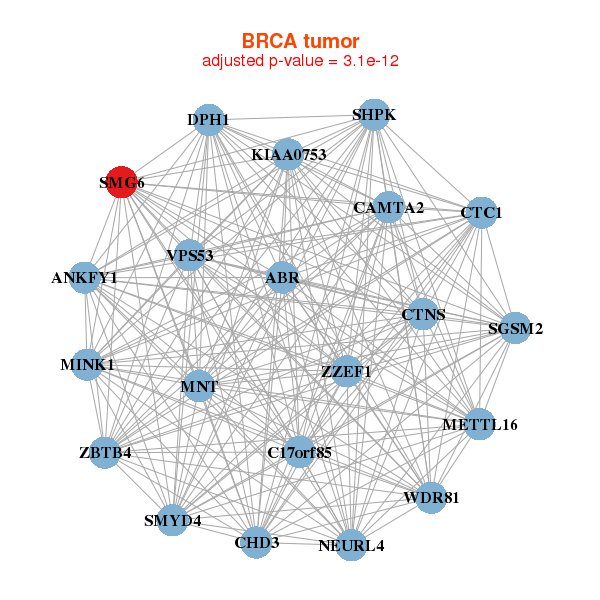
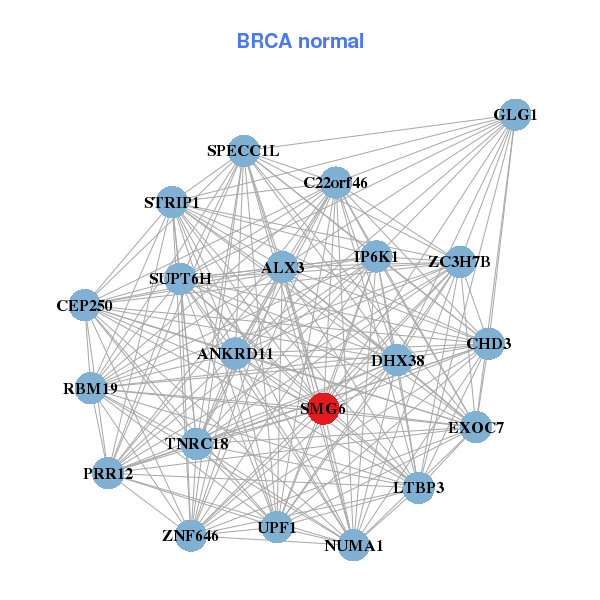
| * Co-Expression network figures were drawn using R package igraph. Only the top 20 genes with the highest correlations were shown. Red circle: input gene, orange circle: cell metabolism gene, sky circle: other gene |
: Open all plots for all cancer types
 |
|
| ABR,ANKFY1,CTC1,C17orf85,CAMTA2,CHD3,CTNS, DPH1,KIAA0753,METTL16,MINK1,MNT,NEURL4,SGSM2, SHPK,SMG6,SMYD4,VPS53,WDR81,ZBTB4,ZZEF1 | ALX3,ANKRD11,C22orf46,CEP250,CHD3,SPECC1L,DHX38, EXOC7,STRIP1,GLG1,IP6K1,LTBP3,NUMA1,PRR12, RBM19,SMG6,SUPT6H,TNRC18,UPF1,ZC3H7B,ZNF646 |
 |
|
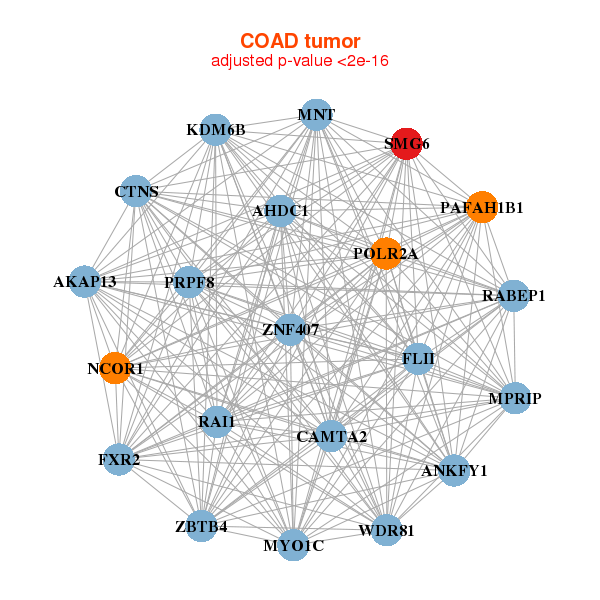
| AHDC1,AKAP13,ANKFY1,CAMTA2,CTNS,FLII,FXR2, KDM6B,MNT,MPRIP,MYO1C,NCOR1,PAFAH1B1,POLR2A, PRPF8,RABEP1,RAI1,SMG6,WDR81,ZBTB4,ZNF407 | PRRC2B,HECTD4,CHD8,CREBBP,DDX42,DYNC1H1,EP300, EP400,FAM193A,GLG1,HERC2,HUWE1,MED12,MED13L, NCOR2,NUMA1,SMG6,SNRNP200,SUPT6H,TNRC6C,ZNF407 |
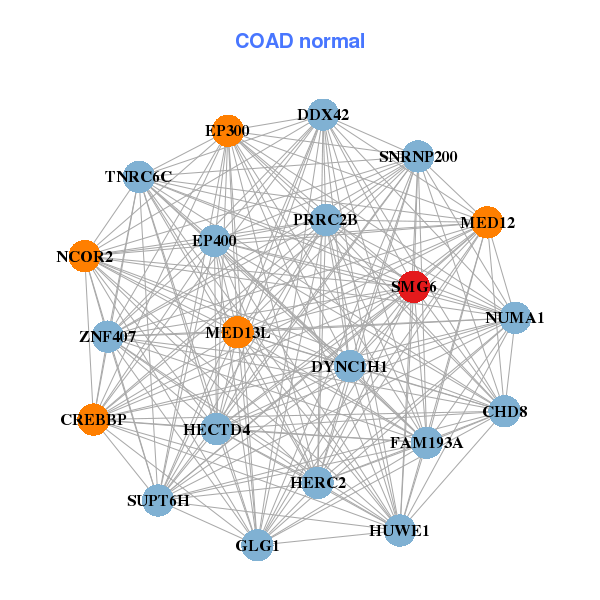
| * Co-Expression network figures were drawn using R package igraph. Only the top 20 genes with the highest correlations were shown. Red circle: input gene, orange circle: cell metabolism gene, sky circle: other gene |
: Open all plots for all cancer types
| Top |
: Open all interacting genes' information including KEGG pathway for all interacting genes from DAVID
| Top |
| Pharmacological Information for SMG6 |
| There's no related Drug. |
| Top |
| Cross referenced IDs for SMG6 |
| * We obtained these cross-references from Uniprot database. It covers 150 different DBs, 18 categories. http://www.uniprot.org/help/cross_references_section |
: Open all cross reference information
|
Copyright © 2016-Present - The Univsersity of Texas Health Science Center at Houston @ |