|
||||||||||||||||||||||||||||||||||||||||||||||||||||||||||||||||||||||||||||||||||||||||||||||||||||||||||||||||||||||||||||||||||||||||||||||||||||||||||||||||||||||||||||||||||||||||||||||||||||||||||||||||||||||||||||||||||||||||||||||||||||||||||||||||||||||||||||||||||||||||||||||||||||||||||||||||||||||||||
| |
| Phenotypic Information (metabolism pathway, cancer, disease, phenome) |
| |
| |
| Gene-Gene Network Information: Co-Expression Network, Interacting Genes & KEGG |
| |
|


| Gene Summary for FMO5 |
| Top |
| Phenotypic Information for FMO5(metabolism pathway, cancer, disease, phenome) |
| Cancer | CGAP: FMO5 |
| Familial Cancer Database: FMO5 | |
| * This gene is included in those cancer gene databases. |
|
|
|
|
|
|
| ||||||||||||||||||||||||||||||||||||||||||||||||||||||||||||||||||||||||||||||||||||||||||||||||||||||||||||||||||||||||||||||||||||||||||||||||||||||||||||||||||||||||||||||||||||||||||||||||||||||||||||||||||||||||||||||||||||||||||||||||||||||||||||||||||||||||||||||||||||||||||||||||||||||||||||||||||||
Oncogene 1 | Significant driver gene in | |||||||||||||||||||||||||||||||||||||||||||||||||||||||||||||||||||||||||||||||||||||||||||||||||||||||||||||||||||||||||||||||||||||||||||||||||||||||||||||||||||||||||||||||||||||||||||||||||||||||||||||||||||||||||||||||||||||||||||||||||||||||||||||||||||||||||||||||||||||||||||||||||||||||||||||||||||||||||
| cf) number; DB name 1 Oncogene; http://nar.oxfordjournals.org/content/35/suppl_1/D721.long, 2 Tumor Suppressor gene; https://bioinfo.uth.edu/TSGene/, 3 Cancer Gene Census; http://www.nature.com/nrc/journal/v4/n3/abs/nrc1299.html, 4 CancerGenes; http://nar.oxfordjournals.org/content/35/suppl_1/D721.long, 5 Network of Cancer Gene; http://ncg.kcl.ac.uk/index.php, 1Therapeutic Vulnerabilities in Cancer; http://cbio.mskcc.org/cancergenomics/statius/ |
| KEGG_DRUG_METABOLISM_CYTOCHROME_P450 | |
| OMIM | |
| Orphanet | |
| Disease | KEGG Disease: FMO5 |
| MedGen: FMO5 (Human Medical Genetics with Condition) | |
| ClinVar: FMO5 | |
| Phenotype | MGI: FMO5 (International Mouse Phenotyping Consortium) |
| PhenomicDB: FMO5 | |
| Mutations for FMO5 |
| * Under tables are showing count per each tissue to give us broad intuition about tissue specific mutation patterns.You can go to the detailed page for each mutation database's web site. |
| There's no structural variation information in COSMIC data for this gene. |
| * From mRNA Sanger sequences, Chitars2.0 arranged chimeric transcripts. This table shows FMO5 related fusion information. |
| ID | Head Gene | Tail Gene | Accession | Gene_a | qStart_a | qEnd_a | Chromosome_a | tStart_a | tEnd_a | Gene_a | qStart_a | qEnd_a | Chromosome_a | tStart_a | tEnd_a |
| AA491849 | FMO5 | 8 | 107 | 1 | 146656768 | 146656867 | FMO5 | 105 | 278 | 1 | 146656863 | 146657036 | |
| AI240595 | MPPE1 | 14 | 69 | 18 | 11884054 | 11884109 | FMO5 | 65 | 377 | 1 | 146676325 | 146676637 | |
| AW972276 | FMO5 | 111 | 210 | 1 | 146656768 | 146656867 | FMO5 | 208 | 381 | 1 | 146656863 | 146657036 | |
| Top |
| Mutation type/ Tissue ID | brca | cns | cerv | endome | haematopo | kidn | Lintest | liver | lung | ns | ovary | pancre | prost | skin | stoma | thyro | urina | |||
| Total # sample | 2 | 1 | ||||||||||||||||||
| GAIN (# sample) | 2 | 1 | ||||||||||||||||||
| LOSS (# sample) |
| cf) Tissue ID; Tissue type (1; Breast, 2; Central_nervous_system, 3; Cervix, 4; Endometrium, 5; Haematopoietic_and_lymphoid_tissue, 6; Kidney, 7; Large_intestine, 8; Liver, 9; Lung, 10; NS, 11; Ovary, 12; Pancreas, 13; Prostate, 14; Skin, 15; Stomach, 16; Thyroid, 17; Urinary_tract) |
| Top |
|
 |
| Top |
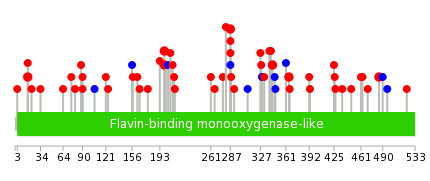
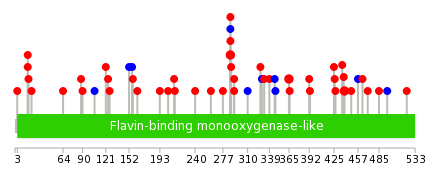
| Stat. for Non-Synonymous SNVs (# total SNVs=49) | (# total SNVs=6) |
 |  |
(# total SNVs=1) | (# total SNVs=0) |
 |
| Top |
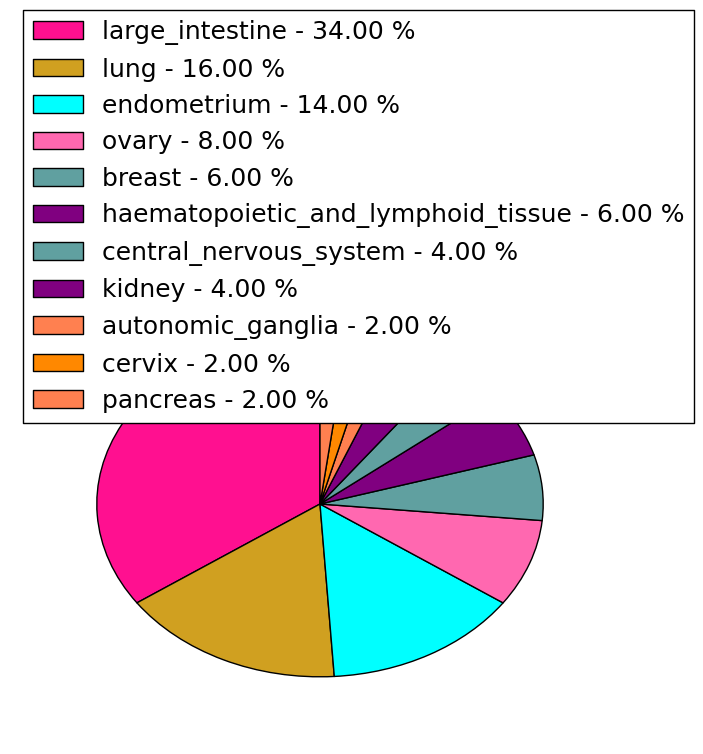
| * When you move the cursor on each content, you can see more deailed mutation information on the Tooltip. Those are primary_site,primary_histology,mutation(aa),pubmedID. |
| GRCh37 position | Mutation(aa) | Unique sampleID count |
| chr1:146673058-146673058 | p.D287N | 3 |
| chr1:146683995-146683995 | p.D199G | 2 |
| chr1:146658627-146658627 | p.R485Q | 2 |
| chr1:146683996-146683996 | p.D199H | 2 |
| chr1:146672824-146672824 | p.T365P | 2 |
| chr1:146672890-146672890 | p.V343I | 2 |
| chr1:146658516-146658516 | p.A522V | 1 |
| chr1:146687457-146687457 | p.S64F | 1 |
| chr1:146658808-146658808 | p.R425S | 1 |
| chr1:146683979-146683979 | p.I204I | 1 |
| Top |
|
 |
| Point Mutation/ Tissue ID | 1 | 2 | 3 | 4 | 5 | 6 | 7 | 8 | 9 | 10 | 11 | 12 | 13 | 14 | 15 | 16 | 17 | 18 | 19 | 20 |
| # sample | 3 | 2 | 1 | 14 | 3 | 3 | 4 | 3 | 9 | 5 | 8 | |||||||||
| # mutation | 4 | 2 | 1 | 13 | 3 | 3 | 4 | 3 | 9 | 6 | 8 | |||||||||
| nonsynonymous SNV | 3 | 2 | 1 | 11 | 2 | 3 | 2 | 3 | 7 | 6 | 6 | |||||||||
| synonymous SNV | 1 | 2 | 1 | 2 | 2 | 2 |
| cf) Tissue ID; Tissue type (1; BLCA[Bladder Urothelial Carcinoma], 2; BRCA[Breast invasive carcinoma], 3; CESC[Cervical squamous cell carcinoma and endocervical adenocarcinoma], 4; COAD[Colon adenocarcinoma], 5; GBM[Glioblastoma multiforme], 6; Glioma Low Grade, 7; HNSC[Head and Neck squamous cell carcinoma], 8; KICH[Kidney Chromophobe], 9; KIRC[Kidney renal clear cell carcinoma], 10; KIRP[Kidney renal papillary cell carcinoma], 11; LAML[Acute Myeloid Leukemia], 12; LUAD[Lung adenocarcinoma], 13; LUSC[Lung squamous cell carcinoma], 14; OV[Ovarian serous cystadenocarcinoma ], 15; PAAD[Pancreatic adenocarcinoma], 16; PRAD[Prostate adenocarcinoma], 17; SKCM[Skin Cutaneous Melanoma], 18:STAD[Stomach adenocarcinoma], 19:THCA[Thyroid carcinoma], 20:UCEC[Uterine Corpus Endometrial Carcinoma]) |
| Top |
| * We represented just top 10 SNVs. When you move the cursor on each content, you can see more deailed mutation information on the Tooltip. Those are primary_site, primary_histology, mutation(aa), pubmedID. |
| Genomic Position | Mutation(aa) | Unique sampleID count |
| chr1:146673058 | p.D287Y,FMO5 | 3 |
| chr1:146656151 | p.D439N | 2 |
| chr1:146673043 | p.T365P,FMO5 | 2 |
| chr1:146672824 | p.R292S,FMO5 | 2 |
| chr1:146680607 | p.L213I,FMO5 | 1 |
| chr1:146658804 | p.S18F,FMO5 | 1 |
| chr1:146687330 | p.P438H | 1 |
| chr1:146672938 | p.K347K,FMO5 | 1 |
| chr1:146656153 | p.F212L,FMO5 | 1 |
| chr1:146680608 | p.S17Y,FMO5 | 1 |
| * Copy number data were extracted from TCGA using R package TCGA-Assembler. The URLs of all public data files on TCGA DCC data server were gathered on Jan-05-2015. Function ProcessCNAData in TCGA-Assembler package was used to obtain gene-level copy number value which is calculated as the average copy number of the genomic region of a gene. |
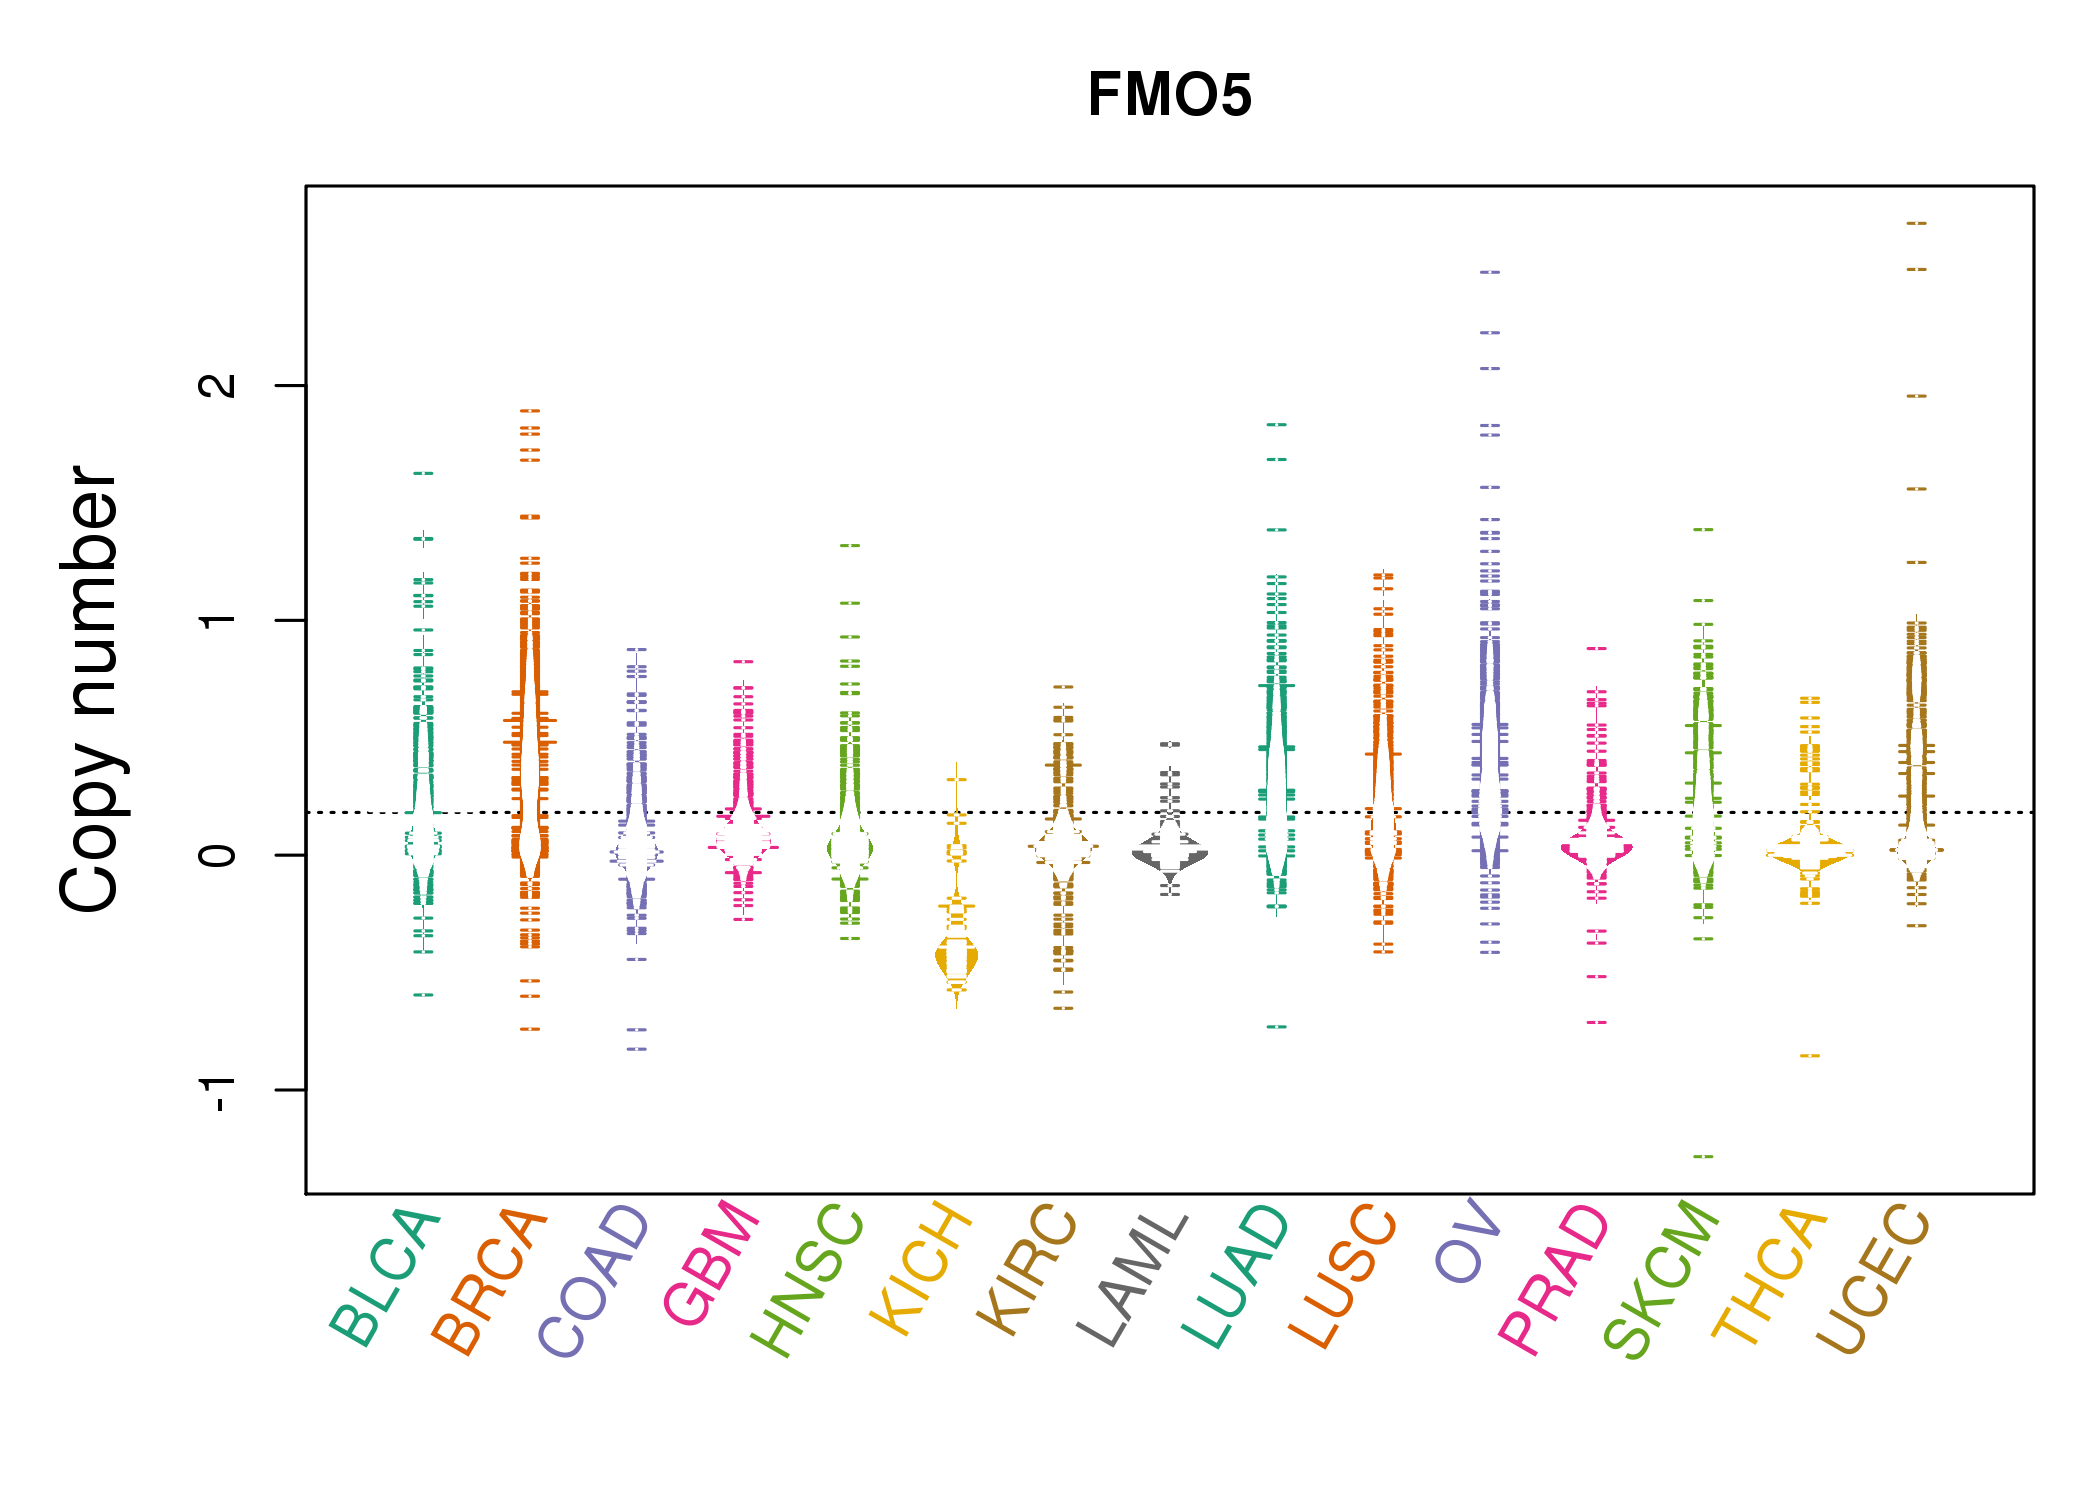 |
| cf) Tissue ID[Tissue type]: BLCA[Bladder Urothelial Carcinoma], BRCA[Breast invasive carcinoma], CESC[Cervical squamous cell carcinoma and endocervical adenocarcinoma], COAD[Colon adenocarcinoma], GBM[Glioblastoma multiforme], Glioma Low Grade, HNSC[Head and Neck squamous cell carcinoma], KICH[Kidney Chromophobe], KIRC[Kidney renal clear cell carcinoma], KIRP[Kidney renal papillary cell carcinoma], LAML[Acute Myeloid Leukemia], LUAD[Lung adenocarcinoma], LUSC[Lung squamous cell carcinoma], OV[Ovarian serous cystadenocarcinoma ], PAAD[Pancreatic adenocarcinoma], PRAD[Prostate adenocarcinoma], SKCM[Skin Cutaneous Melanoma], STAD[Stomach adenocarcinoma], THCA[Thyroid carcinoma], UCEC[Uterine Corpus Endometrial Carcinoma] |
| Top |
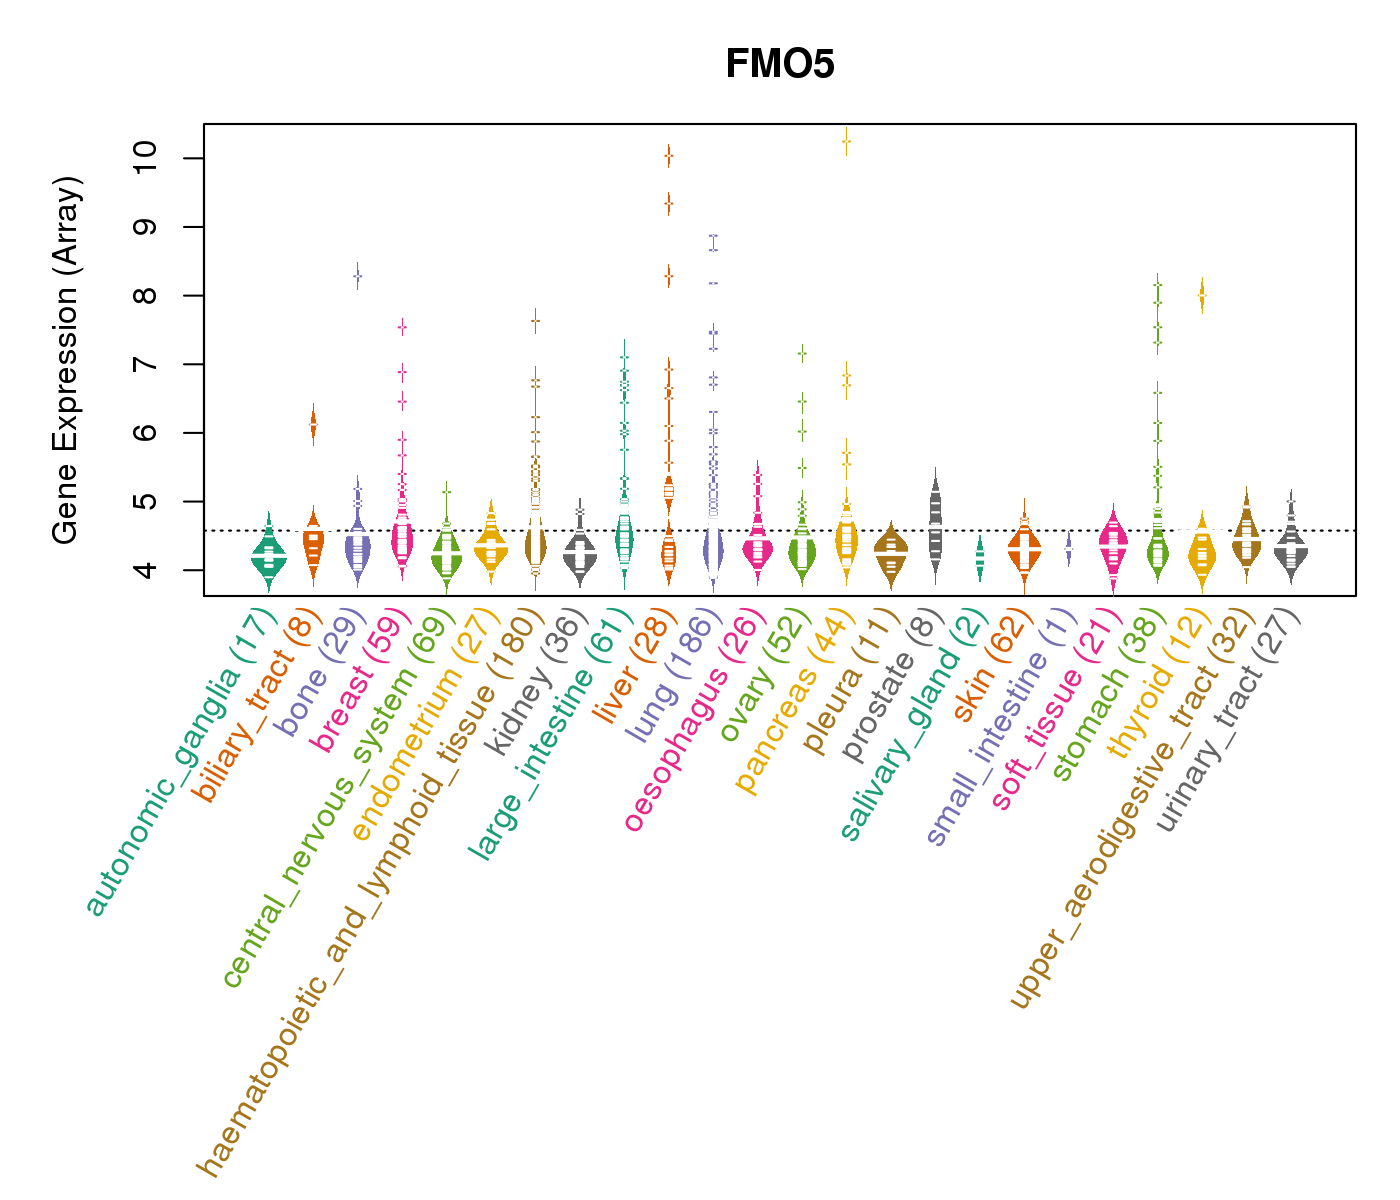
| Gene Expression for FMO5 |
| * CCLE gene expression data were extracted from CCLE_Expression_Entrez_2012-10-18.res: Gene-centric RMA-normalized mRNA expression data. |
 |
| * Normalized gene expression data of RNASeqV2 was extracted from TCGA using R package TCGA-Assembler. The URLs of all public data files on TCGA DCC data server were gathered at Jan-05-2015. Only eight cancer types have enough normal control samples for differential expression analysis. (t test, adjusted p<0.05 (using Benjamini-Hochberg FDR)) |
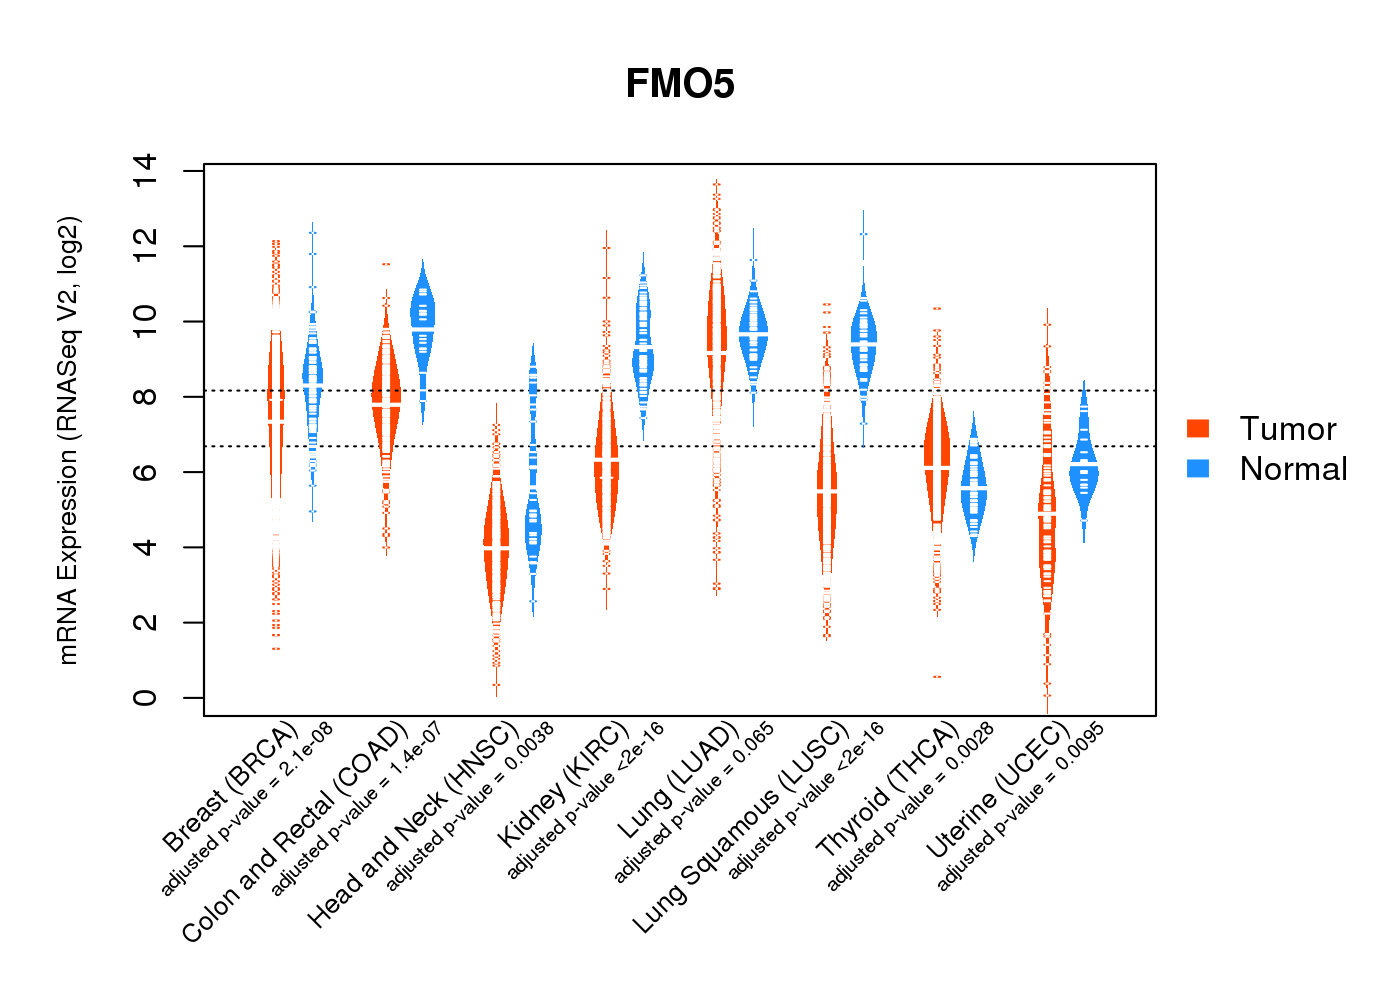 |
| Top |
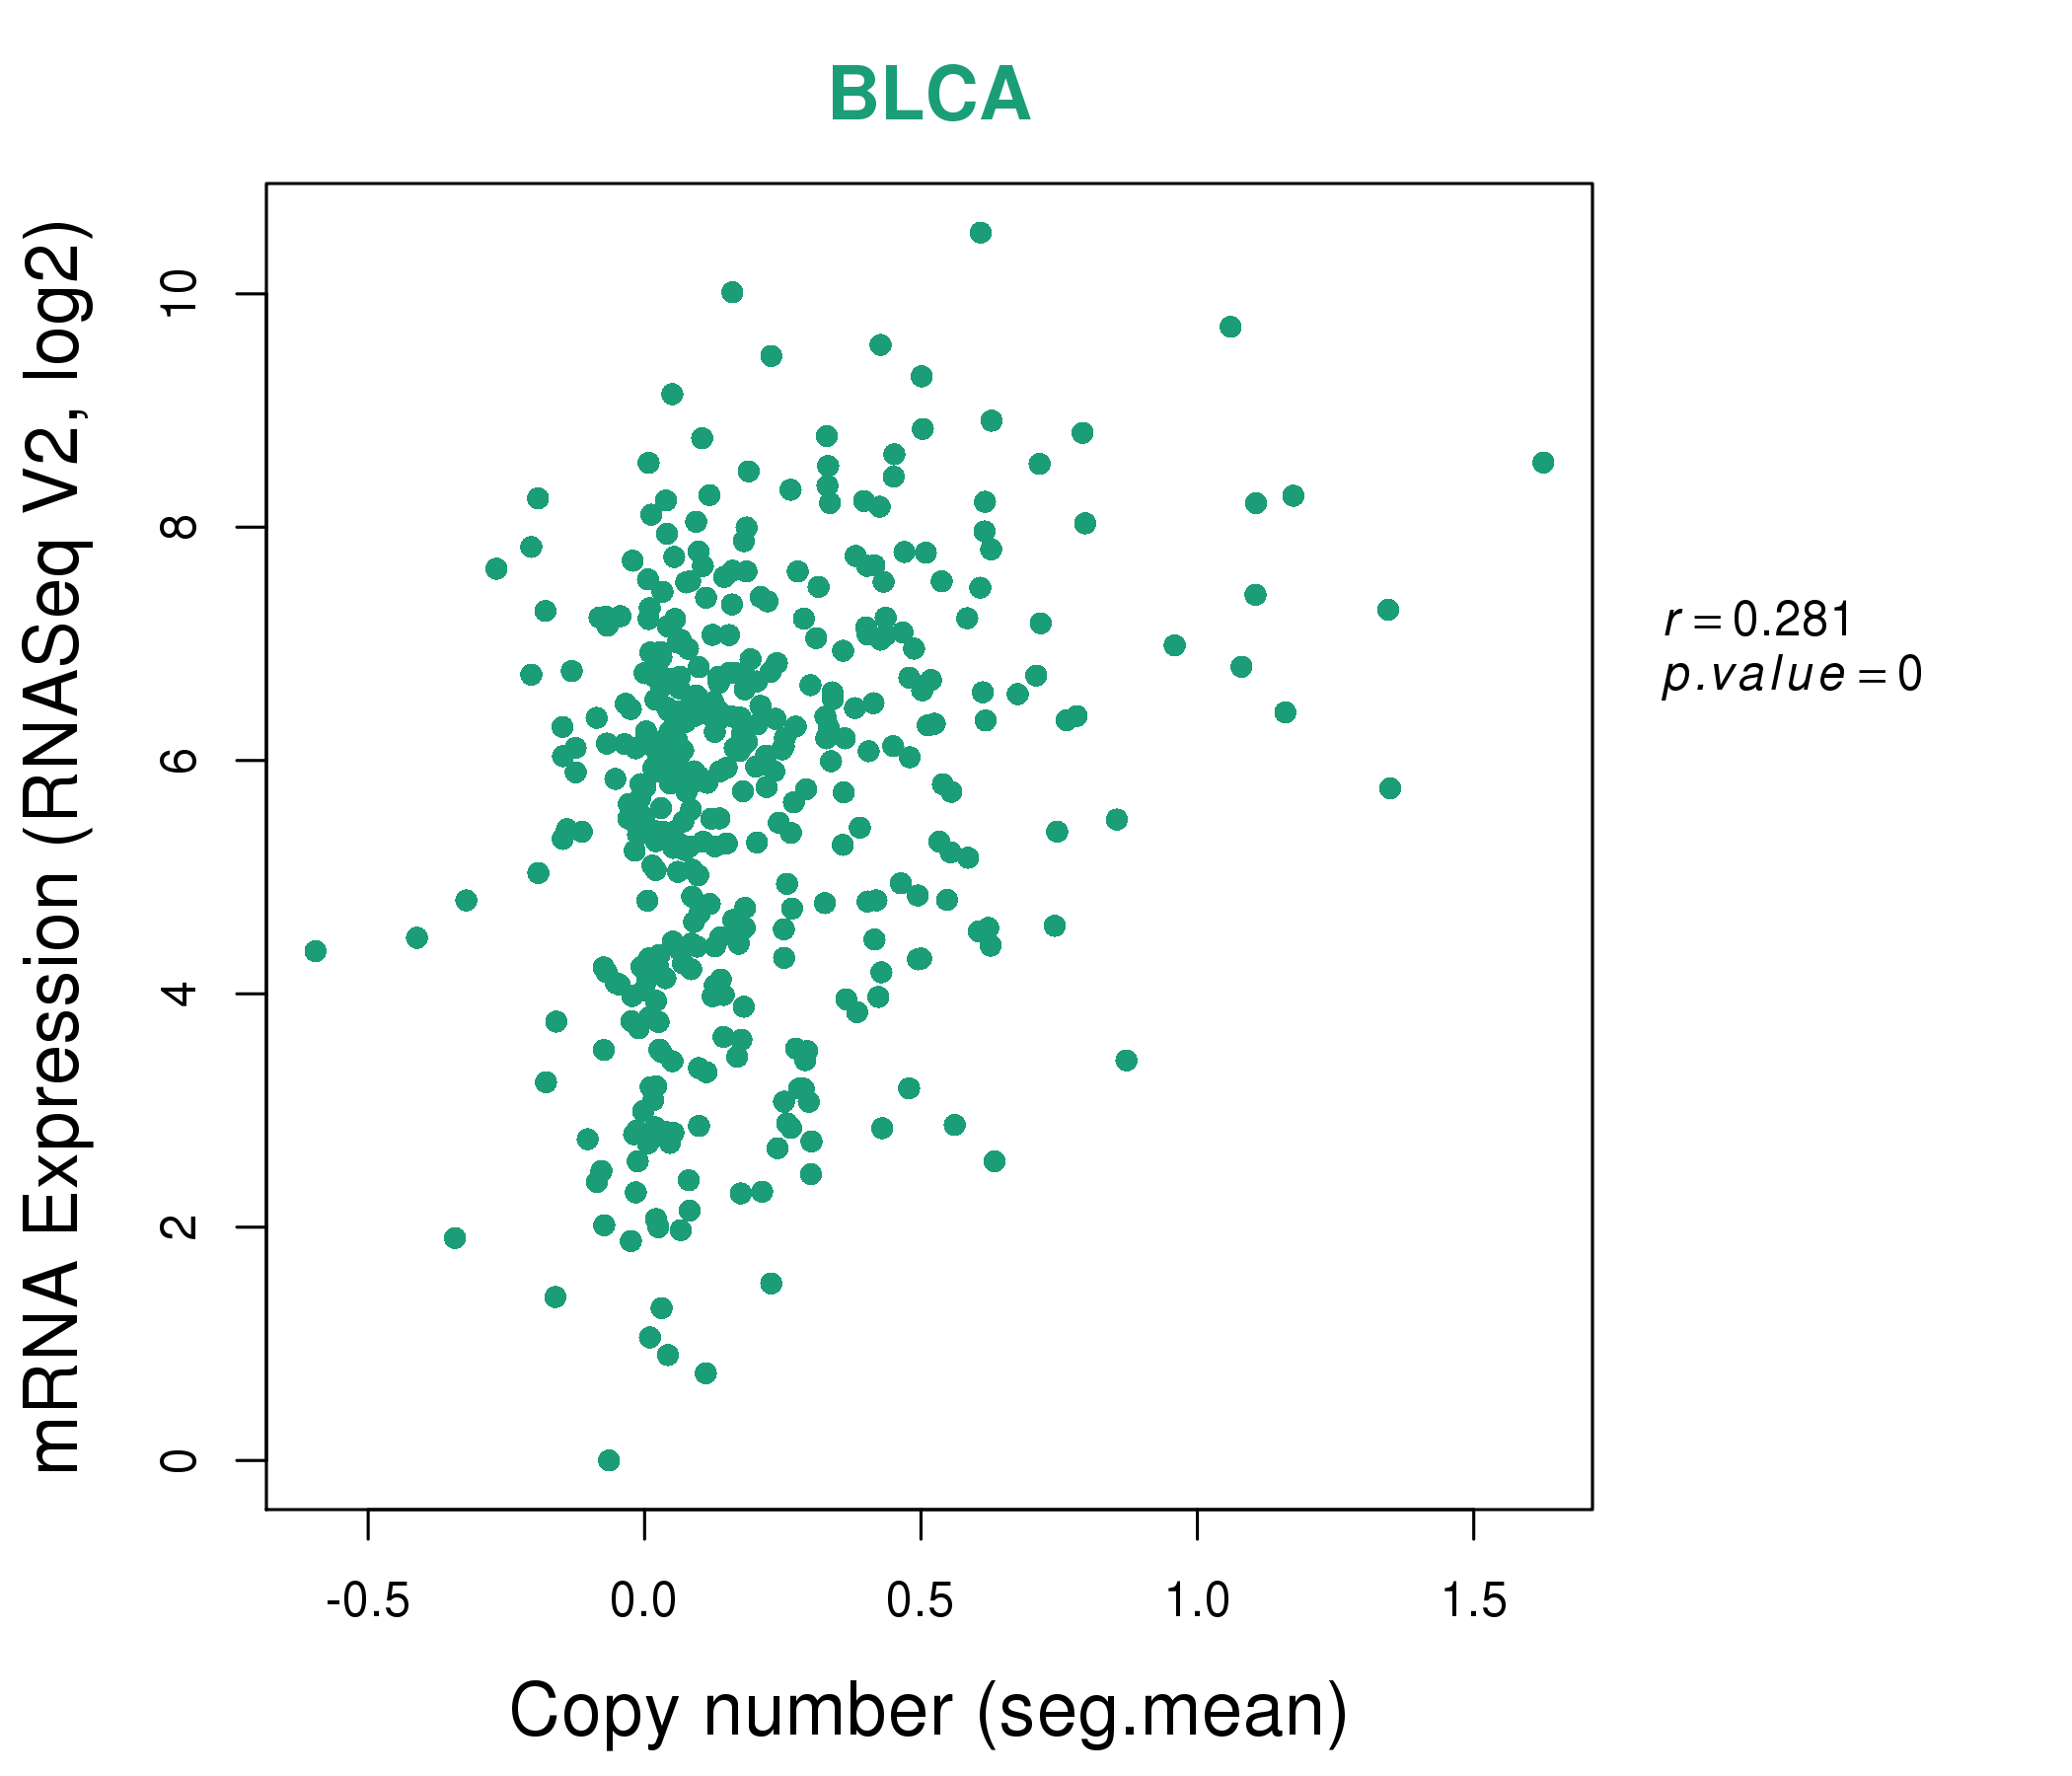
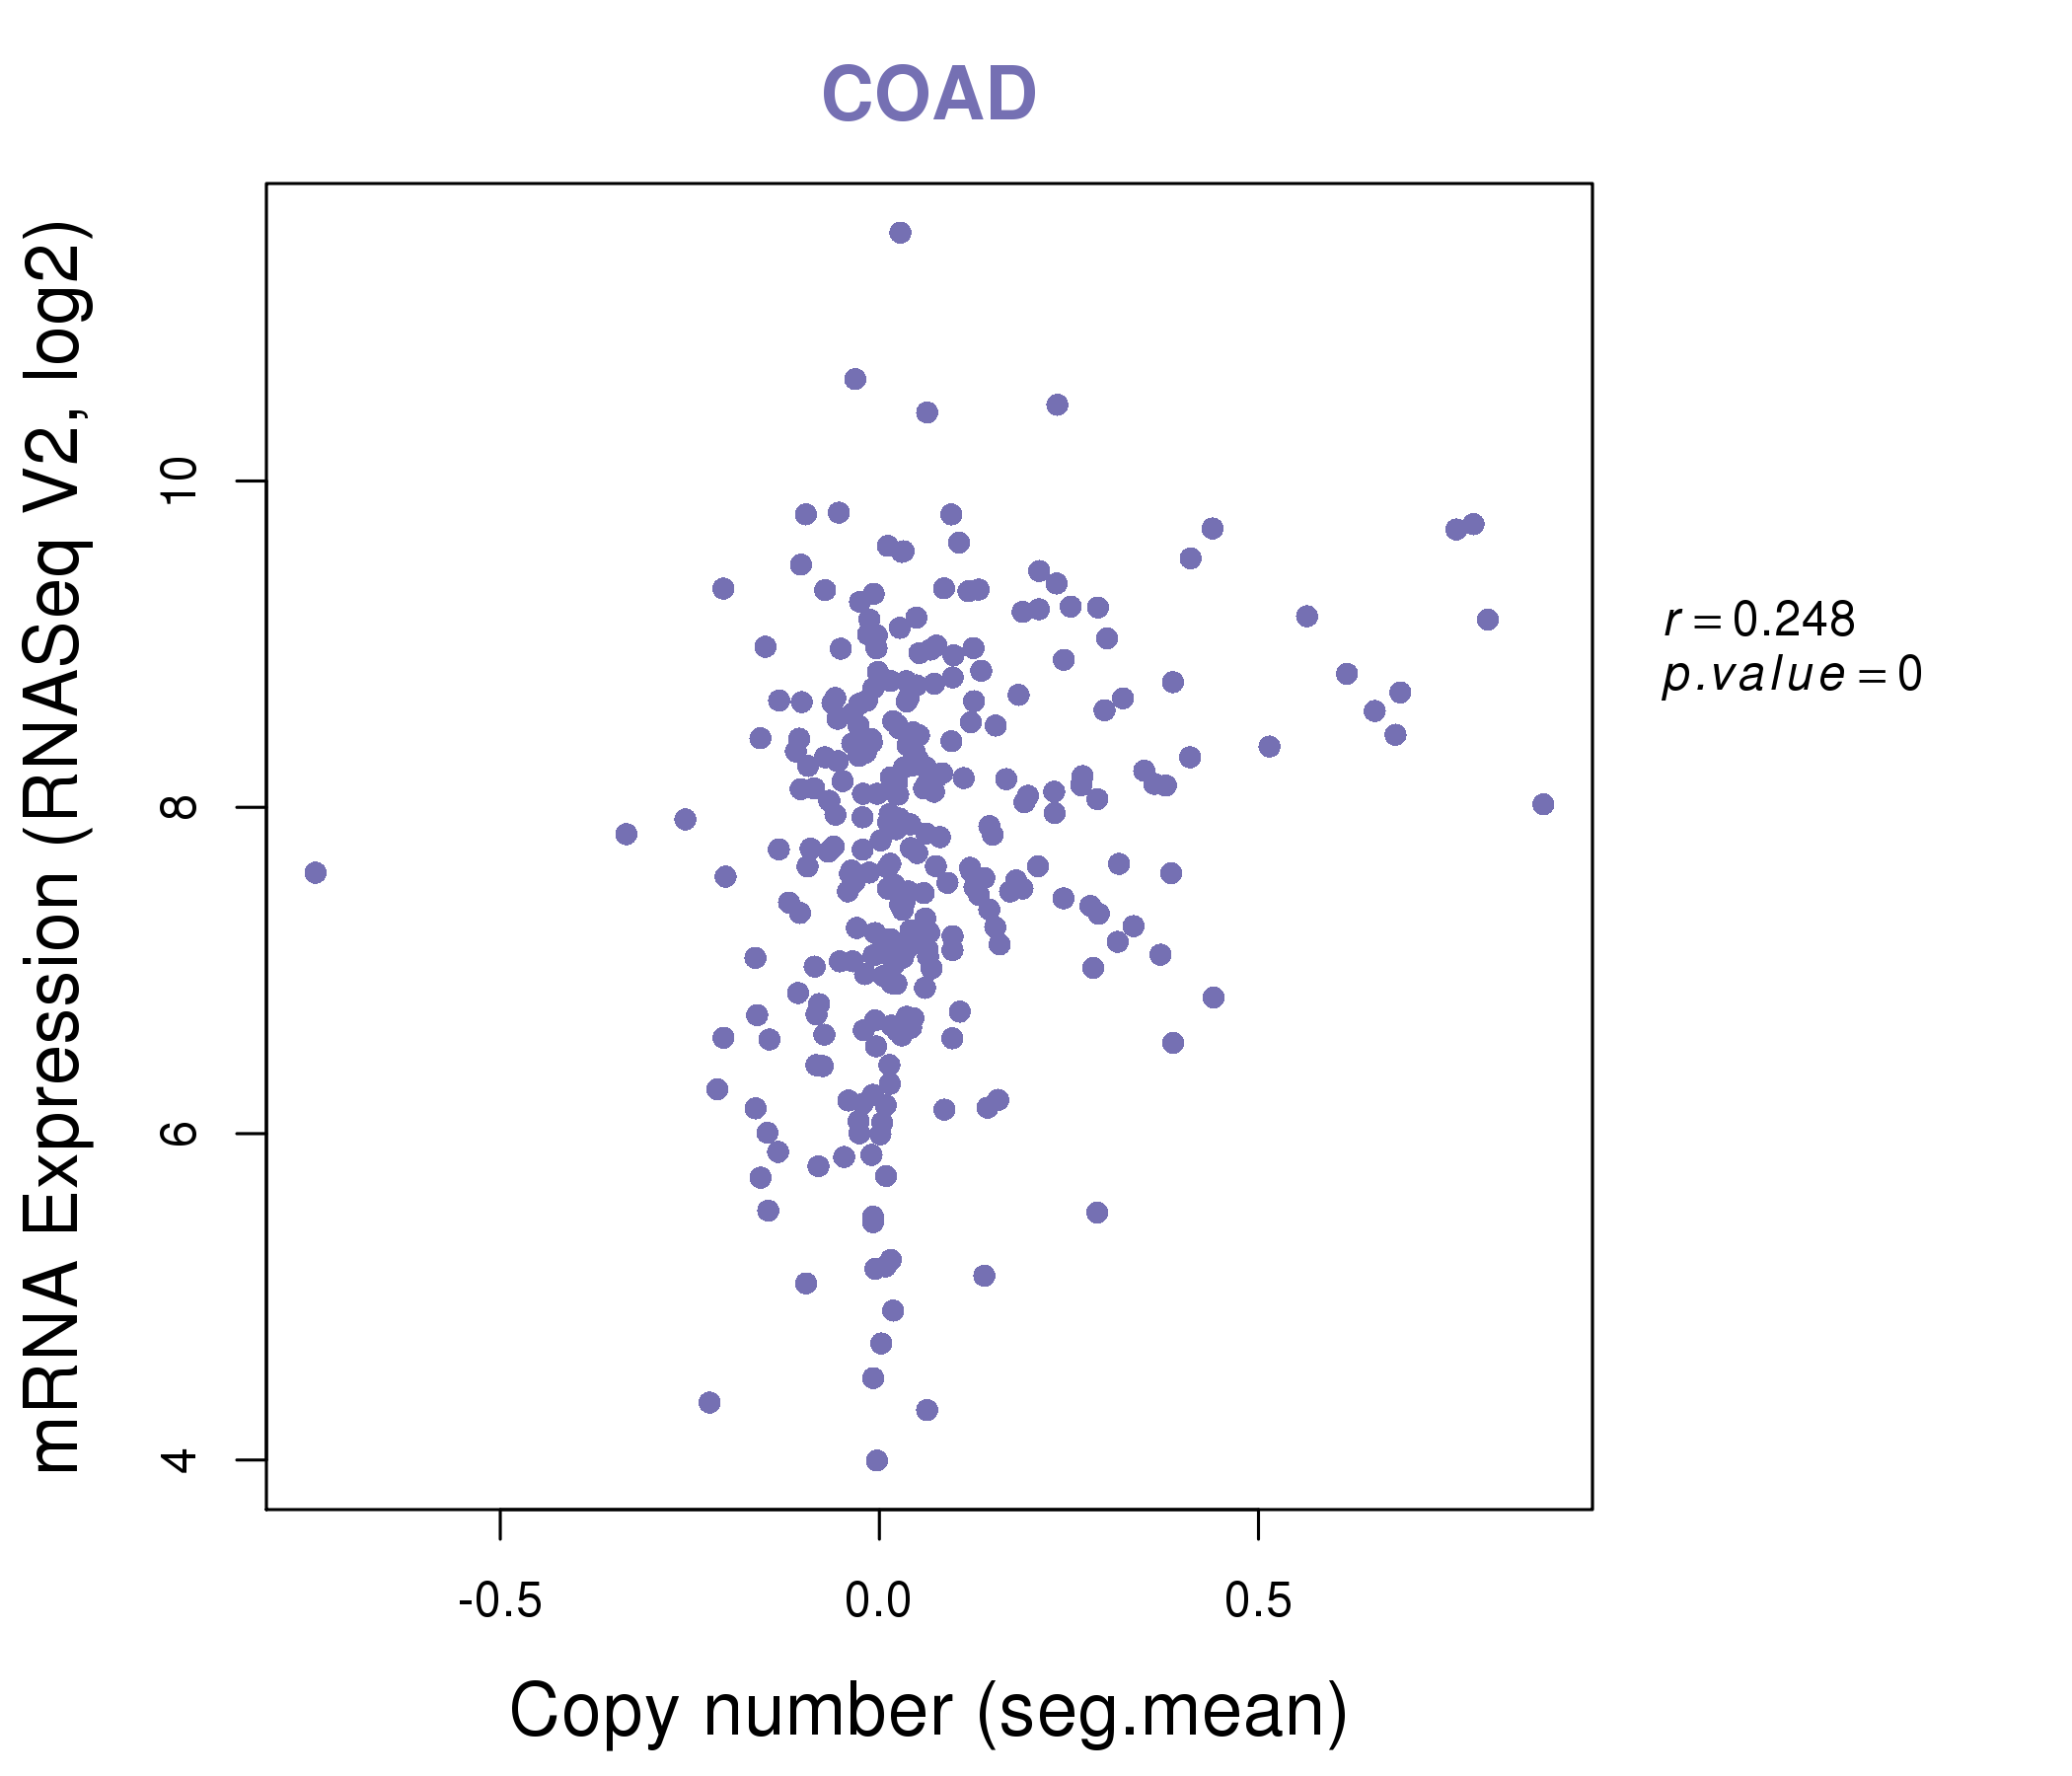
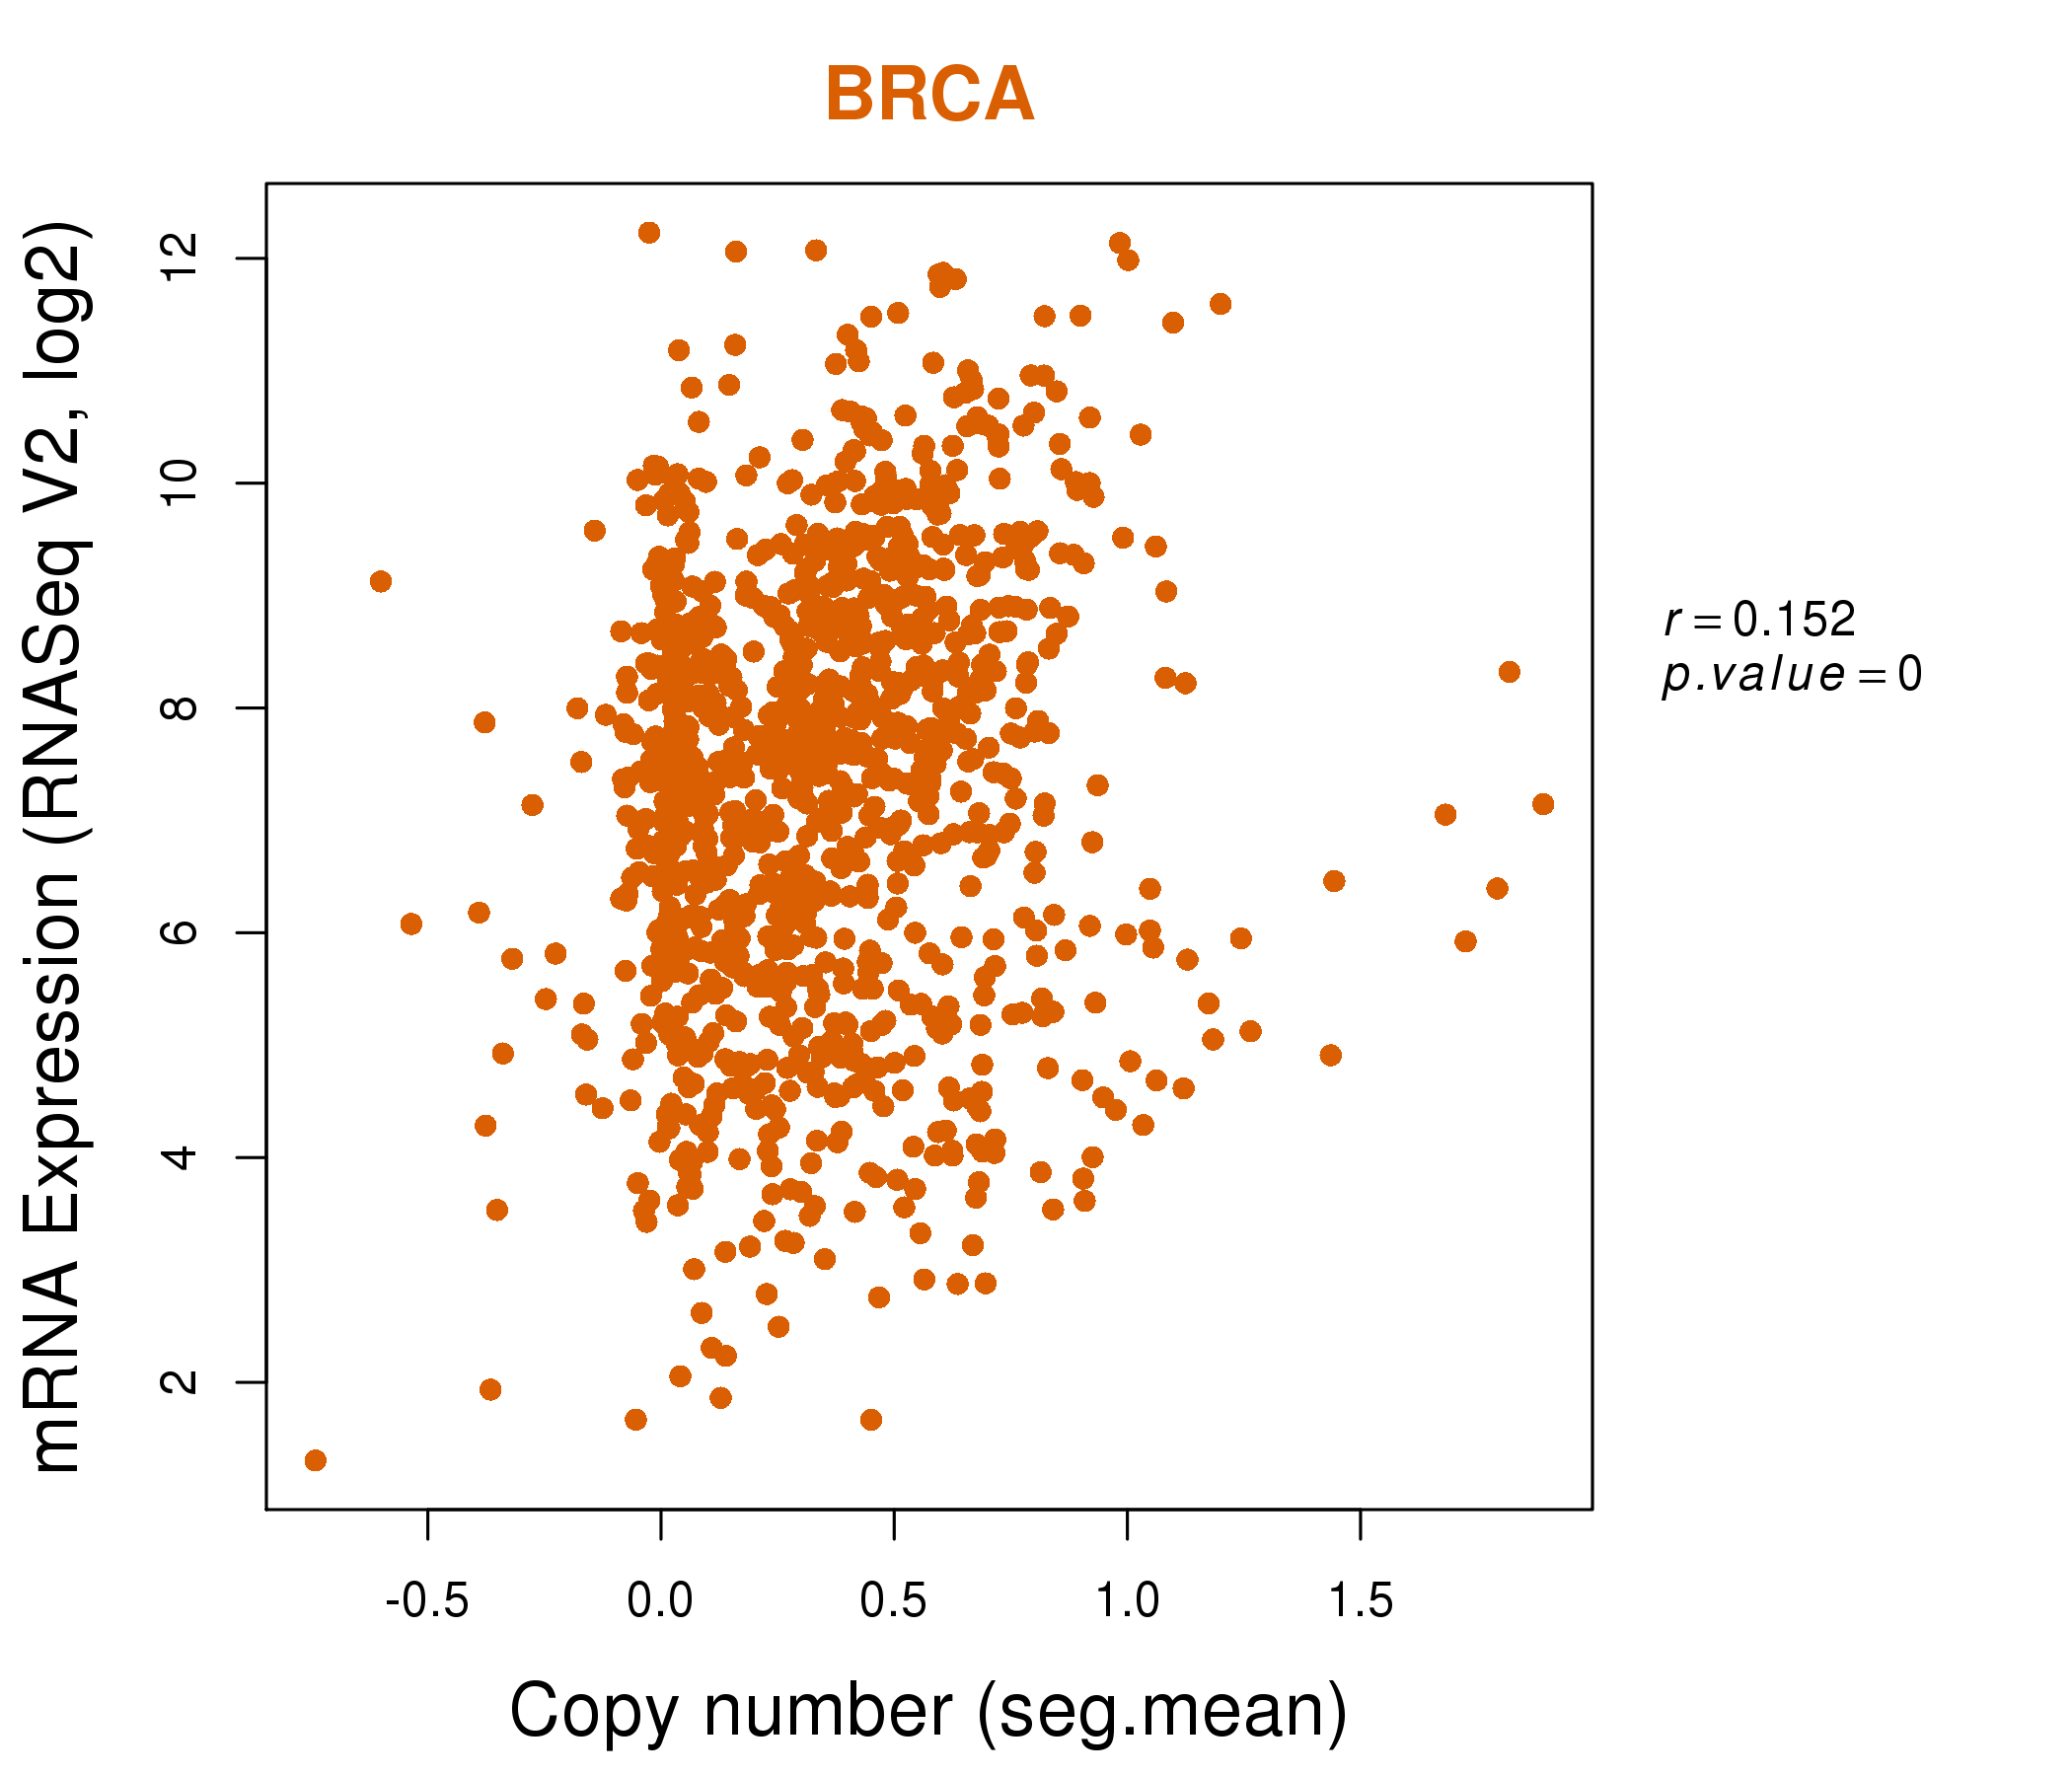
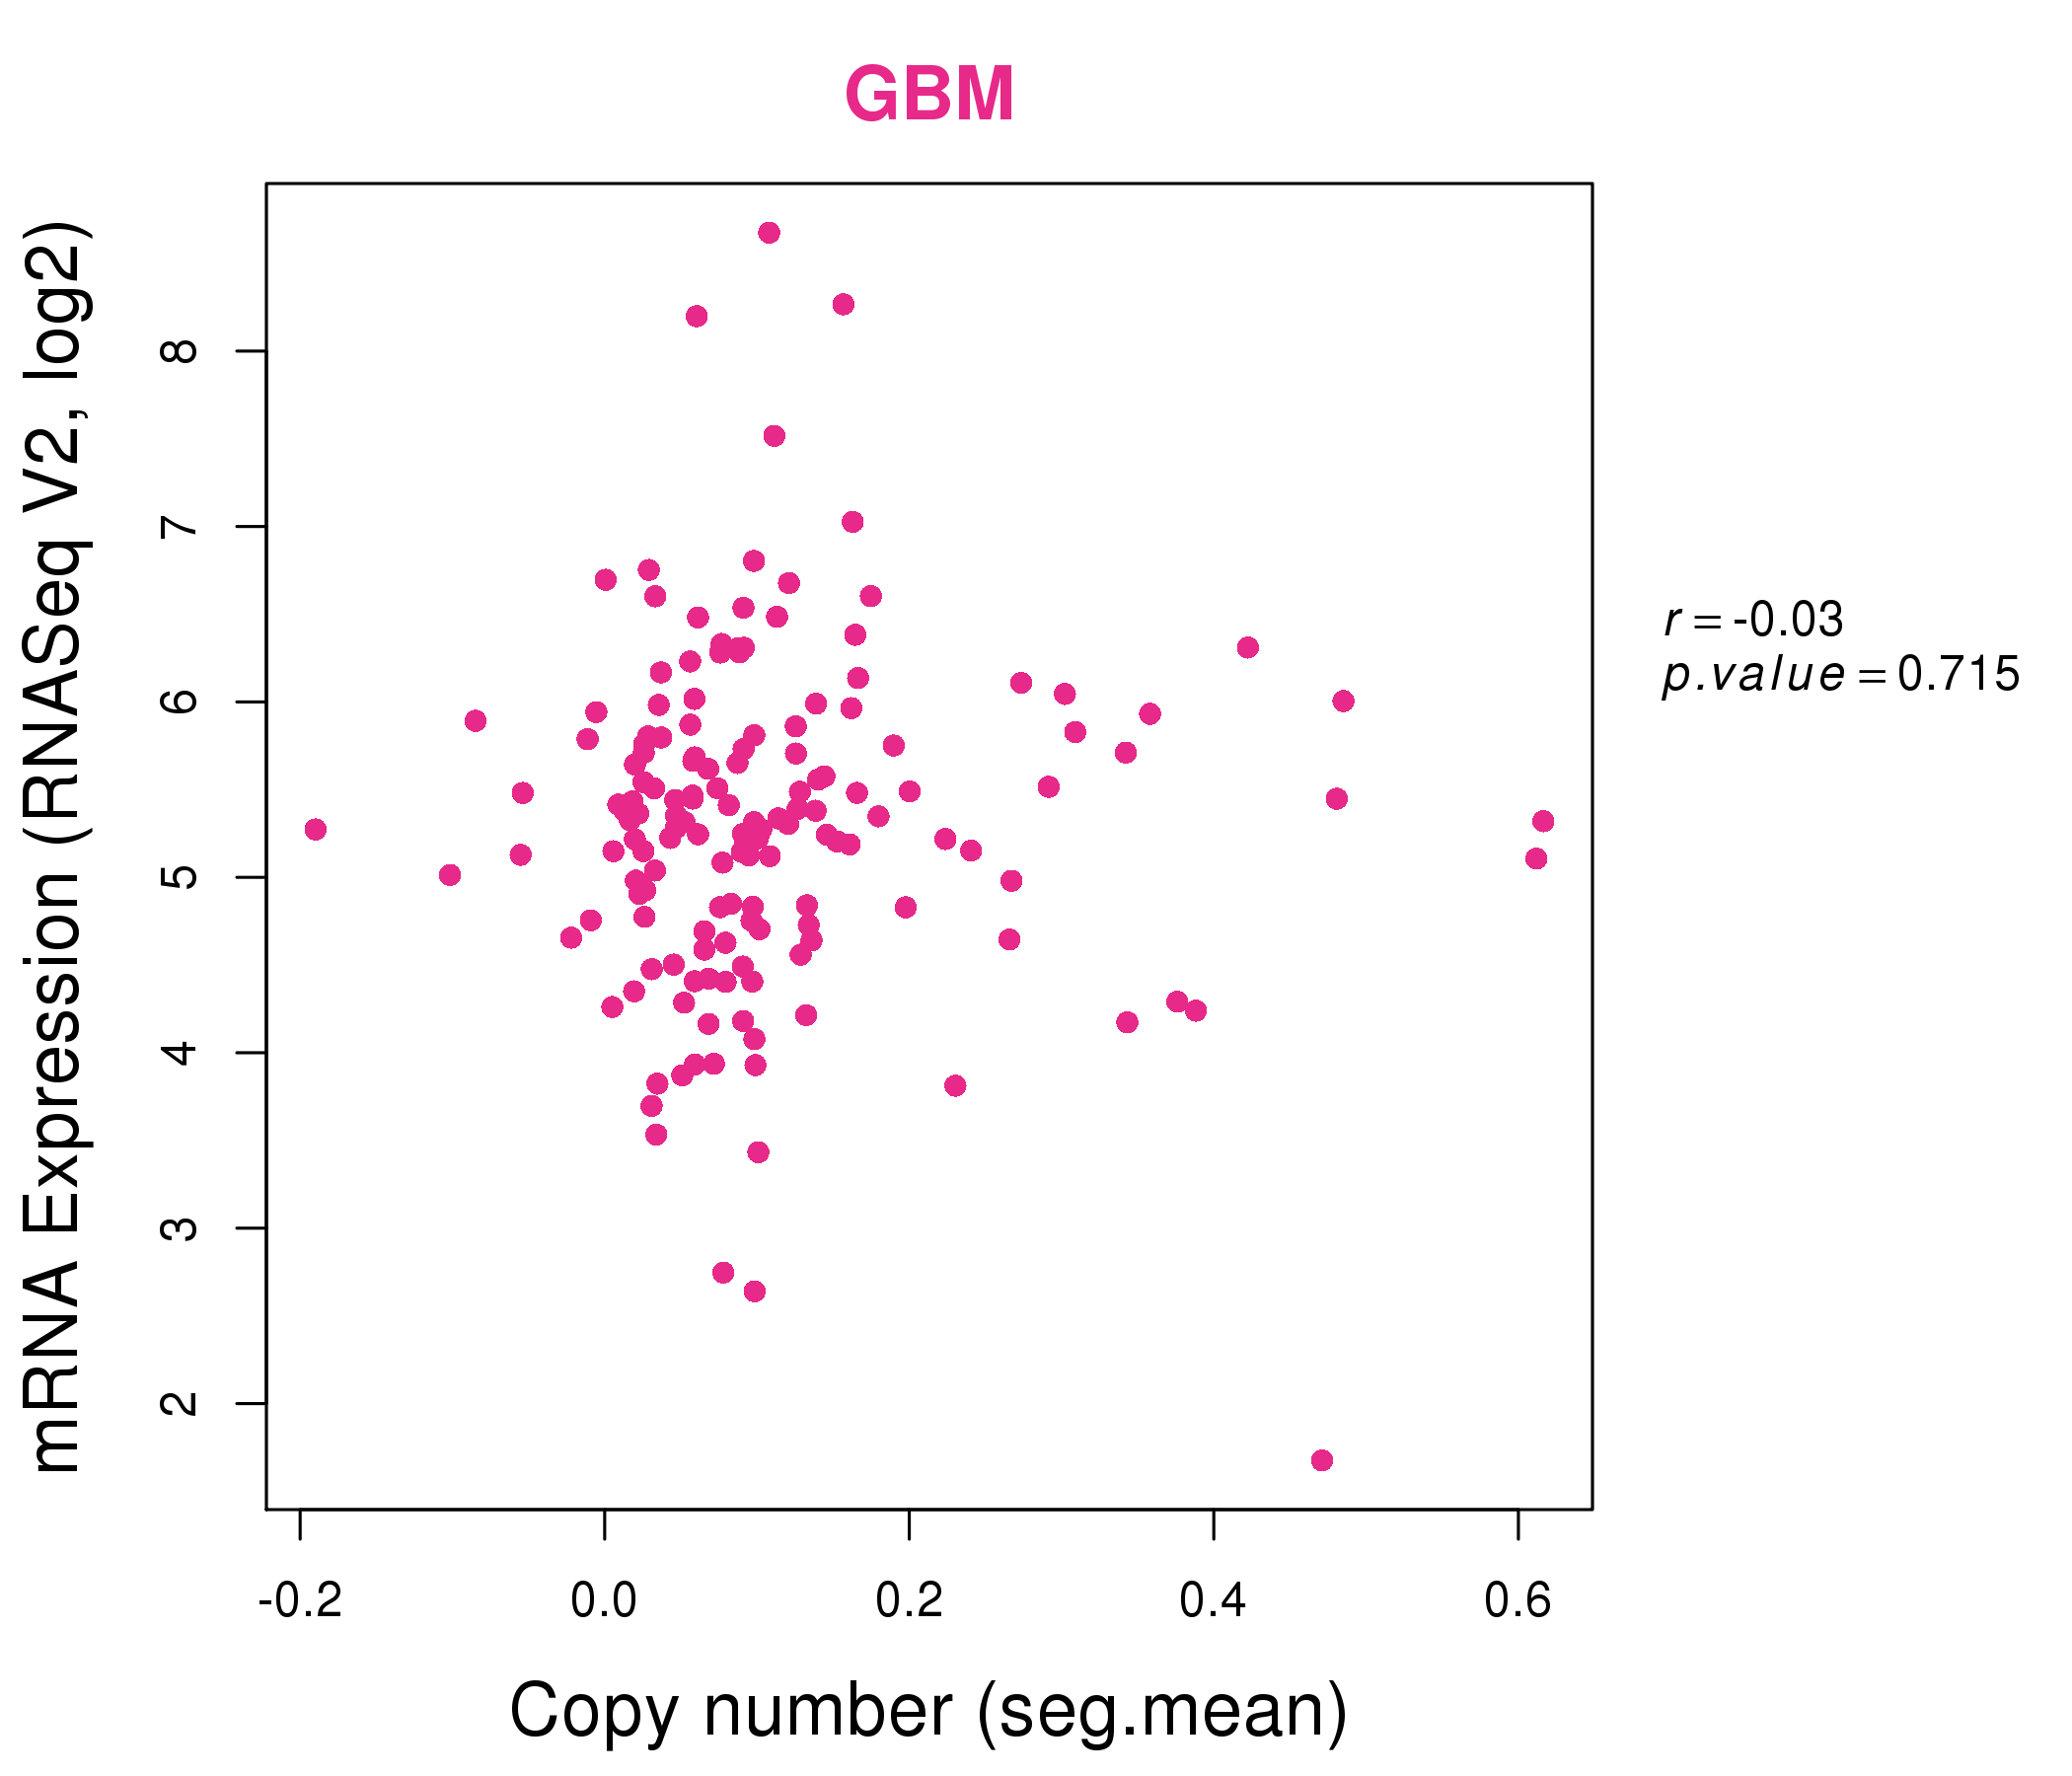
| * This plots show the correlation between CNV and gene expression. |
: Open all plots for all cancer types
 |
|
 |
|
| Top |
| Gene-Gene Network Information |
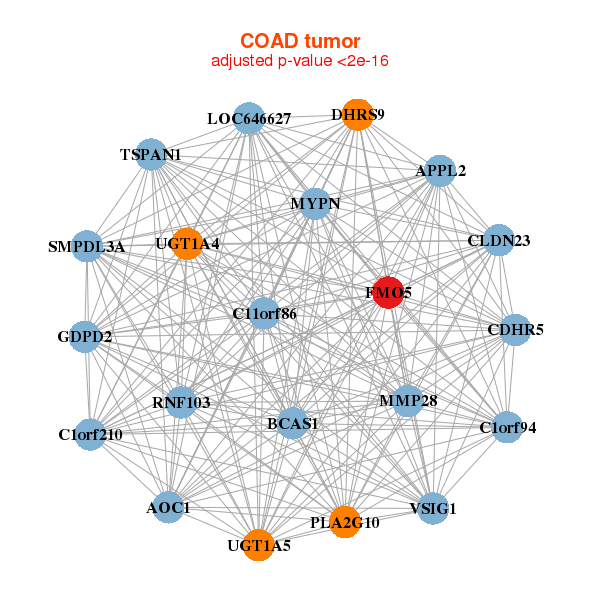
| * Co-Expression network figures were drawn using R package igraph. Only the top 20 genes with the highest correlations were shown. Red circle: input gene, orange circle: cell metabolism gene, sky circle: other gene |
: Open all plots for all cancer types
 |
|
| ALDH6A1,BTD,C1orf21,C1orf27,CD46,COG2,CYB5D1, EDEM3,ESR1,FMO5,IQGAP2,KIAA0040,KIF13B,LRIG1, OTUD7B,RABEP1,RALGPS2,TMEM144,TOR1AIP1,ZBTB41,ZCWPW2 | ABCC12,ACSL3,ADCY10,C15orf43,CCDC15,CTNNA2,EPS8L3, FMO5,HIST1H2AG,HMGCS2,IDI1,IYD,LST-3TM12,PON3, PXMP4,RNASE12,SERHL,SGPP2,SLC12A3,TMEM62,TMPRSS11F |
 |
|
| AOC1,APPL2,BCAS1,C11orf86,C1orf210,C1orf94,CDHR5, CLDN23,DHRS9,FMO5,GDPD2,LOC646627,MMP28,MYPN, PLA2G10,RNF103,SMPDL3A,TSPAN1,UGT1A4,UGT1A5,VSIG1 | ADPRHL1,ASTE1,C11orf52,CES2,CYP2S1,FMO5,GUCY2C, HSD17B11,MEP1A,NGEF,PIWIL2,PMM1,RAB17,RNF128, SLC39A5,STRADB,TMBIM6,TMEM120A,TNNC2,USH1C,VSIG10 |
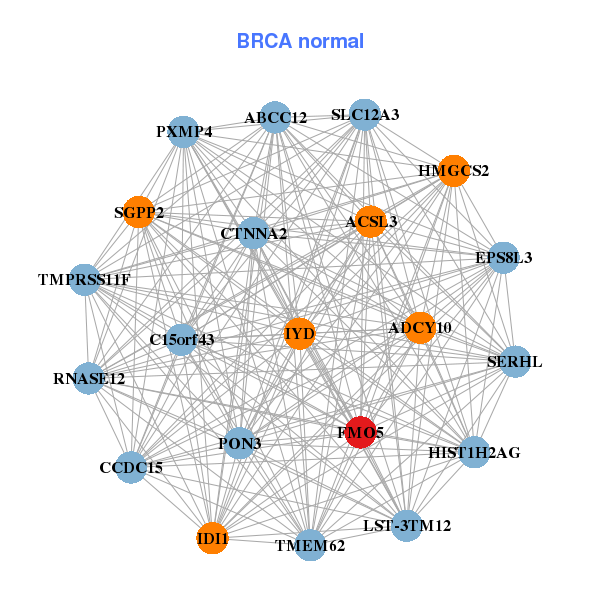
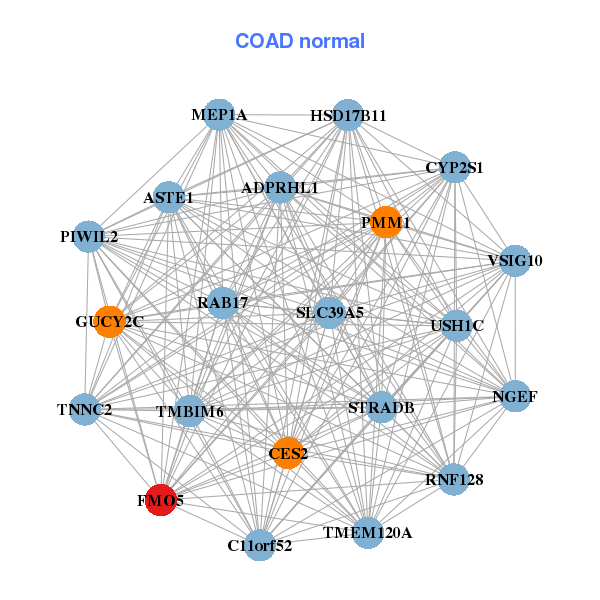
| * Co-Expression network figures were drawn using R package igraph. Only the top 20 genes with the highest correlations were shown. Red circle: input gene, orange circle: cell metabolism gene, sky circle: other gene |
: Open all plots for all cancer types
| Top |
: Open all interacting genes' information including KEGG pathway for all interacting genes from DAVID
| Top |
| Pharmacological Information for FMO5 |
| There's no related Drug. |
| Top |
| Cross referenced IDs for FMO5 |
| * We obtained these cross-references from Uniprot database. It covers 150 different DBs, 18 categories. http://www.uniprot.org/help/cross_references_section |
: Open all cross reference information
|
Copyright © 2016-Present - The Univsersity of Texas Health Science Center at Houston @ |