|
||||||||||||||||||||||||||||||||||||||||||||||||||||||||||||||||||||||||||||||||||||||||||||||||||||||||||||||||||||||||||||||||||||||||||||||||||||||||||||||||||||||||||||||||||||||||||||||||||||||||||||||||||||||||||||||||||||||||||||||||||||||||||||||||||||||||||||||||||||||||||||||||||||||||||||||||||||||||||
| |
| Phenotypic Information (metabolism pathway, cancer, disease, phenome) |
| |
| |
| Gene-Gene Network Information: Co-Expression Network, Interacting Genes & KEGG |
| |
|


| Gene Summary for SIN3B |
| Basic gene info. | Gene symbol | SIN3B |
| Gene name | SIN3 transcription regulator family member B | |
| Synonyms | - | |
| Cytomap | UCSC genome browser: 19p13.11 | |
| Genomic location | chr19 :16940208-16991164 | |
| Type of gene | protein-coding | |
| RefGenes | NM_001297595.1, NM_001297597.1,NM_015260.3, | |
| Ensembl id | ENSG00000127511 | |
| Description | SIN3 homolog B, transcriptional regulatorSIN3 transcription regulator homolog Bhistone deacetylase complex subunit Sin3bpaired amphipathic helix protein Sin3btranscriptional corepressor Sin3b | |
| Modification date | 20141207 | |
| dbXrefs | MIM : 607777 | |
| HGNC : HGNC | ||
| Ensembl : ENSG00000127511 | ||
| HPRD : 09691 | ||
| Vega : OTTHUMG00000182642 | ||
| Protein | UniProt: go to UniProt's Cross Reference DB Table | |
| Expression | CleanEX: HS_SIN3B | |
| BioGPS: 23309 | ||
| Gene Expression Atlas: ENSG00000127511 | ||
| The Human Protein Atlas: ENSG00000127511 | ||
| Pathway | NCI Pathway Interaction Database: SIN3B | |
| KEGG: SIN3B | ||
| REACTOME: SIN3B | ||
| ConsensusPathDB | ||
| Pathway Commons: SIN3B | ||
| Metabolism | MetaCyc: SIN3B | |
| HUMANCyc: SIN3B | ||
| Regulation | Ensembl's Regulation: ENSG00000127511 | |
| miRBase: chr19 :16,940,208-16,991,164 | ||
| TargetScan: NM_001297595 | ||
| cisRED: ENSG00000127511 | ||
| Context | iHOP: SIN3B | |
| cancer metabolism search in PubMed: SIN3B | ||
| UCL Cancer Institute: SIN3B | ||
| Assigned class in ccmGDB | C | |
| Top |
| Phenotypic Information for SIN3B(metabolism pathway, cancer, disease, phenome) |
| Cancer | CGAP: SIN3B |
| Familial Cancer Database: SIN3B | |
| * This gene is included in those cancer gene databases. |
|
|
|
|
|
| . | ||||||||||||||||||||||||||||||||||||||||||||||||||||||||||||||||||||||||||||||||||||||||||||||||||||||||||||||||||||||||||||||||||||||||||||||||||||||||||||||||||||||||||||||||||||||||||||||||||||||||||||||||||||||||||||||||||||||||||||||||||||||||||||||||||||||||||||||||||||||||||||||||||||||||||||||||||||
Oncogene 1 | Significant driver gene in | |||||||||||||||||||||||||||||||||||||||||||||||||||||||||||||||||||||||||||||||||||||||||||||||||||||||||||||||||||||||||||||||||||||||||||||||||||||||||||||||||||||||||||||||||||||||||||||||||||||||||||||||||||||||||||||||||||||||||||||||||||||||||||||||||||||||||||||||||||||||||||||||||||||||||||||||||||||||||
| cf) number; DB name 1 Oncogene; http://nar.oxfordjournals.org/content/35/suppl_1/D721.long, 2 Tumor Suppressor gene; https://bioinfo.uth.edu/TSGene/, 3 Cancer Gene Census; http://www.nature.com/nrc/journal/v4/n3/abs/nrc1299.html, 4 CancerGenes; http://nar.oxfordjournals.org/content/35/suppl_1/D721.long, 5 Network of Cancer Gene; http://ncg.kcl.ac.uk/index.php, 1Therapeutic Vulnerabilities in Cancer; http://cbio.mskcc.org/cancergenomics/statius/ |
| REACTOME_METABOLISM_OF_LIPIDS_AND_LIPOPROTEINS | |
| OMIM | |
| Orphanet | |
| Disease | KEGG Disease: SIN3B |
| MedGen: SIN3B (Human Medical Genetics with Condition) | |
| ClinVar: SIN3B | |
| Phenotype | MGI: SIN3B (International Mouse Phenotyping Consortium) |
| PhenomicDB: SIN3B | |
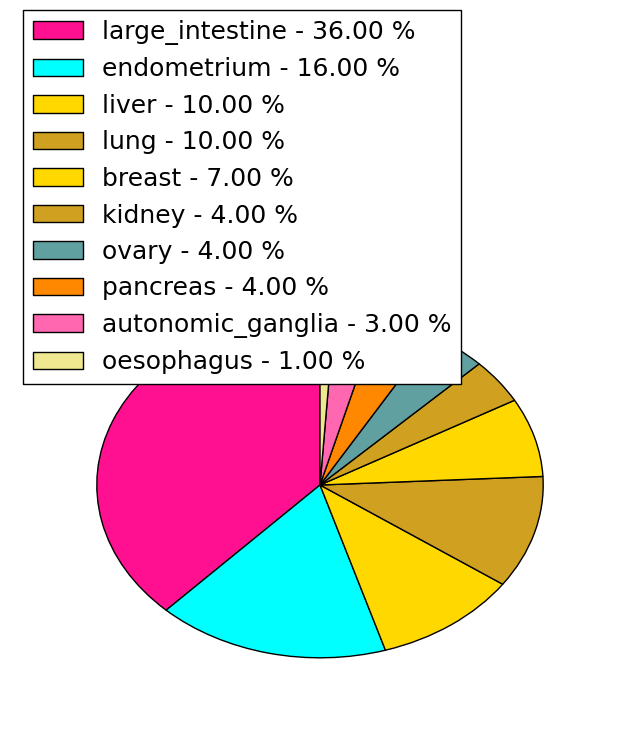
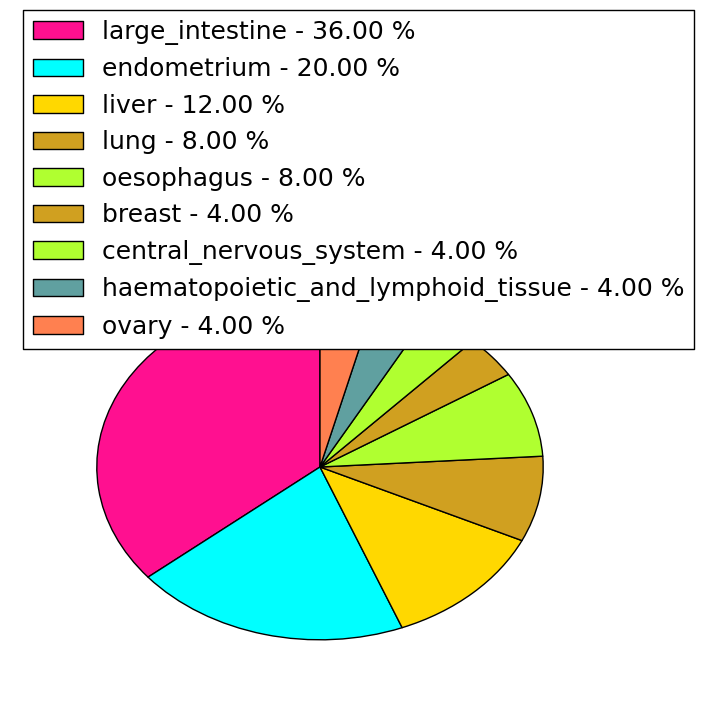
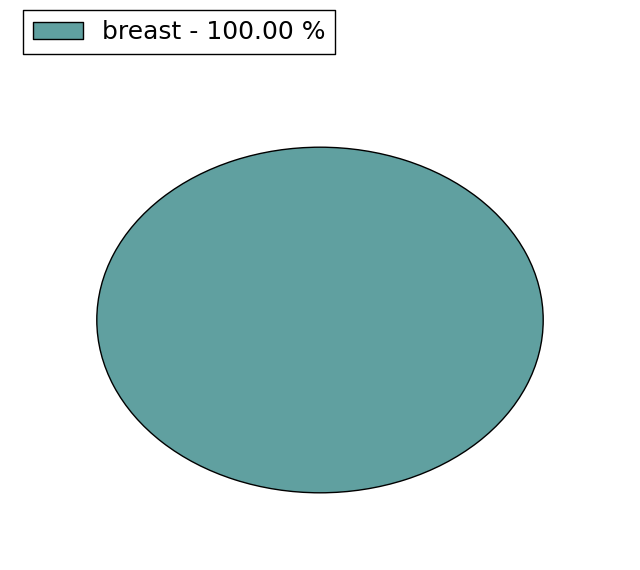
| Mutations for SIN3B |
| * Under tables are showing count per each tissue to give us broad intuition about tissue specific mutation patterns.You can go to the detailed page for each mutation database's web site. |
| - Statistics for Tissue and Mutation type | Top |
 |
| - For Inter-chromosomal Variations |
| There's no inter-chromosomal structural variation. |
| - For Intra-chromosomal Variations |
| * Intra-chromosomal variantions includes 'intrachromosomal amplicon to amplicon', 'intrachromosomal amplicon to non-amplified dna', 'intrachromosomal deletion', 'intrachromosomal fold-back inversion', 'intrachromosomal inversion', 'intrachromosomal tandem duplication', 'Intrachromosomal unknown type', 'intrachromosomal with inverted orientation', 'intrachromosomal with non-inverted orientation'. |
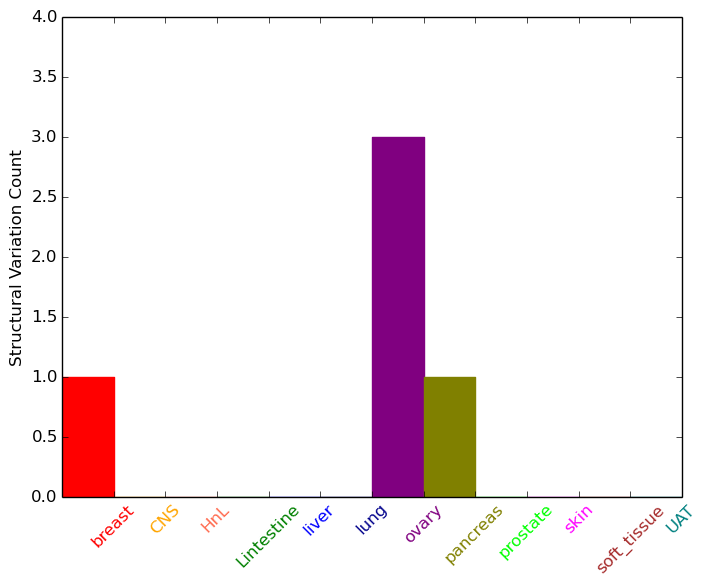 |
| Sample | Symbol_a | Chr_a | Start_a | End_a | Symbol_b | Chr_b | Start_b | End_b |
| breast | SIN3B | chr19 | 16967053 | 16967053 | CPAMD8 | chr19 | 17079512 | 17079512 |
| ovary | SIN3B | chr19 | 16973455 | 16973475 | PRKACA | chr19 | 14221750 | 14221770 |
| ovary | SIN3B | chr19 | 16974681 | 16974701 | KIAA0355 | chr19 | 34810967 | 34810987 |
| ovary | SIN3B | chr19 | 16980483 | 16980503 | chr19 | 8470923 | 8470943 | |
| pancreas | SIN3B | chr19 | 16962126 | 16962146 | SIN3B | chr19 | 16983693 | 16983713 |
| cf) Tissue number; Tissue name (1;Breast, 2;Central_nervous_system, 3;Haematopoietic_and_lymphoid_tissue, 4;Large_intestine, 5;Liver, 6;Lung, 7;Ovary, 8;Pancreas, 9;Prostate, 10;Skin, 11;Soft_tissue, 12;Upper_aerodigestive_tract) |
| * From mRNA Sanger sequences, Chitars2.0 arranged chimeric transcripts. This table shows SIN3B related fusion information. |
| ID | Head Gene | Tail Gene | Accession | Gene_a | qStart_a | qEnd_a | Chromosome_a | tStart_a | tEnd_a | Gene_a | qStart_a | qEnd_a | Chromosome_a | tStart_a | tEnd_a |
| BQ308641 | SIN3B | 2 | 232 | 19 | 16980420 | 16980652 | SIN3B | 227 | 288 | 19 | 16980299 | 16980359 | |
| BQ181363 | YEATS2 | 19 | 436 | 3 | 183529995 | 183530411 | SIN3B | 433 | 670 | 19 | 16954465 | 16954702 | |
| BF365213 | SIN3B | 14 | 281 | 19 | 16944999 | 16945267 | SIN3B | 275 | 327 | 19 | 16945295 | 16945347 | |
| Top |
| Mutation type/ Tissue ID | brca | cns | cerv | endome | haematopo | kidn | Lintest | liver | lung | ns | ovary | pancre | prost | skin | stoma | thyro | urina | |||
| Total # sample | 1 | |||||||||||||||||||
| GAIN (# sample) | 1 | |||||||||||||||||||
| LOSS (# sample) |
| cf) Tissue ID; Tissue type (1; Breast, 2; Central_nervous_system, 3; Cervix, 4; Endometrium, 5; Haematopoietic_and_lymphoid_tissue, 6; Kidney, 7; Large_intestine, 8; Liver, 9; Lung, 10; NS, 11; Ovary, 12; Pancreas, 13; Prostate, 14; Skin, 15; Stomach, 16; Thyroid, 17; Urinary_tract) |
| Top |
|
 |
| Top |
| Stat. for Non-Synonymous SNVs (# total SNVs=66) | (# total SNVs=25) |
 |  |
(# total SNVs=4) | (# total SNVs=1) |
 |  |
| Top |
| * When you move the cursor on each content, you can see more deailed mutation information on the Tooltip. Those are primary_site,primary_histology,mutation(aa),pubmedID. |
| GRCh37 position | Mutation(aa) | Unique sampleID count |
| chr19:16973291-16973291 | p.R396H | 3 |
| chr19:16973290-16973290 | p.R396C | 2 |
| chr19:16976289-16976289 | p.S516S | 2 |
| chr19:16952630-16952630 | p.P145S | 2 |
| chr19:16942395-16942395 | p.L106L | 2 |
| chr19:16974595-16974595 | p.D489D | 2 |
| chr19:16965033-16965033 | p.S340Y | 2 |
| chr19:16989099-16989099 | p.C1052C | 2 |
| chr19:16974600-16974600 | p.R491H | 2 |
| chr19:16940697-16940697 | p.F72L | 2 |
| Top |
|
 |
| Point Mutation/ Tissue ID | 1 | 2 | 3 | 4 | 5 | 6 | 7 | 8 | 9 | 10 | 11 | 12 | 13 | 14 | 15 | 16 | 17 | 18 | 19 | 20 |
| # sample | 1 | 4 | 14 | 5 | 2 | 2 | 1 | 5 | 3 | 3 | 13 | 12 | 1 | 11 | ||||||
| # mutation | 1 | 4 | 16 | 5 | 2 | 2 | 1 | 5 | 3 | 3 | 14 | 15 | 1 | 15 | ||||||
| nonsynonymous SNV | 3 | 8 | 4 | 1 | 2 | 1 | 1 | 3 | 3 | 5 | 11 | 1 | 11 | |||||||
| synonymous SNV | 1 | 1 | 8 | 1 | 1 | 4 | 9 | 4 | 4 |
| cf) Tissue ID; Tissue type (1; BLCA[Bladder Urothelial Carcinoma], 2; BRCA[Breast invasive carcinoma], 3; CESC[Cervical squamous cell carcinoma and endocervical adenocarcinoma], 4; COAD[Colon adenocarcinoma], 5; GBM[Glioblastoma multiforme], 6; Glioma Low Grade, 7; HNSC[Head and Neck squamous cell carcinoma], 8; KICH[Kidney Chromophobe], 9; KIRC[Kidney renal clear cell carcinoma], 10; KIRP[Kidney renal papillary cell carcinoma], 11; LAML[Acute Myeloid Leukemia], 12; LUAD[Lung adenocarcinoma], 13; LUSC[Lung squamous cell carcinoma], 14; OV[Ovarian serous cystadenocarcinoma ], 15; PAAD[Pancreatic adenocarcinoma], 16; PRAD[Prostate adenocarcinoma], 17; SKCM[Skin Cutaneous Melanoma], 18:STAD[Stomach adenocarcinoma], 19:THCA[Thyroid carcinoma], 20:UCEC[Uterine Corpus Endometrial Carcinoma]) |
| Top |
| * We represented just top 10 SNVs. When you move the cursor on each content, you can see more deailed mutation information on the Tooltip. Those are primary_site, primary_histology, mutation(aa), pubmedID. |
| Genomic Position | Mutation(aa) | Unique sampleID count |
| chr19:16952630 | p.A157A,SIN3B | 2 |
| chr19:16974595 | p.P145S,SIN3B | 2 |
| chr19:16977262 | p.D47D,SIN3B | 2 |
| chr19:16973290 | p.R396C,SIN3B | 2 |
| chr19:16942395 | p.L106L,SIN3B | 2 |
| chr19:16974605 | p.H259H,SIN3B | 1 |
| chr19:16989146 | p.S440S | 1 |
| chr19:16957795 | p.V127I,SIN3B | 1 |
| chr19:16977266 | p.S386N,SIN3B | 1 |
| chr19:16963895 | p.I120M,SIN3B | 1 |
| * Copy number data were extracted from TCGA using R package TCGA-Assembler. The URLs of all public data files on TCGA DCC data server were gathered on Jan-05-2015. Function ProcessCNAData in TCGA-Assembler package was used to obtain gene-level copy number value which is calculated as the average copy number of the genomic region of a gene. |
 |
| cf) Tissue ID[Tissue type]: BLCA[Bladder Urothelial Carcinoma], BRCA[Breast invasive carcinoma], CESC[Cervical squamous cell carcinoma and endocervical adenocarcinoma], COAD[Colon adenocarcinoma], GBM[Glioblastoma multiforme], Glioma Low Grade, HNSC[Head and Neck squamous cell carcinoma], KICH[Kidney Chromophobe], KIRC[Kidney renal clear cell carcinoma], KIRP[Kidney renal papillary cell carcinoma], LAML[Acute Myeloid Leukemia], LUAD[Lung adenocarcinoma], LUSC[Lung squamous cell carcinoma], OV[Ovarian serous cystadenocarcinoma ], PAAD[Pancreatic adenocarcinoma], PRAD[Prostate adenocarcinoma], SKCM[Skin Cutaneous Melanoma], STAD[Stomach adenocarcinoma], THCA[Thyroid carcinoma], UCEC[Uterine Corpus Endometrial Carcinoma] |
| Top |
| Gene Expression for SIN3B |
| * CCLE gene expression data were extracted from CCLE_Expression_Entrez_2012-10-18.res: Gene-centric RMA-normalized mRNA expression data. |
 |
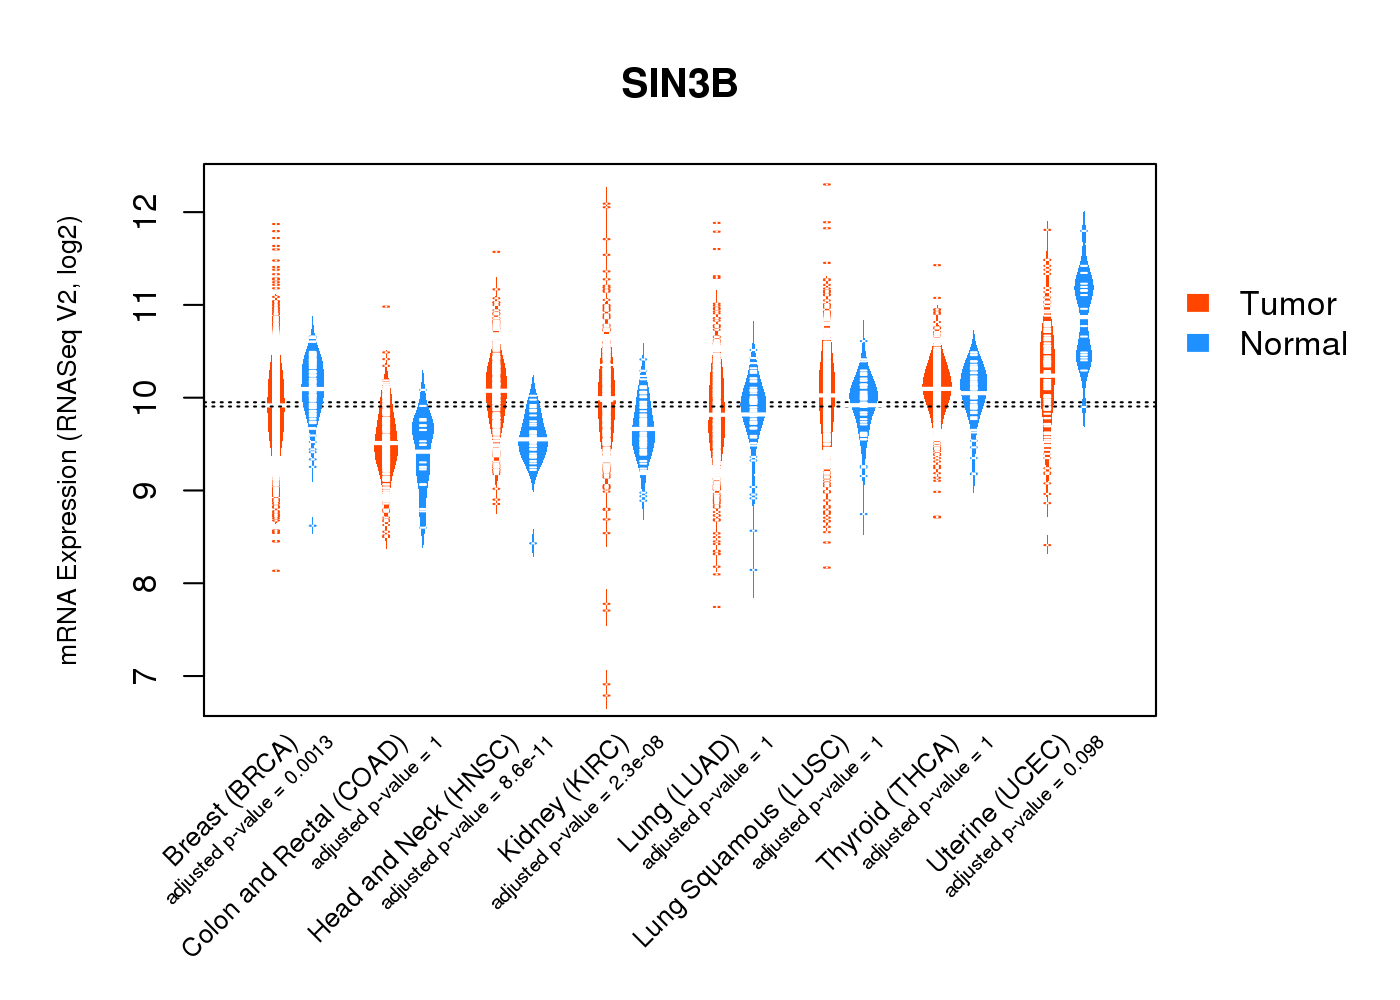
| * Normalized gene expression data of RNASeqV2 was extracted from TCGA using R package TCGA-Assembler. The URLs of all public data files on TCGA DCC data server were gathered at Jan-05-2015. Only eight cancer types have enough normal control samples for differential expression analysis. (t test, adjusted p<0.05 (using Benjamini-Hochberg FDR)) |
 |
| Top |
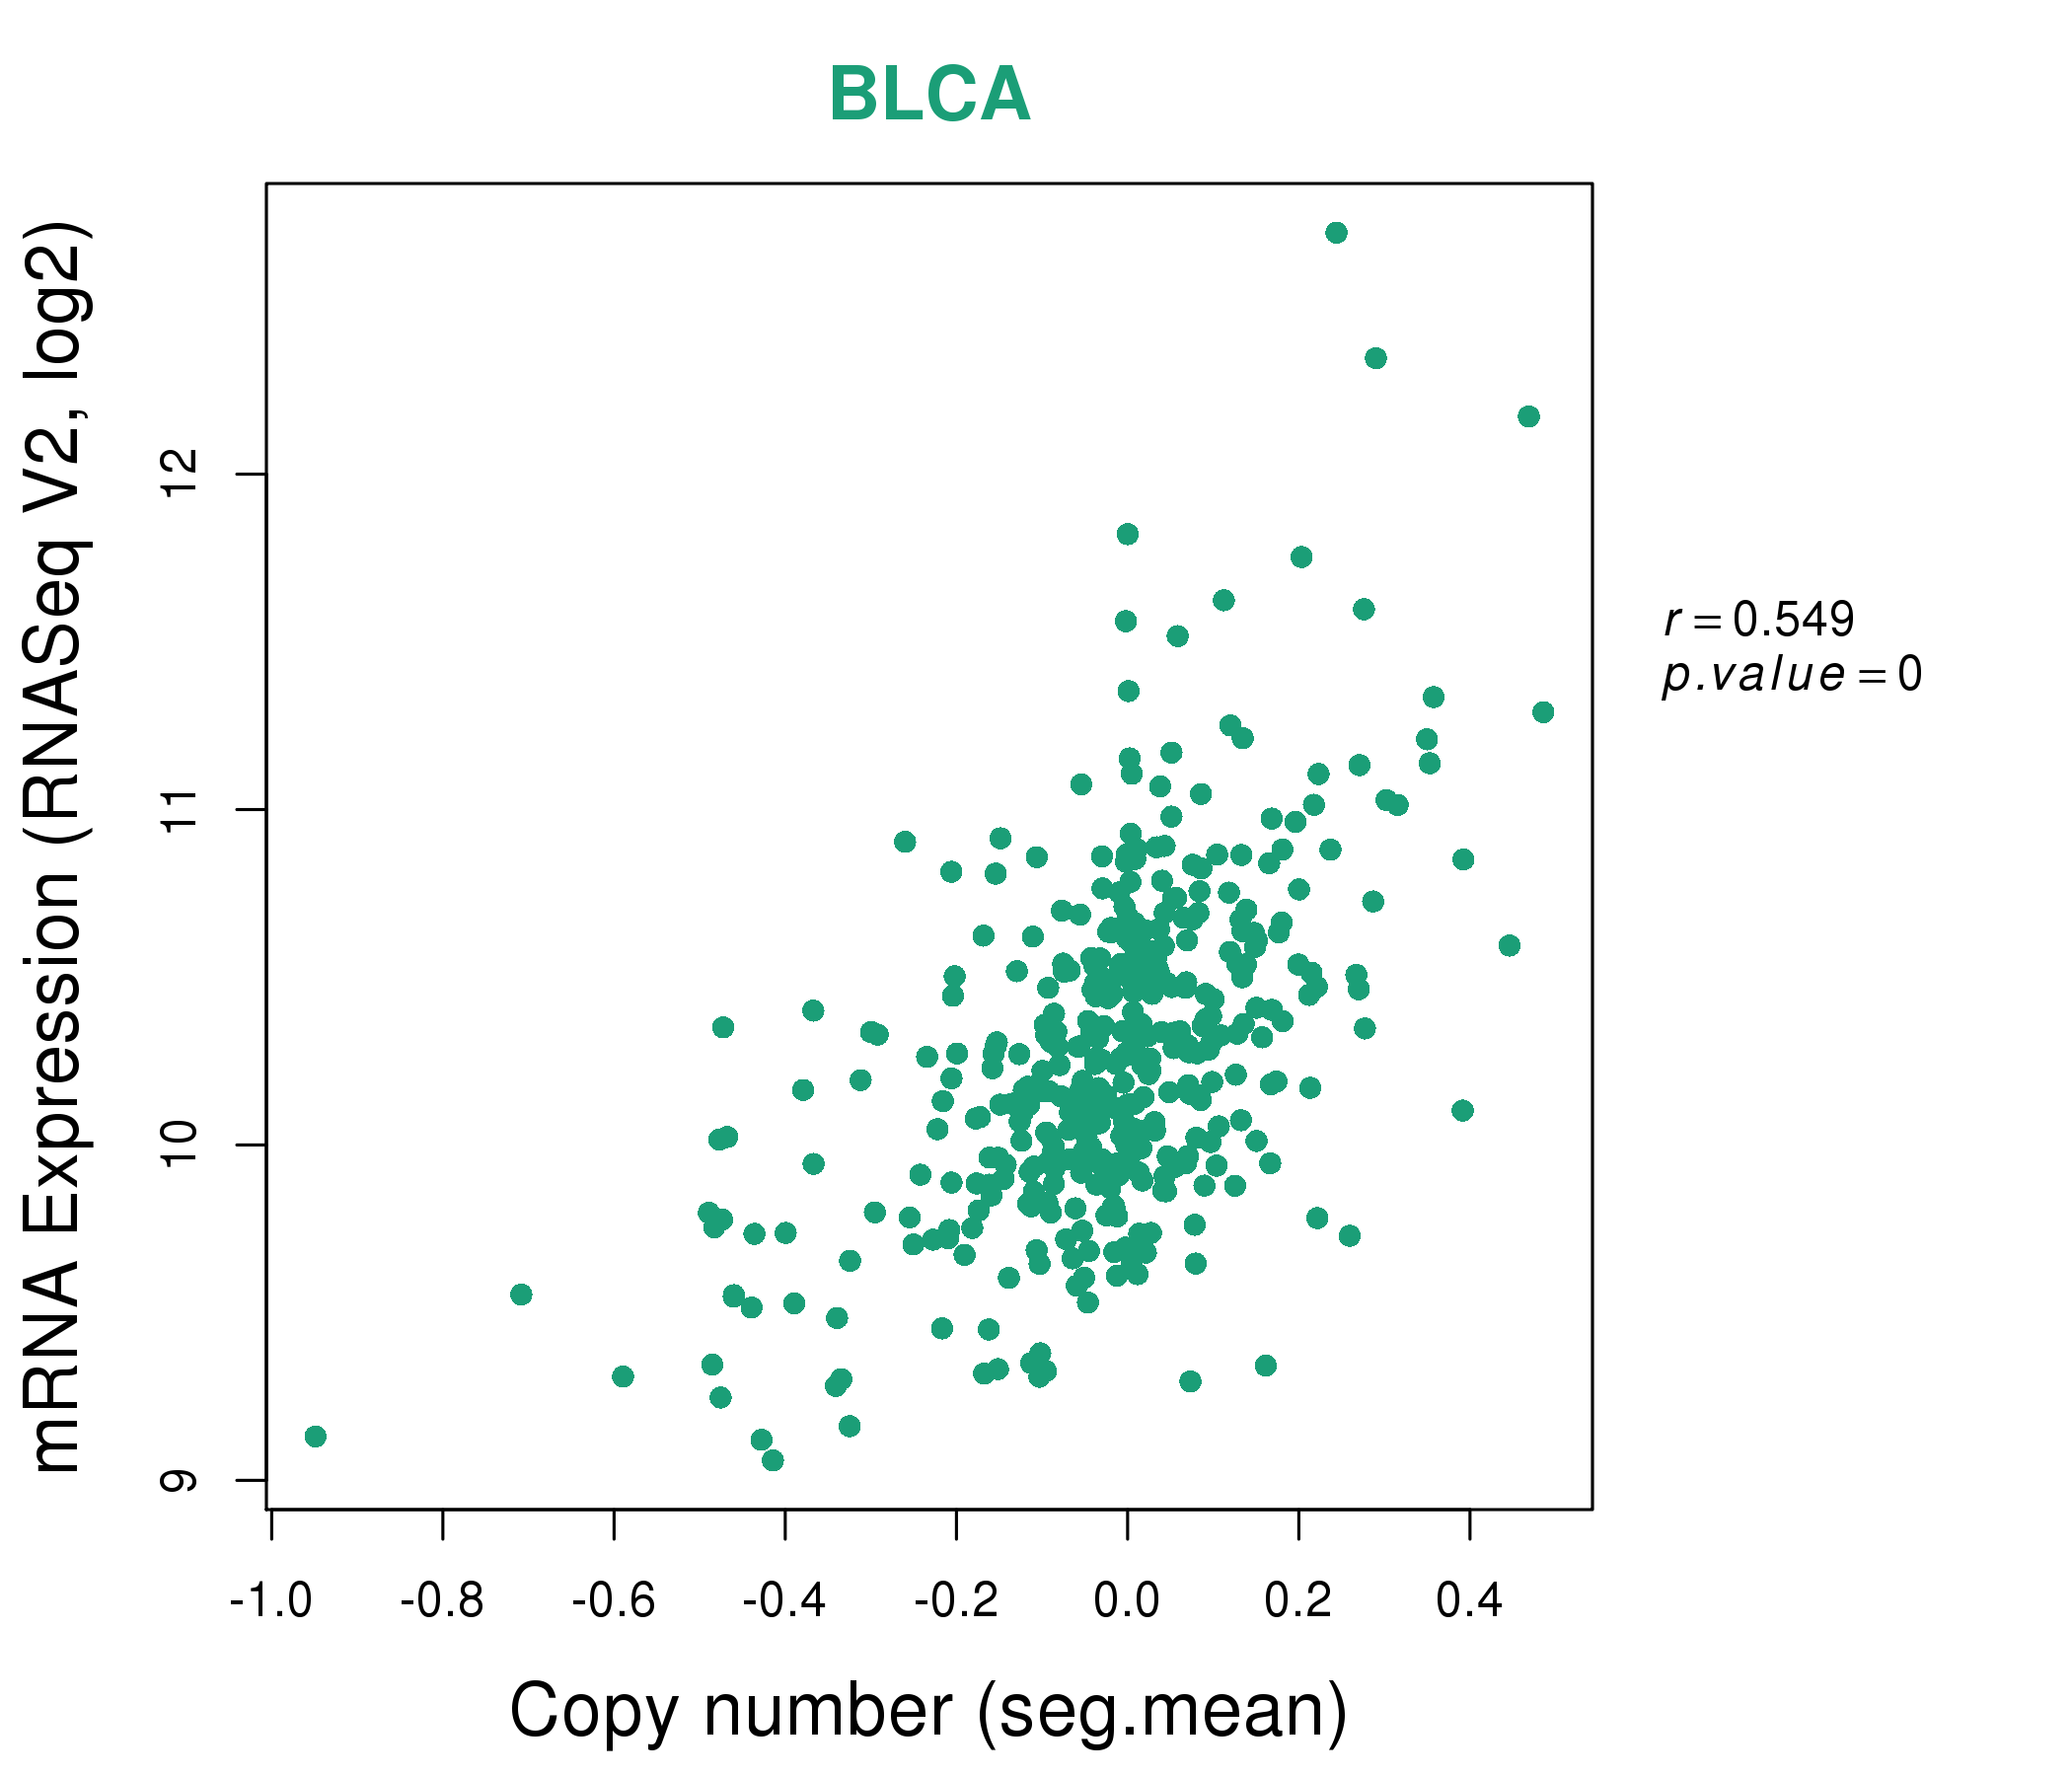
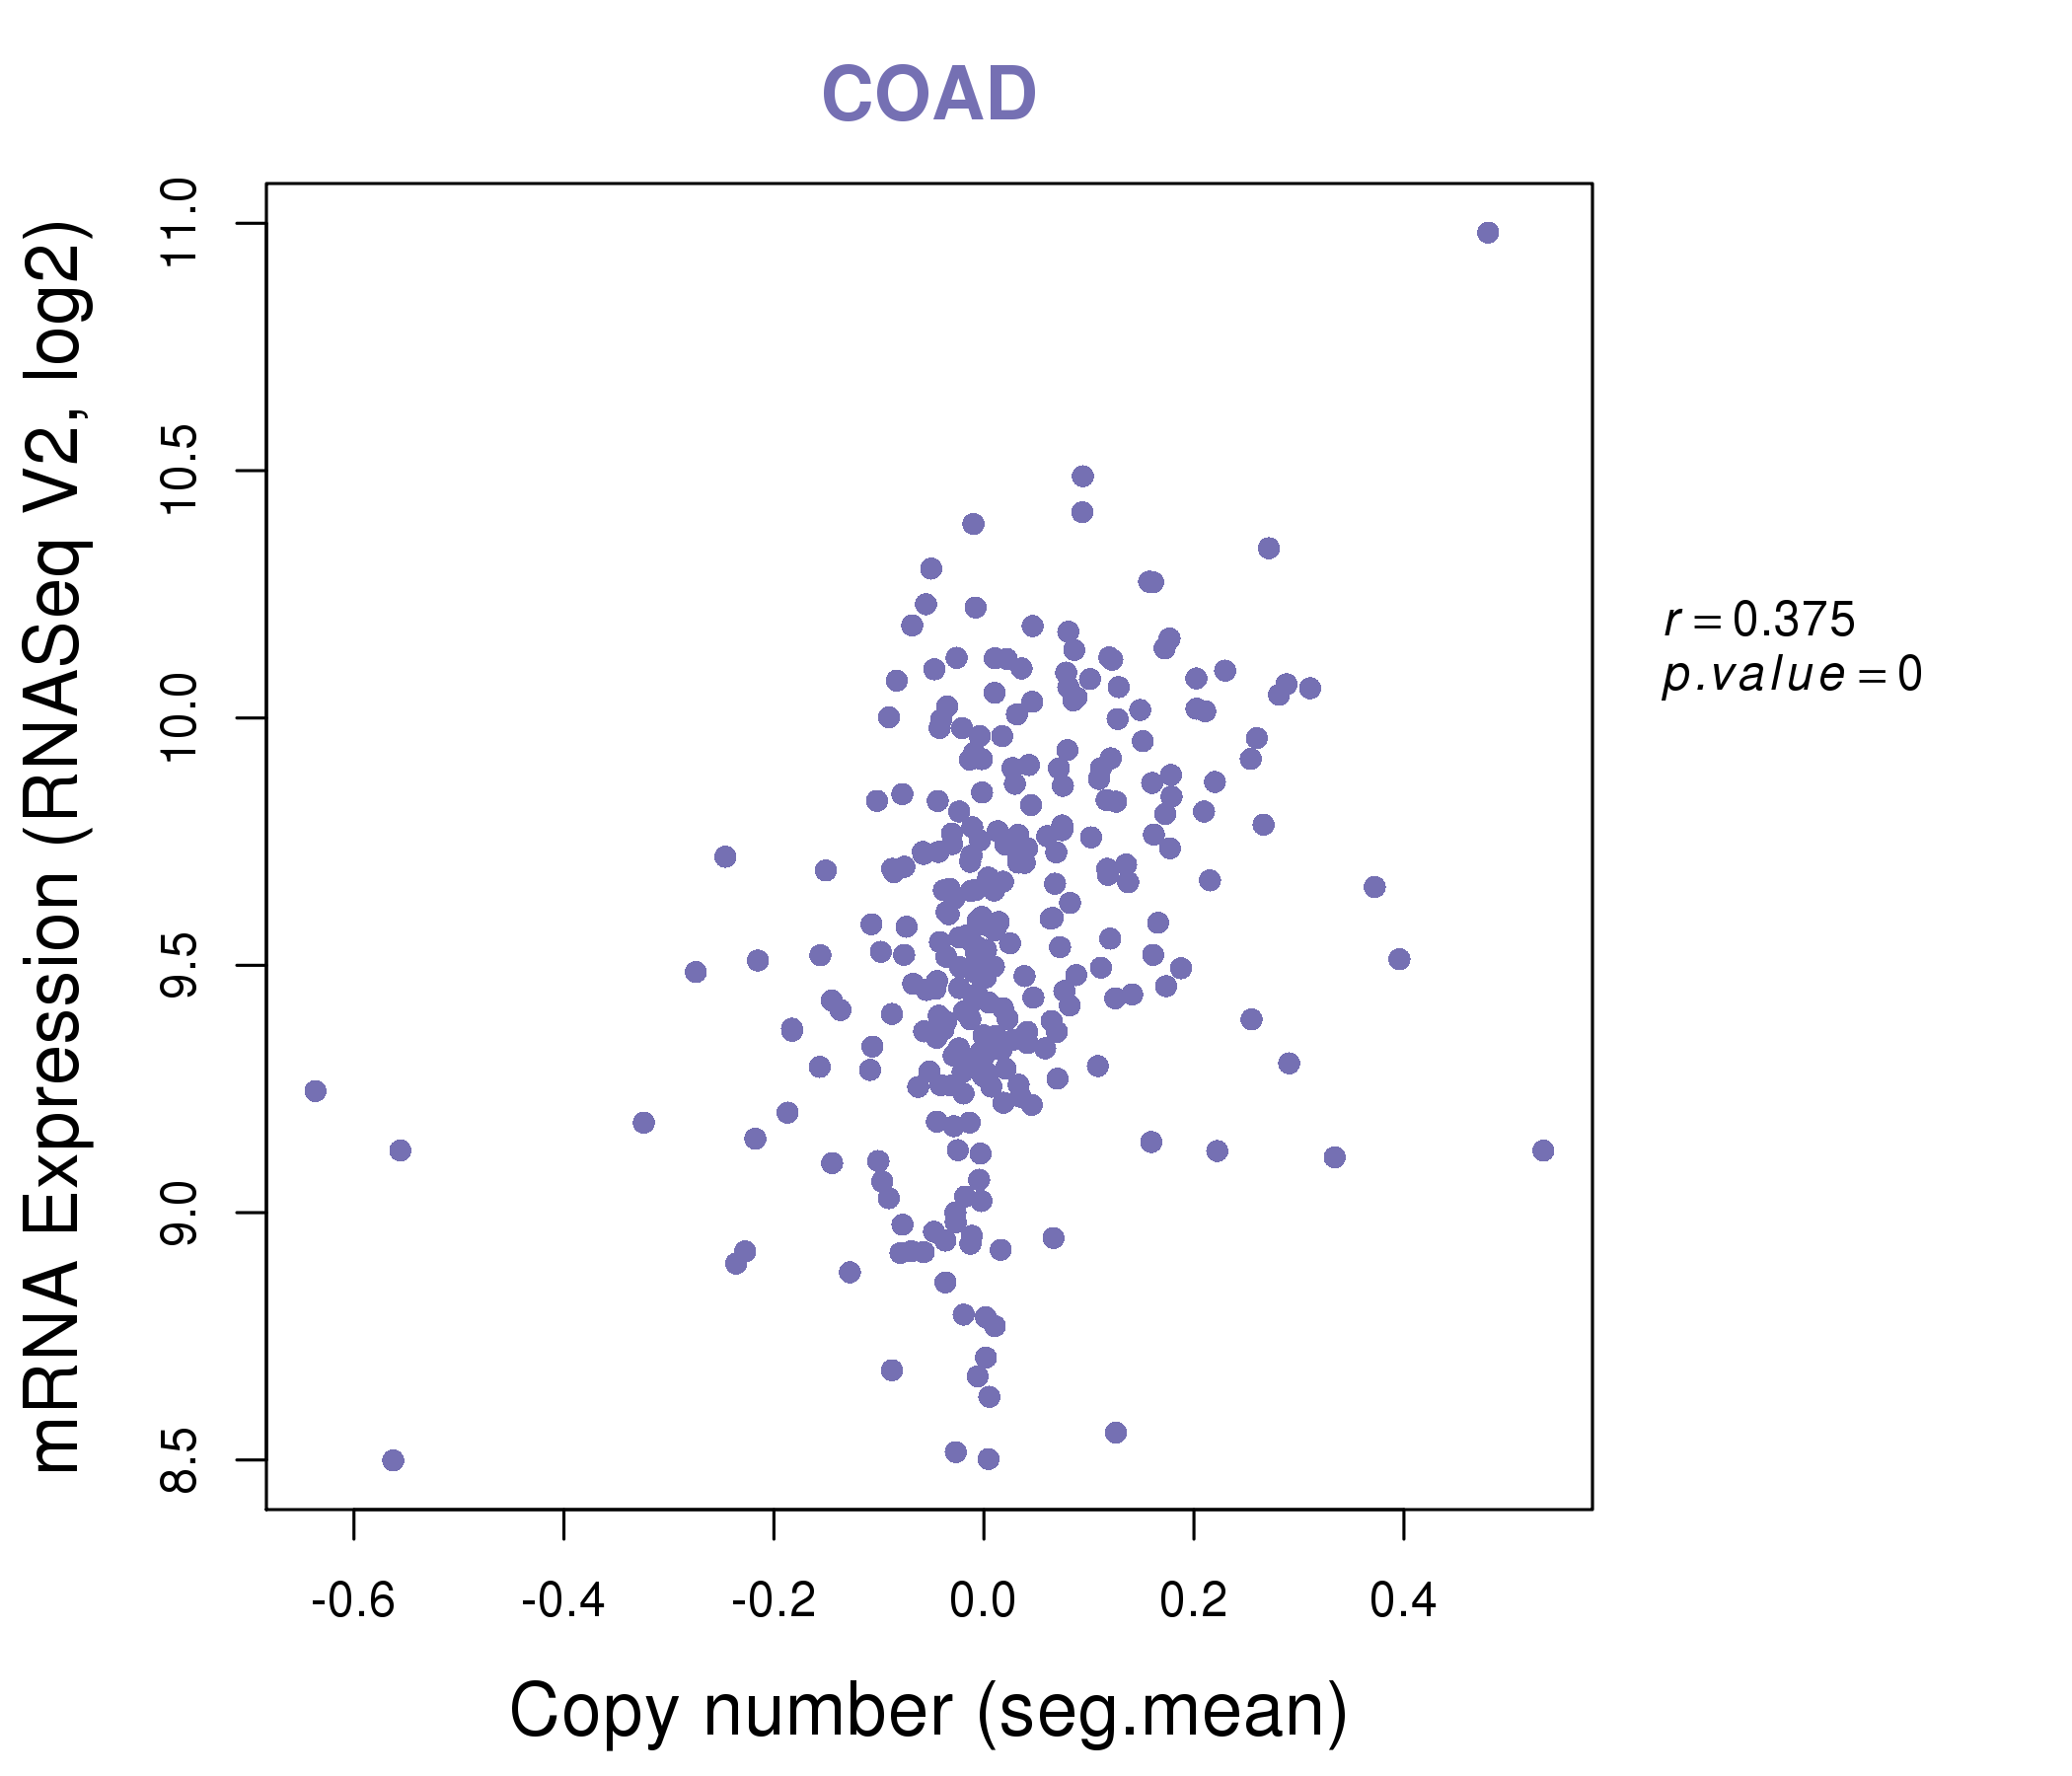
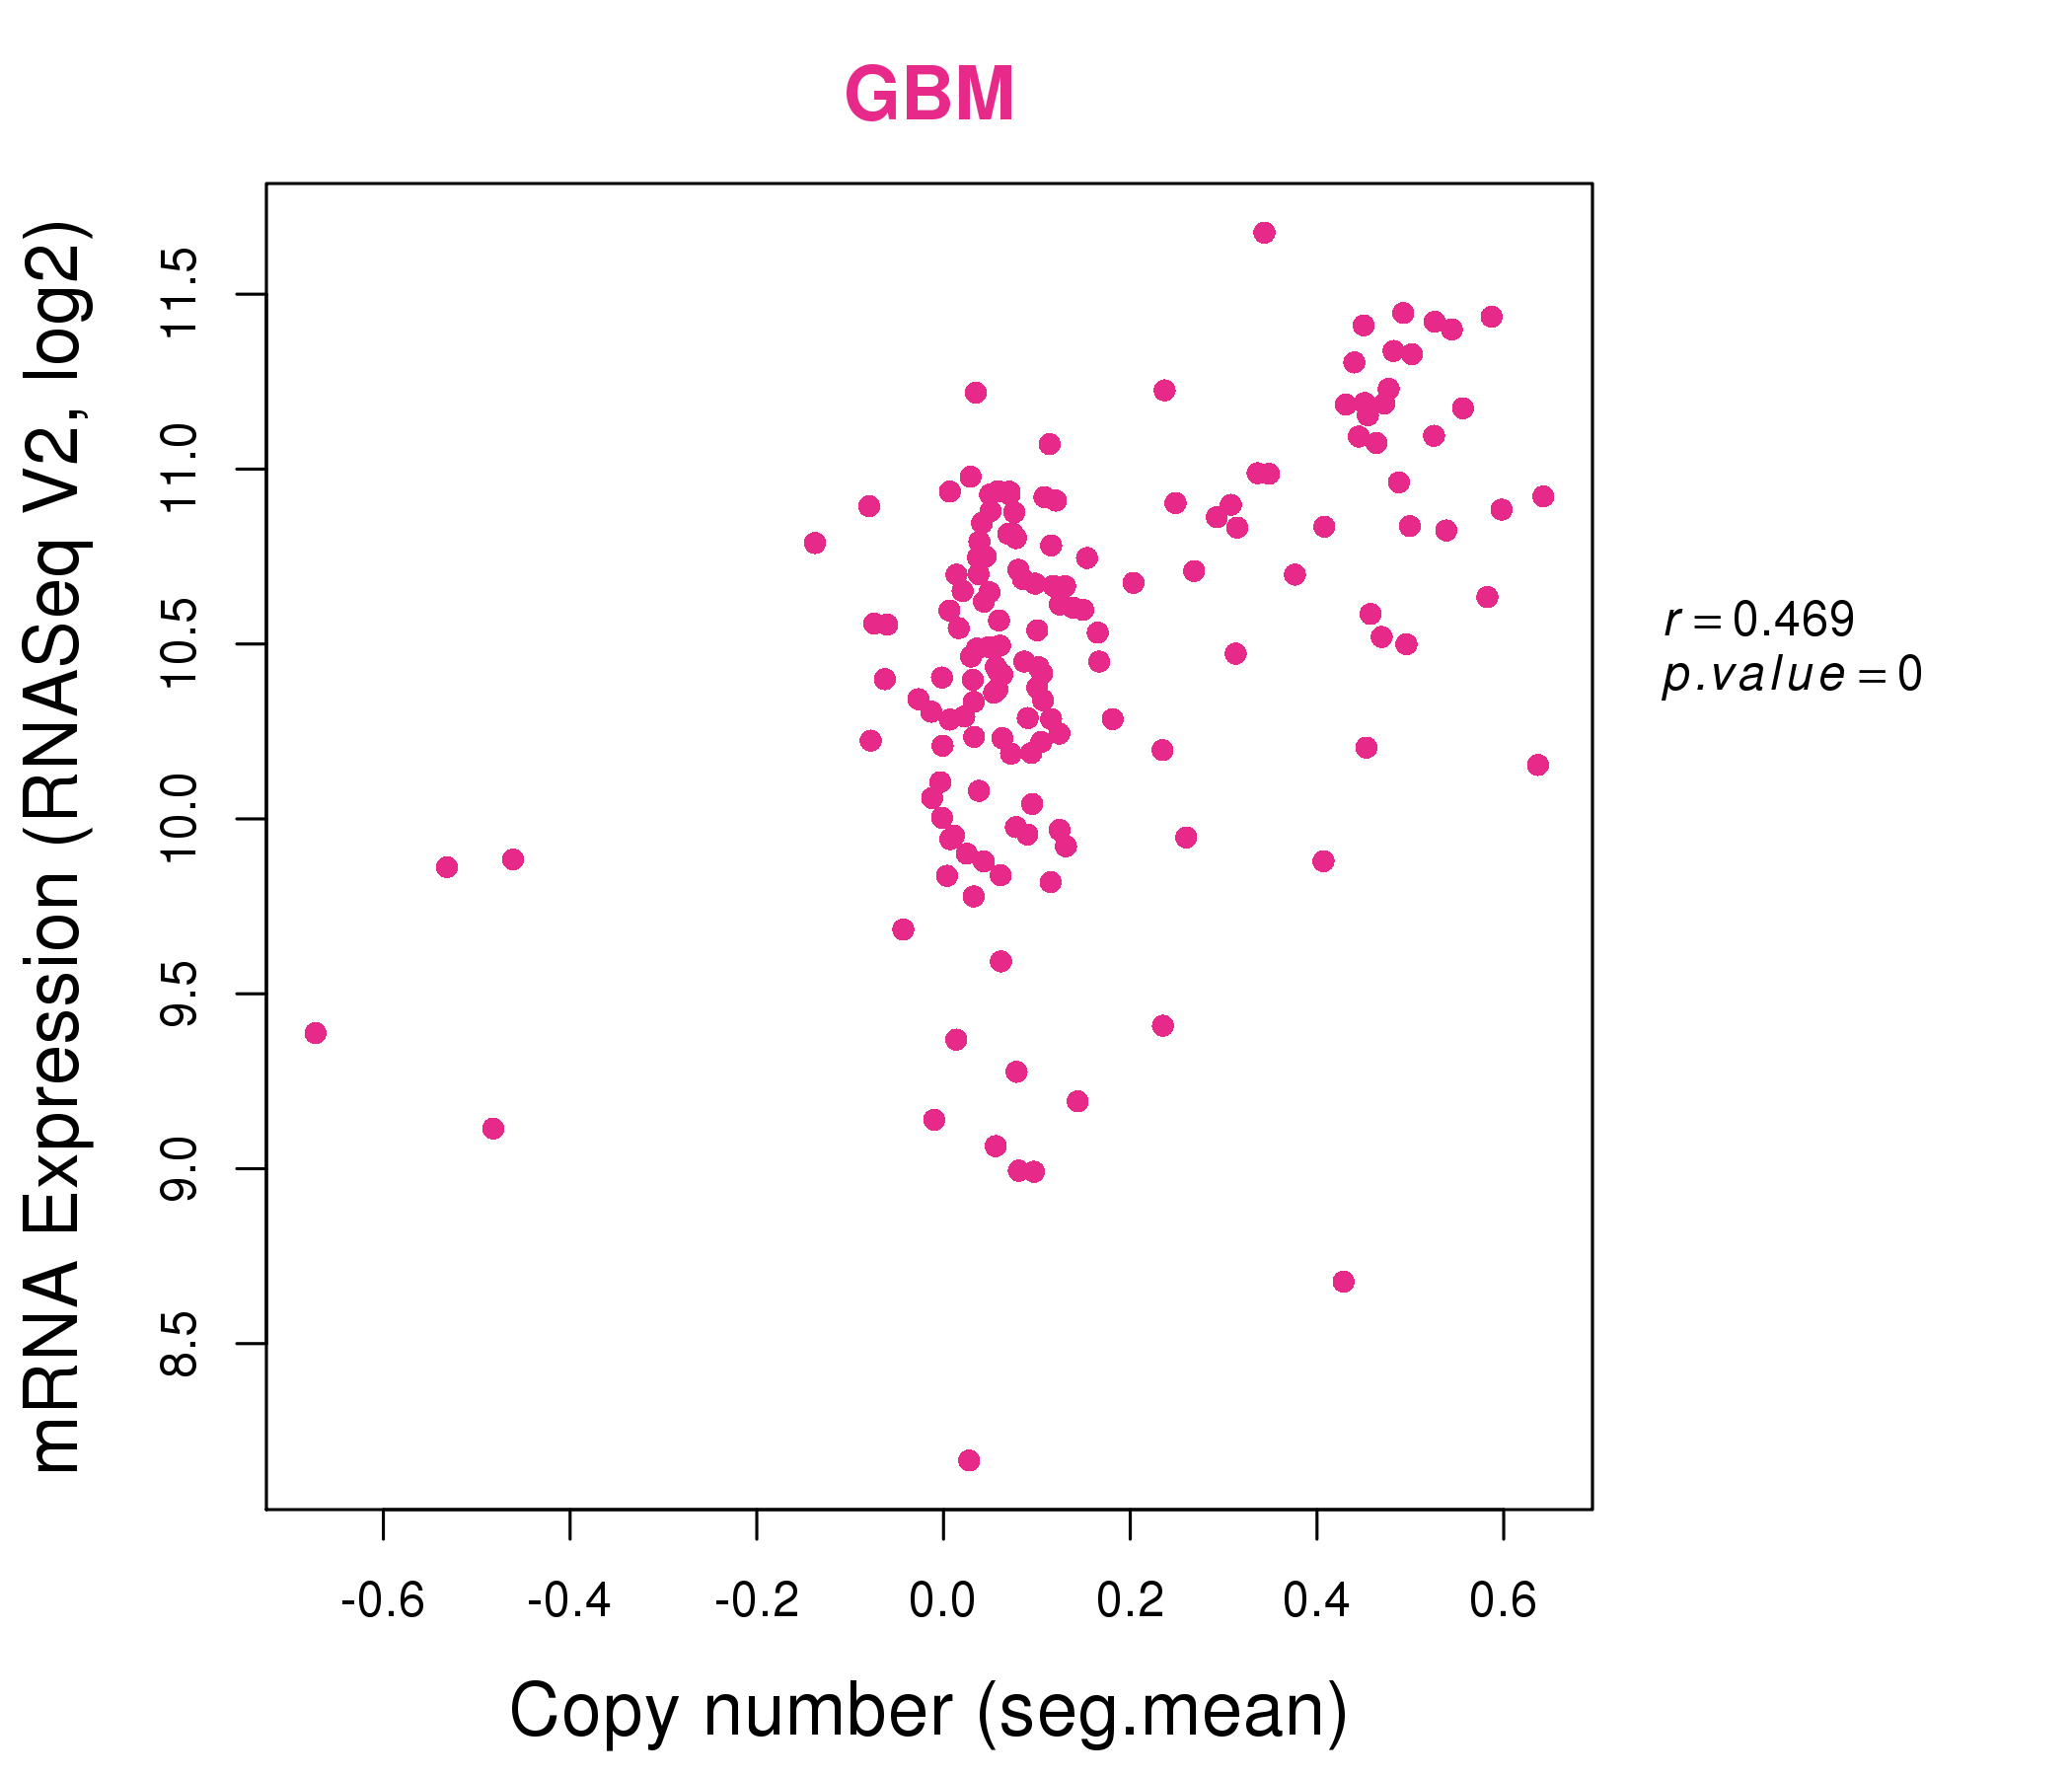
| * This plots show the correlation between CNV and gene expression. |
: Open all plots for all cancer types
 |
|
 |
|

| Top |
| Gene-Gene Network Information |
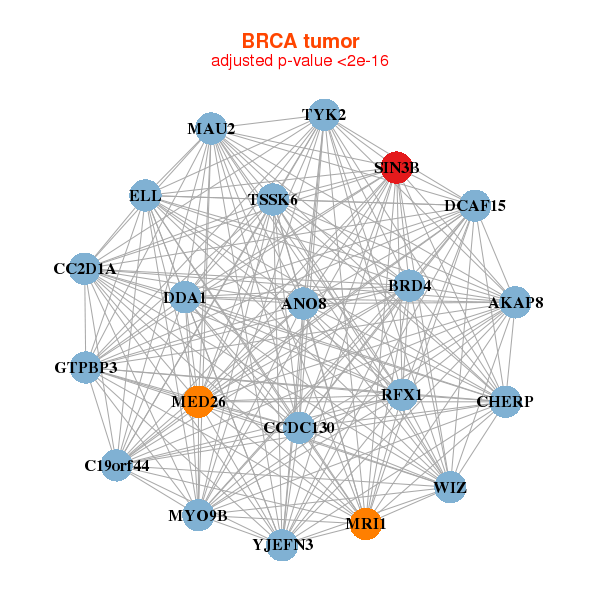
| * Co-Expression network figures were drawn using R package igraph. Only the top 20 genes with the highest correlations were shown. Red circle: input gene, orange circle: cell metabolism gene, sky circle: other gene |
: Open all plots for all cancer types
 |
|
| AKAP8,ANO8,BRD4,C19orf44,CC2D1A,CCDC130,CHERP, DCAF15,DDA1,ELL,GTPBP3,MAU2,MED26,MRI1, MYO9B,RFX1,SIN3B,TSSK6,TYK2,WIZ,YJEFN3 | ABCC10,ANKRD11,CEP164,CUL9,GIGYF1,MAU2,ZSWIM8, LENG8,MAPK8IP3,MBD1,MINK1,MYO15B,NEURL4,NISCH, PGS1,RTEL1,SIN3B,TAF1C,TUBGCP6,ZNF335,ZNF646 |
 |
|
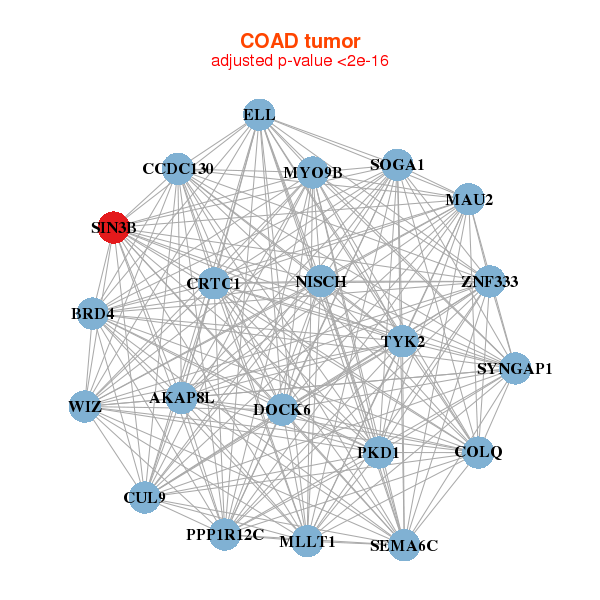
| AKAP8L,BRD4,SOGA1,CCDC130,COLQ,CRTC1,CUL9, DOCK6,ELL,MAU2,MLLT1,MYO9B,NISCH,PKD1, PPP1R12C,SEMA6C,SIN3B,SYNGAP1,TYK2,WIZ,ZNF333 | ASXL1,ATXN2,PRRC2B,CEP164,CHD6,CRAMP1L,GIGYF1, INTS3,L3MBTL1,LZTR1,NISCH,OBSCN,PPT2,SETD5, SFSWAP,SIN3B,SSH1,SYNGAP1,ZC3H7B,ZDHHC8,ZNF142 |
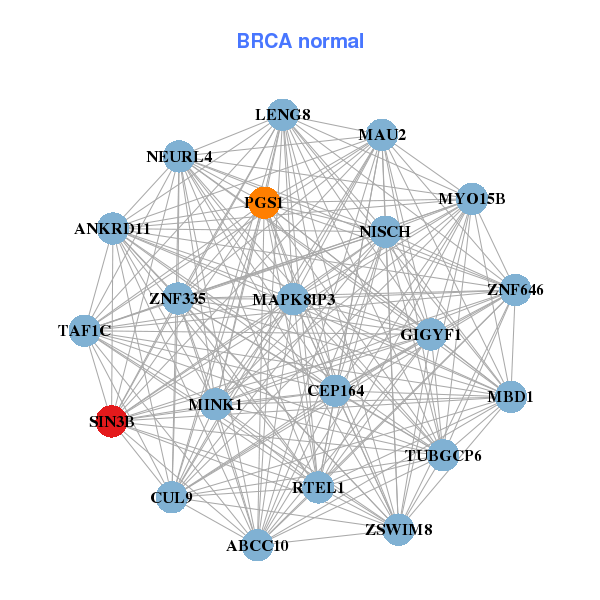
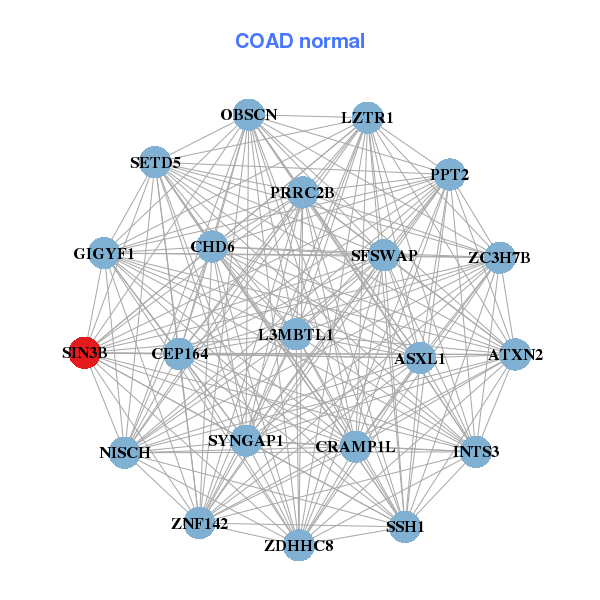
| * Co-Expression network figures were drawn using R package igraph. Only the top 20 genes with the highest correlations were shown. Red circle: input gene, orange circle: cell metabolism gene, sky circle: other gene |
: Open all plots for all cancer types
| Top |
: Open all interacting genes' information including KEGG pathway for all interacting genes from DAVID
| Top |
| Pharmacological Information for SIN3B |
| There's no related Drug. |
| Top |
| Cross referenced IDs for SIN3B |
| * We obtained these cross-references from Uniprot database. It covers 150 different DBs, 18 categories. http://www.uniprot.org/help/cross_references_section |
: Open all cross reference information
|
Copyright © 2016-Present - The Univsersity of Texas Health Science Center at Houston @ |