|
||||||||||||||||||||||||||||||||||||||||||||||||||||||||||||||||||||||||||||||||||||||||||||||||||||||||||||||||||||||||||||||||||||||||||||||||||||||||||||||||||||||||||||||||||||||||||||||||||||||||||||||||||||||||||||||||||||||||||||||||||||||||||||||||||||||||||||||||||||||||||||||||||||||||||||||||||||||||||
| |
| Phenotypic Information (metabolism pathway, cancer, disease, phenome) |
| |
| |
| Gene-Gene Network Information: Co-Expression Network, Interacting Genes & KEGG |
| |
|


| Gene Summary for AHCYL2 |
| Top |
| Phenotypic Information for AHCYL2(metabolism pathway, cancer, disease, phenome) |
| Cancer | CGAP: AHCYL2 |
| Familial Cancer Database: AHCYL2 | |
| * This gene is included in those cancer gene databases. |
|
|
|
|
|
|
| ||||||||||||||||||||||||||||||||||||||||||||||||||||||||||||||||||||||||||||||||||||||||||||||||||||||||||||||||||||||||||||||||||||||||||||||||||||||||||||||||||||||||||||||||||||||||||||||||||||||||||||||||||||||||||||||||||||||||||||||||||||||||||||||||||||||||||||||||||||||||||||||||||||||||||||||||||||
Oncogene 1 | Significant driver gene in | |||||||||||||||||||||||||||||||||||||||||||||||||||||||||||||||||||||||||||||||||||||||||||||||||||||||||||||||||||||||||||||||||||||||||||||||||||||||||||||||||||||||||||||||||||||||||||||||||||||||||||||||||||||||||||||||||||||||||||||||||||||||||||||||||||||||||||||||||||||||||||||||||||||||||||||||||||||||||
| cf) number; DB name 1 Oncogene; http://nar.oxfordjournals.org/content/35/suppl_1/D721.long, 2 Tumor Suppressor gene; https://bioinfo.uth.edu/TSGene/, 3 Cancer Gene Census; http://www.nature.com/nrc/journal/v4/n3/abs/nrc1299.html, 4 CancerGenes; http://nar.oxfordjournals.org/content/35/suppl_1/D721.long, 5 Network of Cancer Gene; http://ncg.kcl.ac.uk/index.php, 1Therapeutic Vulnerabilities in Cancer; http://cbio.mskcc.org/cancergenomics/statius/ |
| KEGG_CYSTEINE_AND_METHIONINE_METABOLISM KEGG_SELENOAMINO_ACID_METABOLISM | |
| OMIM | |
| Orphanet | |
| Disease | KEGG Disease: AHCYL2 |
| MedGen: AHCYL2 (Human Medical Genetics with Condition) | |
| ClinVar: AHCYL2 | |
| Phenotype | MGI: AHCYL2 (International Mouse Phenotyping Consortium) |
| PhenomicDB: AHCYL2 | |
| Mutations for AHCYL2 |
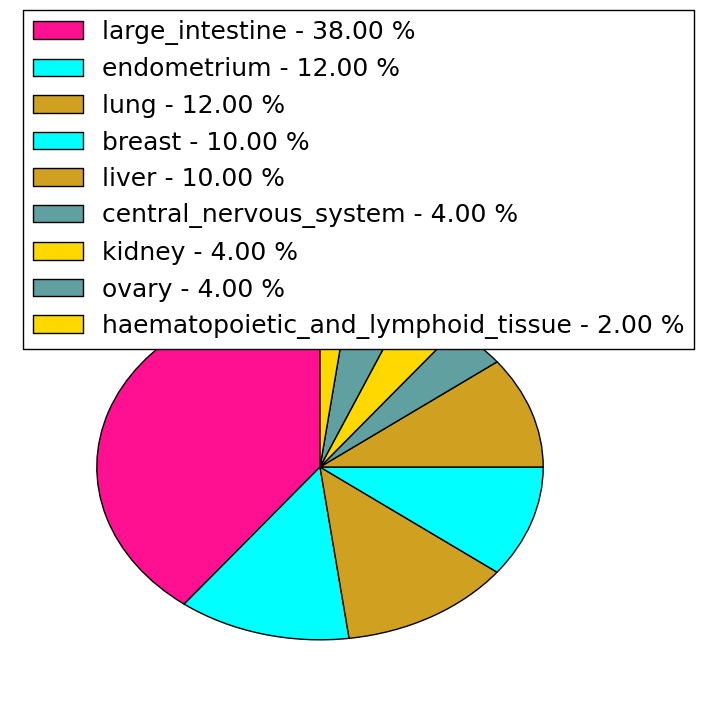
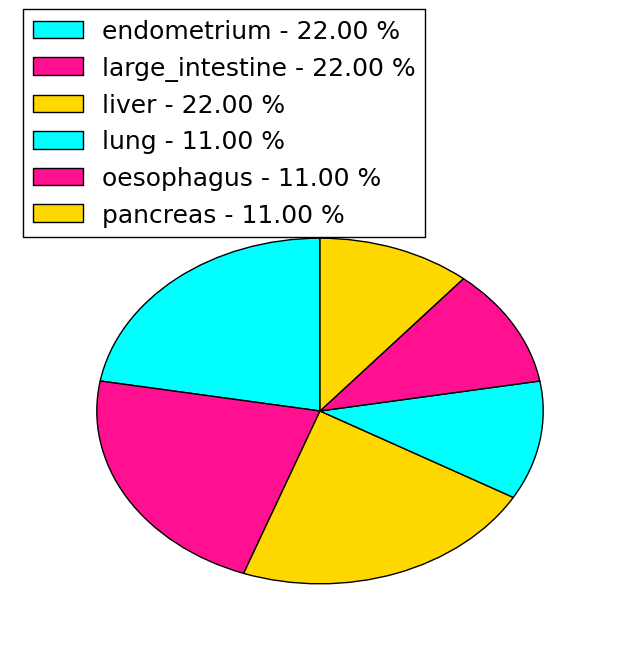
| * Under tables are showing count per each tissue to give us broad intuition about tissue specific mutation patterns.You can go to the detailed page for each mutation database's web site. |
| - Statistics for Tissue and Mutation type | Top |
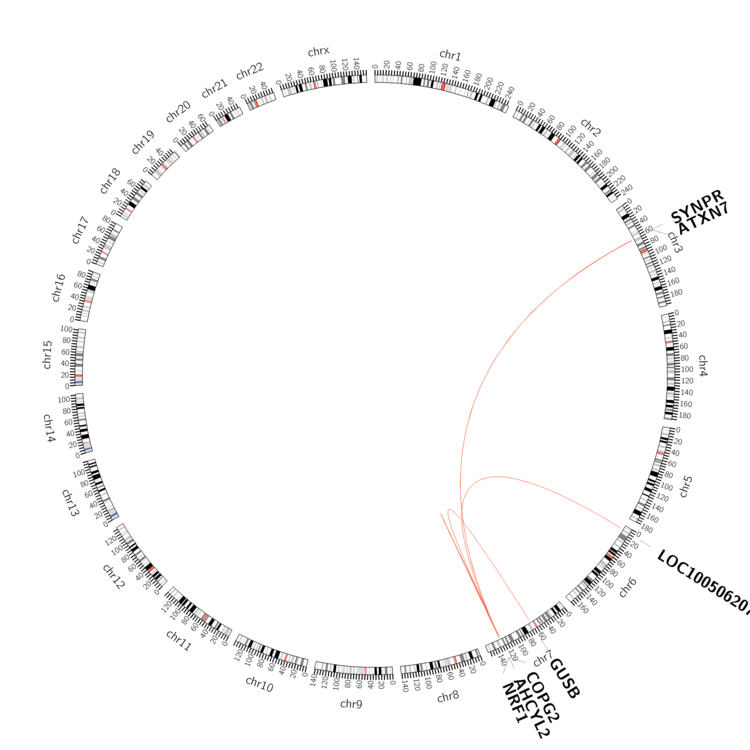 |
| - For Inter-chromosomal Variations |
| * Inter-chromosomal variantions includes 'interchromosomal amplicon to amplicon', 'interchromosomal amplicon to non-amplified dna', 'interchromosomal insertion', 'Interchromosomal unknown type'. |
 |
| - For Intra-chromosomal Variations |
| * Intra-chromosomal variantions includes 'intrachromosomal amplicon to amplicon', 'intrachromosomal amplicon to non-amplified dna', 'intrachromosomal deletion', 'intrachromosomal fold-back inversion', 'intrachromosomal inversion', 'intrachromosomal tandem duplication', 'Intrachromosomal unknown type', 'intrachromosomal with inverted orientation', 'intrachromosomal with non-inverted orientation'. |
 |
| Sample | Symbol_a | Chr_a | Start_a | End_a | Symbol_b | Chr_b | Start_b | End_b |
| breast | AHCYL2 | chr7 | 128948688 | 128949088 | COPG2 | chr7 | 130313409 | 130313809 |
| ovary | AHCYL2 | chr7 | 128954104 | 128954124 | GUSB | chr7 | 65439892 | 65439912 |
| prostate | AHCYL2 | chr7 | 128955544 | 128955544 | NRF1 | chr7 | 129381847 | 129381847 |
| prostate | AHCYL2 | chr7 | 128984258 | 128984258 | chr7 | 129401205 | 129401205 | |
| prostate | AHCYL2 | chr7 | 128986933 | 128986933 | chr7 | 129407220 | 129407220 |
| cf) Tissue number; Tissue name (1;Breast, 2;Central_nervous_system, 3;Haematopoietic_and_lymphoid_tissue, 4;Large_intestine, 5;Liver, 6;Lung, 7;Ovary, 8;Pancreas, 9;Prostate, 10;Skin, 11;Soft_tissue, 12;Upper_aerodigestive_tract) |
| * From mRNA Sanger sequences, Chitars2.0 arranged chimeric transcripts. This table shows AHCYL2 related fusion information. |
| ID | Head Gene | Tail Gene | Accession | Gene_a | qStart_a | qEnd_a | Chromosome_a | tStart_a | tEnd_a | Gene_a | qStart_a | qEnd_a | Chromosome_a | tStart_a | tEnd_a |
| DA731128 | AHCYL2 | 1 | 112 | 7 | 129050161 | 129050272 | YME1L1 | 111 | 758 | 10 | 27412476 | 27425291 | |
| AK309708 | AHCYL2 | 1 | 112 | 7 | 129050161 | 129050272 | YME1L1 | 111 | 1064 | 10 | 27409367 | 27425291 | |
| AW793520 | AHCYL2 | 66 | 394 | 7 | 128908993 | 128909673 | PTGES3 | 377 | 437 | 12 | 57066563 | 57066765 | |
| AW947006 | CD244 | 91 | 112 | 1 | 160810804 | 160810825 | AHCYL2 | 102 | 245 | 7 | 129069472 | 129069615 | |
| DB138706 | CELF2 | 1 | 292 | 10 | 11207447 | 11259477 | AHCYL2 | 285 | 570 | 7 | 129062680 | 129066320 | |
| BE070114 | AHCYL2 | 99 | 393 | 7 | 128909372 | 128909673 | PTGES3 | 376 | 436 | 12 | 57066563 | 57066765 | |
| Top |
| Mutation type/ Tissue ID | brca | cns | cerv | endome | haematopo | kidn | Lintest | liver | lung | ns | ovary | pancre | prost | skin | stoma | thyro | urina | |||
| Total # sample | 1 | 1 | 1 | |||||||||||||||||
| GAIN (# sample) | 1 | 1 | 1 | |||||||||||||||||
| LOSS (# sample) |
| cf) Tissue ID; Tissue type (1; Breast, 2; Central_nervous_system, 3; Cervix, 4; Endometrium, 5; Haematopoietic_and_lymphoid_tissue, 6; Kidney, 7; Large_intestine, 8; Liver, 9; Lung, 10; NS, 11; Ovary, 12; Pancreas, 13; Prostate, 14; Skin, 15; Stomach, 16; Thyroid, 17; Urinary_tract) |
| Top |
|
 |
| Top |
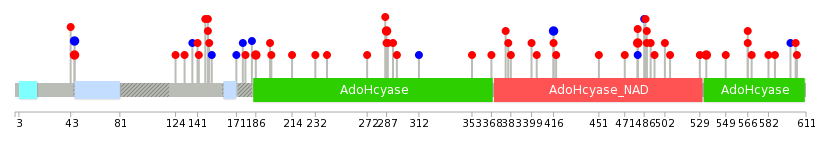
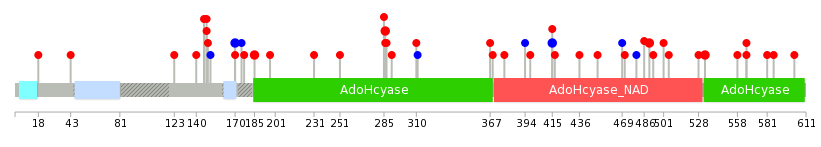
| Stat. for Non-Synonymous SNVs (# total SNVs=47) | (# total SNVs=9) |
 |  |
(# total SNVs=0) | (# total SNVs=0) |
| Top |
| * When you move the cursor on each content, you can see more deailed mutation information on the Tooltip. Those are primary_site,primary_histology,mutation(aa),pubmedID. |
| GRCh37 position | Mutation(aa) | Unique sampleID count |
| chr7:129053510-129053510 | p.S481Y | 3 |
| chr7:129019506-129019506 | p.E131* | 2 |
| chr7:129064755-129064755 | p.F534C | 2 |
| chr7:129028979-129028979 | p.F186L | 2 |
| chr7:129040167-129040167 | p.D287G | 2 |
| chr7:129064971-129064971 | p.P566L | 2 |
| chr7:129062682-129062682 | p.A488E | 2 |
| chr7:129019563-129019563 | p.Q150K | 2 |
| chr7:129046260-129046260 | p.S416S | 2 |
| chr7:128865054-128865054 | p.G46D | 2 |
| Top |
|
 |
| Point Mutation/ Tissue ID | 1 | 2 | 3 | 4 | 5 | 6 | 7 | 8 | 9 | 10 | 11 | 12 | 13 | 14 | 15 | 16 | 17 | 18 | 19 | 20 |
| # sample | 2 | 1 | 1 | 13 | 2 | 4 | 1 | 2 | 6 | 1 | 1 | 10 | 3 | 7 | ||||||
| # mutation | 2 | 1 | 1 | 13 | 2 | 4 | 1 | 2 | 6 | 1 | 1 | 9 | 3 | 7 | ||||||
| nonsynonymous SNV | 2 | 1 | 11 | 2 | 4 | 1 | 2 | 4 | 1 | 1 | 7 | 3 | 6 | |||||||
| synonymous SNV | 1 | 2 | 2 | 2 | 1 |
| cf) Tissue ID; Tissue type (1; BLCA[Bladder Urothelial Carcinoma], 2; BRCA[Breast invasive carcinoma], 3; CESC[Cervical squamous cell carcinoma and endocervical adenocarcinoma], 4; COAD[Colon adenocarcinoma], 5; GBM[Glioblastoma multiforme], 6; Glioma Low Grade, 7; HNSC[Head and Neck squamous cell carcinoma], 8; KICH[Kidney Chromophobe], 9; KIRC[Kidney renal clear cell carcinoma], 10; KIRP[Kidney renal papillary cell carcinoma], 11; LAML[Acute Myeloid Leukemia], 12; LUAD[Lung adenocarcinoma], 13; LUSC[Lung squamous cell carcinoma], 14; OV[Ovarian serous cystadenocarcinoma ], 15; PAAD[Pancreatic adenocarcinoma], 16; PRAD[Prostate adenocarcinoma], 17; SKCM[Skin Cutaneous Melanoma], 18:STAD[Stomach adenocarcinoma], 19:THCA[Thyroid carcinoma], 20:UCEC[Uterine Corpus Endometrial Carcinoma]) |
| Top |
| * We represented just top 10 SNVs. When you move the cursor on each content, you can see more deailed mutation information on the Tooltip. Those are primary_site, primary_histology, mutation(aa), pubmedID. |
| Genomic Position | Mutation(aa) | Unique sampleID count |
| chr7:129062691 | p.R490L,AHCYL2 | 2 |
| chr7:129040167 | p.S170S,AHCYL2 | 2 |
| chr7:129046260 | p.F533C,AHCYL2 | 2 |
| chr7:129028934 | p.F185L,AHCYL2 | 2 |
| chr7:129064755 | p.P565H,AHCYL2 | 2 |
| chr7:129028979 | p.S415S,AHCYL2 | 2 |
| chr7:129064971 | p.D286G,AHCYL2 | 2 |
| chr7:129029014 | p.S148Y,AHCYL2 | 1 |
| chr7:129066319 | p.G310A,AHCYL2 | 1 |
| chr7:129045020 | p.Q149K,AHCYL2 | 1 |
| * Copy number data were extracted from TCGA using R package TCGA-Assembler. The URLs of all public data files on TCGA DCC data server were gathered on Jan-05-2015. Function ProcessCNAData in TCGA-Assembler package was used to obtain gene-level copy number value which is calculated as the average copy number of the genomic region of a gene. |
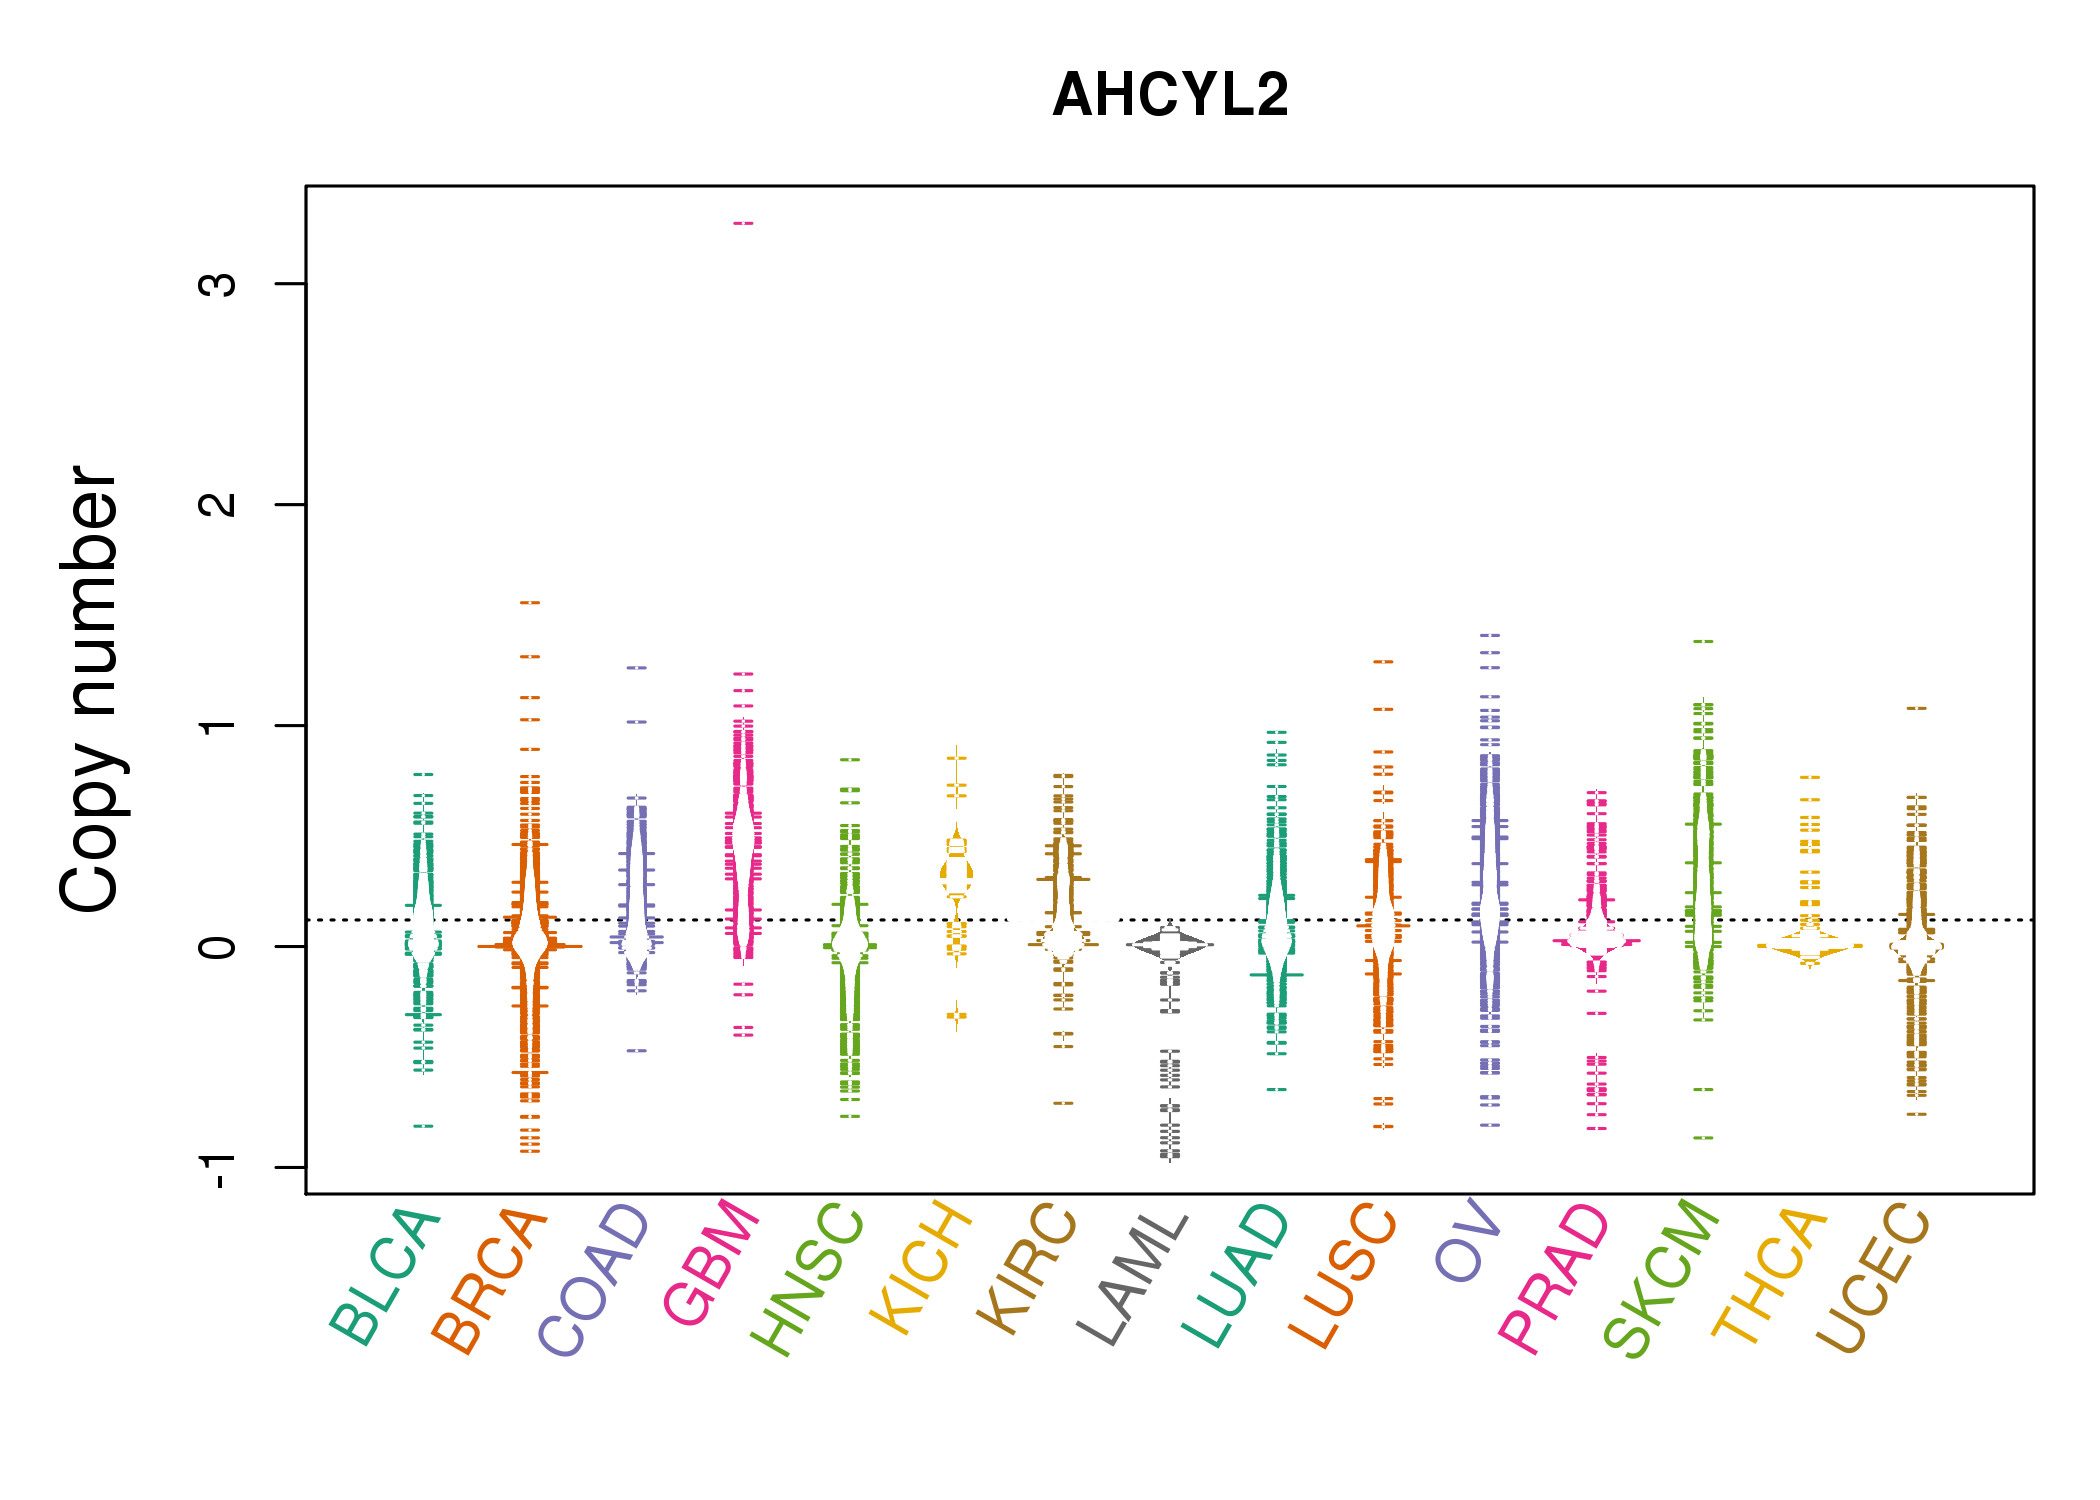 |
| cf) Tissue ID[Tissue type]: BLCA[Bladder Urothelial Carcinoma], BRCA[Breast invasive carcinoma], CESC[Cervical squamous cell carcinoma and endocervical adenocarcinoma], COAD[Colon adenocarcinoma], GBM[Glioblastoma multiforme], Glioma Low Grade, HNSC[Head and Neck squamous cell carcinoma], KICH[Kidney Chromophobe], KIRC[Kidney renal clear cell carcinoma], KIRP[Kidney renal papillary cell carcinoma], LAML[Acute Myeloid Leukemia], LUAD[Lung adenocarcinoma], LUSC[Lung squamous cell carcinoma], OV[Ovarian serous cystadenocarcinoma ], PAAD[Pancreatic adenocarcinoma], PRAD[Prostate adenocarcinoma], SKCM[Skin Cutaneous Melanoma], STAD[Stomach adenocarcinoma], THCA[Thyroid carcinoma], UCEC[Uterine Corpus Endometrial Carcinoma] |
| Top |
| Gene Expression for AHCYL2 |
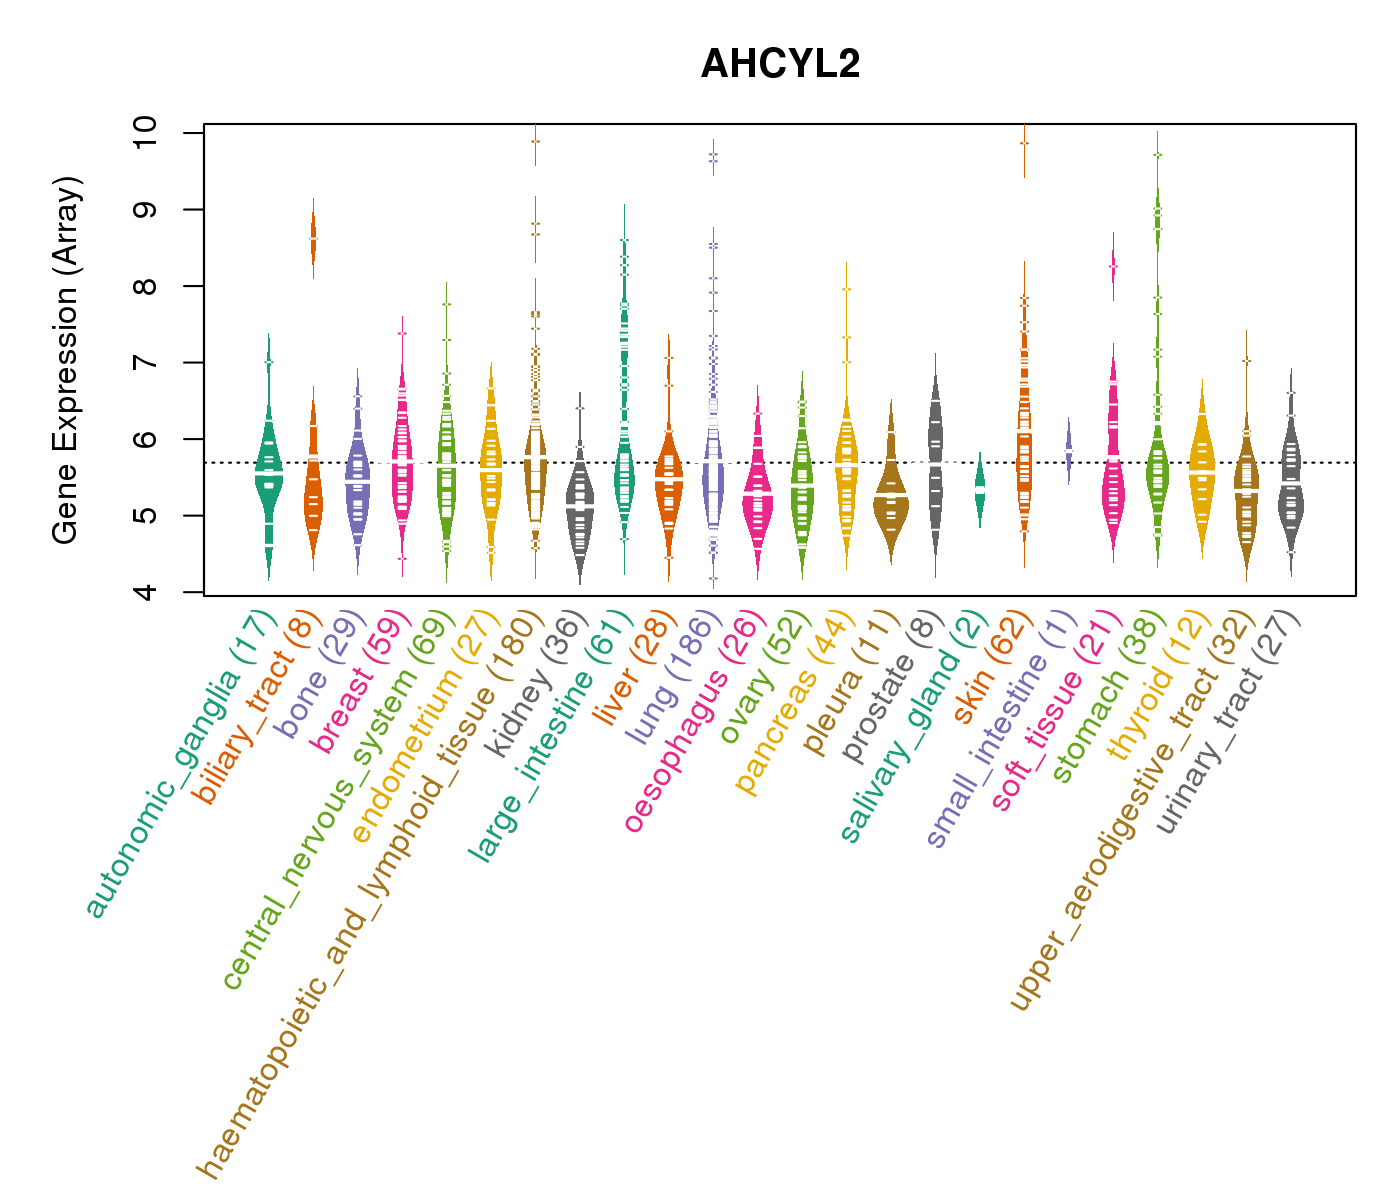
| * CCLE gene expression data were extracted from CCLE_Expression_Entrez_2012-10-18.res: Gene-centric RMA-normalized mRNA expression data. |
 |
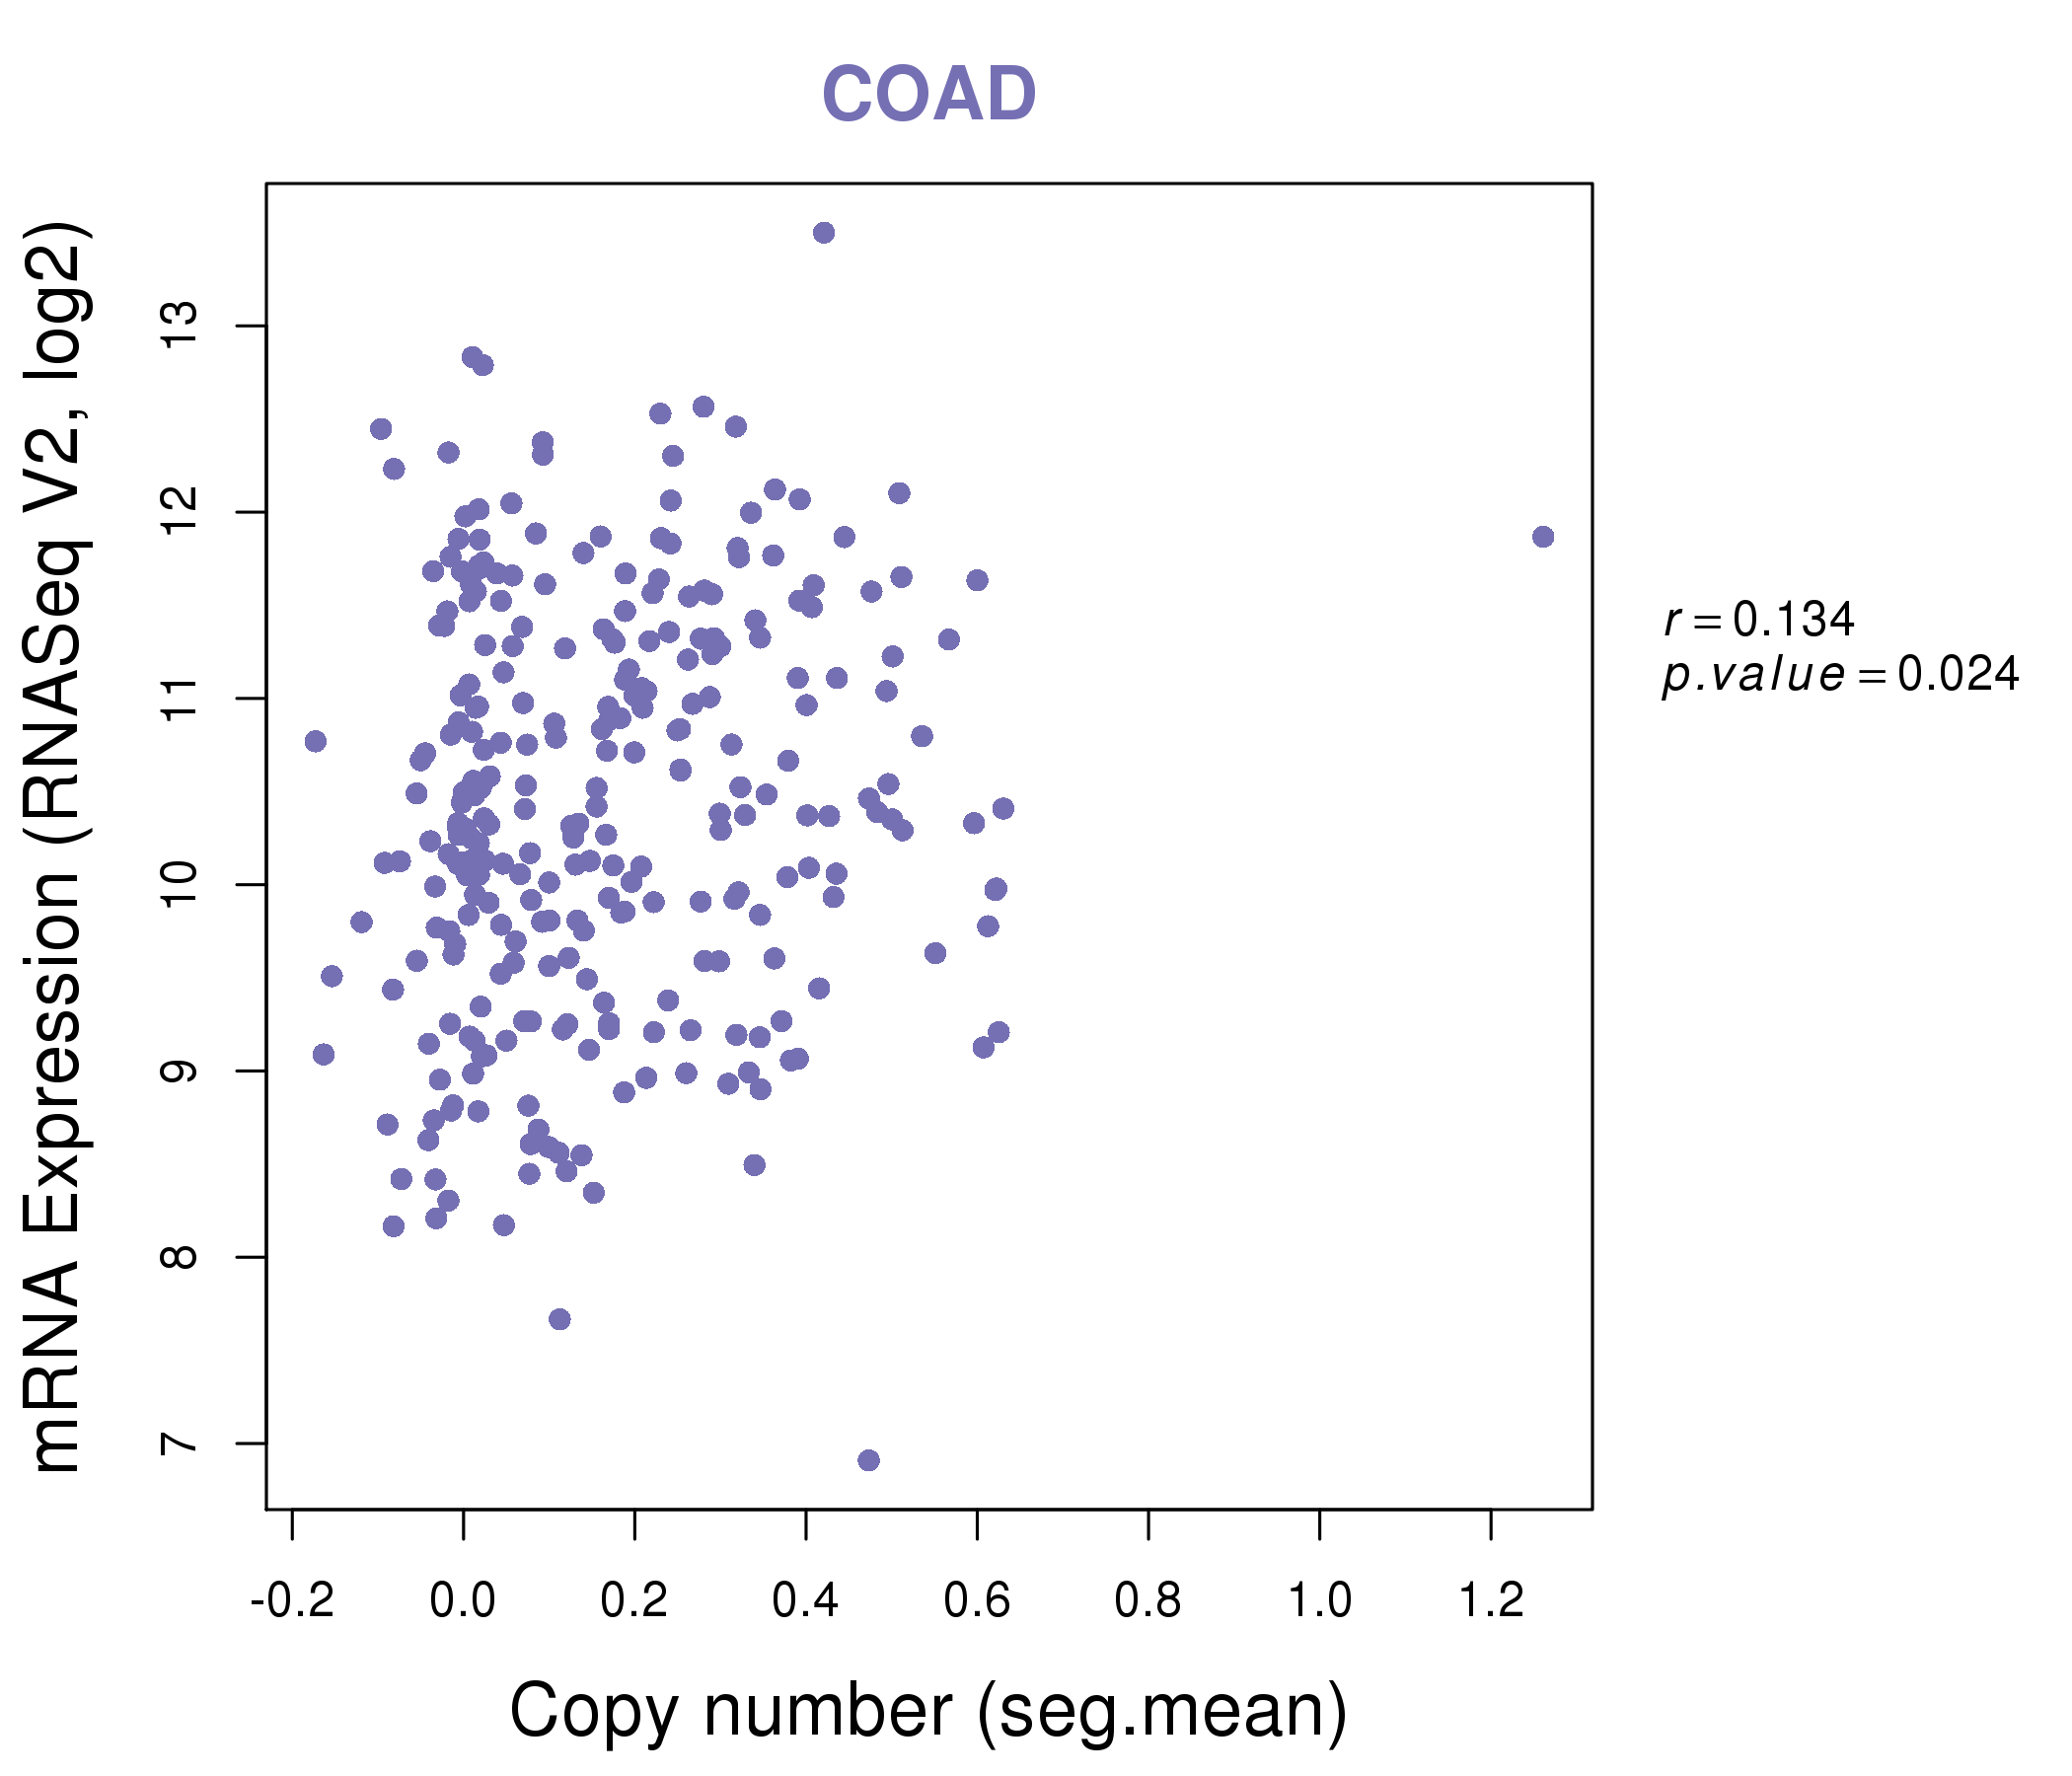
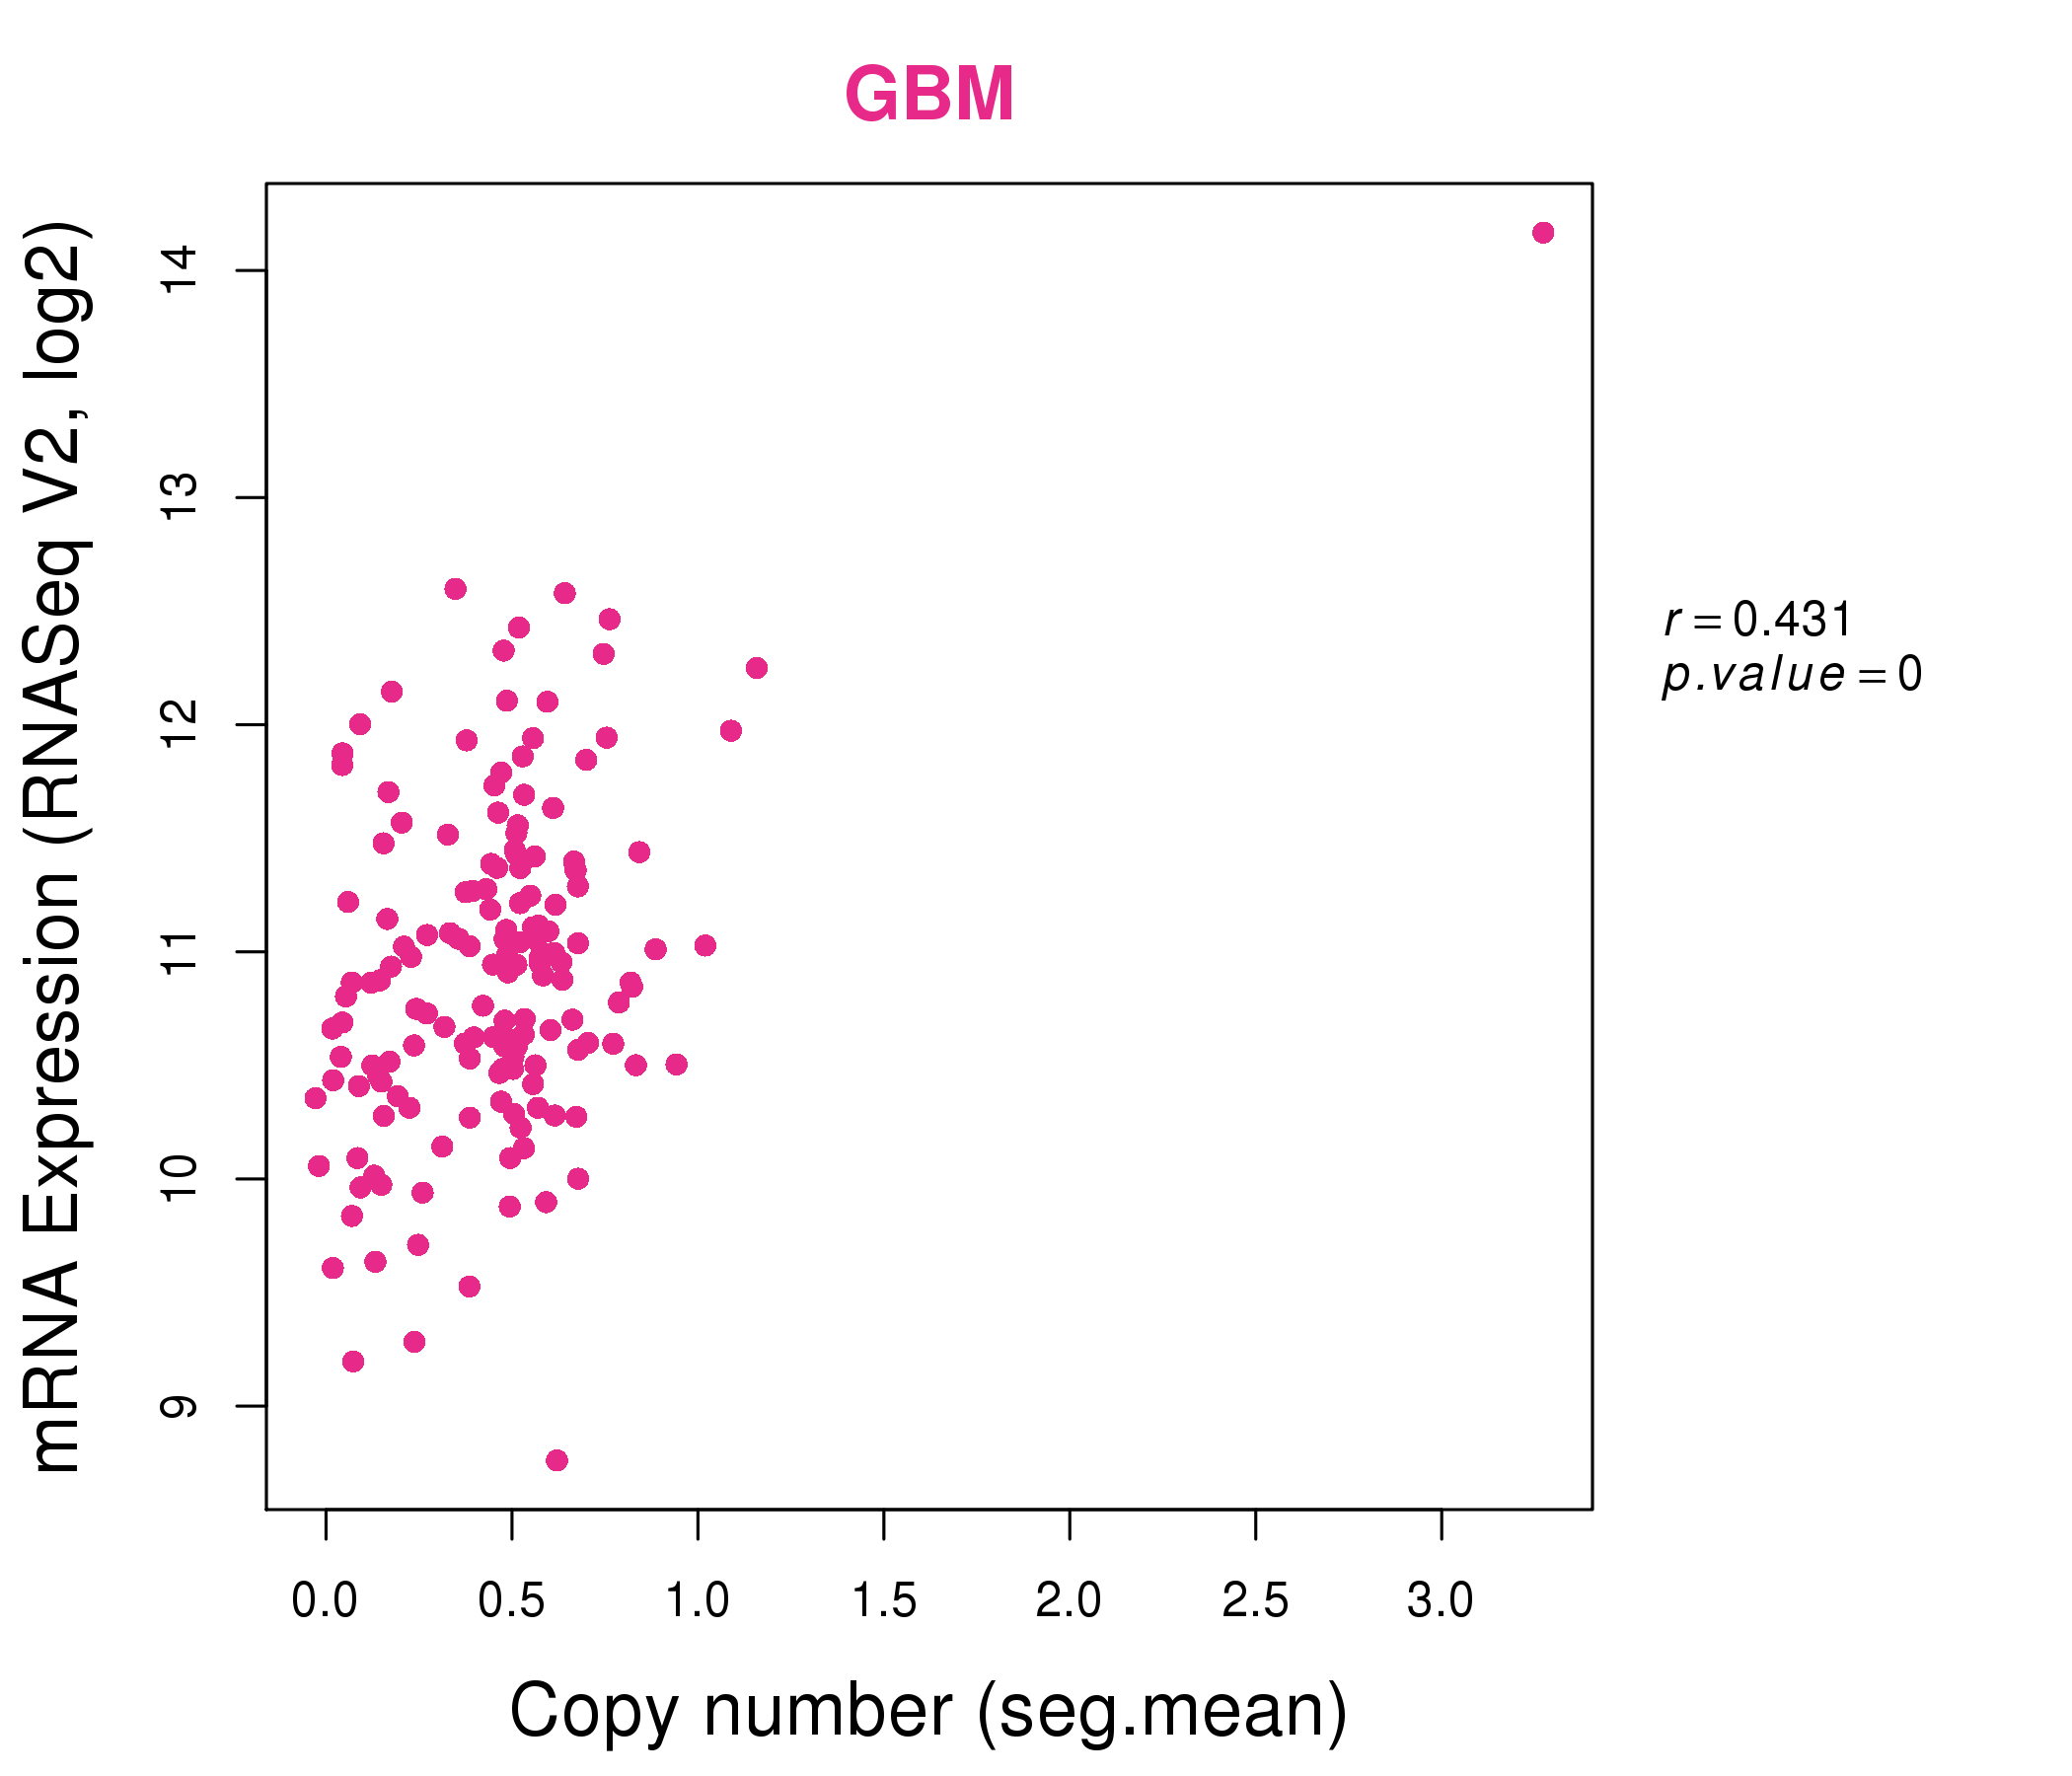
| * Normalized gene expression data of RNASeqV2 was extracted from TCGA using R package TCGA-Assembler. The URLs of all public data files on TCGA DCC data server were gathered at Jan-05-2015. Only eight cancer types have enough normal control samples for differential expression analysis. (t test, adjusted p<0.05 (using Benjamini-Hochberg FDR)) |
 |
| Top |
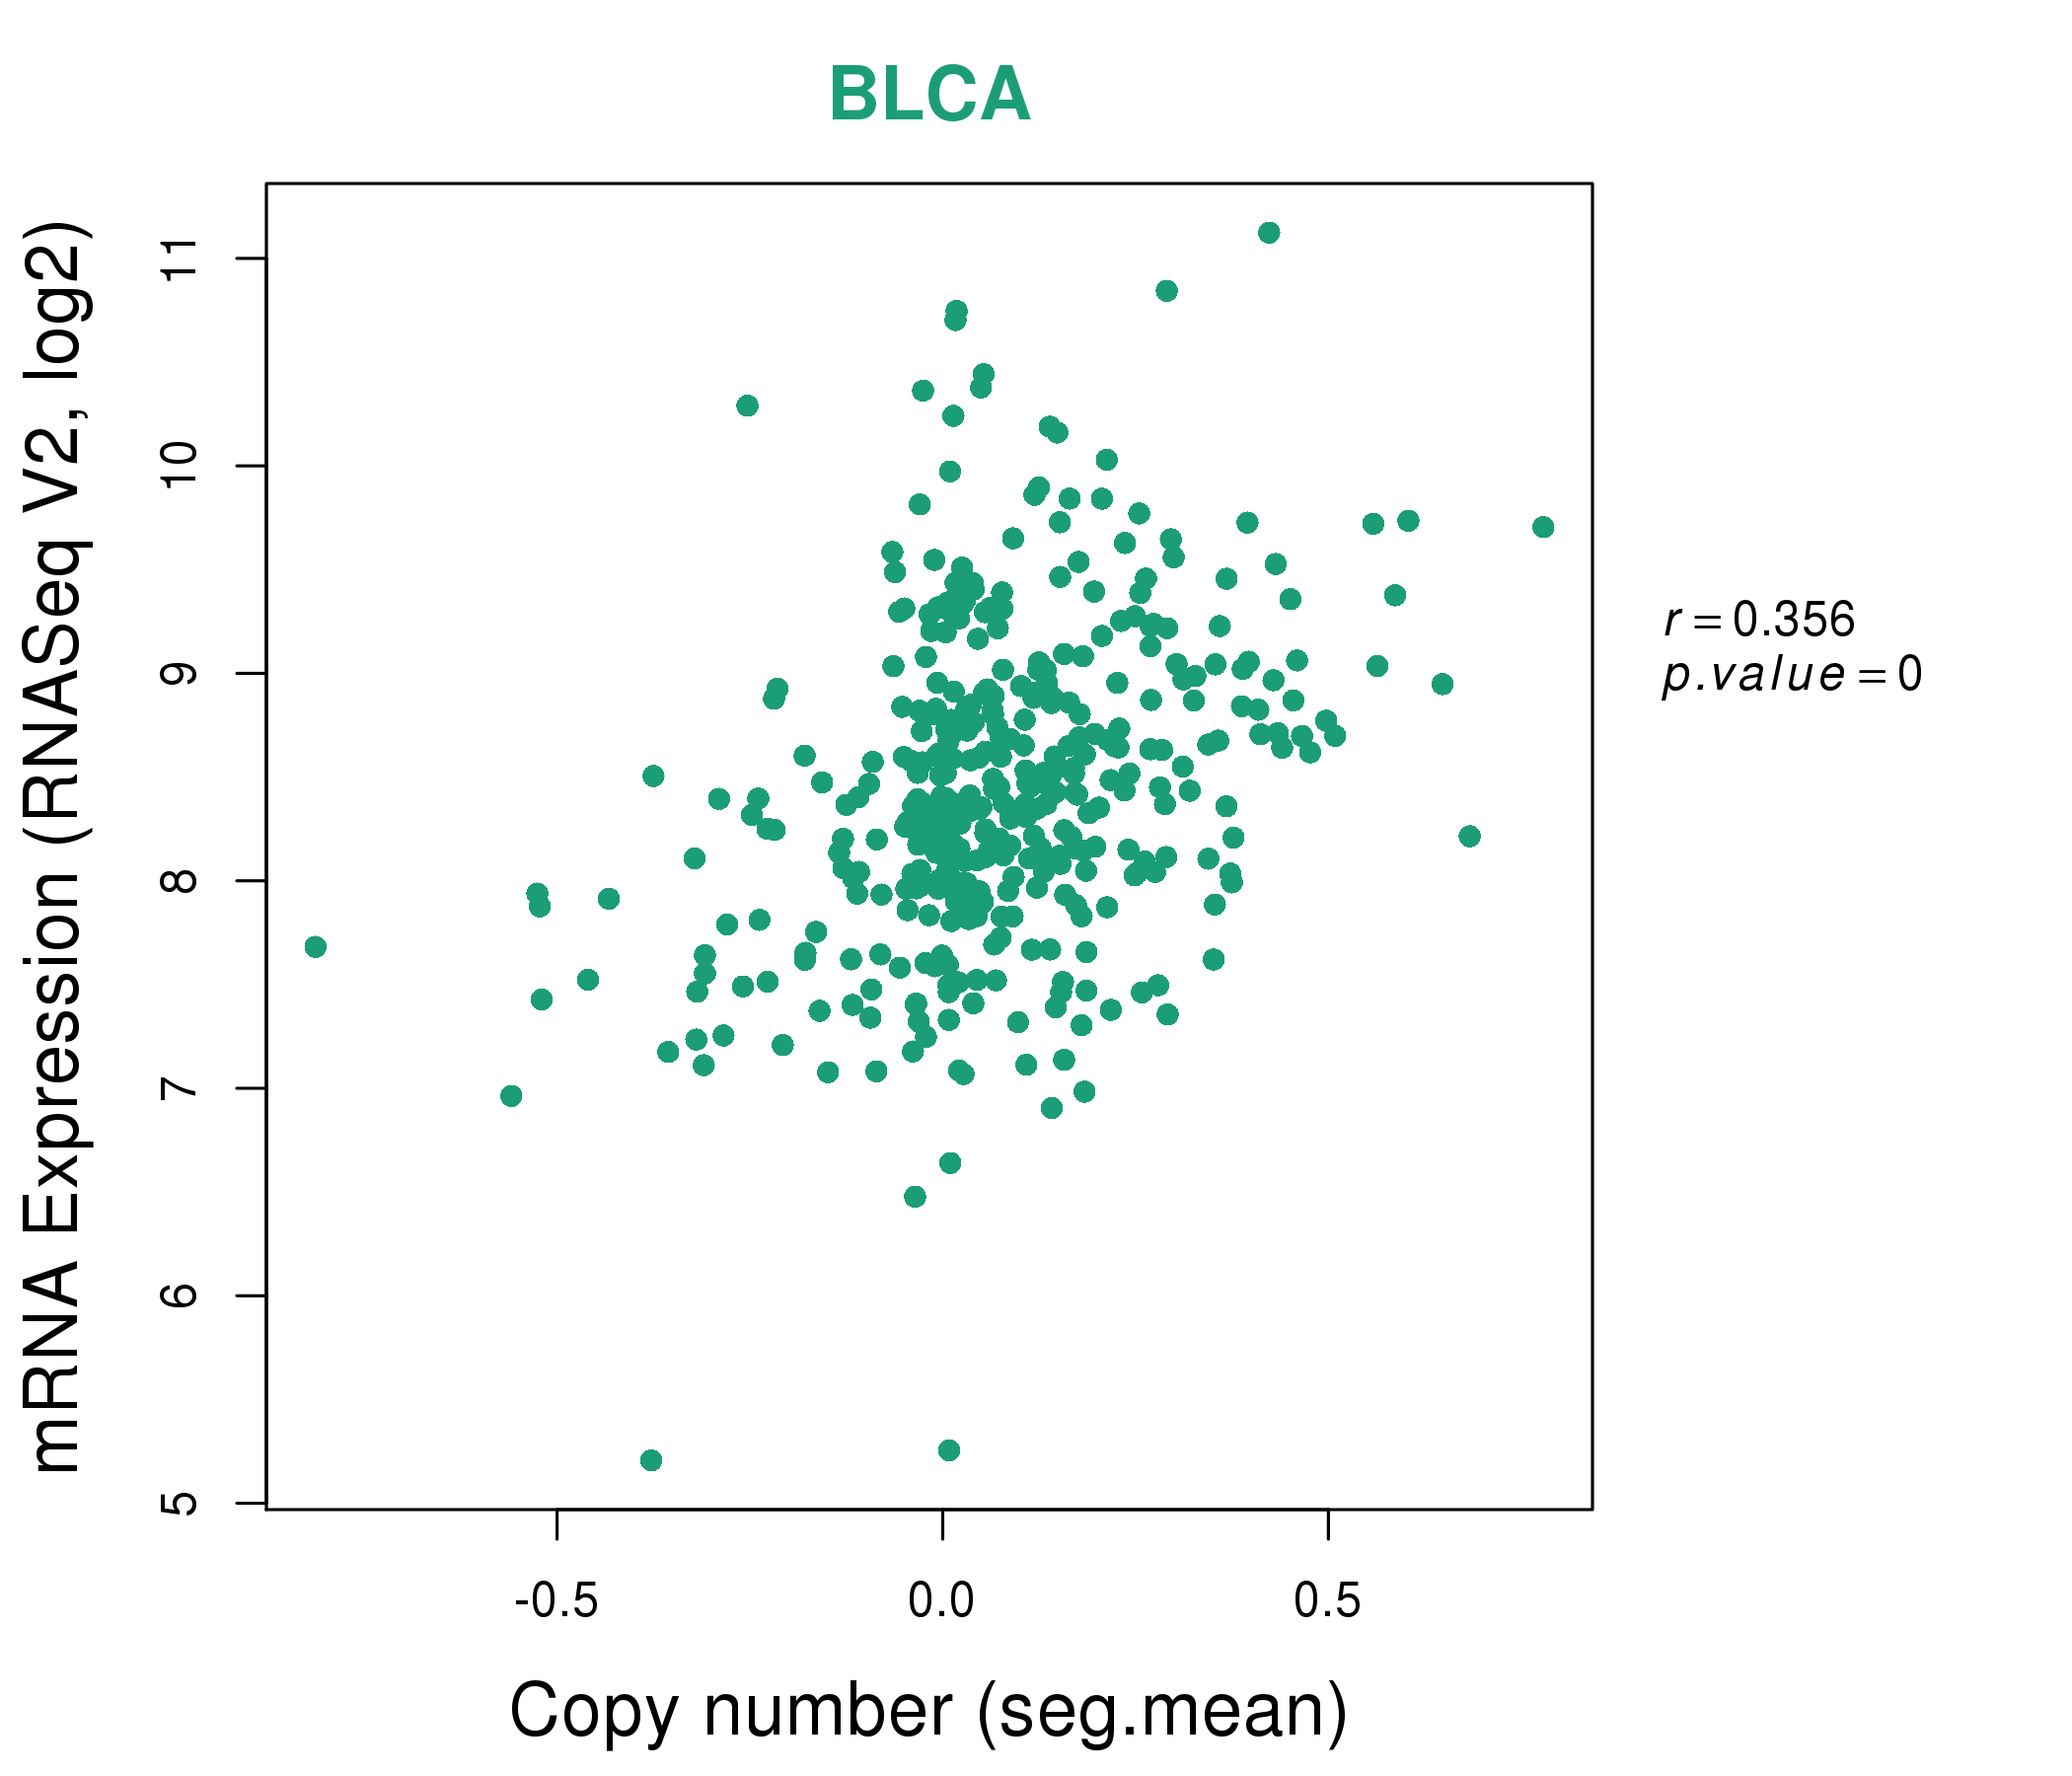
| * This plots show the correlation between CNV and gene expression. |
: Open all plots for all cancer types
 |
|
 |
|

| Top |
| Gene-Gene Network Information |
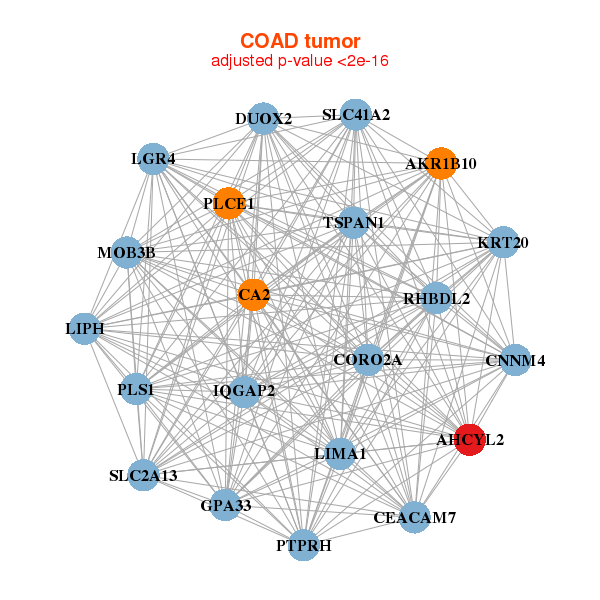
| * Co-Expression network figures were drawn using R package igraph. Only the top 20 genes with the highest correlations were shown. Red circle: input gene, orange circle: cell metabolism gene, sky circle: other gene |
: Open all plots for all cancer types
 |
|
| AFF3,AHCYL2,BAZ2B,CHM,DMXL1,FAM73A,GCC2, GLCE,HEATR5B,KIAA1324L,KLHDC10,MAP4K3,MED13L,MTMR10, NAPEPLD,SLC25A40,THAP5,TMEM209,UBN2,WDR44,ZNF800 | AHCYL2,CFAP126,CUL4A,CUL5,HBS1L,HECTD1,IPO7, KIF1B,LOC729082,NEDD4,PPTC7,PRKAB2,PRKAR2A,PTCD3, PYGO1,RNF115,UBR3,USO1,USP38,XPO4,ZYG11B |
 |
|
| AHCYL2,AKR1B10,CA2,CEACAM7,CNNM4,CORO2A,DUOX2, GPA33,IQGAP2,KRT20,LGR4,LIMA1,LIPH,MOB3B, PLCE1,PLS1,PTPRH,RHBDL2,SLC2A13,SLC41A2,TSPAN1 | ABHD3,AGFG2,AHCYL2,AMACR,CAPN2,CNNM4,DSG2, MGLL,NCEH1,PDE6A,PDE8A,PIP5K1B,PPM1B,RAVER2, SGK2,SH3BGRL2,SLC26A2,SLC26A3,SLC4A4,SNX30,TMEM65 |

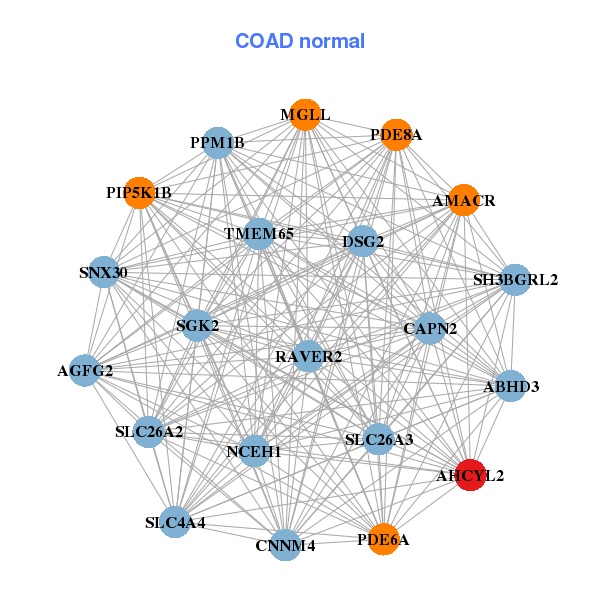
| * Co-Expression network figures were drawn using R package igraph. Only the top 20 genes with the highest correlations were shown. Red circle: input gene, orange circle: cell metabolism gene, sky circle: other gene |
: Open all plots for all cancer types
| Top |
: Open all interacting genes' information including KEGG pathway for all interacting genes from DAVID
| Top |
| Pharmacological Information for AHCYL2 |
| There's no related Drug. |
| Top |
| Cross referenced IDs for AHCYL2 |
| * We obtained these cross-references from Uniprot database. It covers 150 different DBs, 18 categories. http://www.uniprot.org/help/cross_references_section |
: Open all cross reference information
|
Copyright © 2016-Present - The Univsersity of Texas Health Science Center at Houston @ |