|
||||||||||||||||||||||||||||||||||||||||||||||||||||||||||||||||||||||||||||||||||||||||||||||||||||||||||||||||||||||||||||||||||||||||||||||||||||||||||||||||||||||||||||||||||||||||||||||||||||||||||||||||||||||||||||||||||||||||||||||||||||||||||||||||||||||||||||||||||||||||||||||||||||||||||||||||||||||||||
| |
| Phenotypic Information (metabolism pathway, cancer, disease, phenome) |
| |
| |
| Gene-Gene Network Information: Co-Expression Network, Interacting Genes & KEGG |
| |
|


| Gene Summary for MED13L |
| Top |
| Phenotypic Information for MED13L(metabolism pathway, cancer, disease, phenome) |
| Cancer | CGAP: MED13L |
| Familial Cancer Database: MED13L | |
| * This gene is included in those cancer gene databases. |
|
|
|
|
|
| . | ||||||||||||||||||||||||||||||||||||||||||||||||||||||||||||||||||||||||||||||||||||||||||||||||||||||||||||||||||||||||||||||||||||||||||||||||||||||||||||||||||||||||||||||||||||||||||||||||||||||||||||||||||||||||||||||||||||||||||||||||||||||||||||||||||||||||||||||||||||||||||||||||||||||||||||||||||||
Oncogene 1 | Significant driver gene in | |||||||||||||||||||||||||||||||||||||||||||||||||||||||||||||||||||||||||||||||||||||||||||||||||||||||||||||||||||||||||||||||||||||||||||||||||||||||||||||||||||||||||||||||||||||||||||||||||||||||||||||||||||||||||||||||||||||||||||||||||||||||||||||||||||||||||||||||||||||||||||||||||||||||||||||||||||||||||
| cf) number; DB name 1 Oncogene; http://nar.oxfordjournals.org/content/35/suppl_1/D721.long, 2 Tumor Suppressor gene; https://bioinfo.uth.edu/TSGene/, 3 Cancer Gene Census; http://www.nature.com/nrc/journal/v4/n3/abs/nrc1299.html, 4 CancerGenes; http://nar.oxfordjournals.org/content/35/suppl_1/D721.long, 5 Network of Cancer Gene; http://ncg.kcl.ac.uk/index.php, 1Therapeutic Vulnerabilities in Cancer; http://cbio.mskcc.org/cancergenomics/statius/ |
| REACTOME_METABOLISM_OF_LIPIDS_AND_LIPOPROTEINS | |
| OMIM | |
| Orphanet | |
| Disease | KEGG Disease: MED13L |
| MedGen: MED13L (Human Medical Genetics with Condition) | |
| ClinVar: MED13L | |
| Phenotype | MGI: MED13L (International Mouse Phenotyping Consortium) |
| PhenomicDB: MED13L | |
| Mutations for MED13L |
| * Under tables are showing count per each tissue to give us broad intuition about tissue specific mutation patterns.You can go to the detailed page for each mutation database's web site. |
| - Statistics for Tissue and Mutation type | Top |
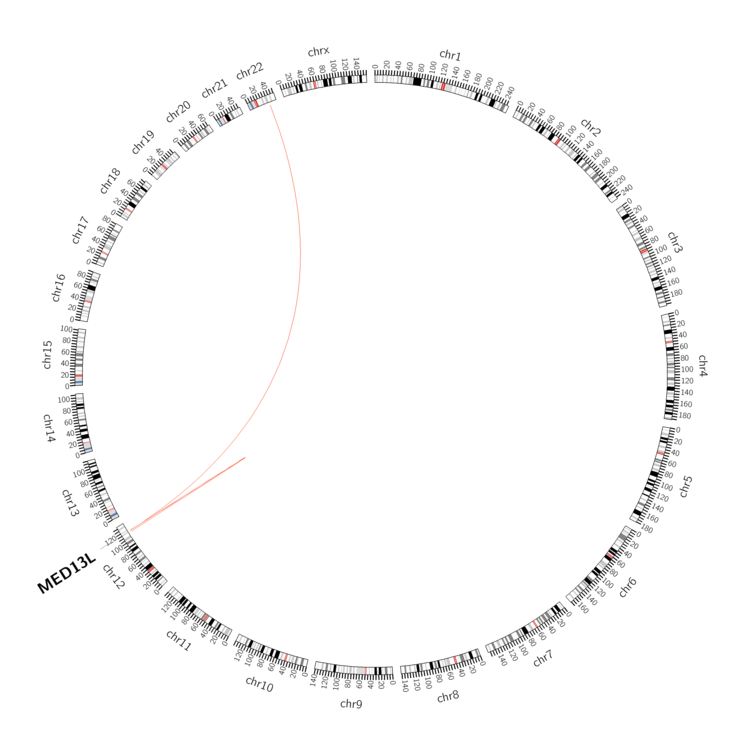 |
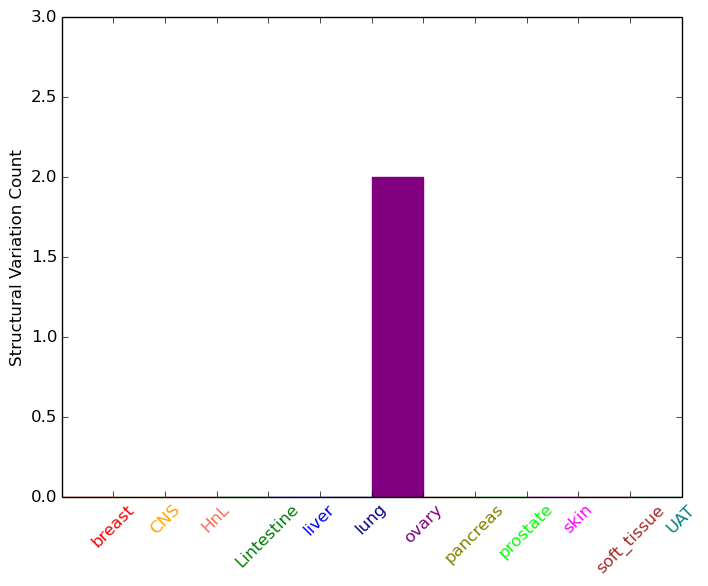
| - For Inter-chromosomal Variations |
| * Inter-chromosomal variantions includes 'interchromosomal amplicon to amplicon', 'interchromosomal amplicon to non-amplified dna', 'interchromosomal insertion', 'Interchromosomal unknown type'. |
 |
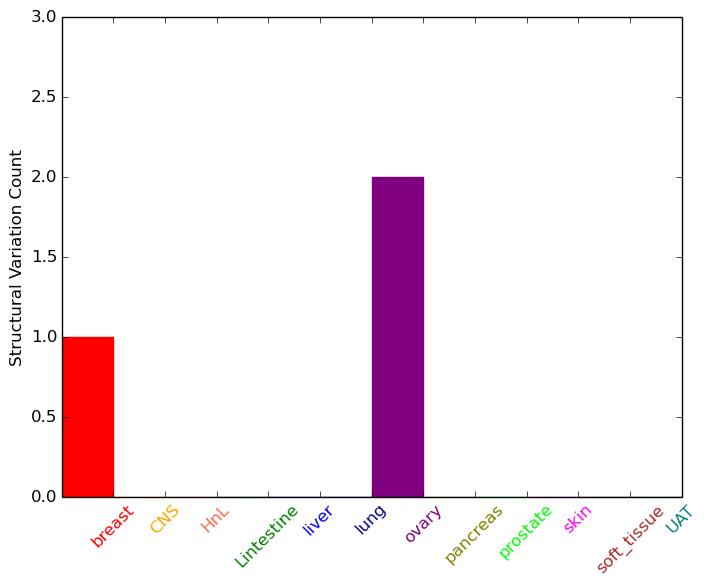
| - For Intra-chromosomal Variations |
| * Intra-chromosomal variantions includes 'intrachromosomal amplicon to amplicon', 'intrachromosomal amplicon to non-amplified dna', 'intrachromosomal deletion', 'intrachromosomal fold-back inversion', 'intrachromosomal inversion', 'intrachromosomal tandem duplication', 'Intrachromosomal unknown type', 'intrachromosomal with inverted orientation', 'intrachromosomal with non-inverted orientation'. |
 |
| Sample | Symbol_a | Chr_a | Start_a | End_a | Symbol_b | Chr_b | Start_b | End_b |
| breast | MED13L | chr12 | 116451691 | 116451691 | MED13L | chr12 | 116476980 | 116476980 |
| ovary | MED13L | chr12 | 116401464 | 116401484 | chr22 | 37647327 | 37647347 | |
| ovary | MED13L | chr12 | 116427802 | 116427822 | chr12 | 113947591 | 113947611 | |
| ovary | MED13L | chr12 | 116564989 | 116565009 | MED13L | chr12 | 116565502 | 116565522 |
| cf) Tissue number; Tissue name (1;Breast, 2;Central_nervous_system, 3;Haematopoietic_and_lymphoid_tissue, 4;Large_intestine, 5;Liver, 6;Lung, 7;Ovary, 8;Pancreas, 9;Prostate, 10;Skin, 11;Soft_tissue, 12;Upper_aerodigestive_tract) |
| * From mRNA Sanger sequences, Chitars2.0 arranged chimeric transcripts. This table shows MED13L related fusion information. |
| ID | Head Gene | Tail Gene | Accession | Gene_a | qStart_a | qEnd_a | Chromosome_a | tStart_a | tEnd_a | Gene_a | qStart_a | qEnd_a | Chromosome_a | tStart_a | tEnd_a |
| CK824480 | MED13L | 33 | 140 | 12 | 116558166 | 116558273 | SERPINI2 | 136 | 522 | 3 | 167173569 | 167173955 | |
| BF934070 | MED13L | 13 | 250 | 12 | 116595421 | 116595660 | MAP1B | 247 | 498 | 5 | 71504071 | 71504322 | |
| BF357082 | MED13L | 1 | 265 | 12 | 116666969 | 116667232 | PTPN23 | 260 | 279 | 3 | 47439467 | 47439486 | |
| AW809452 | HEATR2 | 161 | 434 | 7 | 776821 | 777229 | MED13L | 431 | 569 | 12 | 116578385 | 116578523 | |
| AA502152 | MED13L | 1 | 123 | 12 | 116441537 | 116441659 | MED13L | 115 | 312 | 12 | 116441733 | 116441930 | |
| CK824479 | SERPINI2 | 1 | 516 | 3 | 167173440 | 167173955 | MED13L | 512 | 586 | 12 | 116558166 | 116558240 | |
| BG988299 | MED13L | 1 | 65 | 12 | 116403886 | 116403951 | GTPBP4 | 55 | 304 | 10 | 1056410 | 1058602 | |
| DA392149 | MED13L | 1 | 501 | 12 | 116398992 | 116400538 | NAP1L3 | 502 | 590 | X | 92928489 | 92928577 | |
| Top |
| Mutation type/ Tissue ID | brca | cns | cerv | endome | haematopo | kidn | Lintest | liver | lung | ns | ovary | pancre | prost | skin | stoma | thyro | urina | |||
| Total # sample | 1 | 1 | ||||||||||||||||||
| GAIN (# sample) | 1 | 1 | ||||||||||||||||||
| LOSS (# sample) |
| cf) Tissue ID; Tissue type (1; Breast, 2; Central_nervous_system, 3; Cervix, 4; Endometrium, 5; Haematopoietic_and_lymphoid_tissue, 6; Kidney, 7; Large_intestine, 8; Liver, 9; Lung, 10; NS, 11; Ovary, 12; Pancreas, 13; Prostate, 14; Skin, 15; Stomach, 16; Thyroid, 17; Urinary_tract) |
| Top |
|
 |
| Top |
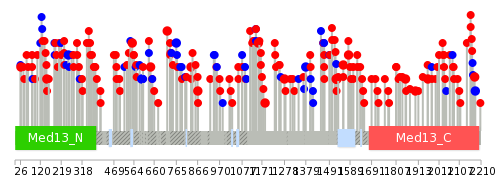
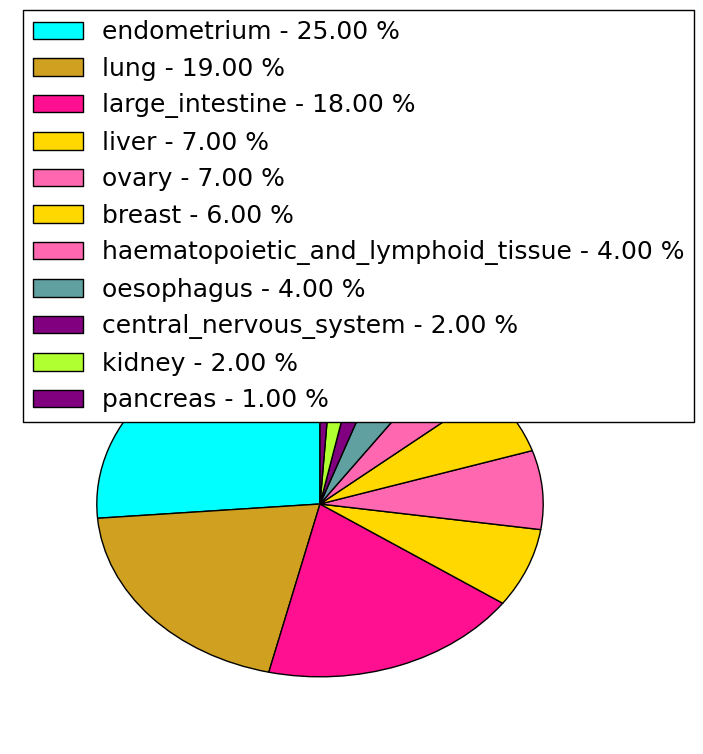
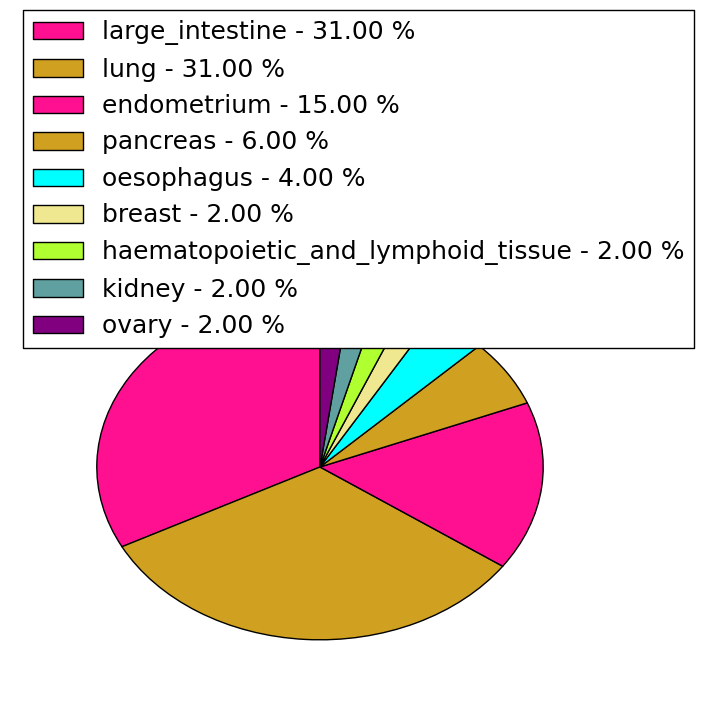
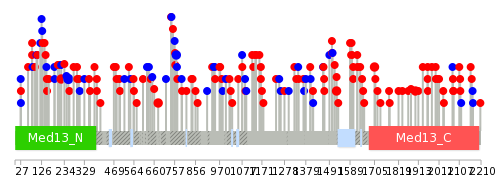
| Stat. for Non-Synonymous SNVs (# total SNVs=148) | (# total SNVs=44) |
 |  |
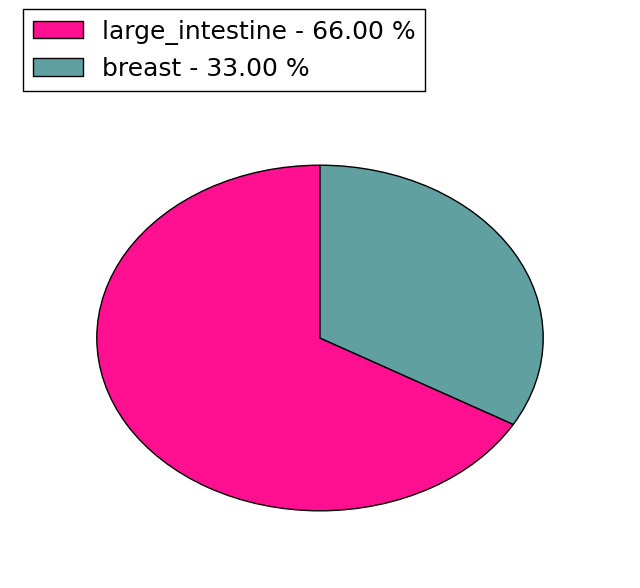
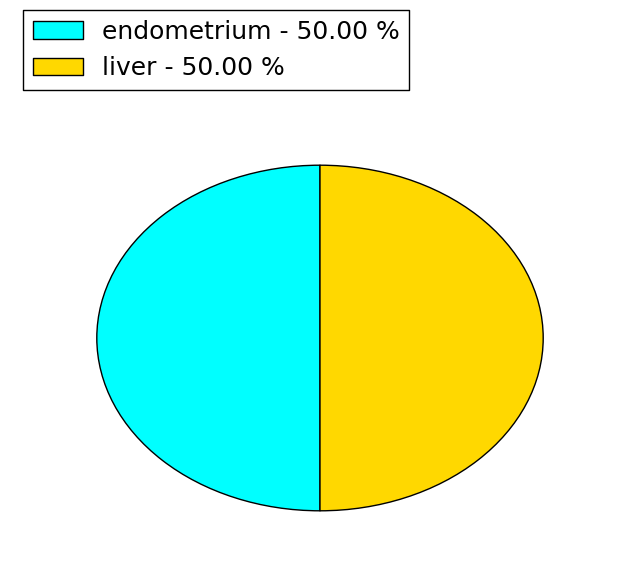
(# total SNVs=3) | (# total SNVs=2) |
 |  |
| Top |
| * When you move the cursor on each content, you can see more deailed mutation information on the Tooltip. Those are primary_site,primary_histology,mutation(aa),pubmedID. |
| GRCh37 position | Mutation(aa) | Unique sampleID count |
| chr12:116421304-116421304 | p.I1525V | 3 |
| chr12:116421207-116421207 | p.P1557L | 2 |
| chr12:116446900-116446900 | p.R440* | 2 |
| chr12:116428926-116428926 | p.A1278V | 2 |
| chr12:116445290-116445290 | p.D722N | 2 |
| chr12:116399155-116399155 | p.P2183P | 2 |
| chr12:116446415-116446415 | p.L601L | 2 |
| chr12:116435005-116435005 | p.T867I | 2 |
| chr12:116457706-116457706 | p.R233S | 2 |
| chr12:116399165-116399165 | p.T2180M | 2 |
| Top |
|
 |
| Point Mutation/ Tissue ID | 1 | 2 | 3 | 4 | 5 | 6 | 7 | 8 | 9 | 10 | 11 | 12 | 13 | 14 | 15 | 16 | 17 | 18 | 19 | 20 |
| # sample | 3 | 3 | 2 | 26 | 1 | 9 | 3 | 1 | 20 | 9 | 7 | 1 | 3 | 19 | 15 | 24 | ||||
| # mutation | 3 | 3 | 2 | 28 | 1 | 9 | 3 | 1 | 24 | 9 | 7 | 1 | 3 | 20 | 22 | 40 | ||||
| nonsynonymous SNV | 3 | 3 | 2 | 18 | 1 | 6 | 2 | 1 | 19 | 5 | 6 | 1 | 12 | 16 | 33 | |||||
| synonymous SNV | 10 | 3 | 1 | 5 | 4 | 1 | 1 | 2 | 8 | 6 | 7 |
| cf) Tissue ID; Tissue type (1; BLCA[Bladder Urothelial Carcinoma], 2; BRCA[Breast invasive carcinoma], 3; CESC[Cervical squamous cell carcinoma and endocervical adenocarcinoma], 4; COAD[Colon adenocarcinoma], 5; GBM[Glioblastoma multiforme], 6; Glioma Low Grade, 7; HNSC[Head and Neck squamous cell carcinoma], 8; KICH[Kidney Chromophobe], 9; KIRC[Kidney renal clear cell carcinoma], 10; KIRP[Kidney renal papillary cell carcinoma], 11; LAML[Acute Myeloid Leukemia], 12; LUAD[Lung adenocarcinoma], 13; LUSC[Lung squamous cell carcinoma], 14; OV[Ovarian serous cystadenocarcinoma ], 15; PAAD[Pancreatic adenocarcinoma], 16; PRAD[Prostate adenocarcinoma], 17; SKCM[Skin Cutaneous Melanoma], 18:STAD[Stomach adenocarcinoma], 19:THCA[Thyroid carcinoma], 20:UCEC[Uterine Corpus Endometrial Carcinoma]) |
| Top |
| * We represented just top 10 SNVs. When you move the cursor on each content, you can see more deailed mutation information on the Tooltip. Those are primary_site, primary_histology, mutation(aa), pubmedID. |
| Genomic Position | Mutation(aa) | Unique sampleID count |
| chr12:116457644 | p.S253S | 3 |
| chr12:116409904 | p.I1525V | 2 |
| chr12:116452926 | p.V765V | 2 |
| chr12:116420250 | p.R1705H | 2 |
| chr12:116413011 | p.G1957R | 2 |
| chr12:116445418 | p.G1899V | 2 |
| chr12:116457747 | p.R679L | 2 |
| chr12:116421304 | p.T219M | 2 |
| chr12:116444160 | p.R388K | 2 |
| chr12:116549311 | p.P577H | 1 |
| * Copy number data were extracted from TCGA using R package TCGA-Assembler. The URLs of all public data files on TCGA DCC data server were gathered on Jan-05-2015. Function ProcessCNAData in TCGA-Assembler package was used to obtain gene-level copy number value which is calculated as the average copy number of the genomic region of a gene. |
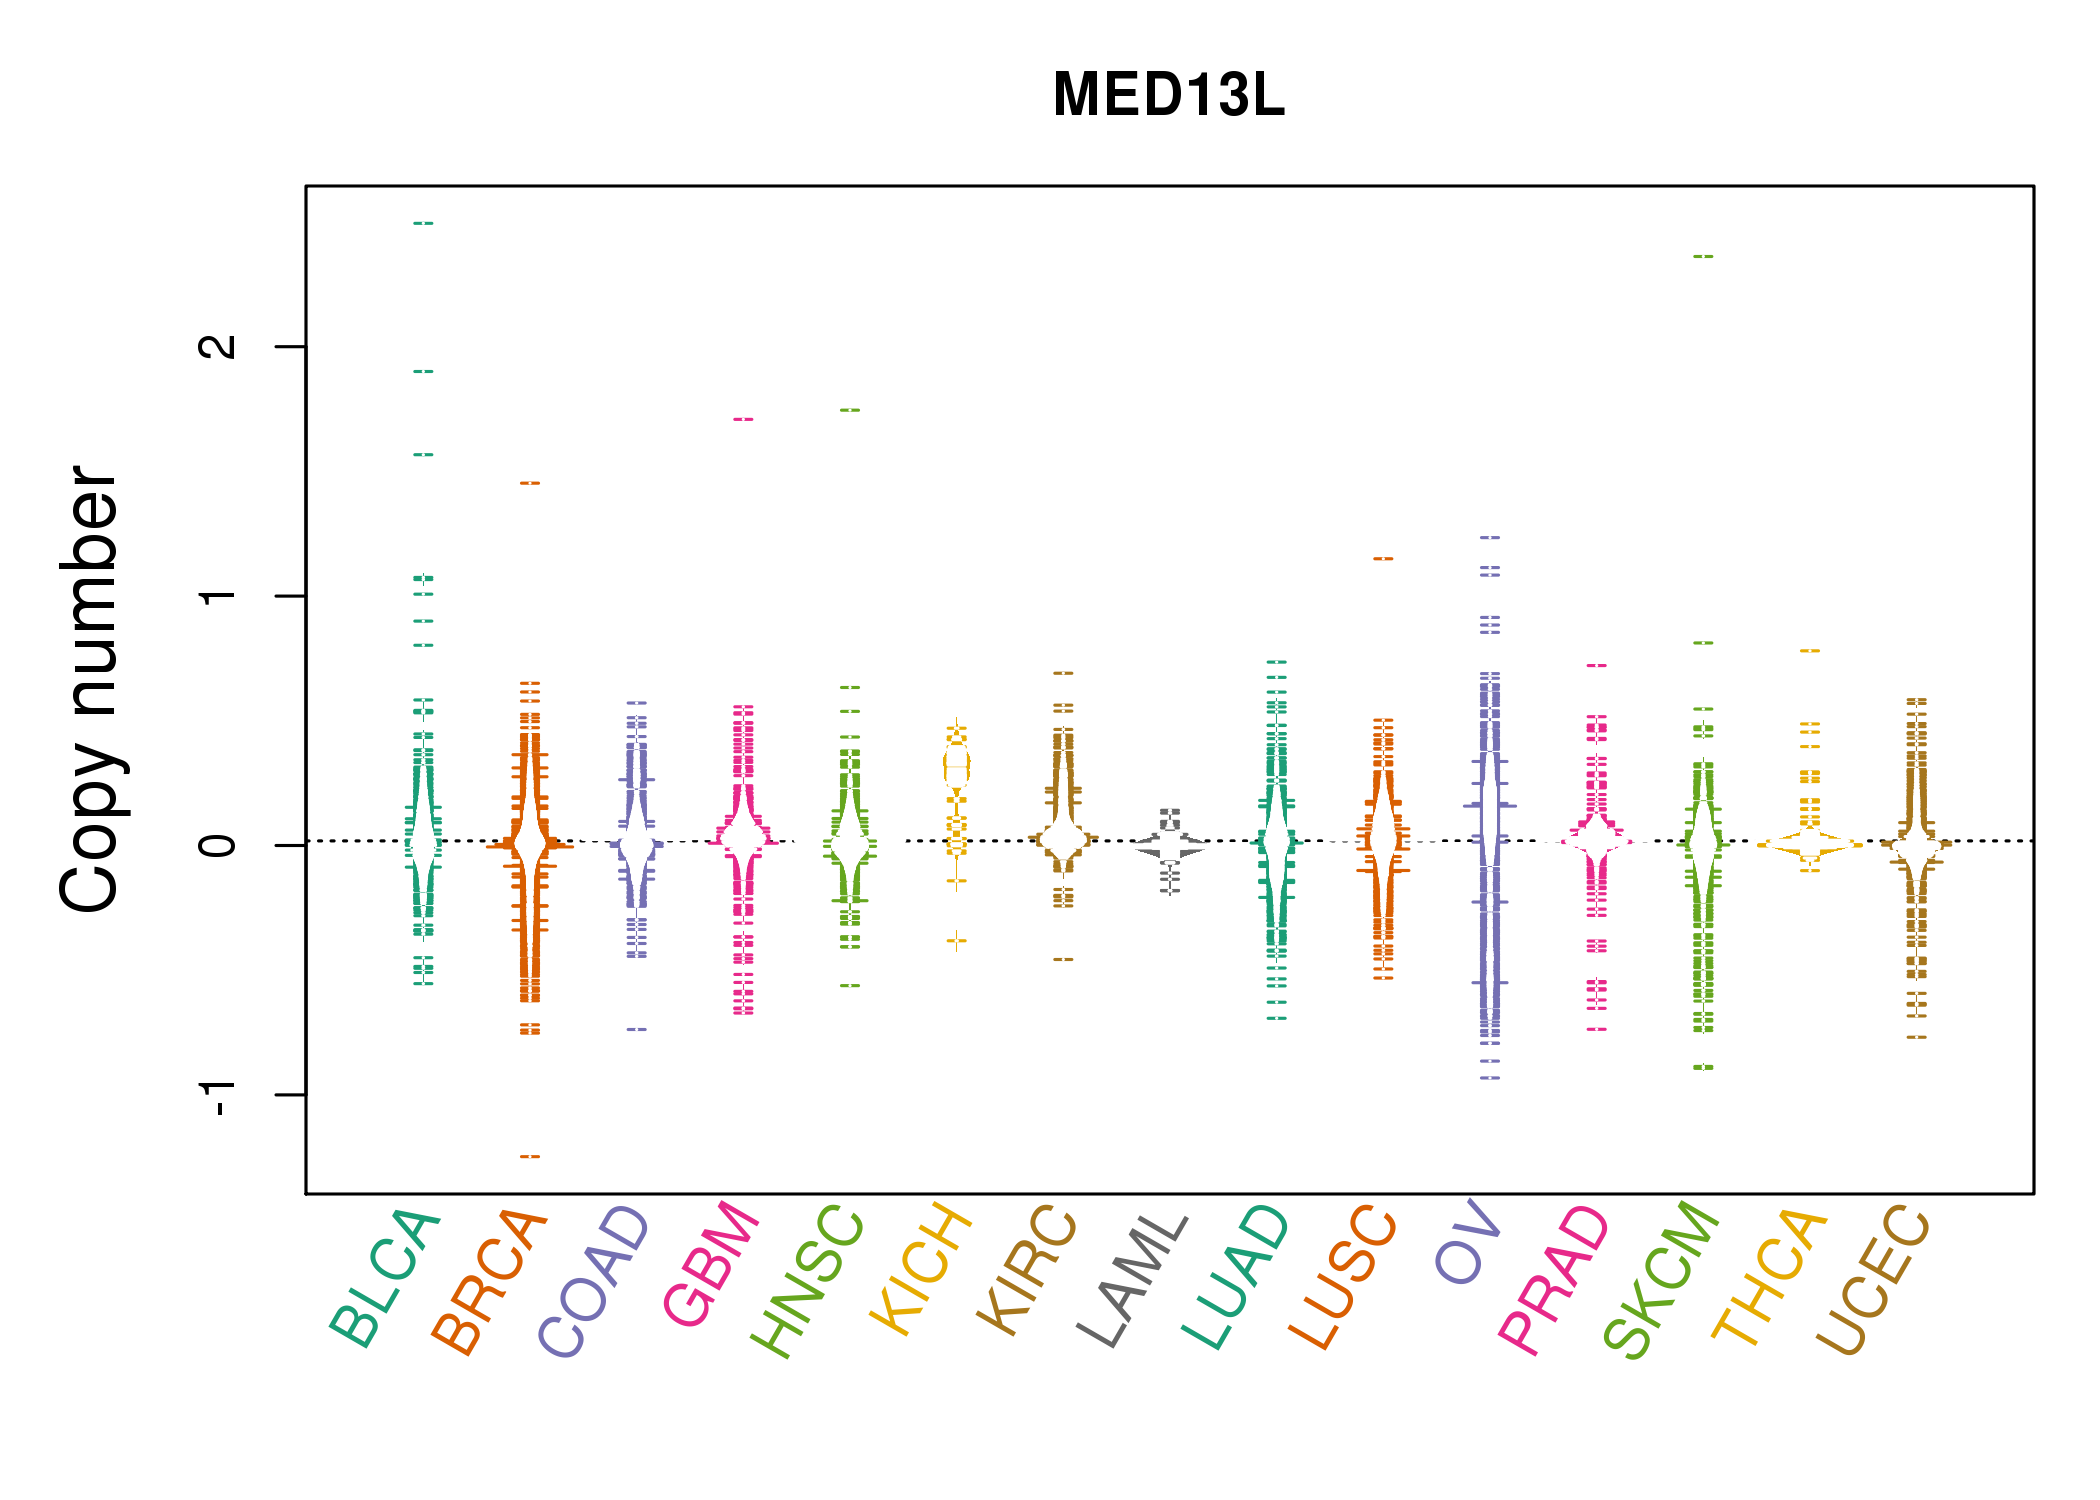 |
| cf) Tissue ID[Tissue type]: BLCA[Bladder Urothelial Carcinoma], BRCA[Breast invasive carcinoma], CESC[Cervical squamous cell carcinoma and endocervical adenocarcinoma], COAD[Colon adenocarcinoma], GBM[Glioblastoma multiforme], Glioma Low Grade, HNSC[Head and Neck squamous cell carcinoma], KICH[Kidney Chromophobe], KIRC[Kidney renal clear cell carcinoma], KIRP[Kidney renal papillary cell carcinoma], LAML[Acute Myeloid Leukemia], LUAD[Lung adenocarcinoma], LUSC[Lung squamous cell carcinoma], OV[Ovarian serous cystadenocarcinoma ], PAAD[Pancreatic adenocarcinoma], PRAD[Prostate adenocarcinoma], SKCM[Skin Cutaneous Melanoma], STAD[Stomach adenocarcinoma], THCA[Thyroid carcinoma], UCEC[Uterine Corpus Endometrial Carcinoma] |
| Top |
| Gene Expression for MED13L |
| * CCLE gene expression data were extracted from CCLE_Expression_Entrez_2012-10-18.res: Gene-centric RMA-normalized mRNA expression data. |
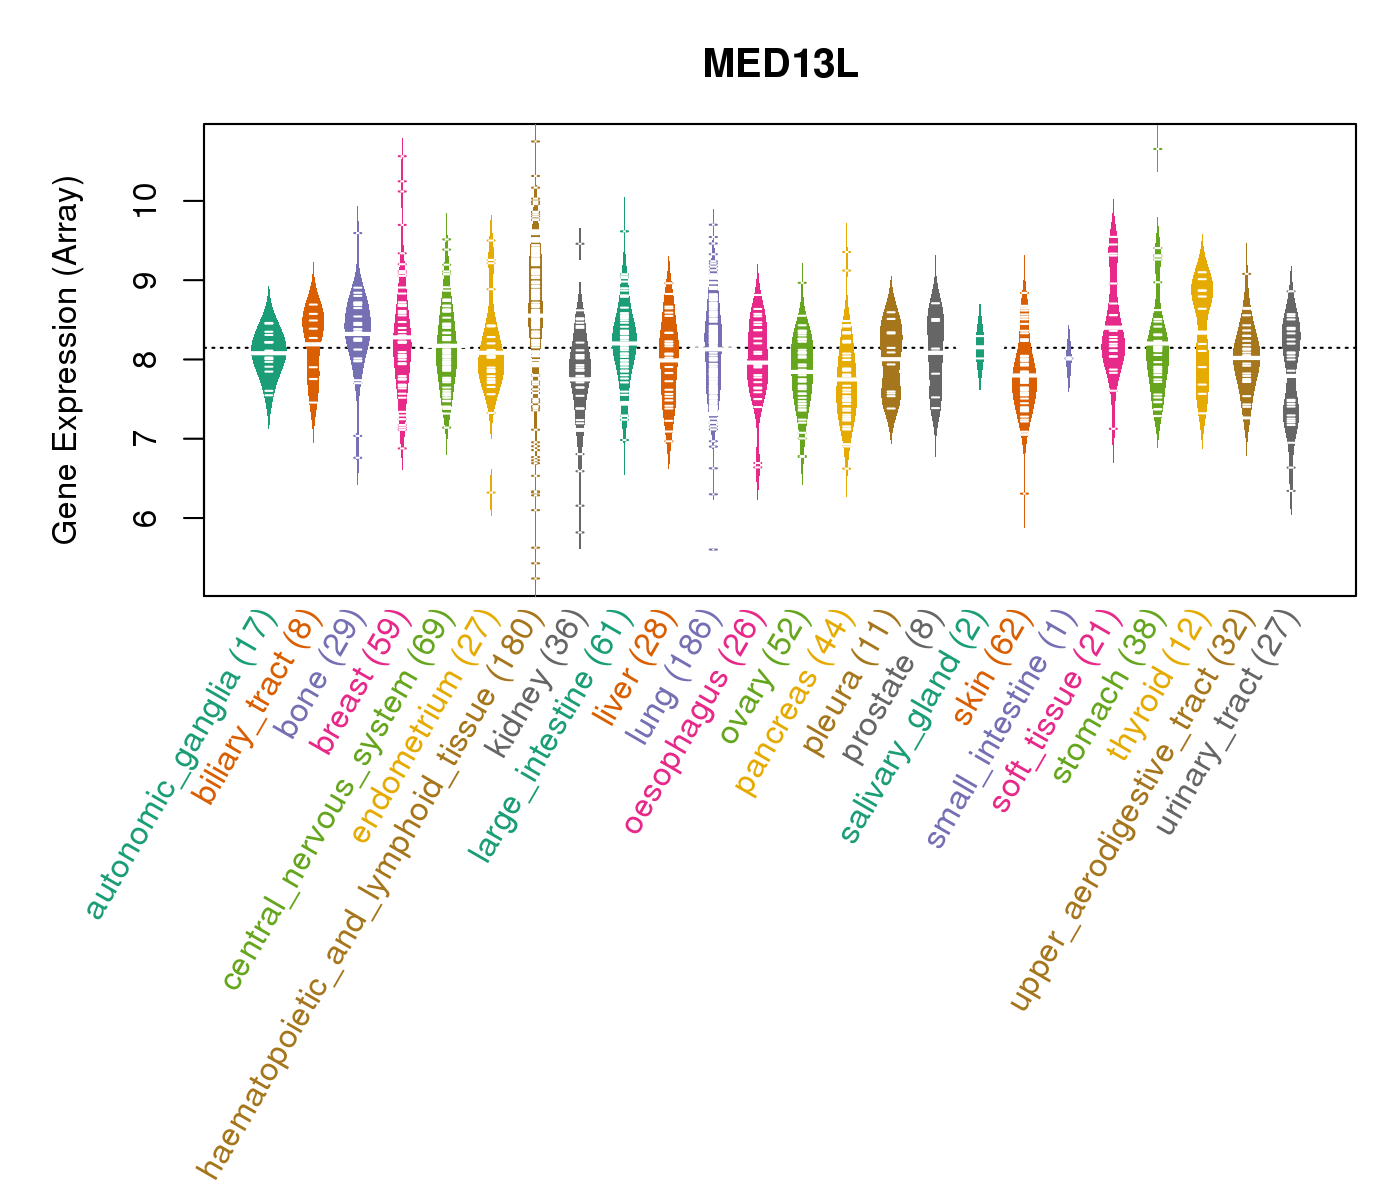 |
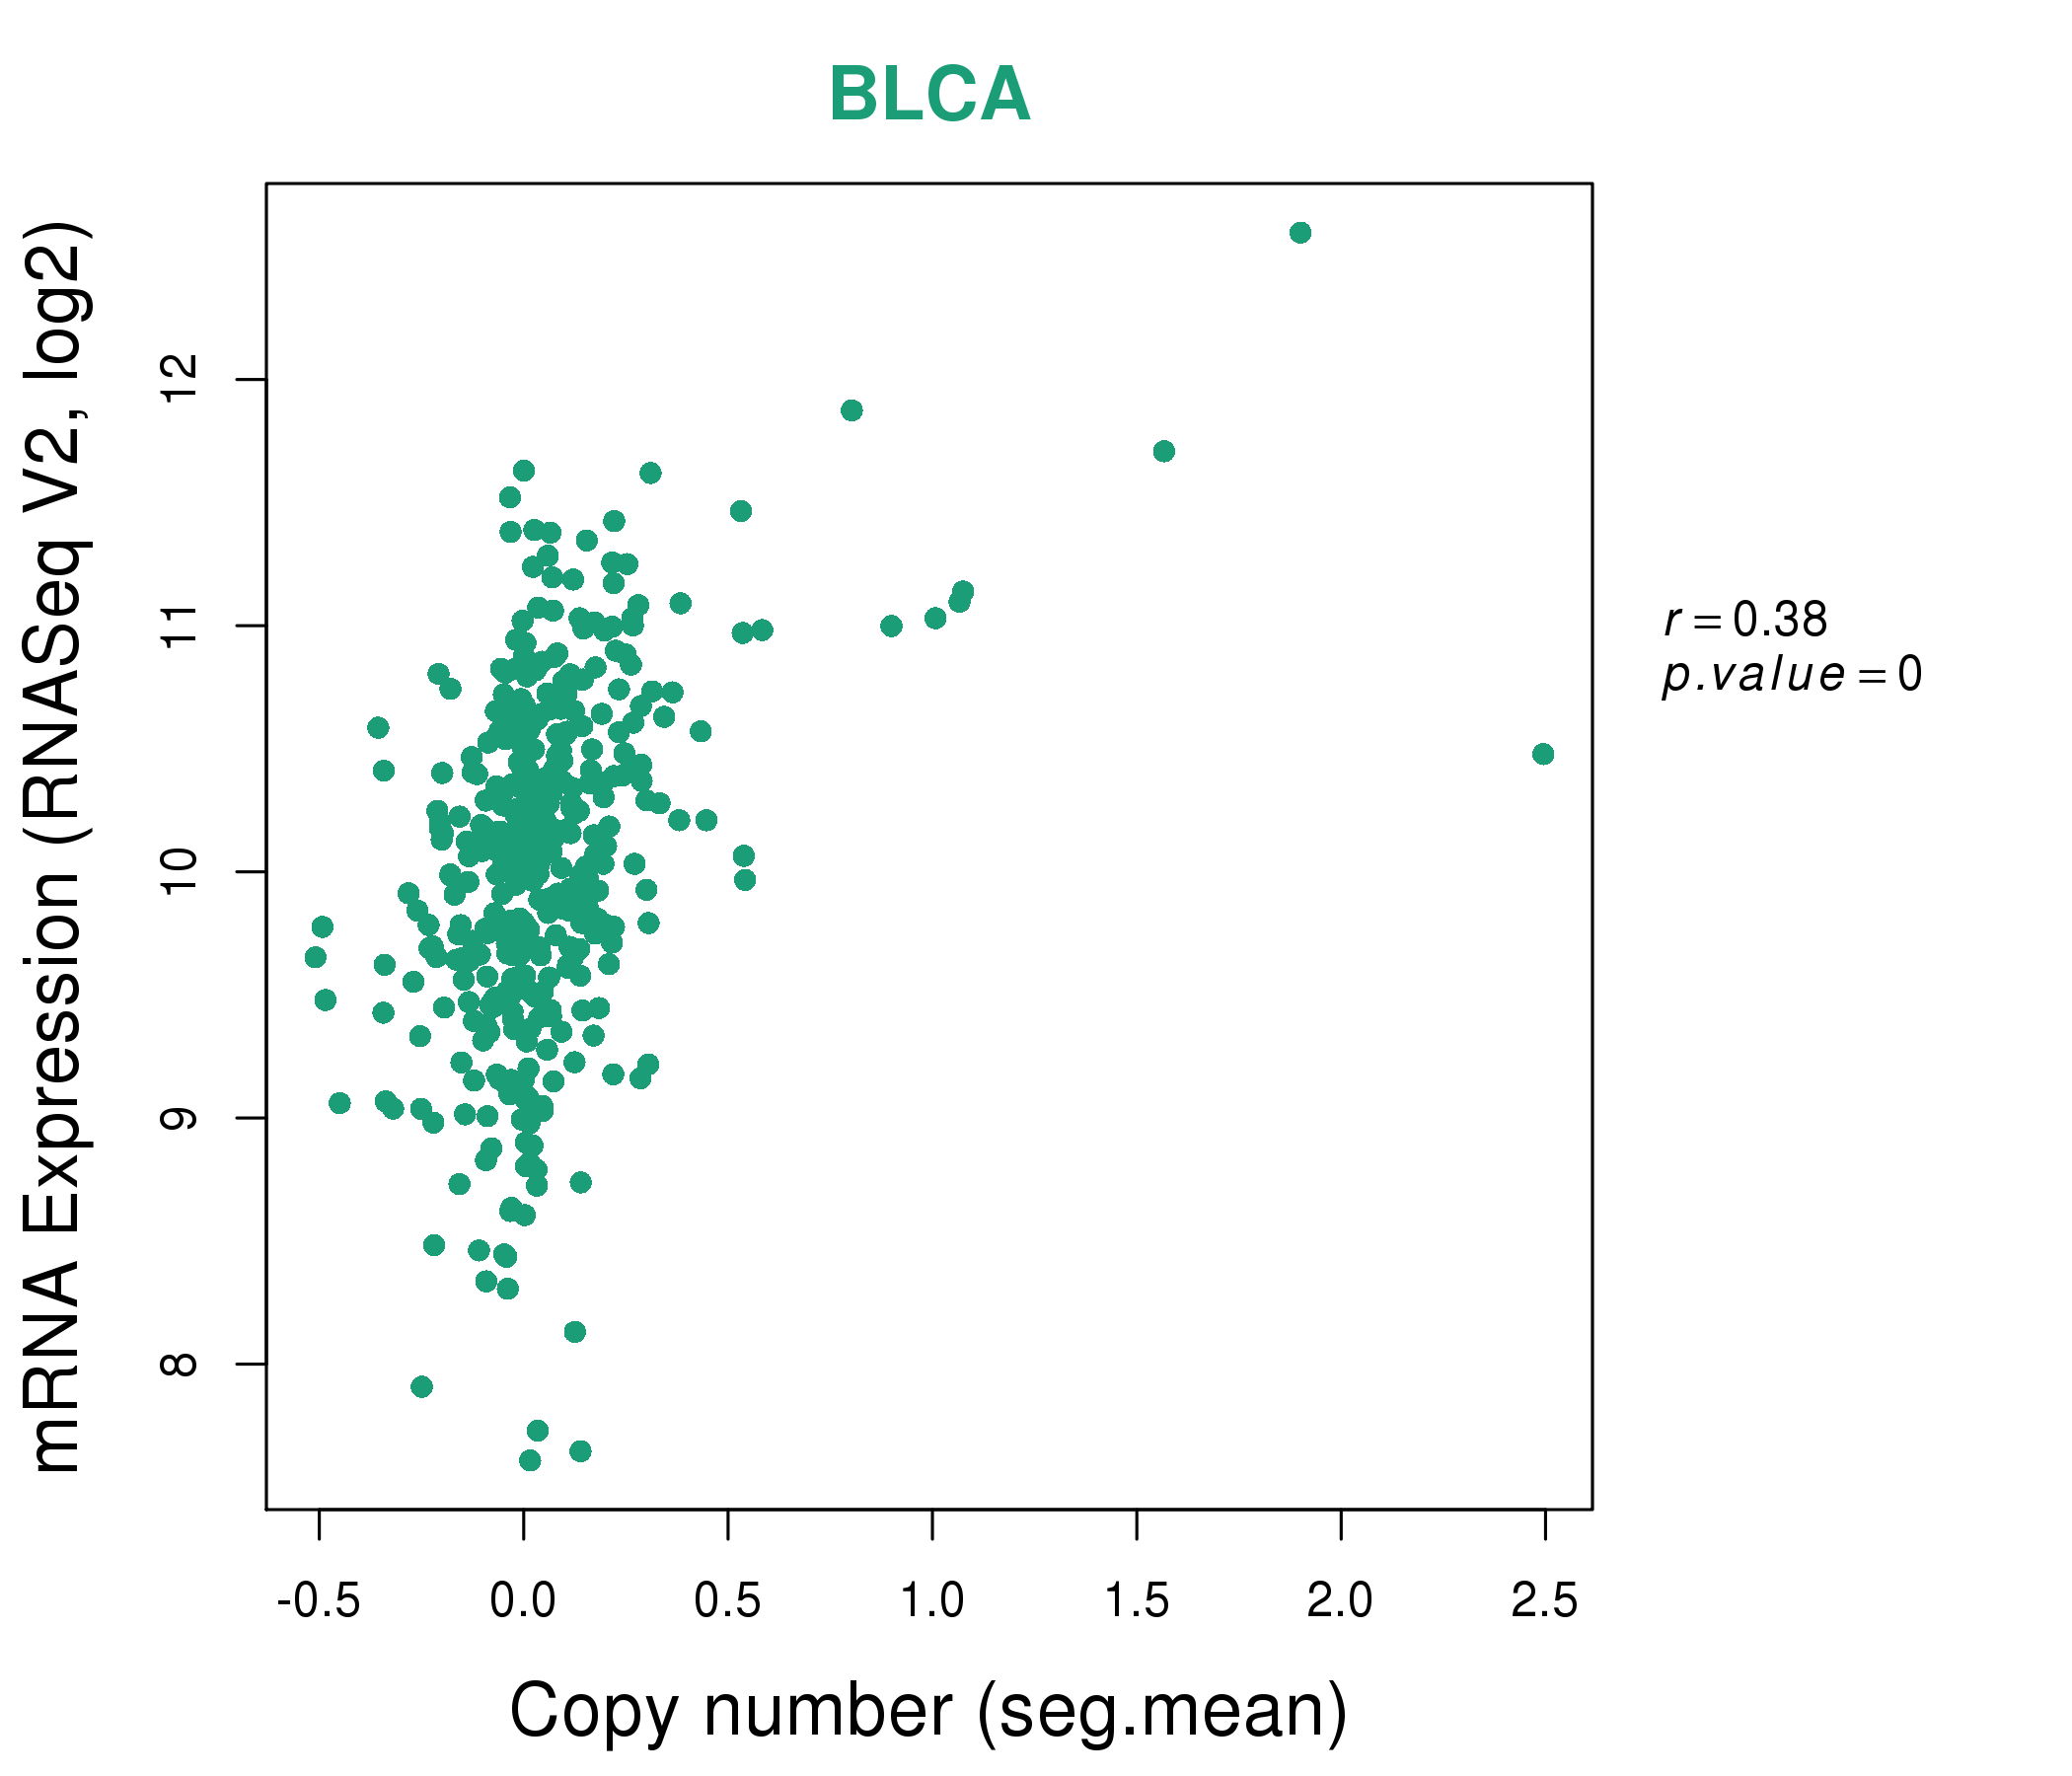
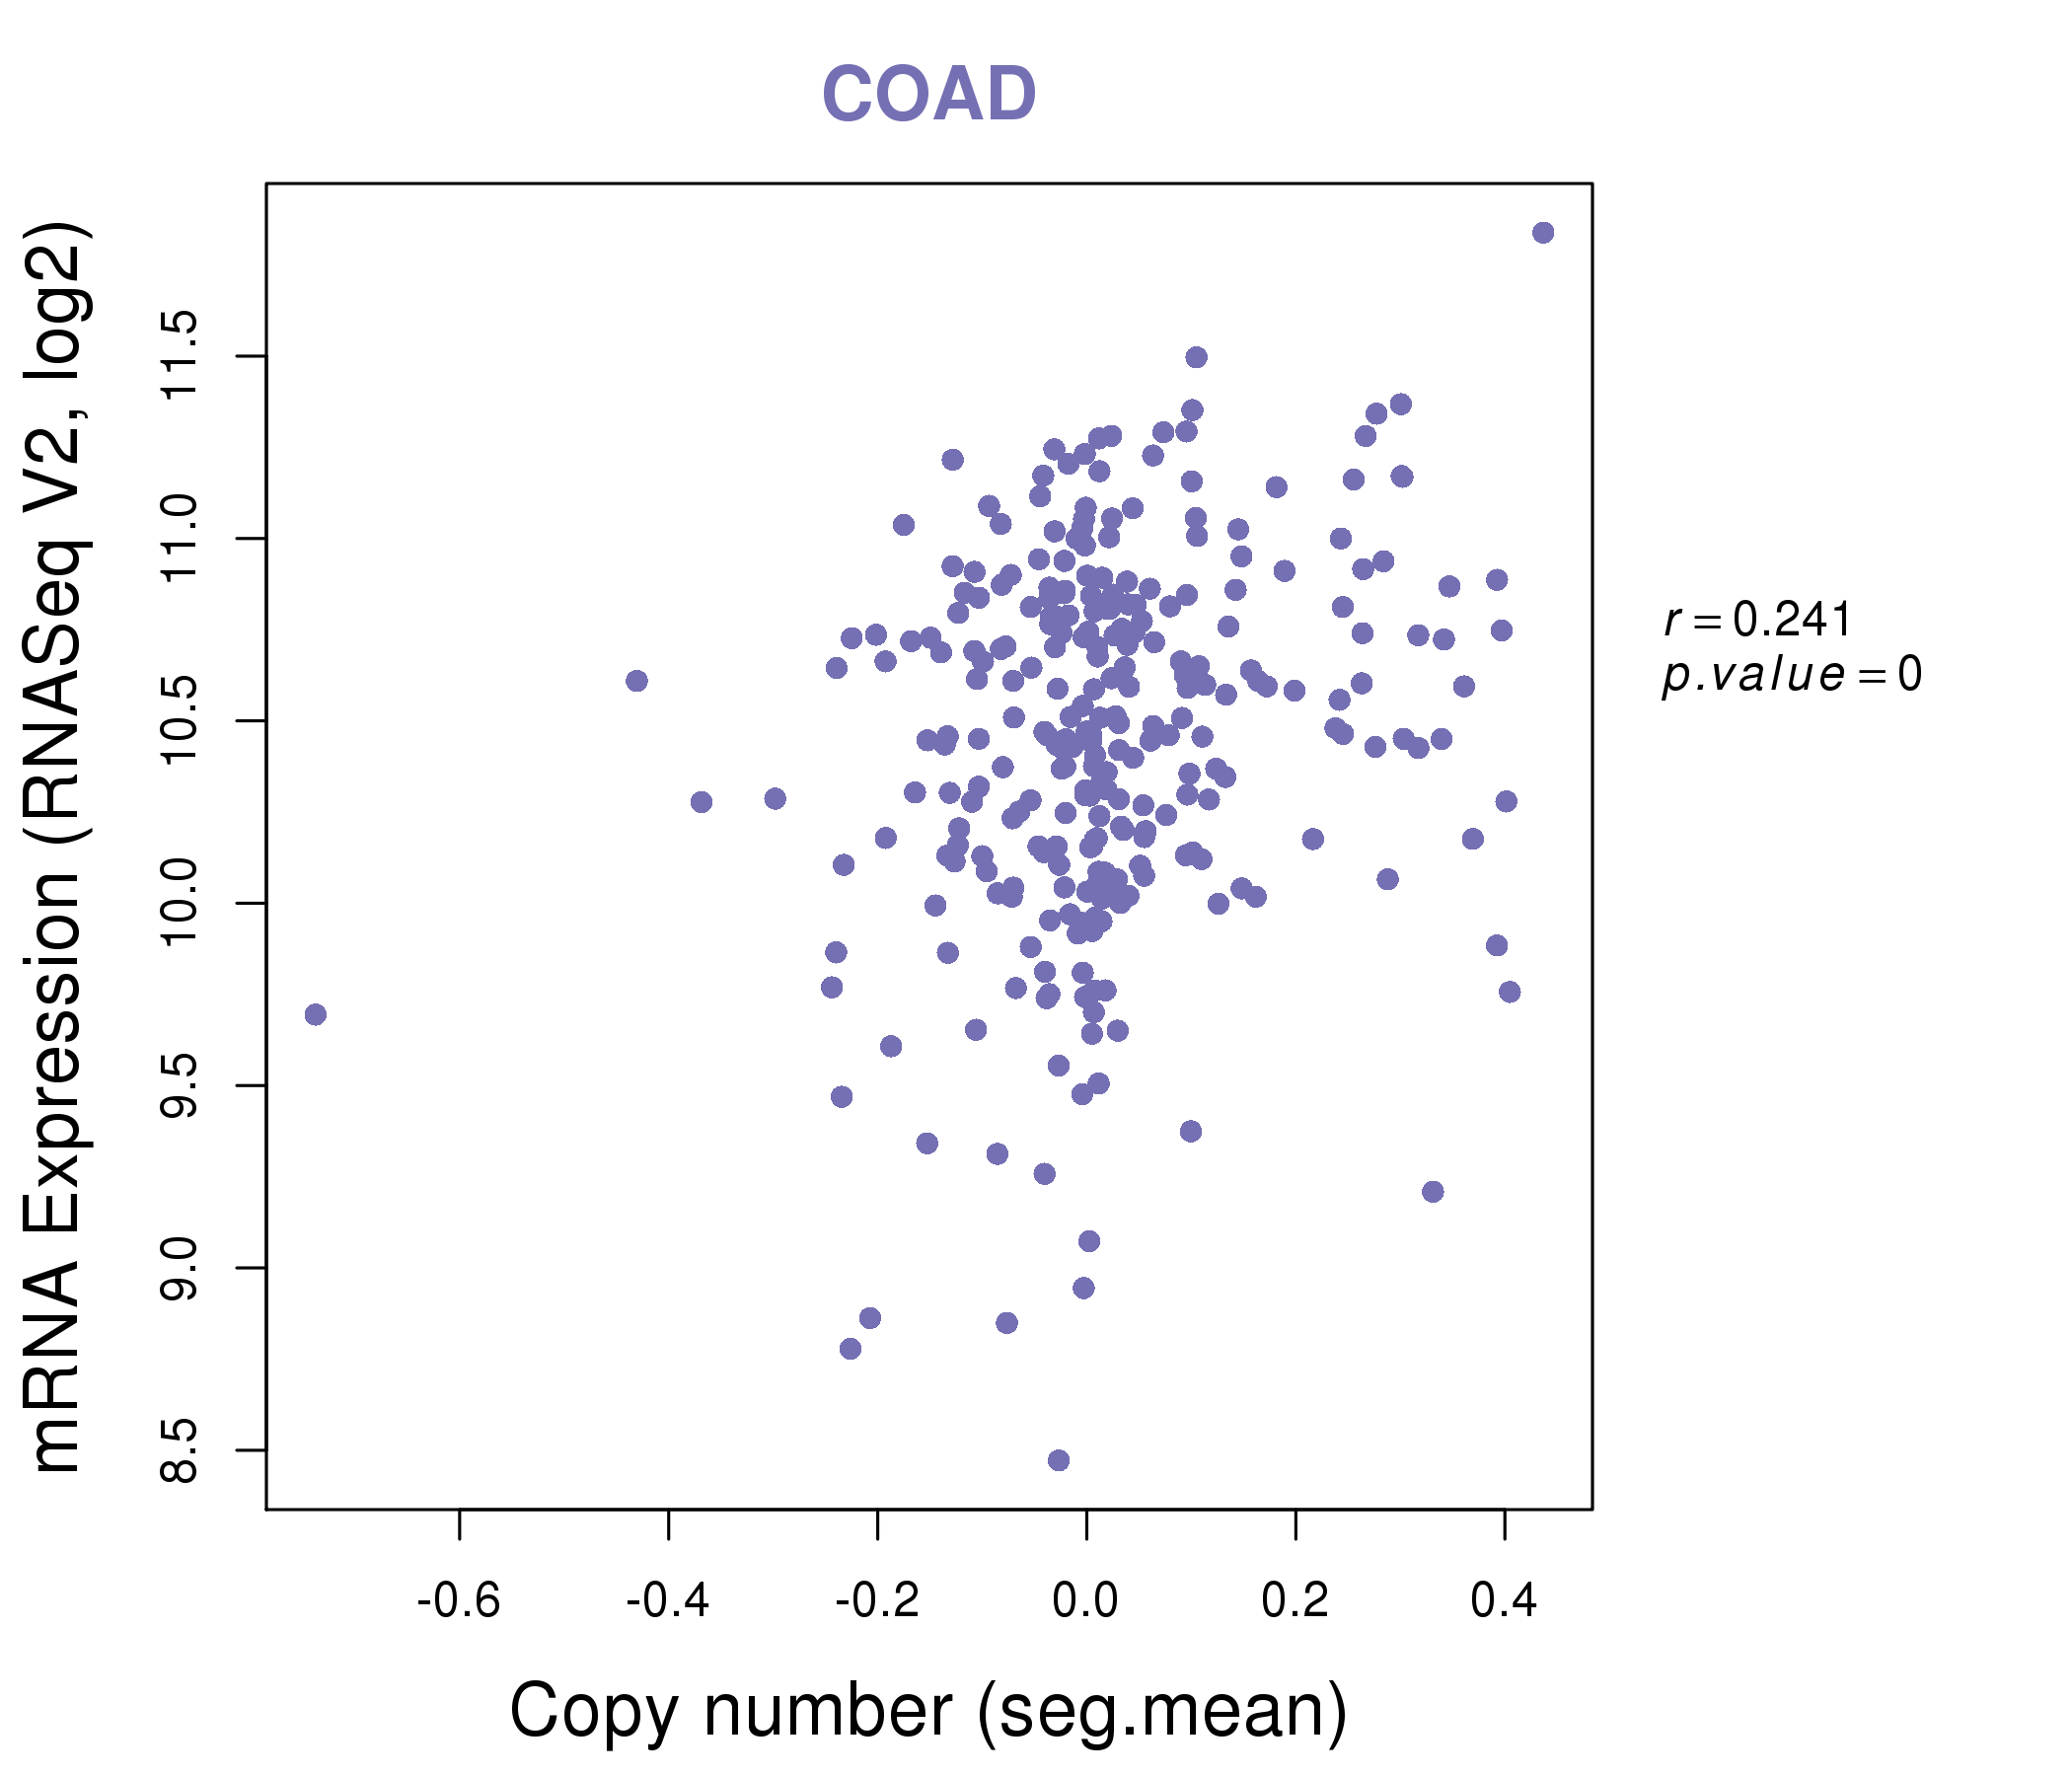
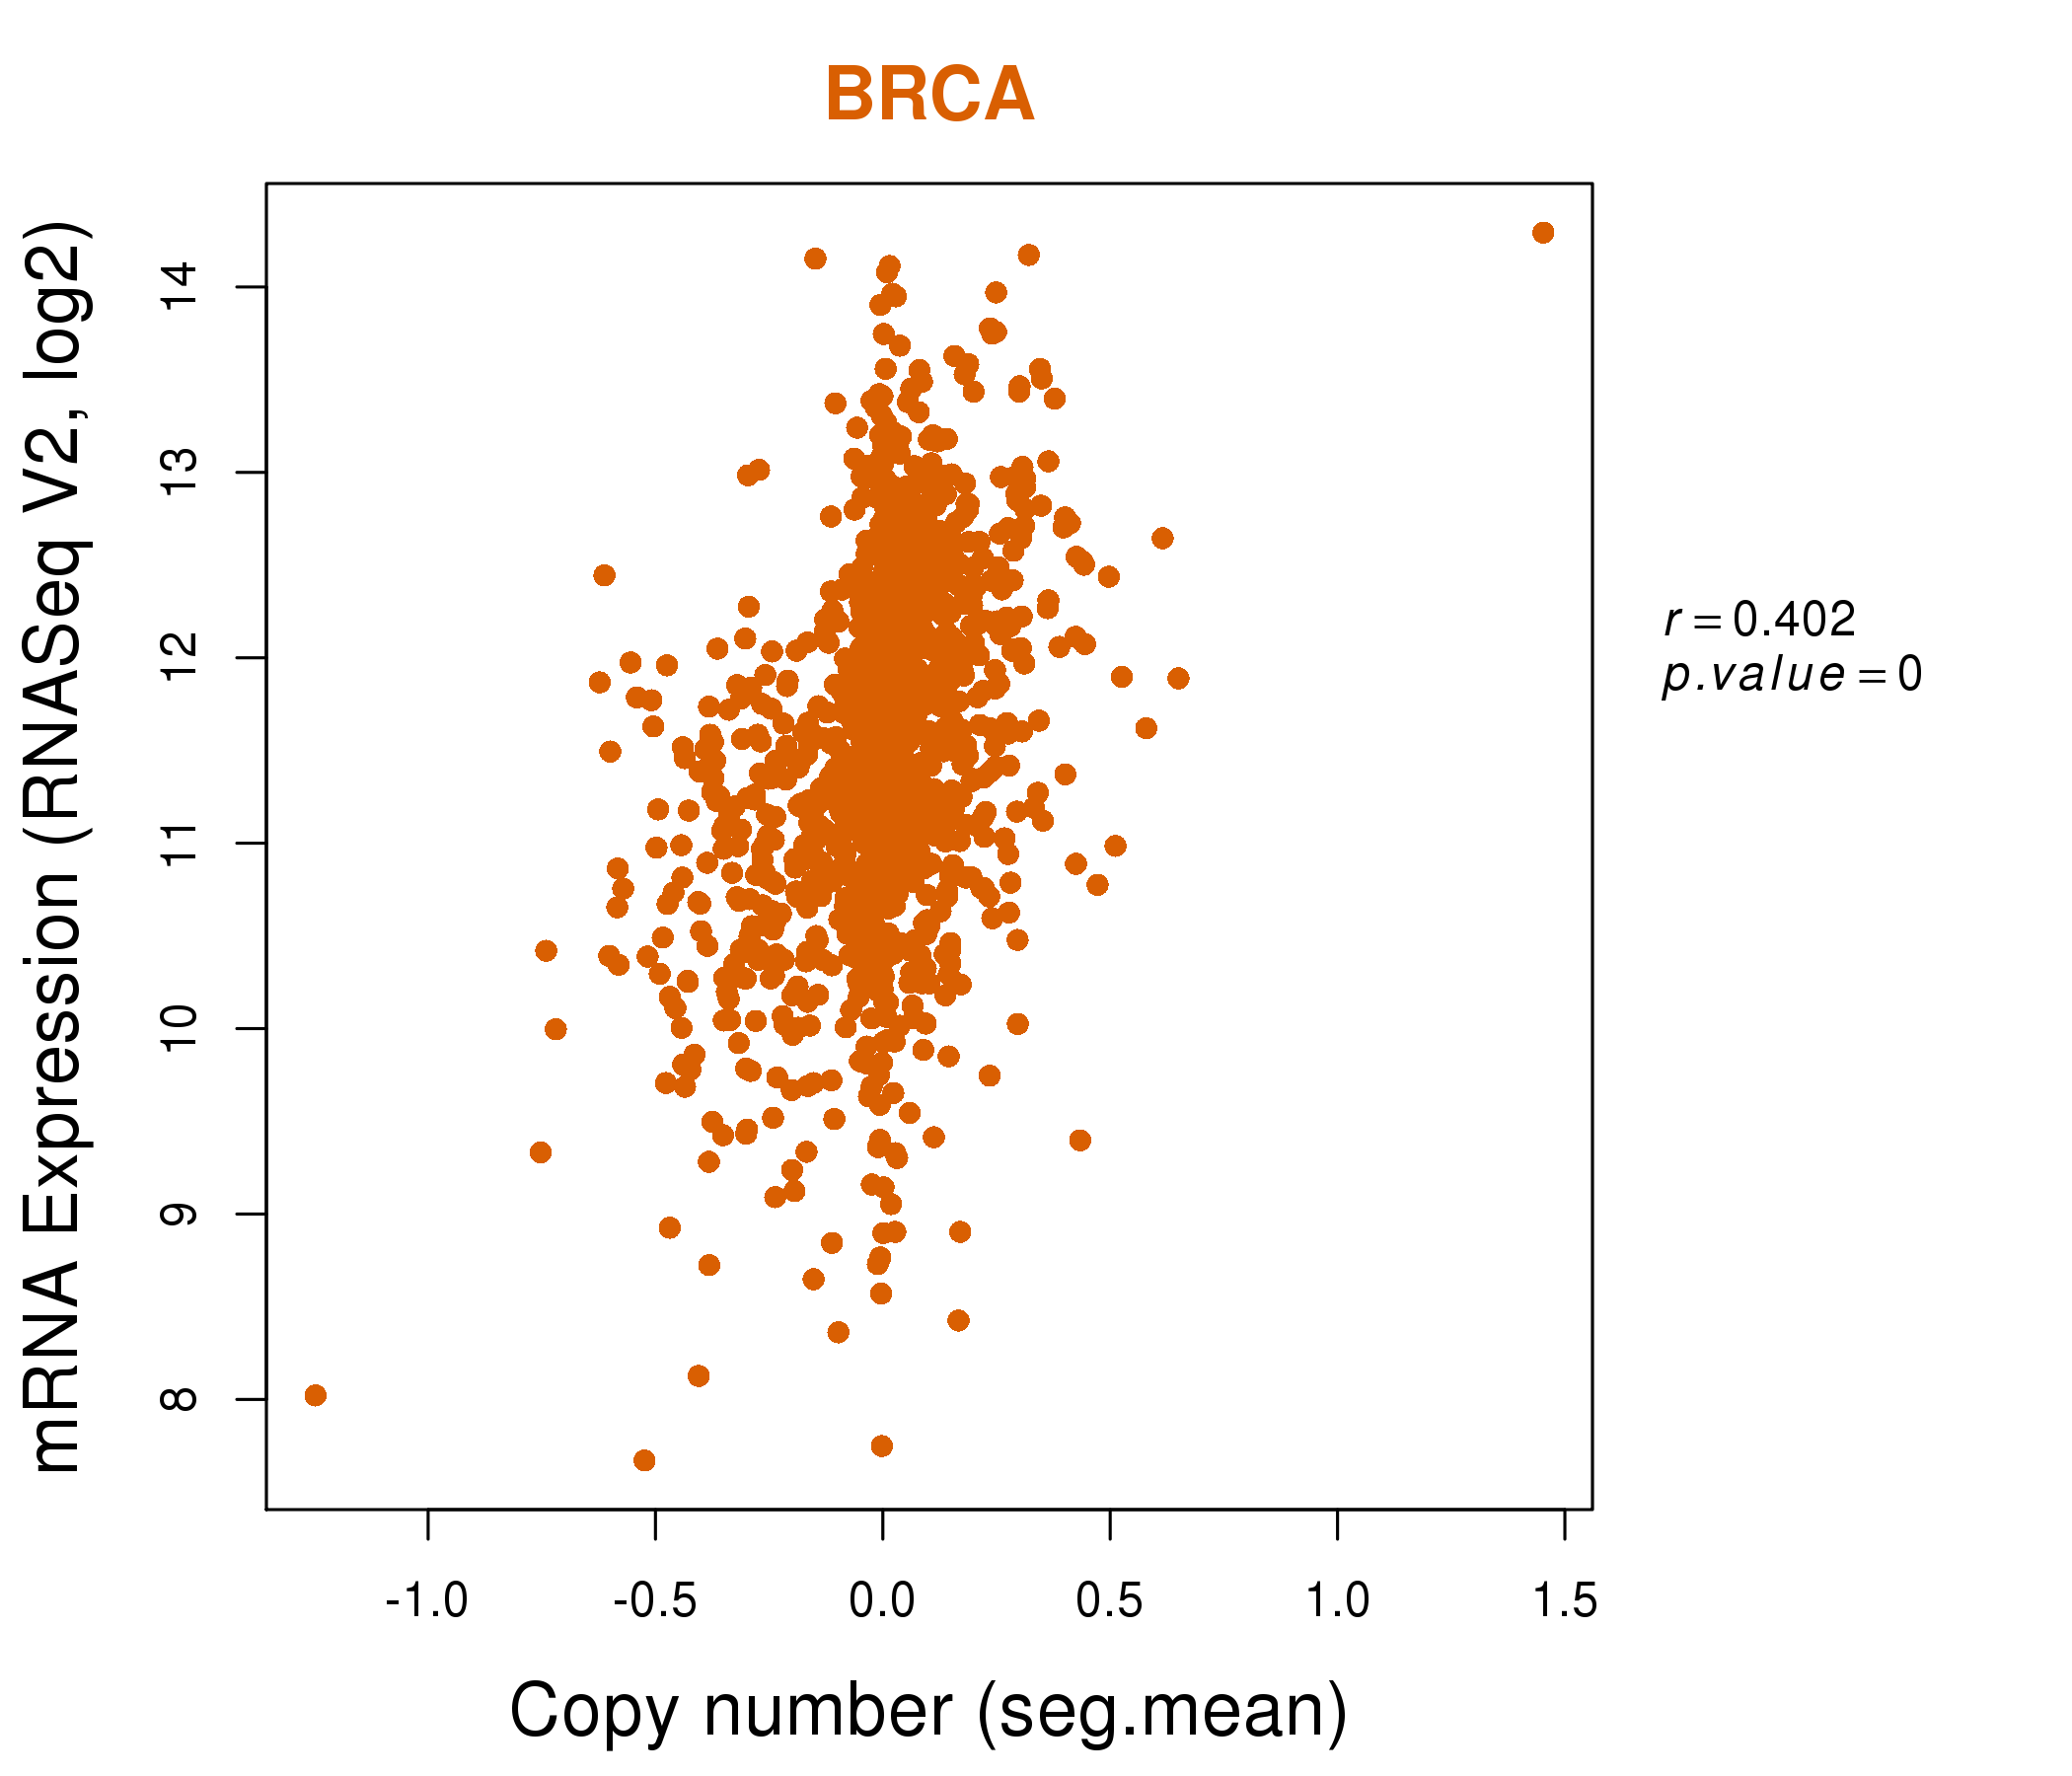
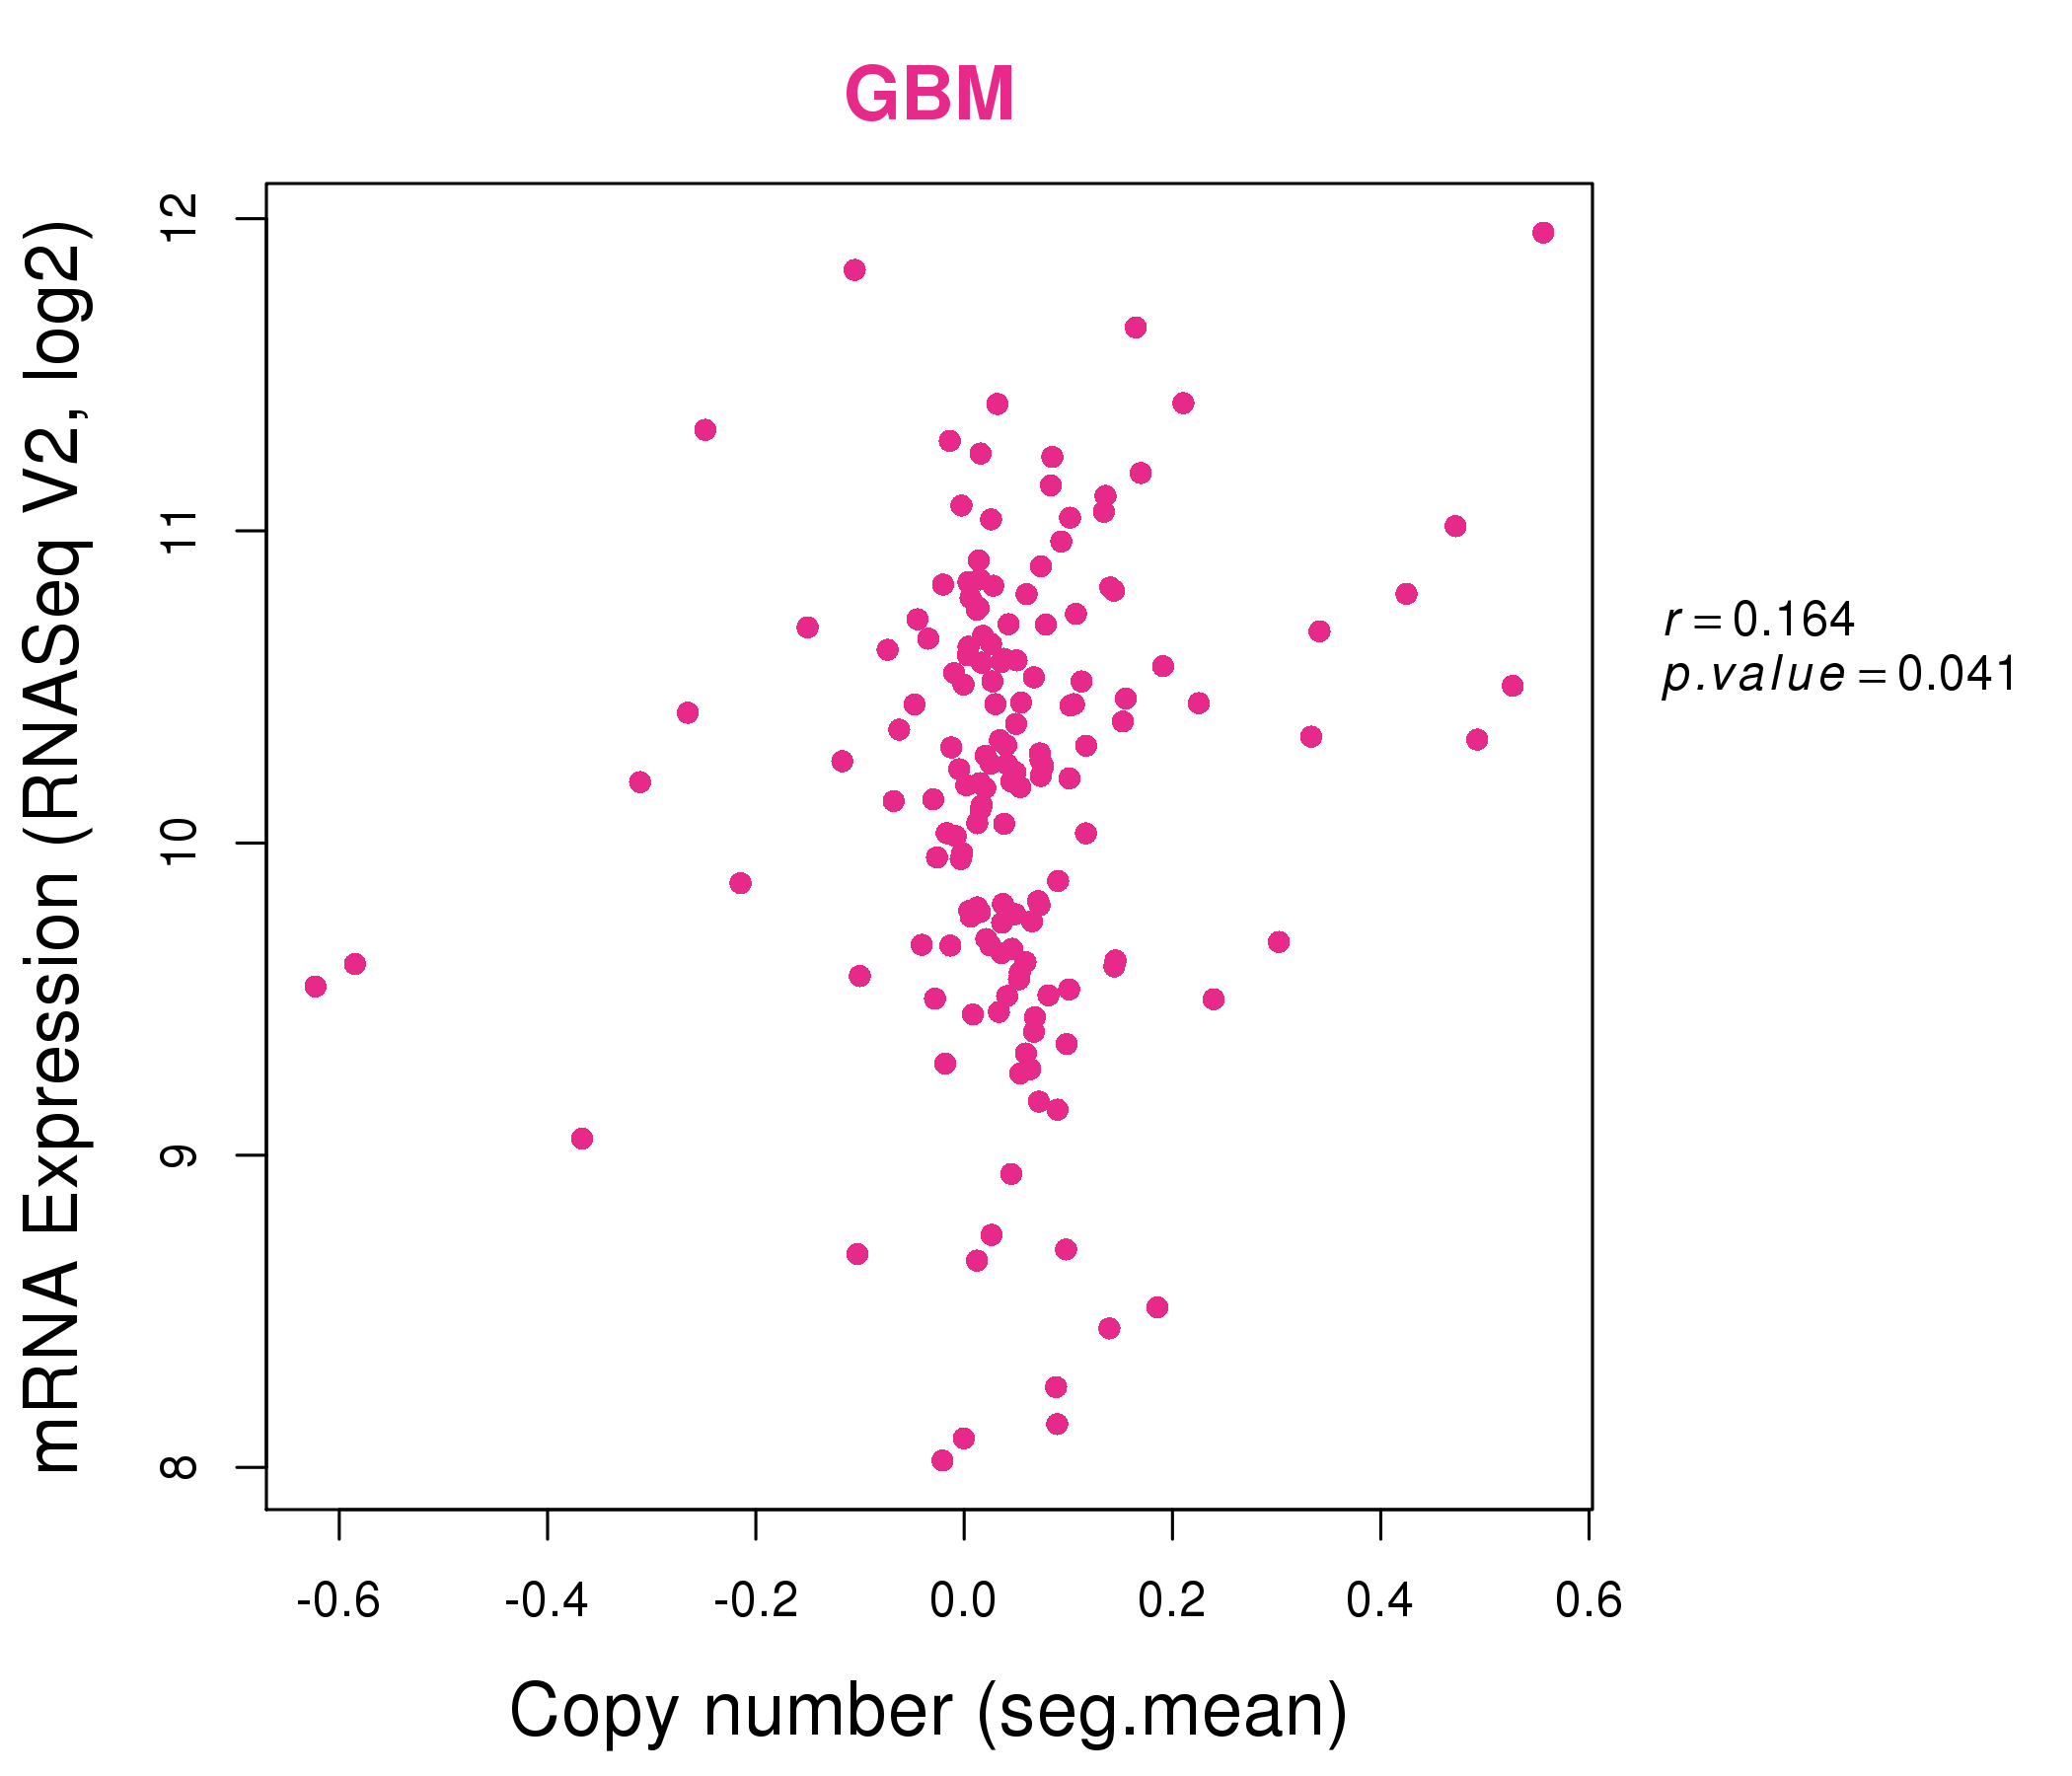
| * Normalized gene expression data of RNASeqV2 was extracted from TCGA using R package TCGA-Assembler. The URLs of all public data files on TCGA DCC data server were gathered at Jan-05-2015. Only eight cancer types have enough normal control samples for differential expression analysis. (t test, adjusted p<0.05 (using Benjamini-Hochberg FDR)) |
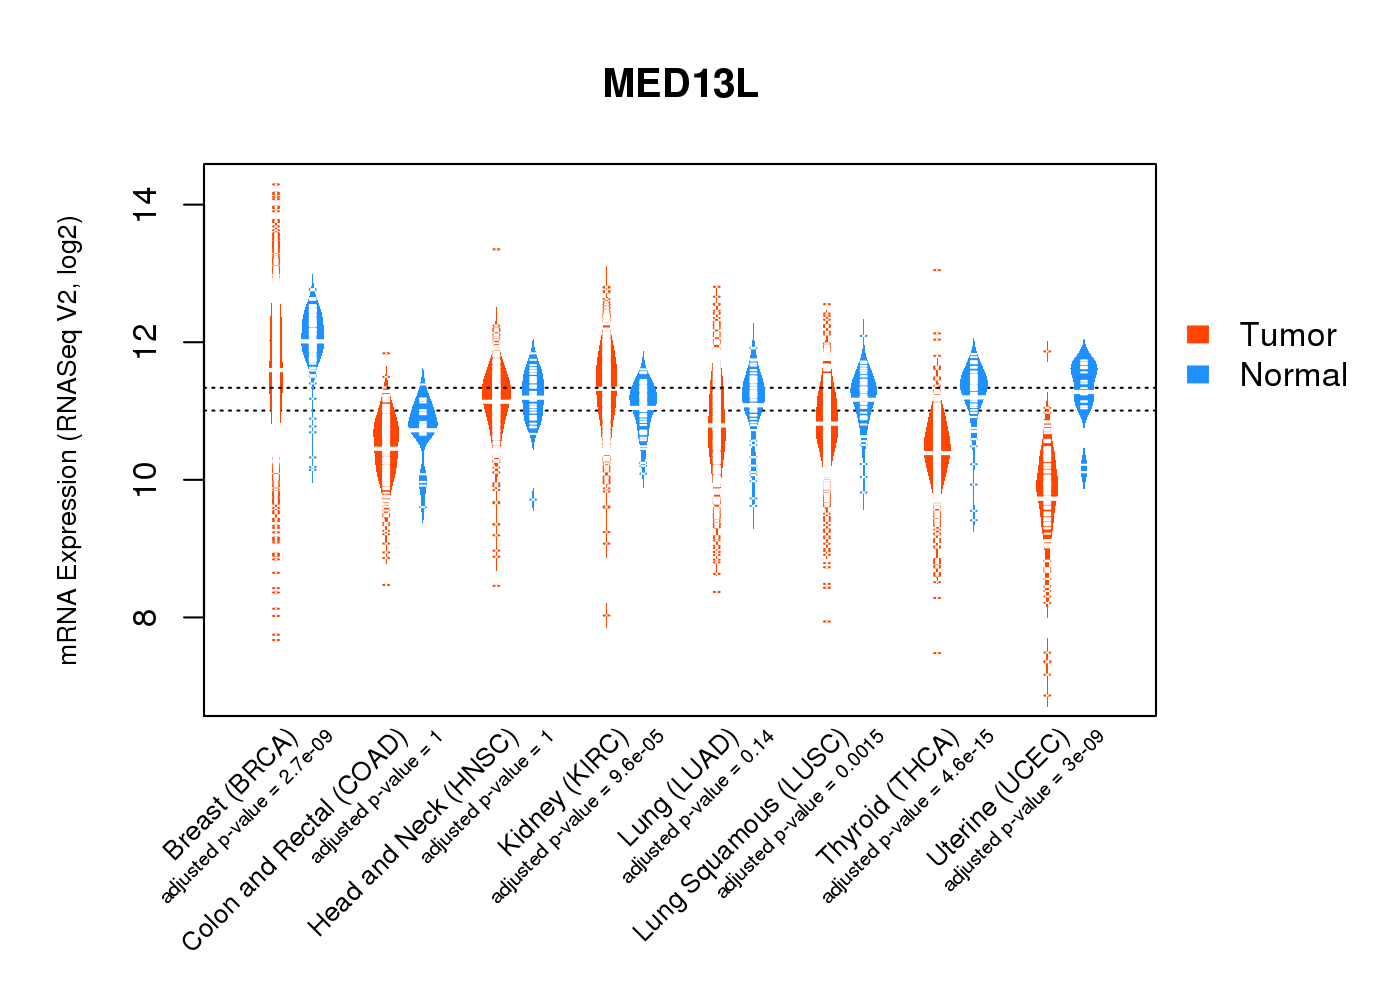 |
| Top |
| * This plots show the correlation between CNV and gene expression. |
: Open all plots for all cancer types
 |
|
 |
|
| Top |
| Gene-Gene Network Information |
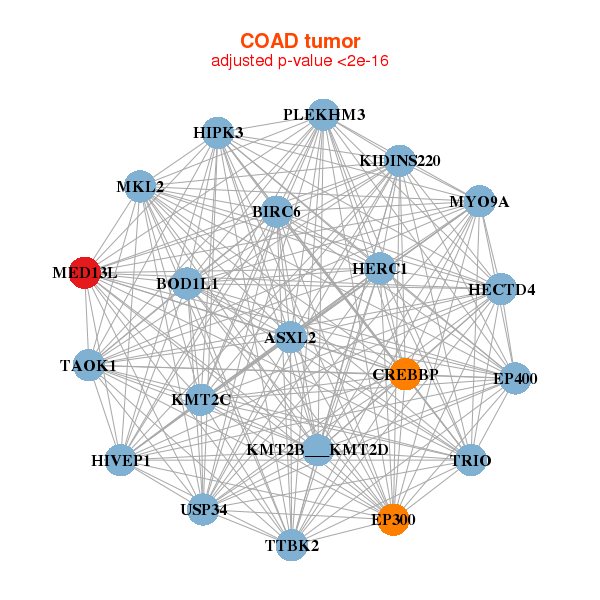
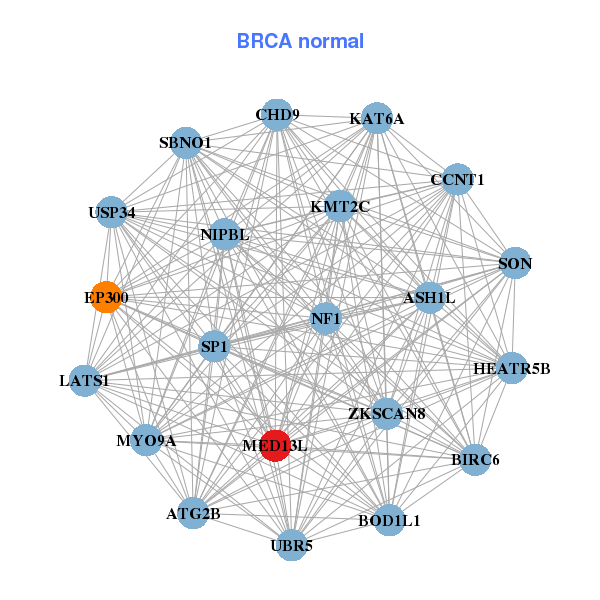
| * Co-Expression network figures were drawn using R package igraph. Only the top 20 genes with the highest correlations were shown. Red circle: input gene, orange circle: cell metabolism gene, sky circle: other gene |
: Open all plots for all cancer types
 |
|
| AFF4,ATXN2,BAZ2A,HECTD4,CREBRF,CLASP2,CPEB2, CSNK1G3,DMXL1,FAM73A,HEATR5B,KIAA1109,KLHL11,LRBA, MED13L,NEK4,RAD50,TBC1D12,TBC1D9,THSD4,ZFX | ASH1L,ATG2B,BIRC6,BOD1L1,CCNT1,CHD9,EP300, HEATR5B,LATS1,MED13L,KMT2C,MYO9A,KAT6A,NF1, NIPBL,SBNO1,SON,SP1,UBR5,USP34,ZKSCAN8 |
 |
|
| ASXL2,BIRC6,BOD1L1,HECTD4,CREBBP,EP300,EP400, HERC1,HIPK3,HIVEP1,KIDINS220,MED13L,MKL2,KMT2B___KMT2D, KMT2C,MYO9A,PLEKHM3,TAOK1,TRIO,TTBK2,USP34 | ASH1L,ATXN1L,BOD1L1,HECTD4,CHD2,CREBBP,EP300, GIGYF2,GON4L,GPATCH8,HELZ,MED13L,KMT2C,KMT2A, KAT6A,KAT6B,NR2C2,POGZ,SMG6,TUG1,USP34 |
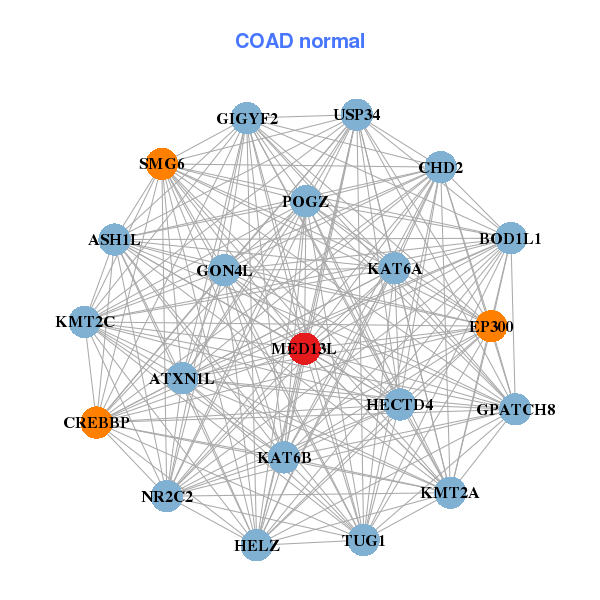
| * Co-Expression network figures were drawn using R package igraph. Only the top 20 genes with the highest correlations were shown. Red circle: input gene, orange circle: cell metabolism gene, sky circle: other gene |
: Open all plots for all cancer types
| Top |
: Open all interacting genes' information including KEGG pathway for all interacting genes from DAVID
| Top |
| Pharmacological Information for MED13L |
| There's no related Drug. |
| Top |
| Cross referenced IDs for MED13L |
| * We obtained these cross-references from Uniprot database. It covers 150 different DBs, 18 categories. http://www.uniprot.org/help/cross_references_section |
: Open all cross reference information
|
Copyright © 2016-Present - The Univsersity of Texas Health Science Center at Houston @ |