|
||||||||||||||||||||||||||||||||||||||||||||||||||||||||||||||||||||||||||||||||||||||||||||||||||||||||||||||||||||||||||||||||||||||||||||||||||||||||||||||||||||||||||||||||||||||||||||||||||||||||||||||||||||||||||||||||||||||||||||||||||||||||||||||||||||||||||||||||||||||||||||||||||||||||||||||||||||||||||
| |
| Phenotypic Information (metabolism pathway, cancer, disease, phenome) |
| |
| |
| Gene-Gene Network Information: Co-Expression Network, Interacting Genes & KEGG |
| |
|


| Gene Summary for SLC44A1 |
| Top |
| Phenotypic Information for SLC44A1(metabolism pathway, cancer, disease, phenome) |
| Cancer | CGAP: SLC44A1 |
| Familial Cancer Database: SLC44A1 | |
| * This gene is included in those cancer gene databases. |
|
|
|
|
|
|
| ||||||||||||||||||||||||||||||||||||||||||||||||||||||||||||||||||||||||||||||||||||||||||||||||||||||||||||||||||||||||||||||||||||||||||||||||||||||||||||||||||||||||||||||||||||||||||||||||||||||||||||||||||||||||||||||||||||||||||||||||||||||||||||||||||||||||||||||||||||||||||||||||||||||||||||||||||||
Oncogene 1 | Significant driver gene in | |||||||||||||||||||||||||||||||||||||||||||||||||||||||||||||||||||||||||||||||||||||||||||||||||||||||||||||||||||||||||||||||||||||||||||||||||||||||||||||||||||||||||||||||||||||||||||||||||||||||||||||||||||||||||||||||||||||||||||||||||||||||||||||||||||||||||||||||||||||||||||||||||||||||||||||||||||||||||
| cf) number; DB name 1 Oncogene; http://nar.oxfordjournals.org/content/35/suppl_1/D721.long, 2 Tumor Suppressor gene; https://bioinfo.uth.edu/TSGene/, 3 Cancer Gene Census; http://www.nature.com/nrc/journal/v4/n3/abs/nrc1299.html, 4 CancerGenes; http://nar.oxfordjournals.org/content/35/suppl_1/D721.long, 5 Network of Cancer Gene; http://ncg.kcl.ac.uk/index.php, 1Therapeutic Vulnerabilities in Cancer; http://cbio.mskcc.org/cancergenomics/statius/ |
| REACTOME_PHOSPHOLIPID_METABOLISM REACTOME_METABOLISM_OF_LIPIDS_AND_LIPOPROTEINS | |
| OMIM | 606105; gene. |
| Orphanet | |
| Disease | KEGG Disease: SLC44A1 |
| MedGen: SLC44A1 (Human Medical Genetics with Condition) | |
| ClinVar: SLC44A1 | |
| Phenotype | MGI: SLC44A1 (International Mouse Phenotyping Consortium) |
| PhenomicDB: SLC44A1 | |
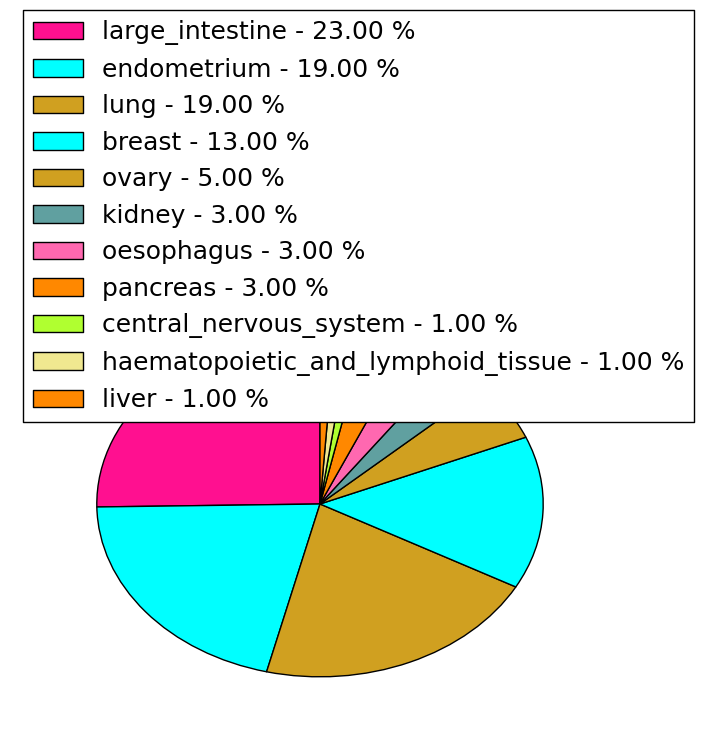
| Mutations for SLC44A1 |
| * Under tables are showing count per each tissue to give us broad intuition about tissue specific mutation patterns.You can go to the detailed page for each mutation database's web site. |
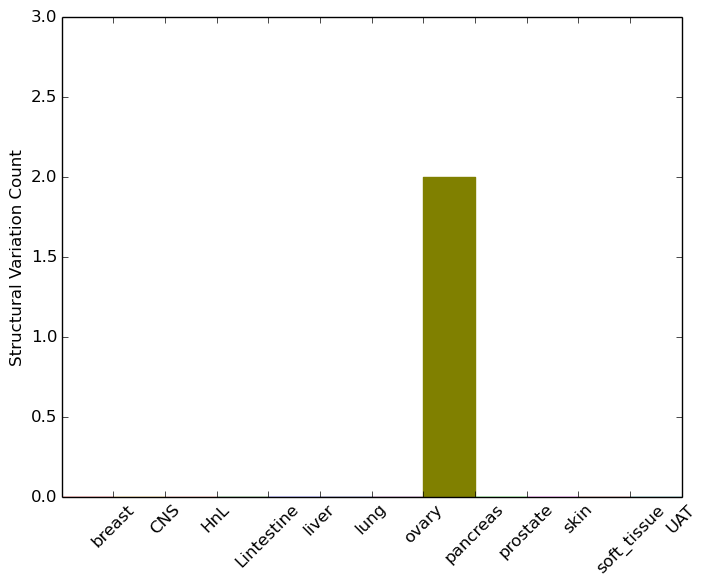
| - Statistics for Tissue and Mutation type | Top |
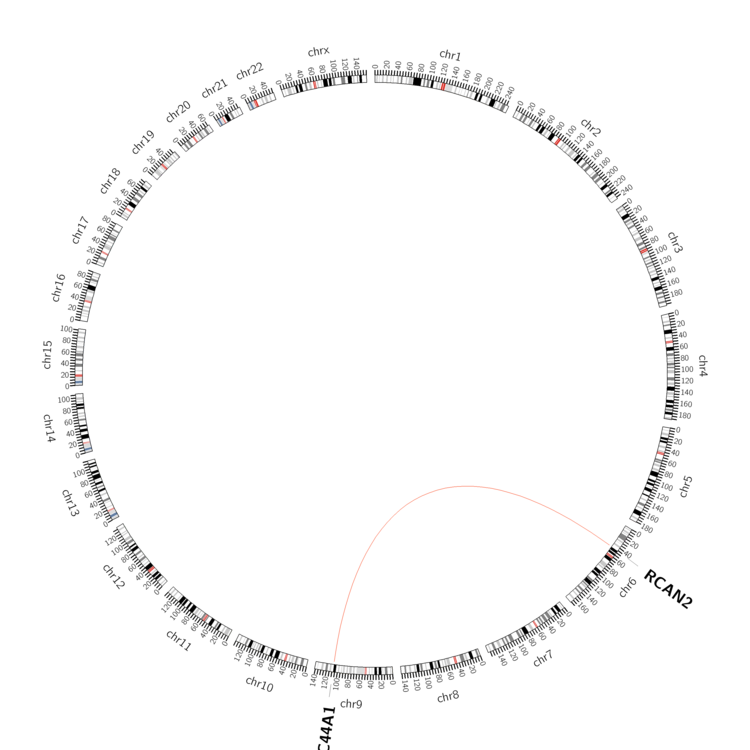 |
| - For Inter-chromosomal Variations |
| * Inter-chromosomal variantions includes 'interchromosomal amplicon to amplicon', 'interchromosomal amplicon to non-amplified dna', 'interchromosomal insertion', 'Interchromosomal unknown type'. |
 |
| - For Intra-chromosomal Variations |
| There's no intra-chromosomal structural variation. |
| Sample | Symbol_a | Chr_a | Start_a | End_a | Symbol_b | Chr_b | Start_b | End_b |
| pancreas | SLC44A1 | chr9 | 108007269 | 108007289 | RCAN2 | chr6 | 46452129 | 46452149 |
| cf) Tissue number; Tissue name (1;Breast, 2;Central_nervous_system, 3;Haematopoietic_and_lymphoid_tissue, 4;Large_intestine, 5;Liver, 6;Lung, 7;Ovary, 8;Pancreas, 9;Prostate, 10;Skin, 11;Soft_tissue, 12;Upper_aerodigestive_tract) |
| * From mRNA Sanger sequences, Chitars2.0 arranged chimeric transcripts. This table shows SLC44A1 related fusion information. |
| ID | Head Gene | Tail Gene | Accession | Gene_a | qStart_a | qEnd_a | Chromosome_a | tStart_a | tEnd_a | Gene_a | qStart_a | qEnd_a | Chromosome_a | tStart_a | tEnd_a |
| CD050630 | NOTCH2 | 22 | 271 | 1 | 120612011 | 120612259 | SLC44A1 | 264 | 480 | 9 | 108007210 | 108007437 | |
| BX504871 | SLC44A1 | 1 | 148 | 9 | 108132314 | 108132461 | KDM2A | 132 | 233 | 11 | 67025031 | 67025132 | |
| C02459 | SLC44A1 | 1 | 146 | 9 | 108152447 | 108152591 | SLC44A1 | 140 | 348 | 9 | 108153184 | 108153392 | |
| Top |
| Mutation type/ Tissue ID | brca | cns | cerv | endome | haematopo | kidn | Lintest | liver | lung | ns | ovary | pancre | prost | skin | stoma | thyro | urina | |||
| Total # sample | 1 | 1 | ||||||||||||||||||
| GAIN (# sample) | 1 | 1 | ||||||||||||||||||
| LOSS (# sample) |
| cf) Tissue ID; Tissue type (1; Breast, 2; Central_nervous_system, 3; Cervix, 4; Endometrium, 5; Haematopoietic_and_lymphoid_tissue, 6; Kidney, 7; Large_intestine, 8; Liver, 9; Lung, 10; NS, 11; Ovary, 12; Pancreas, 13; Prostate, 14; Skin, 15; Stomach, 16; Thyroid, 17; Urinary_tract) |
| Top |
|
 |
| Top |
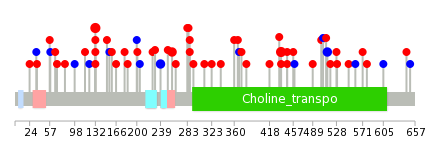
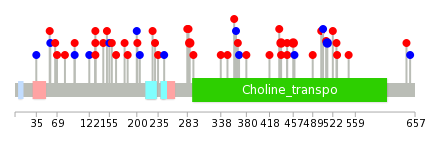
| Stat. for Non-Synonymous SNVs (# total SNVs=51) | (# total SNVs=12) |
 |  |
(# total SNVs=0) | (# total SNVs=0) |
| Top |
| * When you move the cursor on each content, you can see more deailed mutation information on the Tooltip. Those are primary_site,primary_histology,mutation(aa),pubmedID. |
| GRCh37 position | Mutation(aa) | Unique sampleID count |
| chr9:108097968-108097968 | p.A132T | 4 |
| chr9:108127819-108127819 | p.R437C | 3 |
| chr9:108123483-108123483 | p.V258L | 2 |
| chr9:108127850-108127850 | p.S447C | 2 |
| chr9:108097969-108097969 | p.A132V | 2 |
| chr9:108118629-108118629 | p.E213* | 2 |
| chr9:108120671-108120671 | p.V239V | 2 |
| chr9:108136923-108136923 | p.T513T | 2 |
| chr9:108125168-108125168 | p.V323I | 1 |
| chr9:108097858-108097858 | p.L95* | 1 |
| Top |
|
 |
| Point Mutation/ Tissue ID | 1 | 2 | 3 | 4 | 5 | 6 | 7 | 8 | 9 | 10 | 11 | 12 | 13 | 14 | 15 | 16 | 17 | 18 | 19 | 20 |
| # sample | 2 | 1 | 14 | 1 | 2 | 1 | 7 | 1 | 2 | 7 | 6 | 8 | ||||||||
| # mutation | 2 | 1 | 14 | 1 | 2 | 1 | 9 | 1 | 2 | 7 | 7 | 8 | ||||||||
| nonsynonymous SNV | 2 | 10 | 1 | 2 | 1 | 7 | 1 | 2 | 5 | 4 | 6 | |||||||||
| synonymous SNV | 1 | 4 | 2 | 2 | 3 | 2 |
| cf) Tissue ID; Tissue type (1; BLCA[Bladder Urothelial Carcinoma], 2; BRCA[Breast invasive carcinoma], 3; CESC[Cervical squamous cell carcinoma and endocervical adenocarcinoma], 4; COAD[Colon adenocarcinoma], 5; GBM[Glioblastoma multiforme], 6; Glioma Low Grade, 7; HNSC[Head and Neck squamous cell carcinoma], 8; KICH[Kidney Chromophobe], 9; KIRC[Kidney renal clear cell carcinoma], 10; KIRP[Kidney renal papillary cell carcinoma], 11; LAML[Acute Myeloid Leukemia], 12; LUAD[Lung adenocarcinoma], 13; LUSC[Lung squamous cell carcinoma], 14; OV[Ovarian serous cystadenocarcinoma ], 15; PAAD[Pancreatic adenocarcinoma], 16; PRAD[Prostate adenocarcinoma], 17; SKCM[Skin Cutaneous Melanoma], 18:STAD[Stomach adenocarcinoma], 19:THCA[Thyroid carcinoma], 20:UCEC[Uterine Corpus Endometrial Carcinoma]) |
| Top |
| * We represented just top 10 SNVs. When you move the cursor on each content, you can see more deailed mutation information on the Tooltip. Those are primary_site, primary_histology, mutation(aa), pubmedID. |
| Genomic Position | Mutation(aa) | Unique sampleID count |
| chr9:108097969 | p.T513T,SLC44A1 | 2 |
| chr9:108136923 | p.R437C,SLC44A1 | 2 |
| chr9:108123571 | p.S447C,SLC44A1 | 2 |
| chr9:108127819 | p.R457Q,SLC44A1 | 2 |
| chr9:108127850 | p.A132V,SLC44A1 | 2 |
| chr9:108127880 | p.R287L,SLC44A1 | 2 |
| chr9:108127887 | p.G360D,SLC44A1 | 1 |
| chr9:108147780 | p.A166V,SLC44A1 | 1 |
| chr9:108120631 | p.G363G,SLC44A1 | 1 |
| chr9:108061569 | p.L522V,SLC44A1 | 1 |
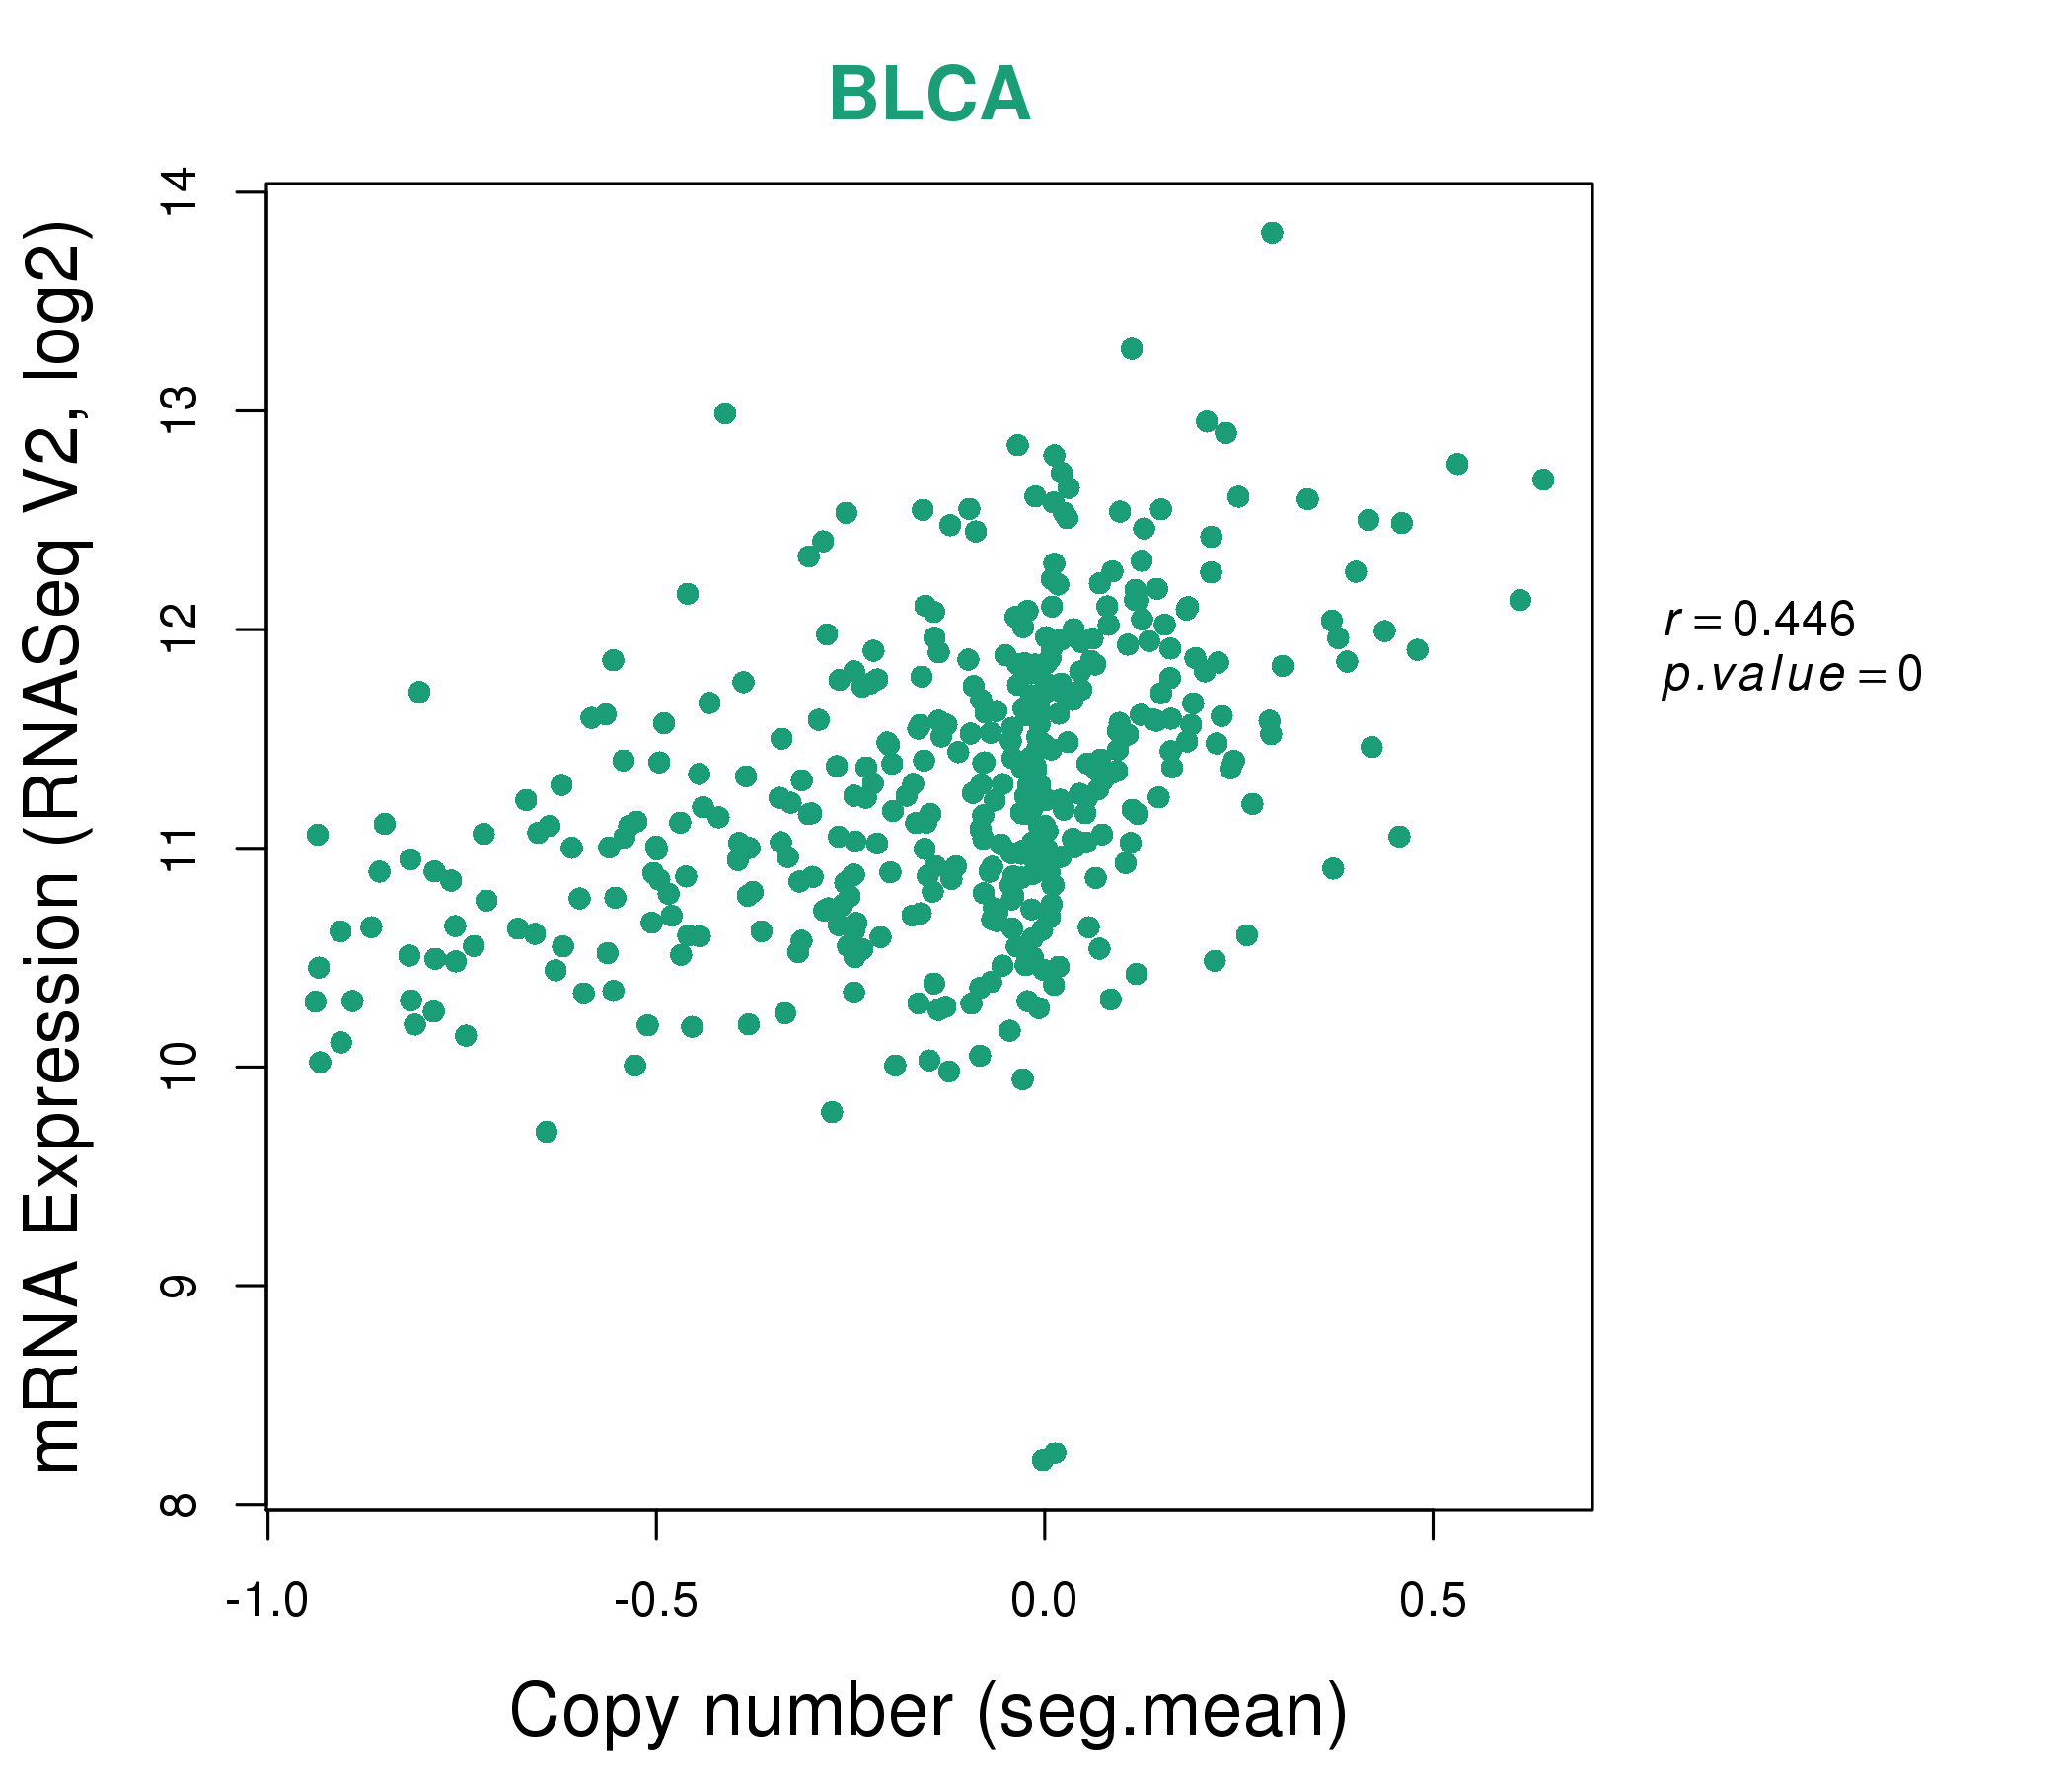
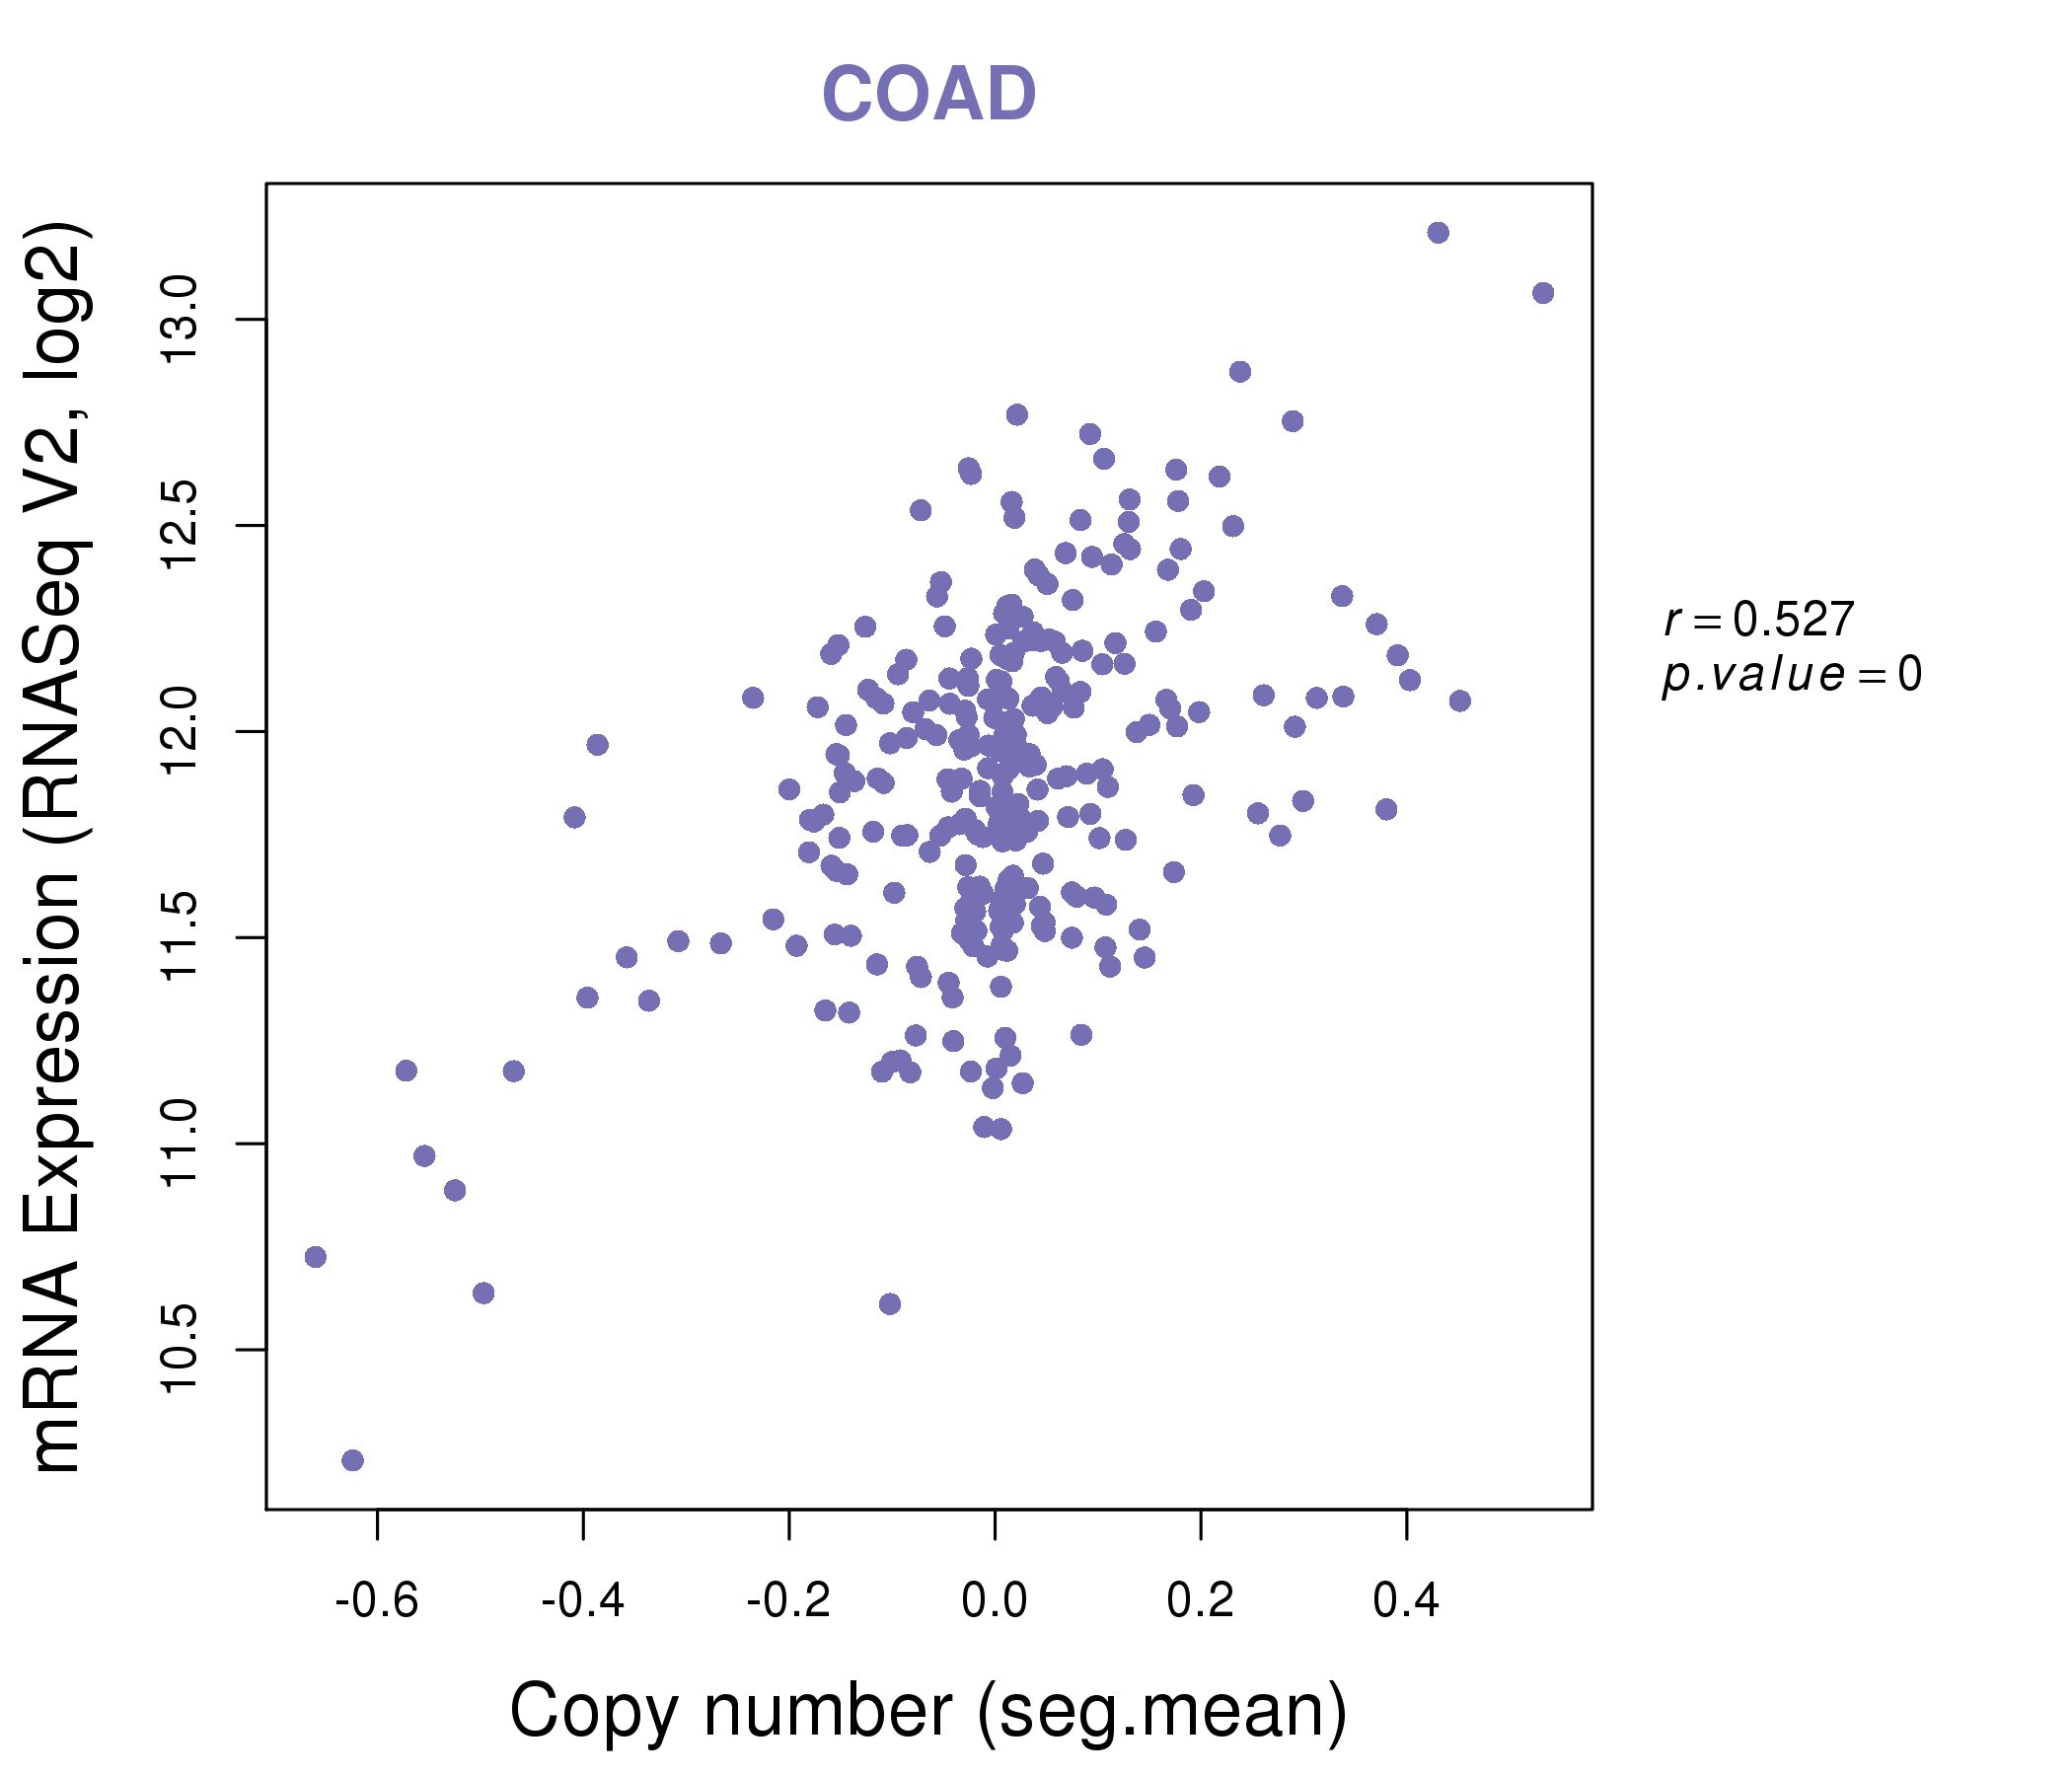
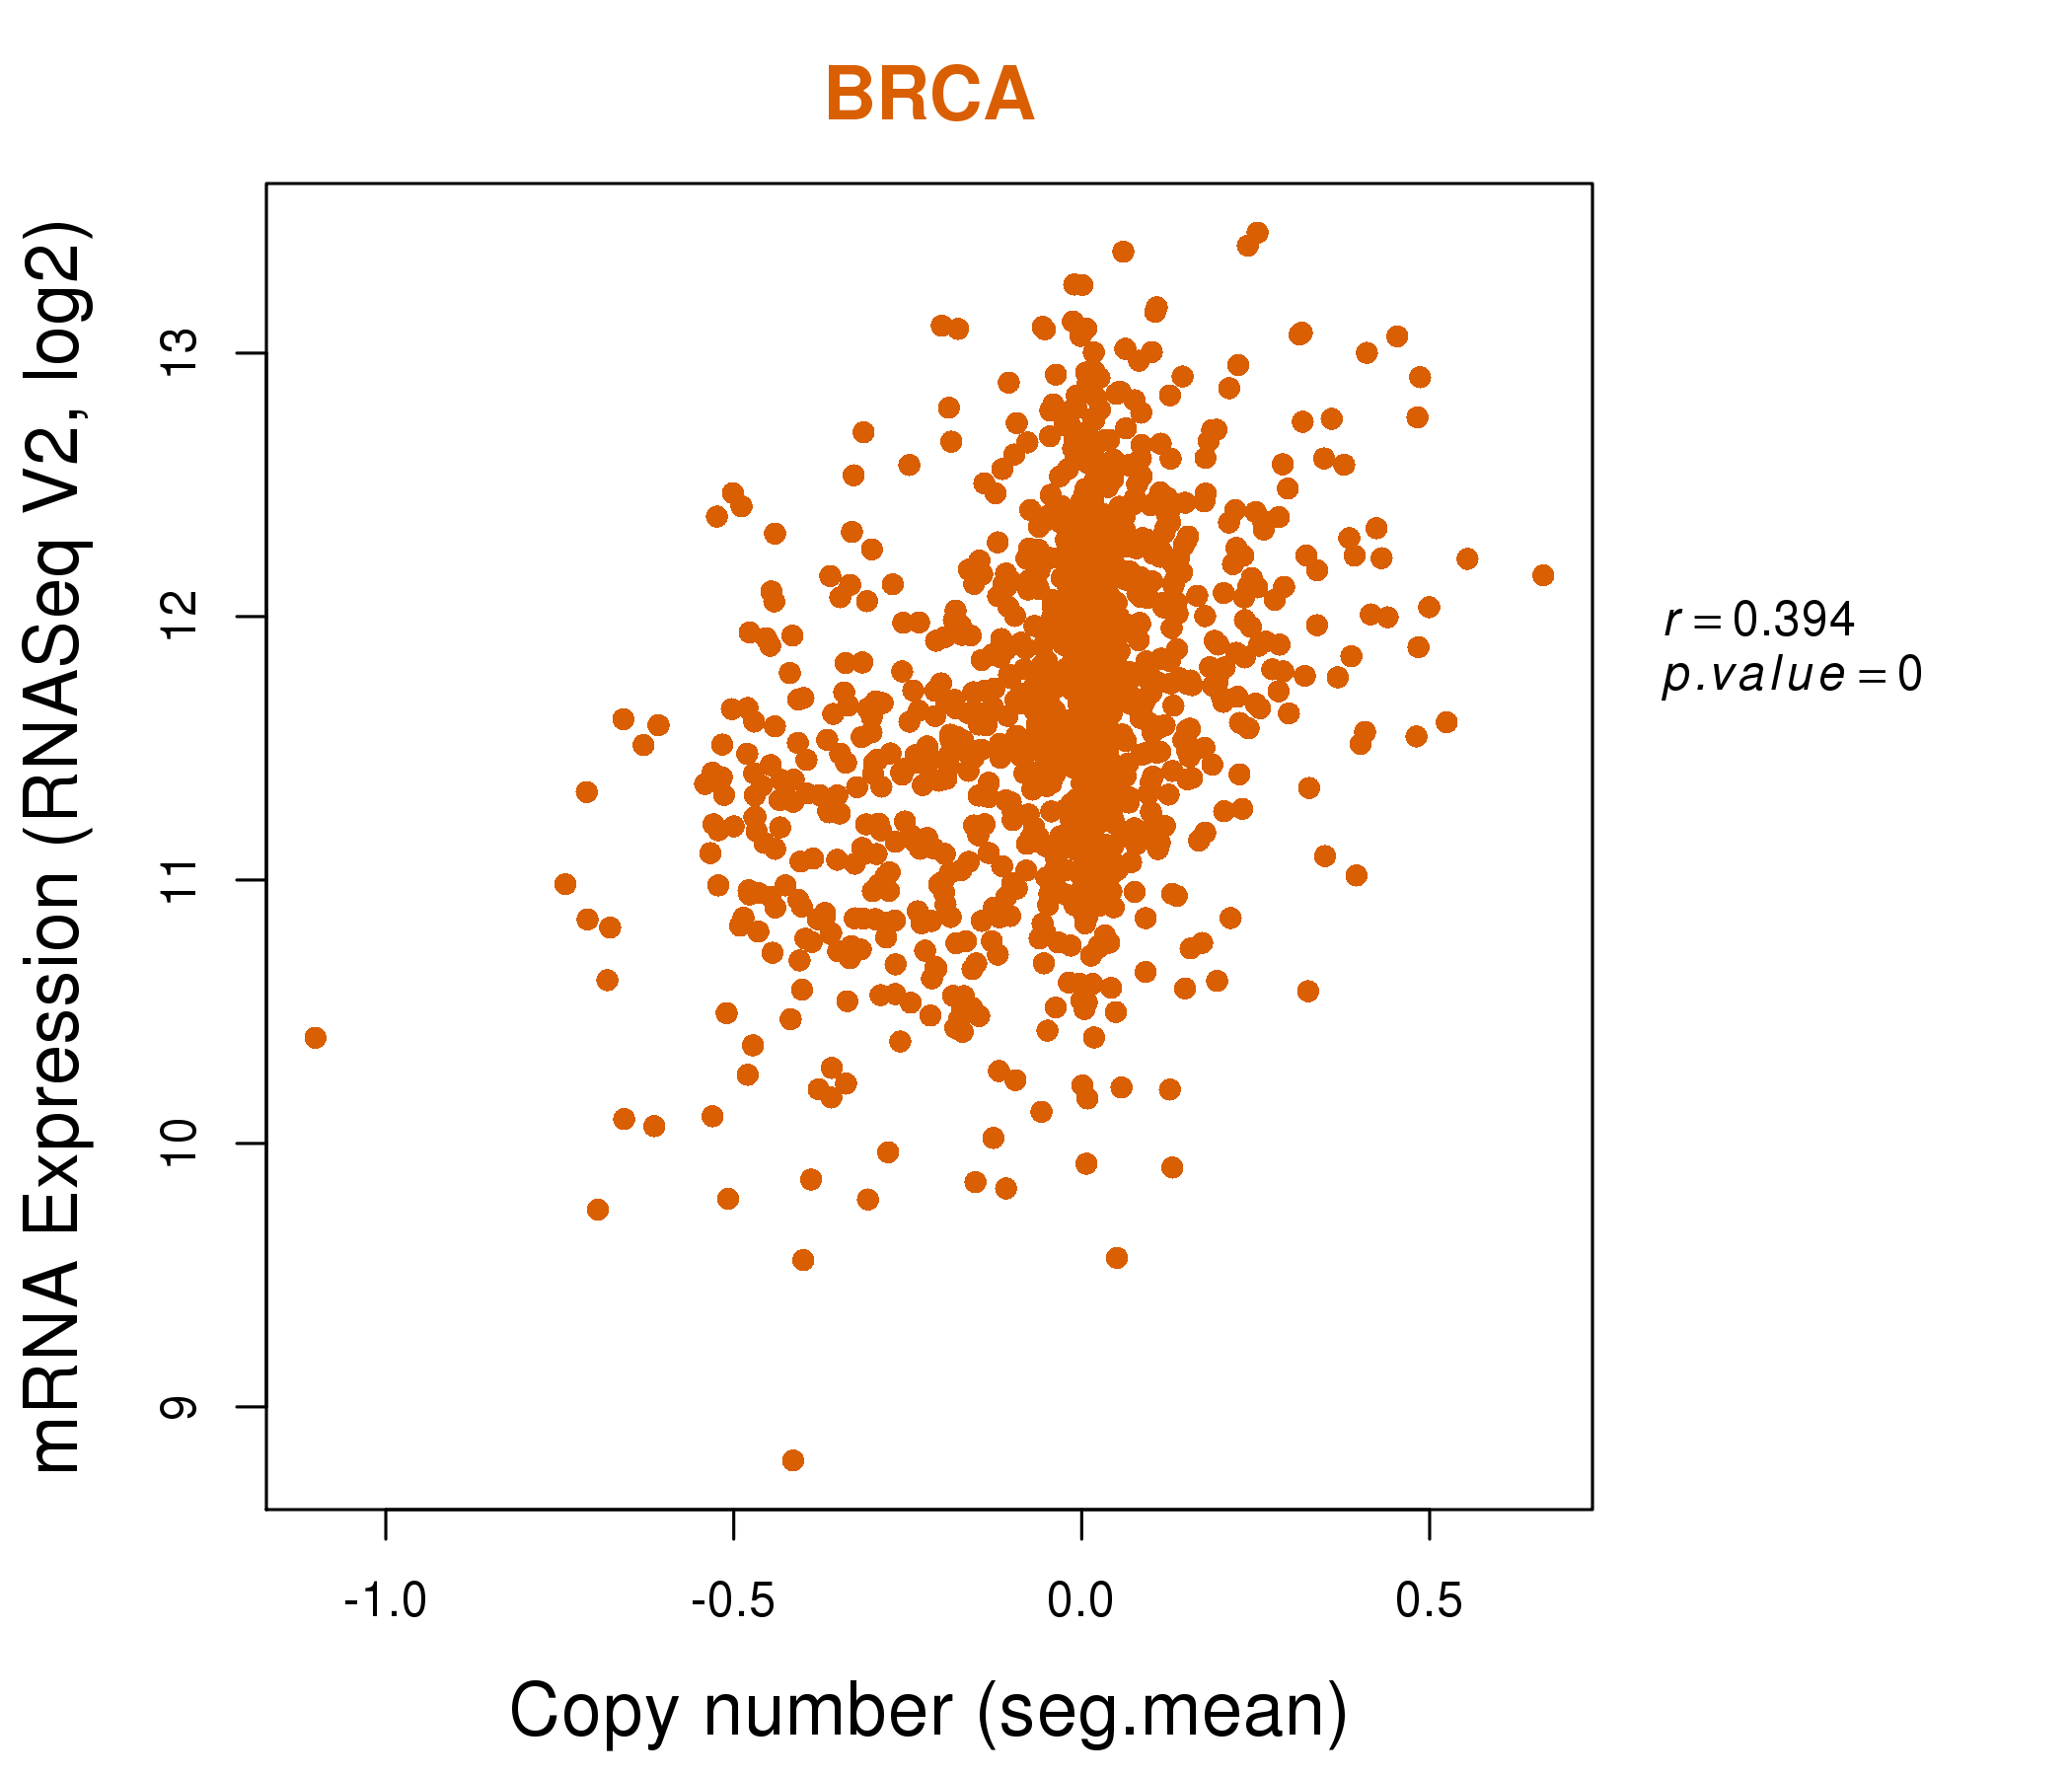
| * Copy number data were extracted from TCGA using R package TCGA-Assembler. The URLs of all public data files on TCGA DCC data server were gathered on Jan-05-2015. Function ProcessCNAData in TCGA-Assembler package was used to obtain gene-level copy number value which is calculated as the average copy number of the genomic region of a gene. |
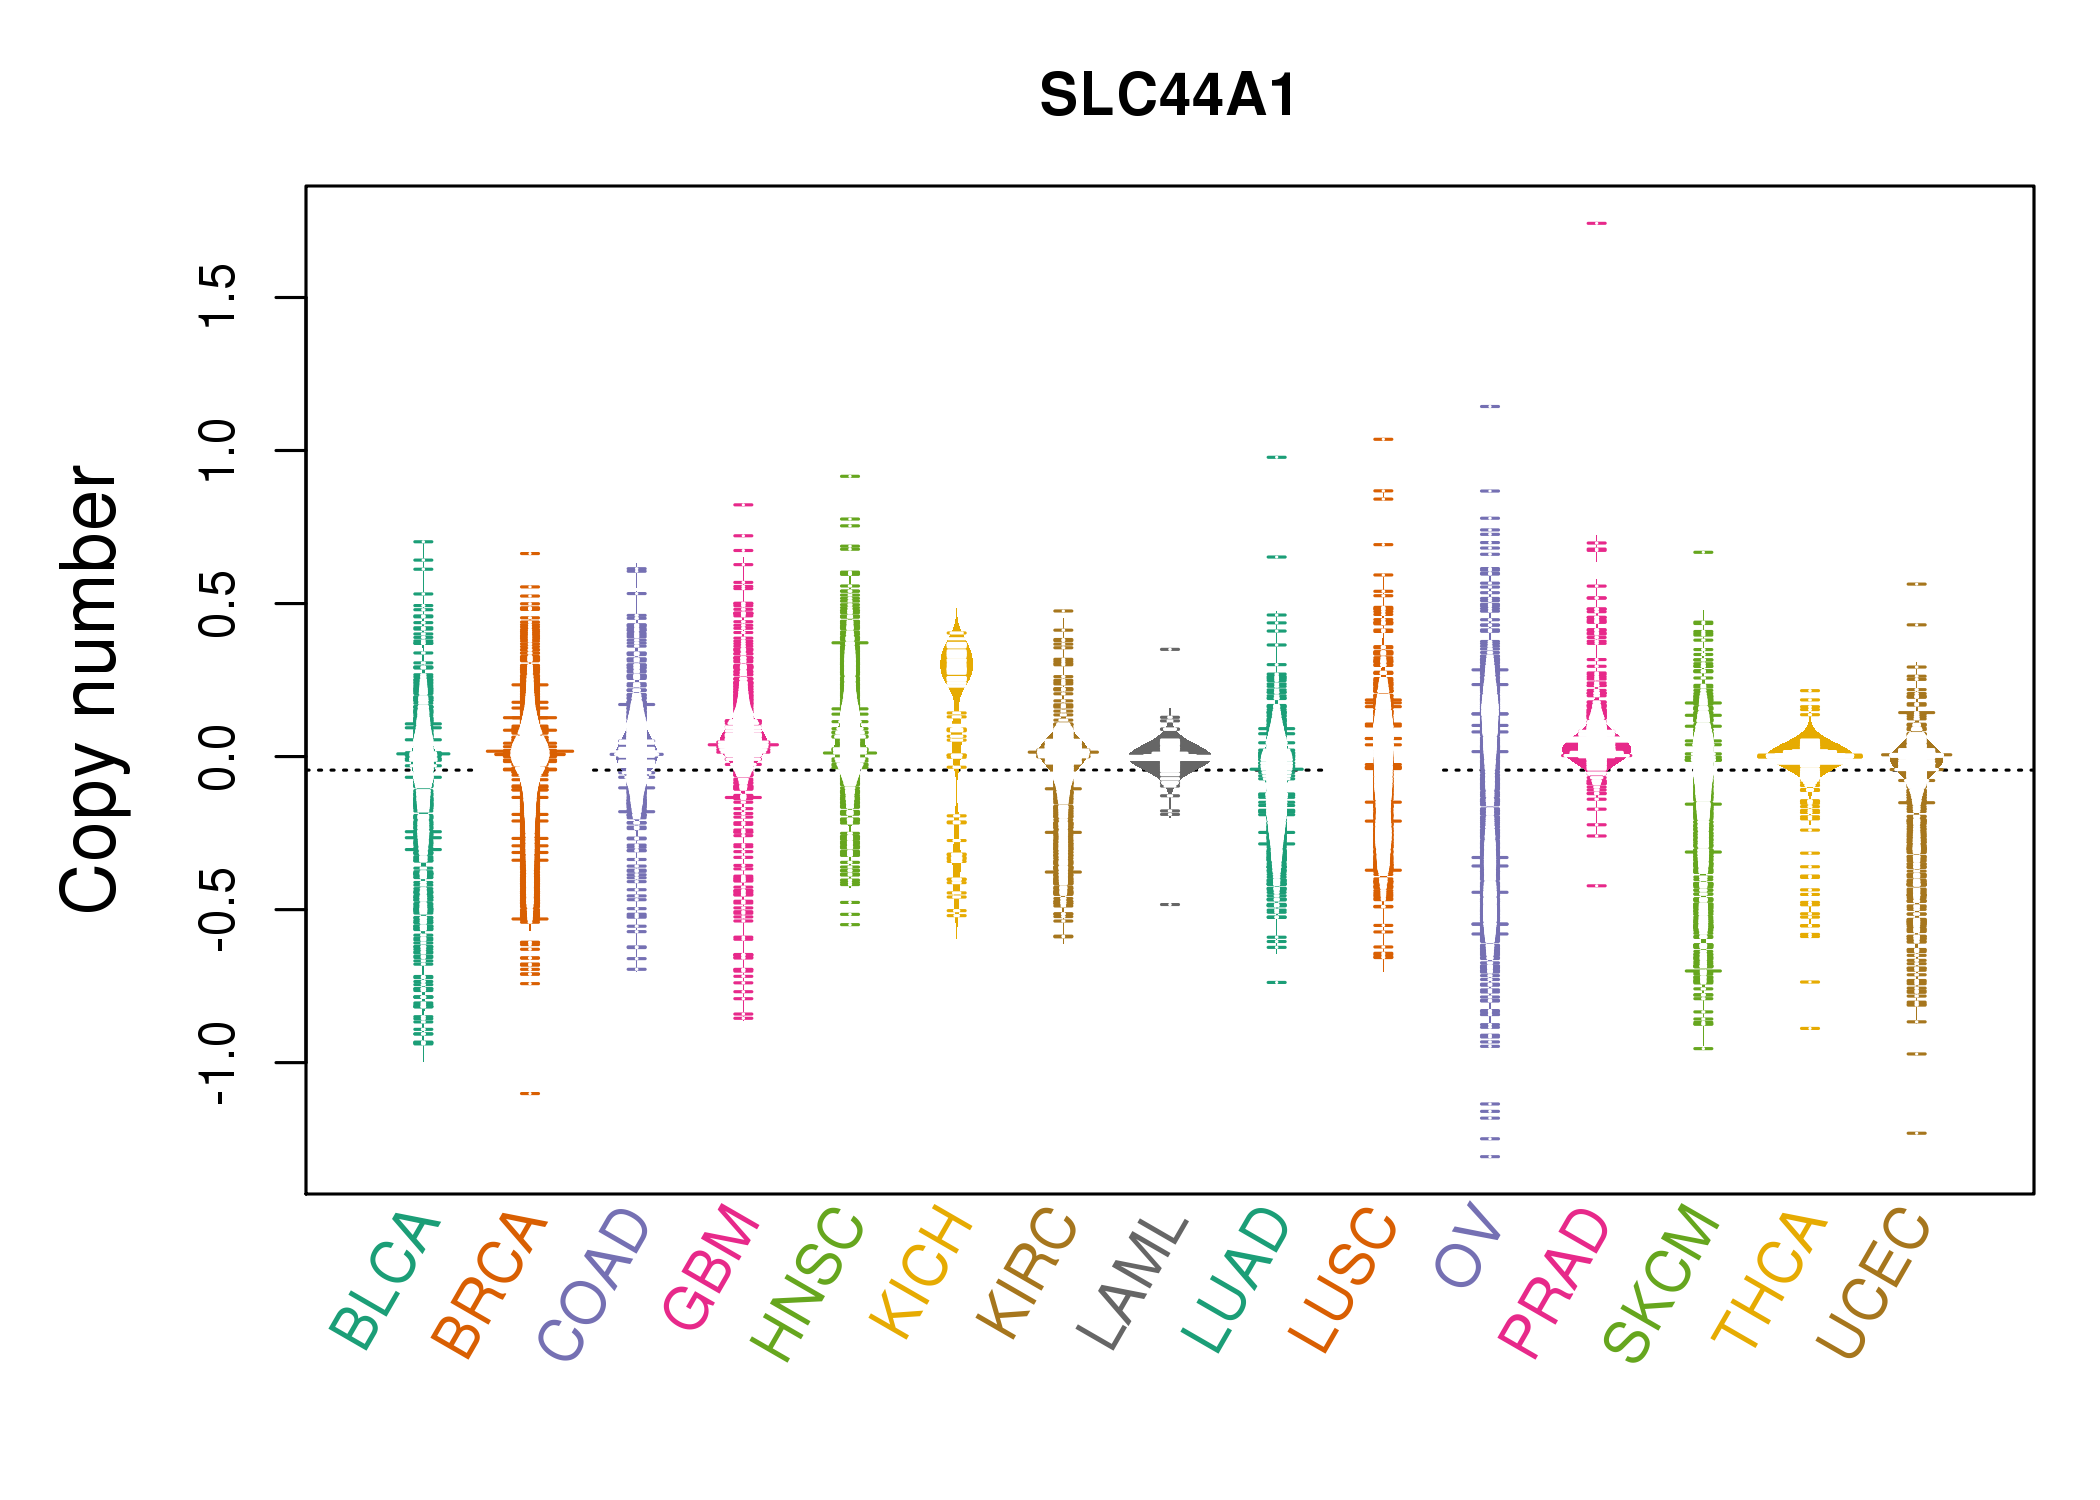 |
| cf) Tissue ID[Tissue type]: BLCA[Bladder Urothelial Carcinoma], BRCA[Breast invasive carcinoma], CESC[Cervical squamous cell carcinoma and endocervical adenocarcinoma], COAD[Colon adenocarcinoma], GBM[Glioblastoma multiforme], Glioma Low Grade, HNSC[Head and Neck squamous cell carcinoma], KICH[Kidney Chromophobe], KIRC[Kidney renal clear cell carcinoma], KIRP[Kidney renal papillary cell carcinoma], LAML[Acute Myeloid Leukemia], LUAD[Lung adenocarcinoma], LUSC[Lung squamous cell carcinoma], OV[Ovarian serous cystadenocarcinoma ], PAAD[Pancreatic adenocarcinoma], PRAD[Prostate adenocarcinoma], SKCM[Skin Cutaneous Melanoma], STAD[Stomach adenocarcinoma], THCA[Thyroid carcinoma], UCEC[Uterine Corpus Endometrial Carcinoma] |
| Top |
| Gene Expression for SLC44A1 |
| * CCLE gene expression data were extracted from CCLE_Expression_Entrez_2012-10-18.res: Gene-centric RMA-normalized mRNA expression data. |
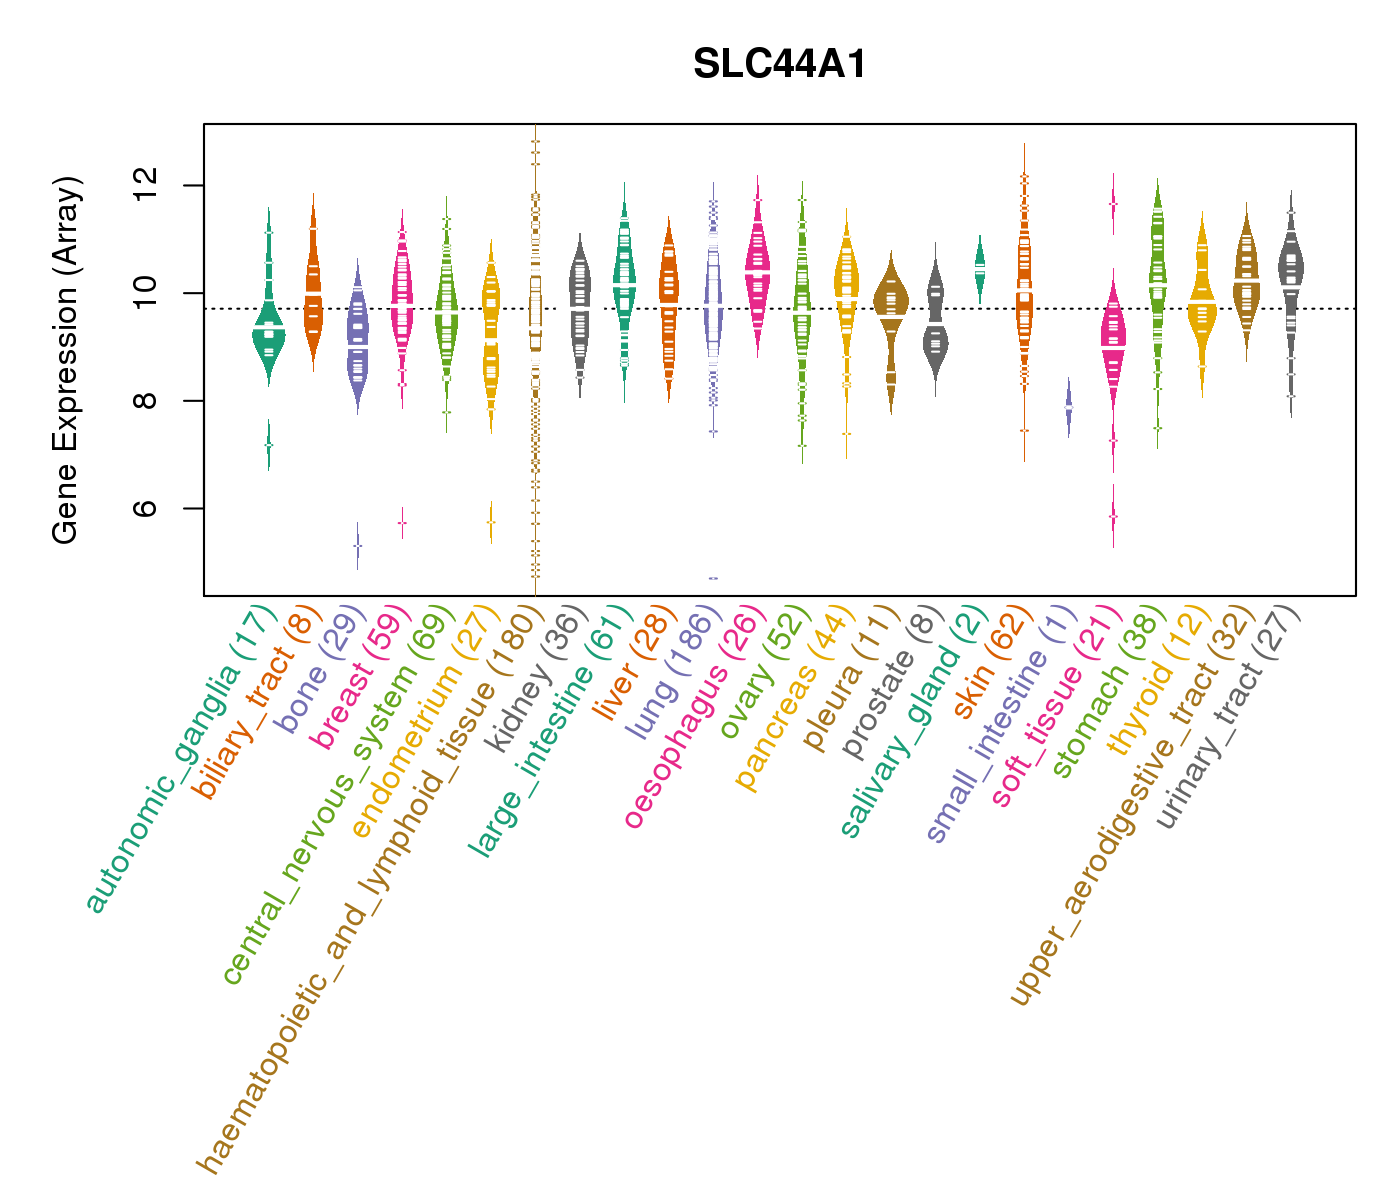 |
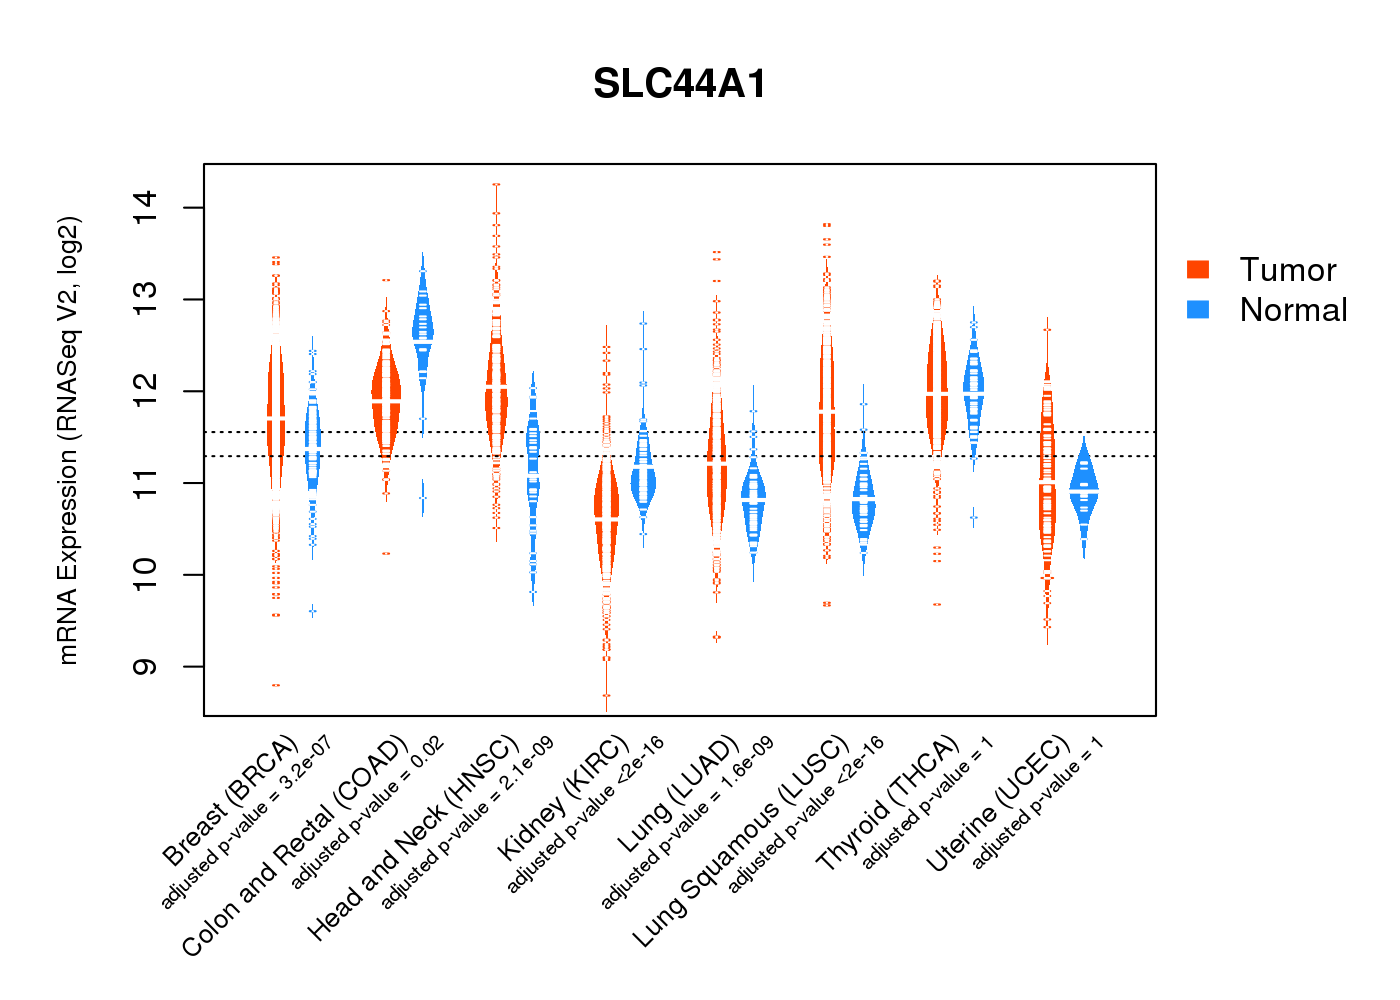
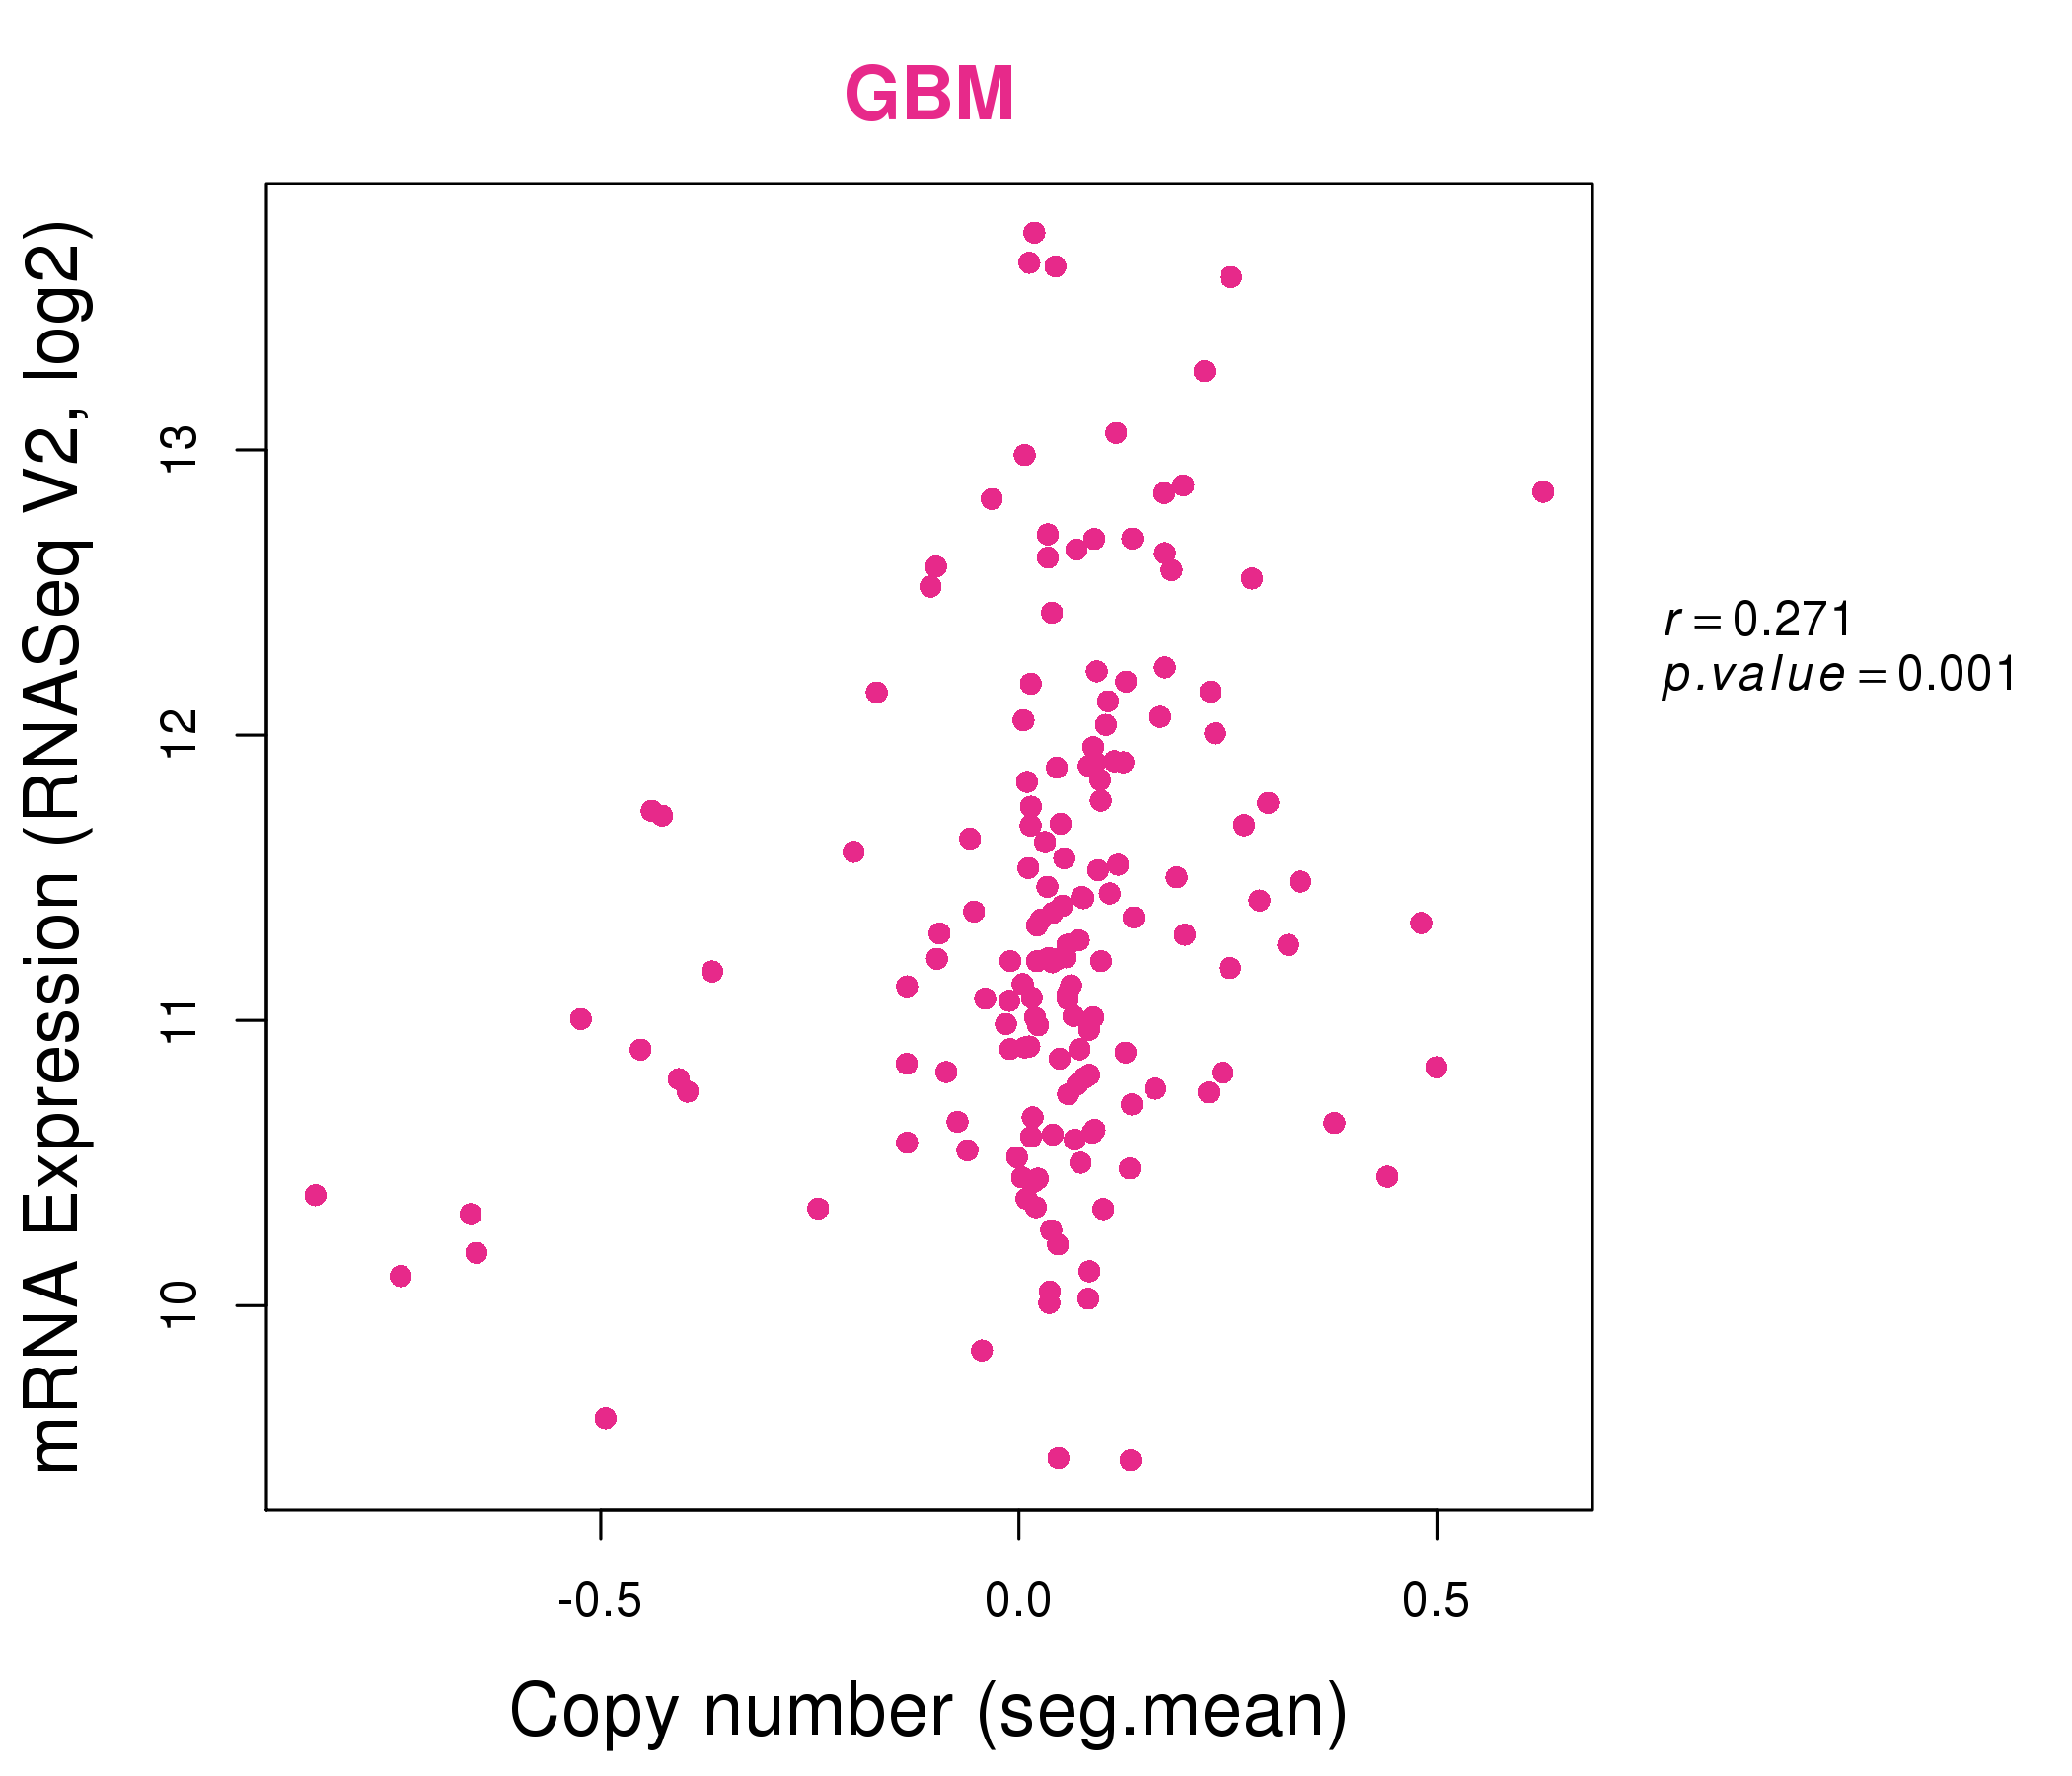
| * Normalized gene expression data of RNASeqV2 was extracted from TCGA using R package TCGA-Assembler. The URLs of all public data files on TCGA DCC data server were gathered at Jan-05-2015. Only eight cancer types have enough normal control samples for differential expression analysis. (t test, adjusted p<0.05 (using Benjamini-Hochberg FDR)) |
 |
| Top |
| * This plots show the correlation between CNV and gene expression. |
: Open all plots for all cancer types
 |
|
 |
|
| Top |
| Gene-Gene Network Information |
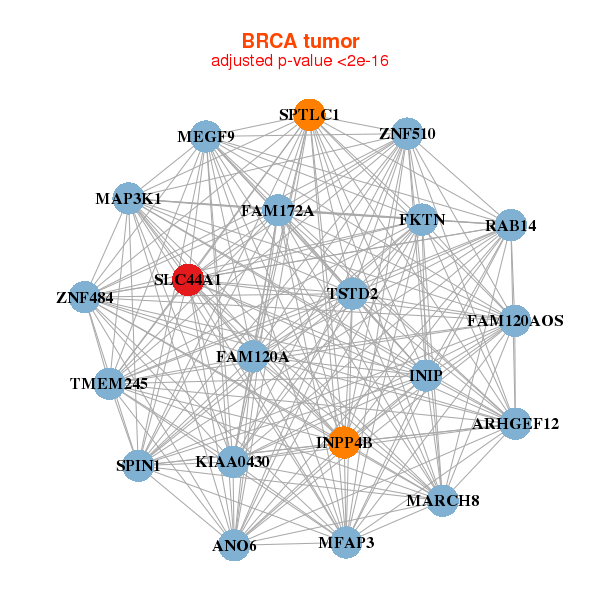
| * Co-Expression network figures were drawn using R package igraph. Only the top 20 genes with the highest correlations were shown. Red circle: input gene, orange circle: cell metabolism gene, sky circle: other gene |
: Open all plots for all cancer types
 |
|
| ANO6,ARHGEF12,TMEM245,INIP,FAM120A,FAM120AOS,FAM172A, FKTN,INPP4B,KIAA0430,MAP3K1,MARCH8,MEGF9,MFAP3, RAB14,SLC44A1,SPIN1,SPTLC1,TSTD2,ZNF484,ZNF510 | AFTPH,APH1B,CMTM6,DKFZP586I1420,ERBB4,ESR1,HHAT, IQCH,LOC344595,MGAT4A,MYO6,JADE3,RAB6C,RERG, SLC44A1,TMEM30B,TSPAN5,TSPYL4,TTC30B,UBP1,ZNRF2 |
 |
|
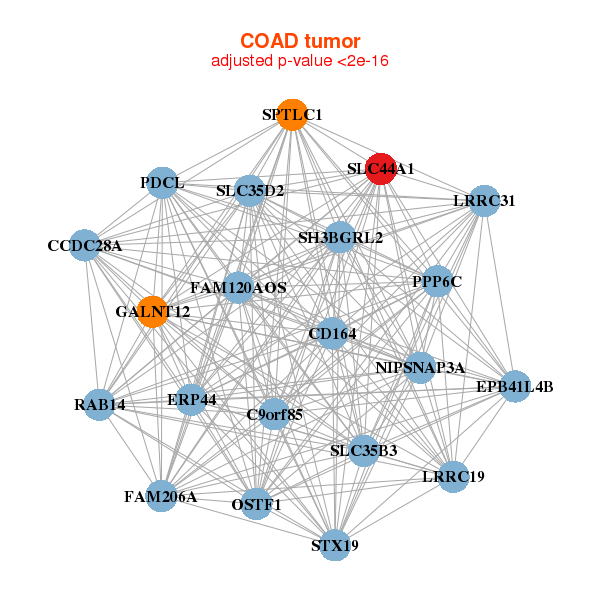
| FAM206A,C9orf85,CCDC28A,CD164,EPB41L4B,ERP44,FAM120AOS, GALNT12,LRRC19,LRRC31,NIPSNAP3A,OSTF1,PDCL,PPP6C, RAB14,SH3BGRL2,SLC35B3,SLC35D2,SLC44A1,SPTLC1,STX19 | AHCYL2,ATP8B1,MCU,DSG2,ENTPD5,EPB41L4B,EPCAM, FBXO34,GPR39,LGR4,PPARG,PPM1B,RASSF6,SH3BGRL2, SLC35A3,SLC35B3,SLC44A1,TMEM170A,TMPRSS4,UGT8,XK |
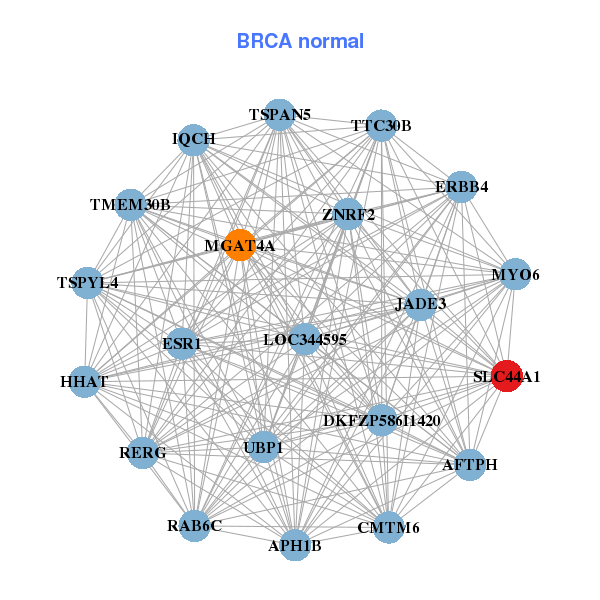
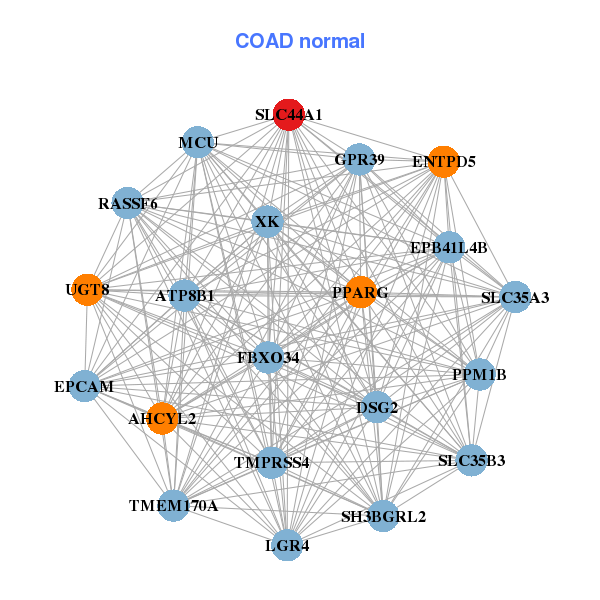
| * Co-Expression network figures were drawn using R package igraph. Only the top 20 genes with the highest correlations were shown. Red circle: input gene, orange circle: cell metabolism gene, sky circle: other gene |
: Open all plots for all cancer types
| Top |
: Open all interacting genes' information including KEGG pathway for all interacting genes from DAVID
| Top |
| Pharmacological Information for SLC44A1 |
| There's no related Drug. |
| Top |
| Cross referenced IDs for SLC44A1 |
| * We obtained these cross-references from Uniprot database. It covers 150 different DBs, 18 categories. http://www.uniprot.org/help/cross_references_section |
: Open all cross reference information
|
Copyright © 2016-Present - The Univsersity of Texas Health Science Center at Houston @ |