|
|||||||||||||||||||||||||||||||||||||||||||||||||||||||||||||||||||||||||||||||||||||||||||||||||||||||||||||||||||||||||||||||||||||||||||||||||||||||||||||||||||||||||||||||||||||||||||||||||||||||||||||||||||||||||||||||||||||||||||||||||||||||||||||||||||||||||||||||||||||||||||||||||||||||||||||||||||||||||||||||||||||||||||||||||||
| |
| Phenotypic Information (metabolism pathway, cancer, disease, phenome) |
| |
| |
| Gene-Gene Network Information: Co-Expression Network, Interacting Genes & KEGG |
| |
|


| Gene Summary for GCAT |
| Top |
| Phenotypic Information for GCAT(metabolism pathway, cancer, disease, phenome) |
| Cancer | CGAP: GCAT |
| Familial Cancer Database: GCAT | |
| * This gene is included in those cancer gene databases. |
|
|
|
|
|
| . | |||||||||||||||||||||||||||||||||||||||||||||||||||||||||||||||||||||||||||||||||||||||||||||||||||||||||||||||||||||||||||||||||||||||||||||||||||||||||||||||||||||||||||||||||||||||||||||||||||||||||||||||||||||||||||||||||||||||||||||||||||||||||||||||||||||||||||||||||||||||||||||||||||||||||||||||||||||||||||||||||||||||||||||
Oncogene 1 | Significant driver gene in | ||||||||||||||||||||||||||||||||||||||||||||||||||||||||||||||||||||||||||||||||||||||||||||||||||||||||||||||||||||||||||||||||||||||||||||||||||||||||||||||||||||||||||||||||||||||||||||||||||||||||||||||||||||||||||||||||||||||||||||||||||||||||||||||||||||||||||||||||||||||||||||||||||||||||||||||||||||||||||||||||||||||||||||||||||
| cf) number; DB name 1 Oncogene; http://nar.oxfordjournals.org/content/35/suppl_1/D721.long, 2 Tumor Suppressor gene; https://bioinfo.uth.edu/TSGene/, 3 Cancer Gene Census; http://www.nature.com/nrc/journal/v4/n3/abs/nrc1299.html, 4 CancerGenes; http://nar.oxfordjournals.org/content/35/suppl_1/D721.long, 5 Network of Cancer Gene; http://ncg.kcl.ac.uk/index.php, 1Therapeutic Vulnerabilities in Cancer; http://cbio.mskcc.org/cancergenomics/statius/ |
| KEGG_GLYCINE_SERINE_AND_THREONINE_METABOLISM | |
| OMIM | |
| Orphanet | |
| Disease | KEGG Disease: GCAT |
| MedGen: GCAT (Human Medical Genetics with Condition) | |
| ClinVar: GCAT | |
| Phenotype | MGI: GCAT (International Mouse Phenotyping Consortium) |
| PhenomicDB: GCAT | |
| Mutations for GCAT |
| * Under tables are showing count per each tissue to give us broad intuition about tissue specific mutation patterns.You can go to the detailed page for each mutation database's web site. |
| There's no structural variation information in COSMIC data for this gene. |
| * From mRNA Sanger sequences, Chitars2.0 arranged chimeric transcripts. This table shows GCAT related fusion information. |
| ID | Head Gene | Tail Gene | Accession | Gene_a | qStart_a | qEnd_a | Chromosome_a | tStart_a | tEnd_a | Gene_a | qStart_a | qEnd_a | Chromosome_a | tStart_a | tEnd_a |
| Top |
| Mutation type/ Tissue ID | brca | cns | cerv | endome | haematopo | kidn | Lintest | liver | lung | ns | ovary | pancre | prost | skin | stoma | thyro | urina | |||
| Total # sample | 1 | |||||||||||||||||||
| GAIN (# sample) | 1 | |||||||||||||||||||
| LOSS (# sample) |
| cf) Tissue ID; Tissue type (1; Breast, 2; Central_nervous_system, 3; Cervix, 4; Endometrium, 5; Haematopoietic_and_lymphoid_tissue, 6; Kidney, 7; Large_intestine, 8; Liver, 9; Lung, 10; NS, 11; Ovary, 12; Pancreas, 13; Prostate, 14; Skin, 15; Stomach, 16; Thyroid, 17; Urinary_tract) |
| Top |
|
 |
| Top |
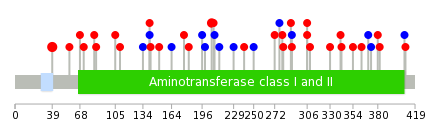
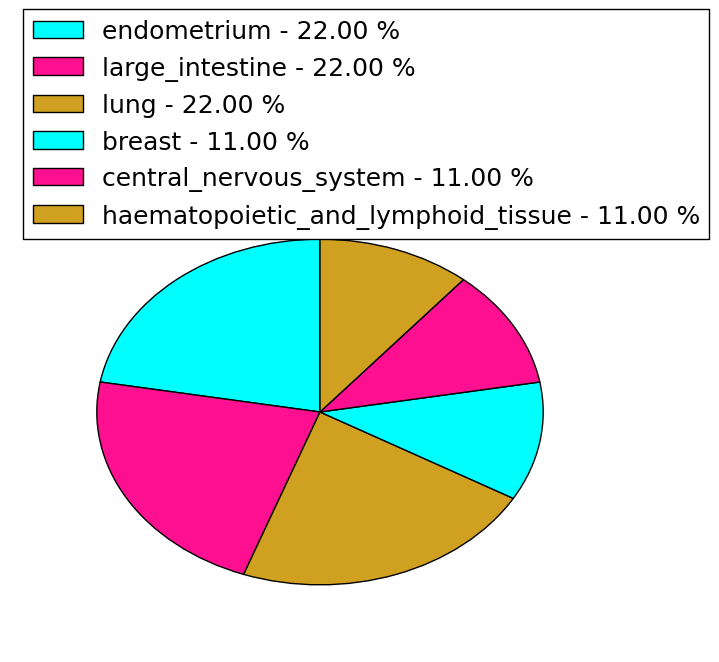
| Stat. for Non-Synonymous SNVs (# total SNVs=23) | (# total SNVs=9) |
 |  |
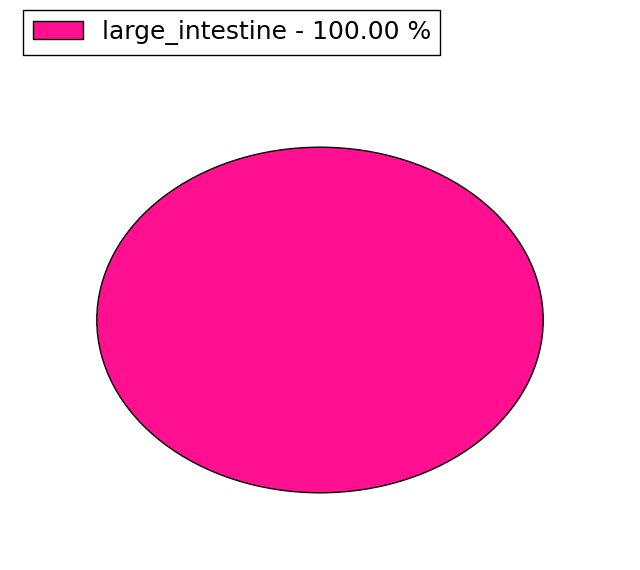
(# total SNVs=1) | (# total SNVs=0) |
 |
| Top |
| * When you move the cursor on each content, you can see more deailed mutation information on the Tooltip. Those are primary_site,primary_histology,mutation(aa),pubmedID. |
| GRCh37 position | Mutation(aa) | Unique sampleID count |
| chr22:38204089-38204089 | p.R39C | 3 |
| chr22:38211771-38211771 | p.A306S | 2 |
| chr22:38211173-38211173 | p.S206F | 2 |
| chr22:38211693-38211693 | p.P280S | 1 |
| chr22:38212307-38212307 | p.A363T | 1 |
| chr22:38208988-38208988 | p.L141H | 1 |
| chr22:38211178-38211178 | p.D208N | 1 |
| chr22:38211697-38211697 | p.L281P | 1 |
| chr22:38212575-38212575 | p.G370G | 1 |
| chr22:38208989-38208989 | p.L141L | 1 |
| Top |
|
 |
| Point Mutation/ Tissue ID | 1 | 2 | 3 | 4 | 5 | 6 | 7 | 8 | 9 | 10 | 11 | 12 | 13 | 14 | 15 | 16 | 17 | 18 | 19 | 20 |
| # sample | 2 | 3 | 2 | 3 | 1 | 6 | 2 | 8 | 3 | 2 | ||||||||||
| # mutation | 2 | 3 | 2 | 3 | 1 | 6 | 2 | 9 | 3 | 2 | ||||||||||
| nonsynonymous SNV | 2 | 1 | 1 | 3 | 6 | 1 | 4 | 3 | ||||||||||||
| synonymous SNV | 2 | 1 | 1 | 1 | 5 | 2 |
| cf) Tissue ID; Tissue type (1; BLCA[Bladder Urothelial Carcinoma], 2; BRCA[Breast invasive carcinoma], 3; CESC[Cervical squamous cell carcinoma and endocervical adenocarcinoma], 4; COAD[Colon adenocarcinoma], 5; GBM[Glioblastoma multiforme], 6; Glioma Low Grade, 7; HNSC[Head and Neck squamous cell carcinoma], 8; KICH[Kidney Chromophobe], 9; KIRC[Kidney renal clear cell carcinoma], 10; KIRP[Kidney renal papillary cell carcinoma], 11; LAML[Acute Myeloid Leukemia], 12; LUAD[Lung adenocarcinoma], 13; LUSC[Lung squamous cell carcinoma], 14; OV[Ovarian serous cystadenocarcinoma ], 15; PAAD[Pancreatic adenocarcinoma], 16; PRAD[Prostate adenocarcinoma], 17; SKCM[Skin Cutaneous Melanoma], 18:STAD[Stomach adenocarcinoma], 19:THCA[Thyroid carcinoma], 20:UCEC[Uterine Corpus Endometrial Carcinoma]) |
| Top |
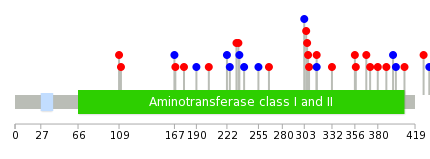
| * We represented just top 10 SNVs. When you move the cursor on each content, you can see more deailed mutation information on the Tooltip. Those are primary_site, primary_histology, mutation(aa), pubmedID. |
| Genomic Position | Mutation(aa) | Unique sampleID count |
| chr22:38212584 | p.F255F,GCAT | 1 |
| chr22:38211173 | p.G396G,GCAT | 1 |
| chr22:38211724 | p.G266W,GCAT | 1 |
| chr22:38212609 | p.V399V,GCAT | 1 |
| chr22:38211178 | p.G303G,GCAT | 1 |
| chr22:38211725 | p.P408S,GCAT | 1 |
| chr22:38212669 | p.G305E,GCAT | 1 |
| chr22:38206084 | p.D428Y,GCAT | 1 |
| chr22:38211183 | p.E109K,GCAT | 1 |
| chr22:38211771 | p.P306S,GCAT | 1 |
| * Copy number data were extracted from TCGA using R package TCGA-Assembler. The URLs of all public data files on TCGA DCC data server were gathered on Jan-05-2015. Function ProcessCNAData in TCGA-Assembler package was used to obtain gene-level copy number value which is calculated as the average copy number of the genomic region of a gene. |
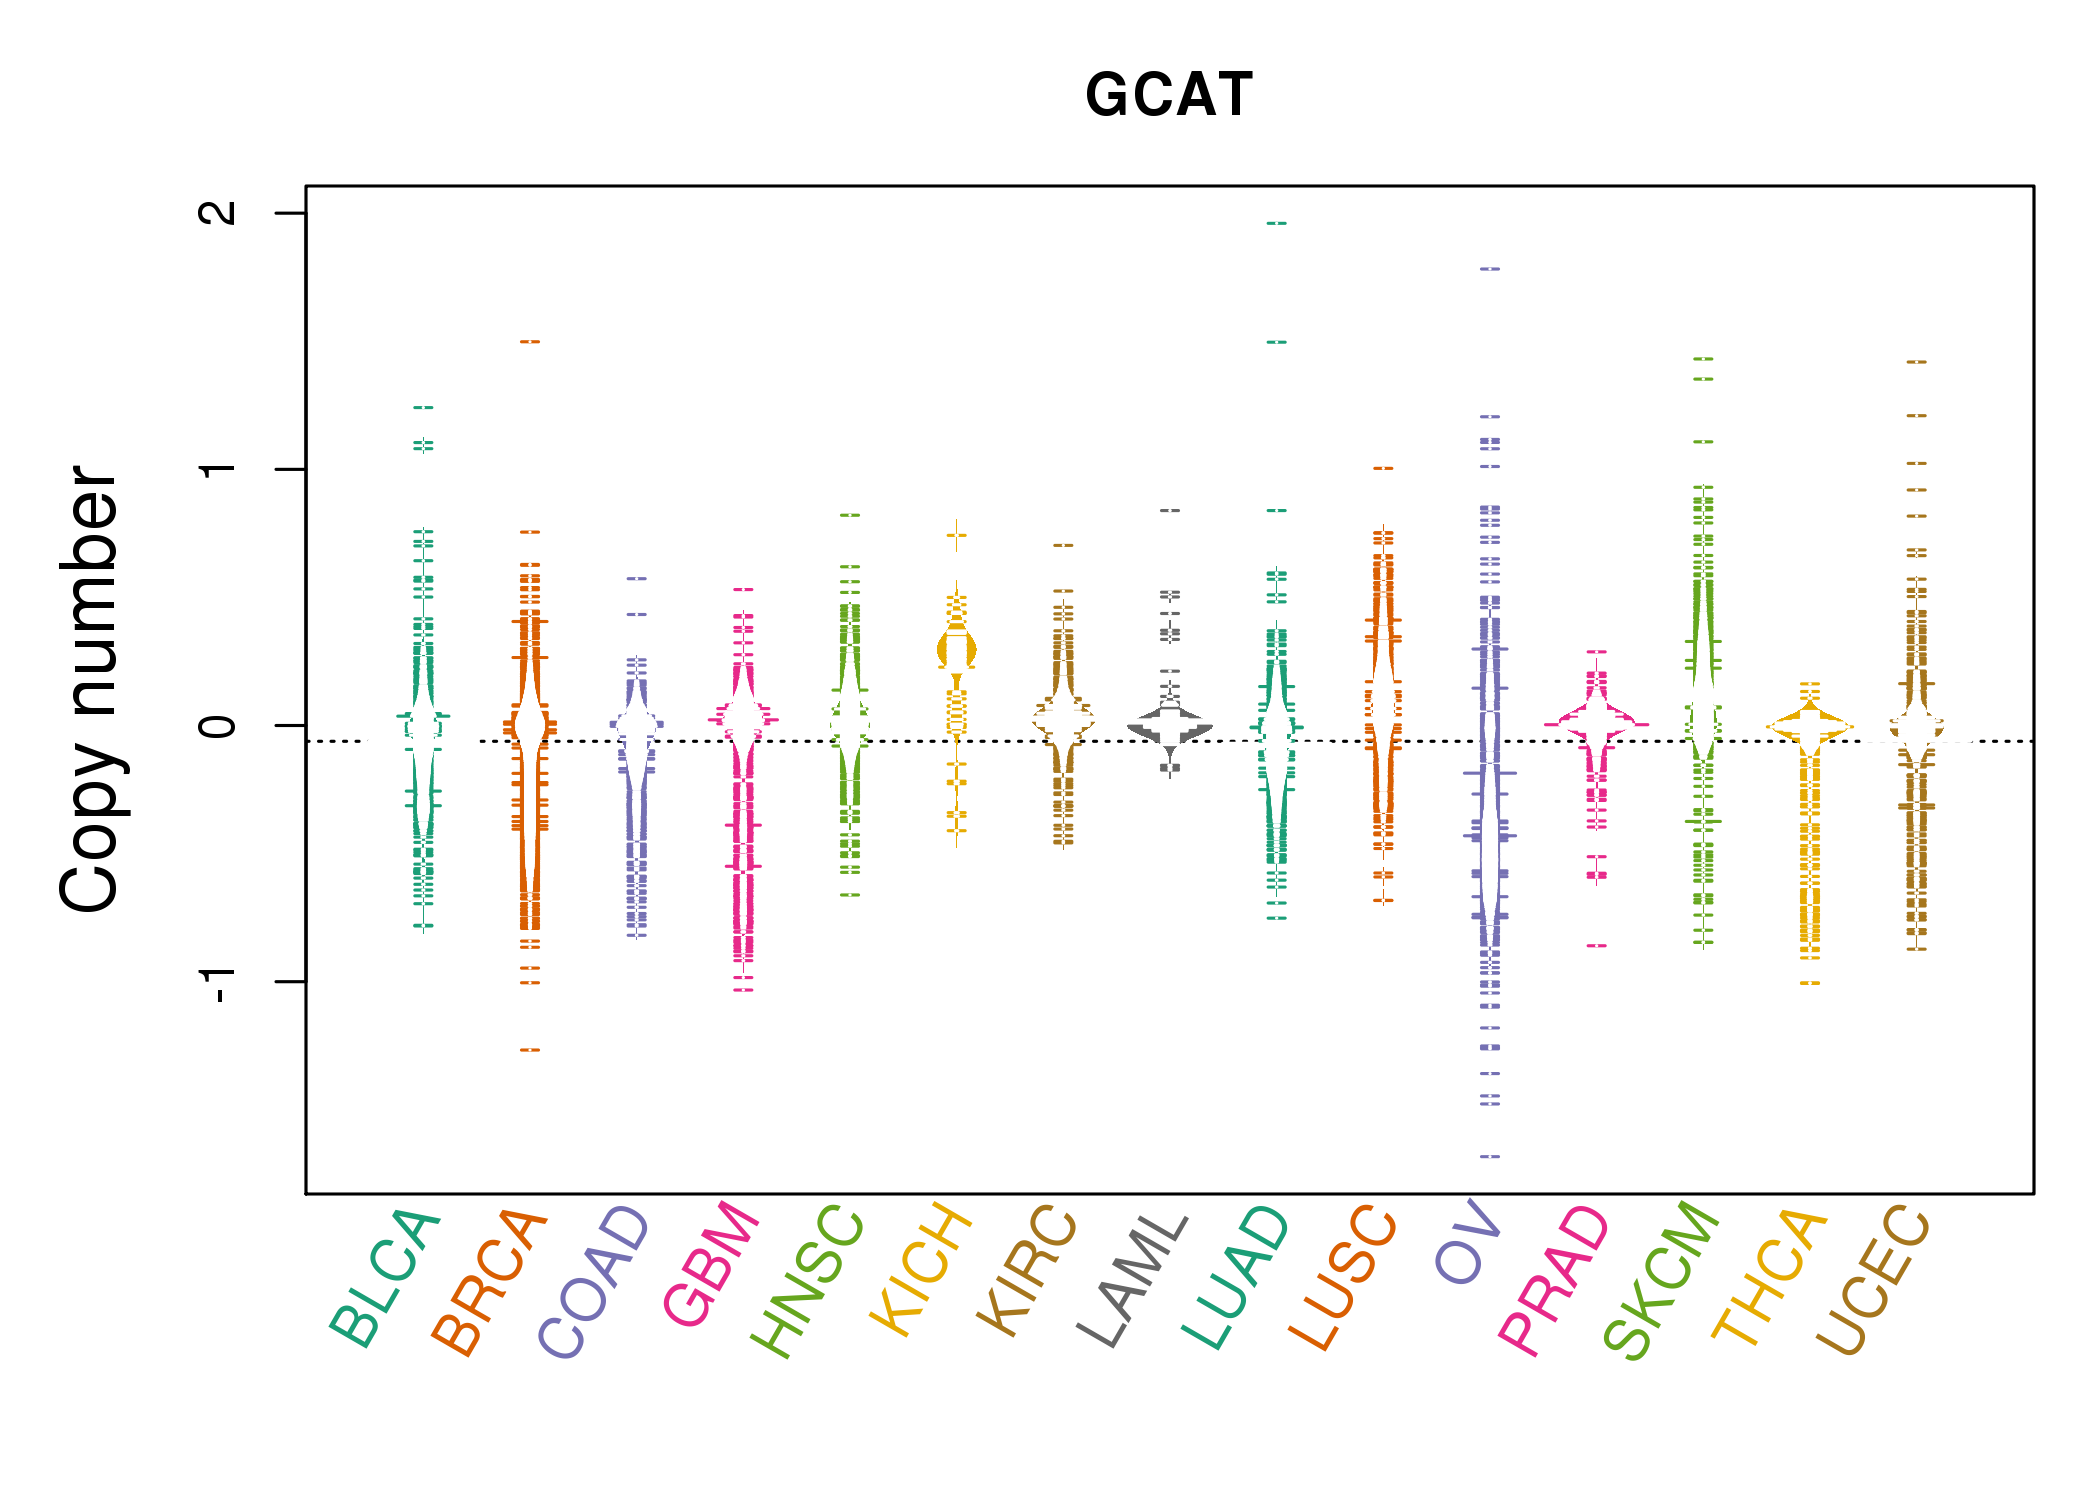 |
| cf) Tissue ID[Tissue type]: BLCA[Bladder Urothelial Carcinoma], BRCA[Breast invasive carcinoma], CESC[Cervical squamous cell carcinoma and endocervical adenocarcinoma], COAD[Colon adenocarcinoma], GBM[Glioblastoma multiforme], Glioma Low Grade, HNSC[Head and Neck squamous cell carcinoma], KICH[Kidney Chromophobe], KIRC[Kidney renal clear cell carcinoma], KIRP[Kidney renal papillary cell carcinoma], LAML[Acute Myeloid Leukemia], LUAD[Lung adenocarcinoma], LUSC[Lung squamous cell carcinoma], OV[Ovarian serous cystadenocarcinoma ], PAAD[Pancreatic adenocarcinoma], PRAD[Prostate adenocarcinoma], SKCM[Skin Cutaneous Melanoma], STAD[Stomach adenocarcinoma], THCA[Thyroid carcinoma], UCEC[Uterine Corpus Endometrial Carcinoma] |
| Top |
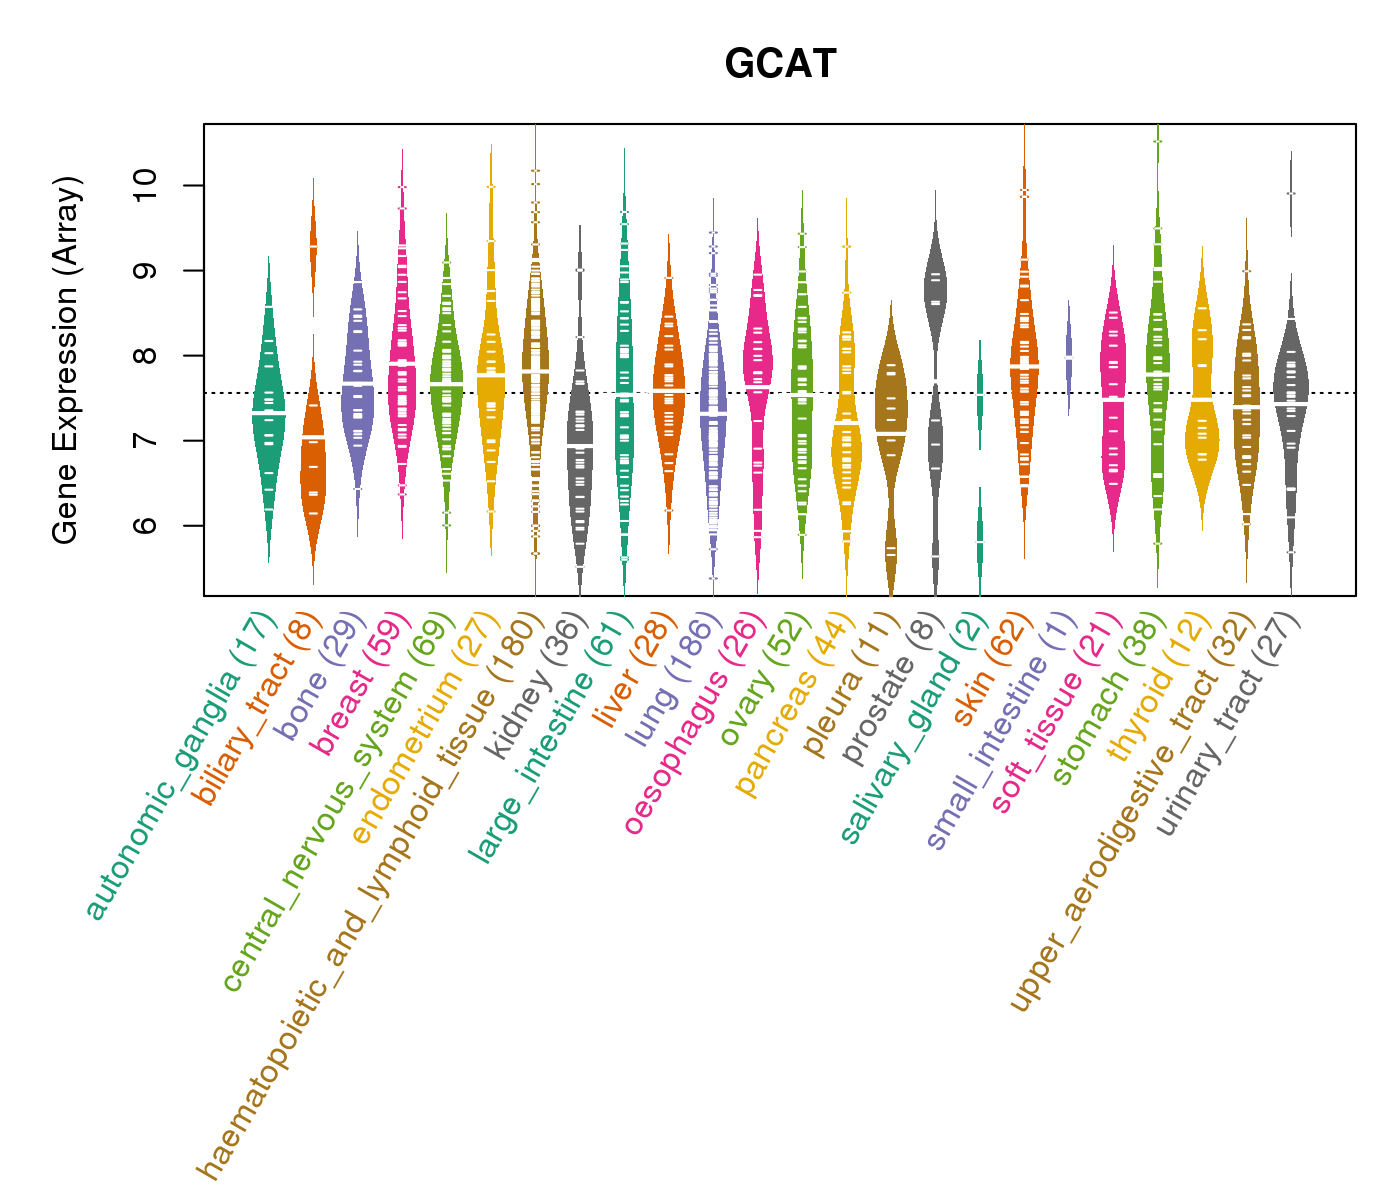
| Gene Expression for GCAT |
| * CCLE gene expression data were extracted from CCLE_Expression_Entrez_2012-10-18.res: Gene-centric RMA-normalized mRNA expression data. |
 |
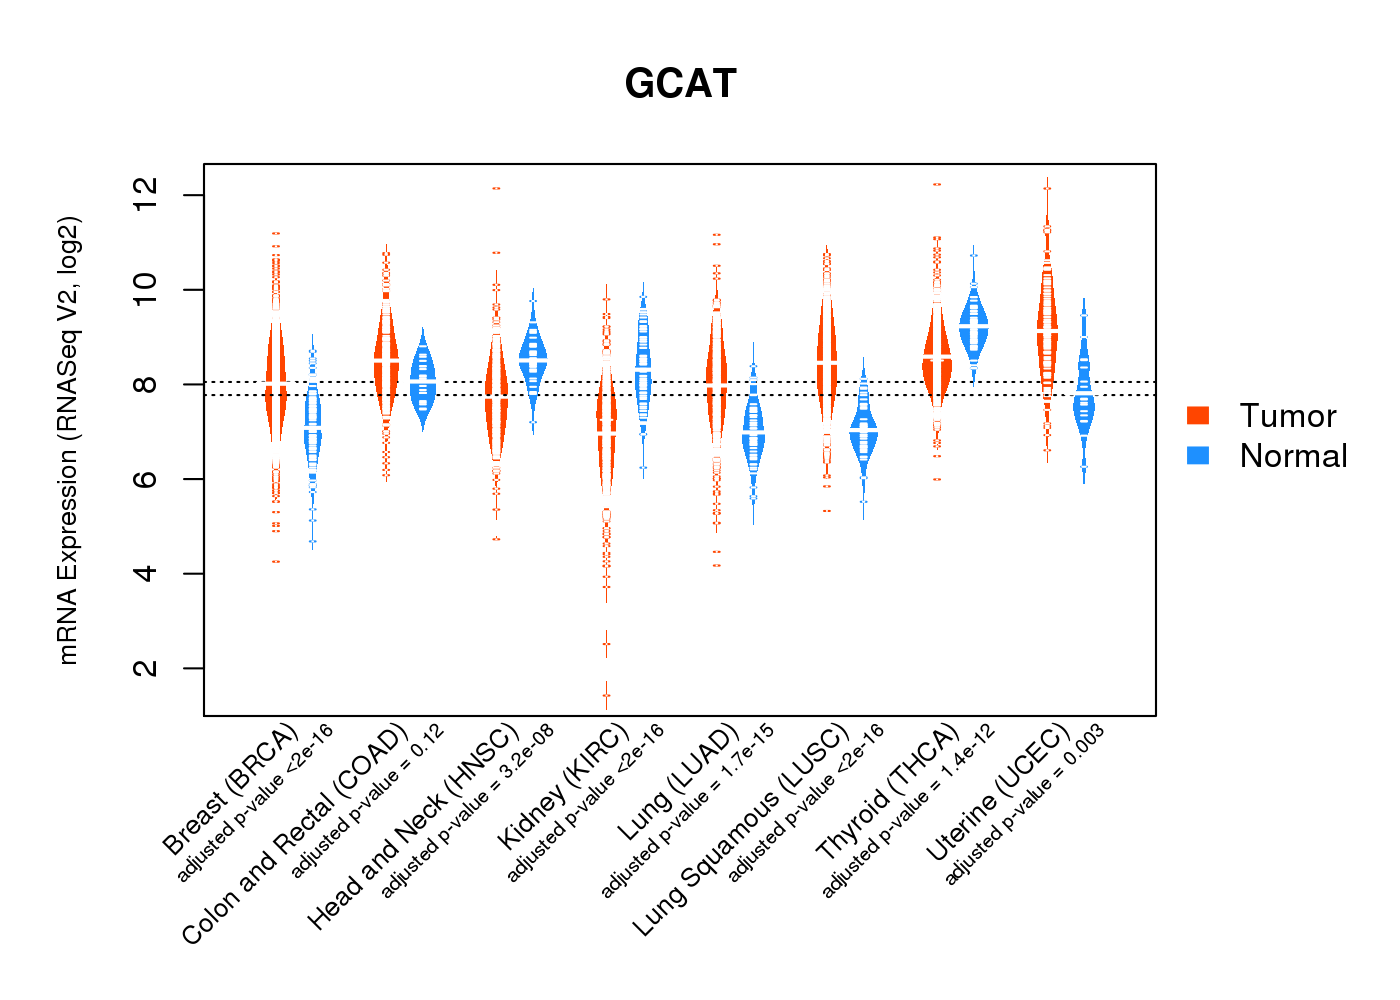
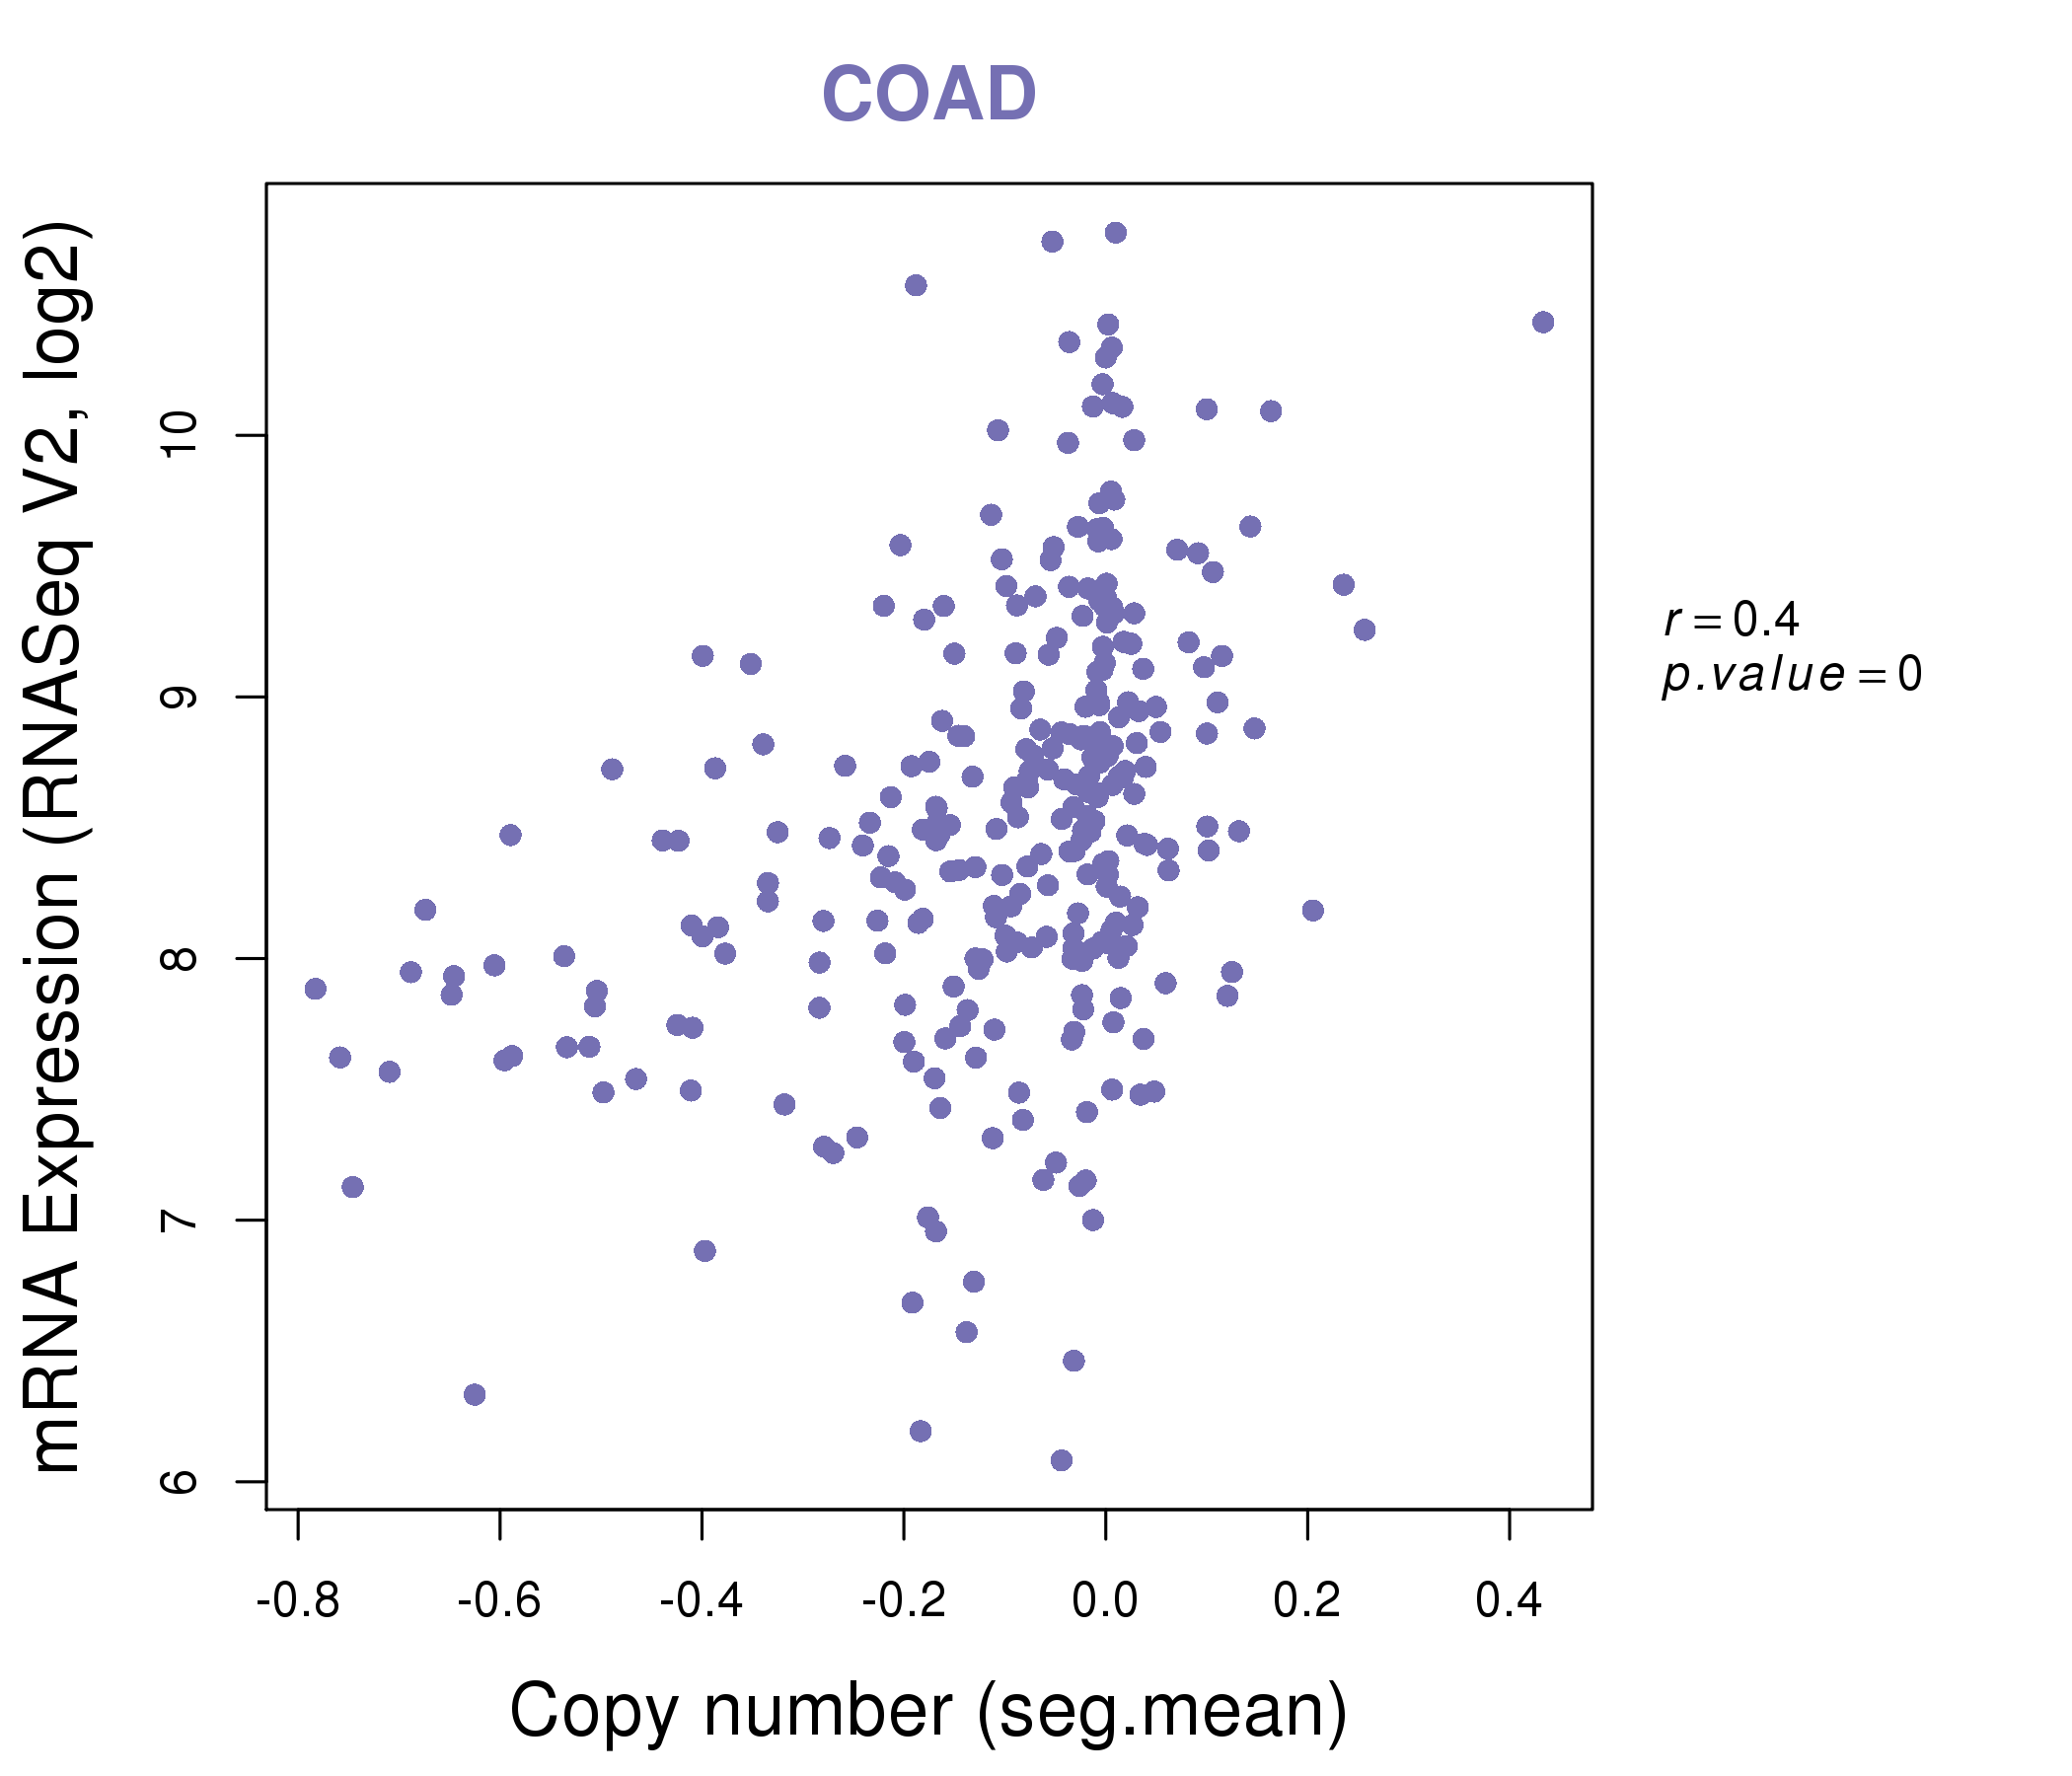
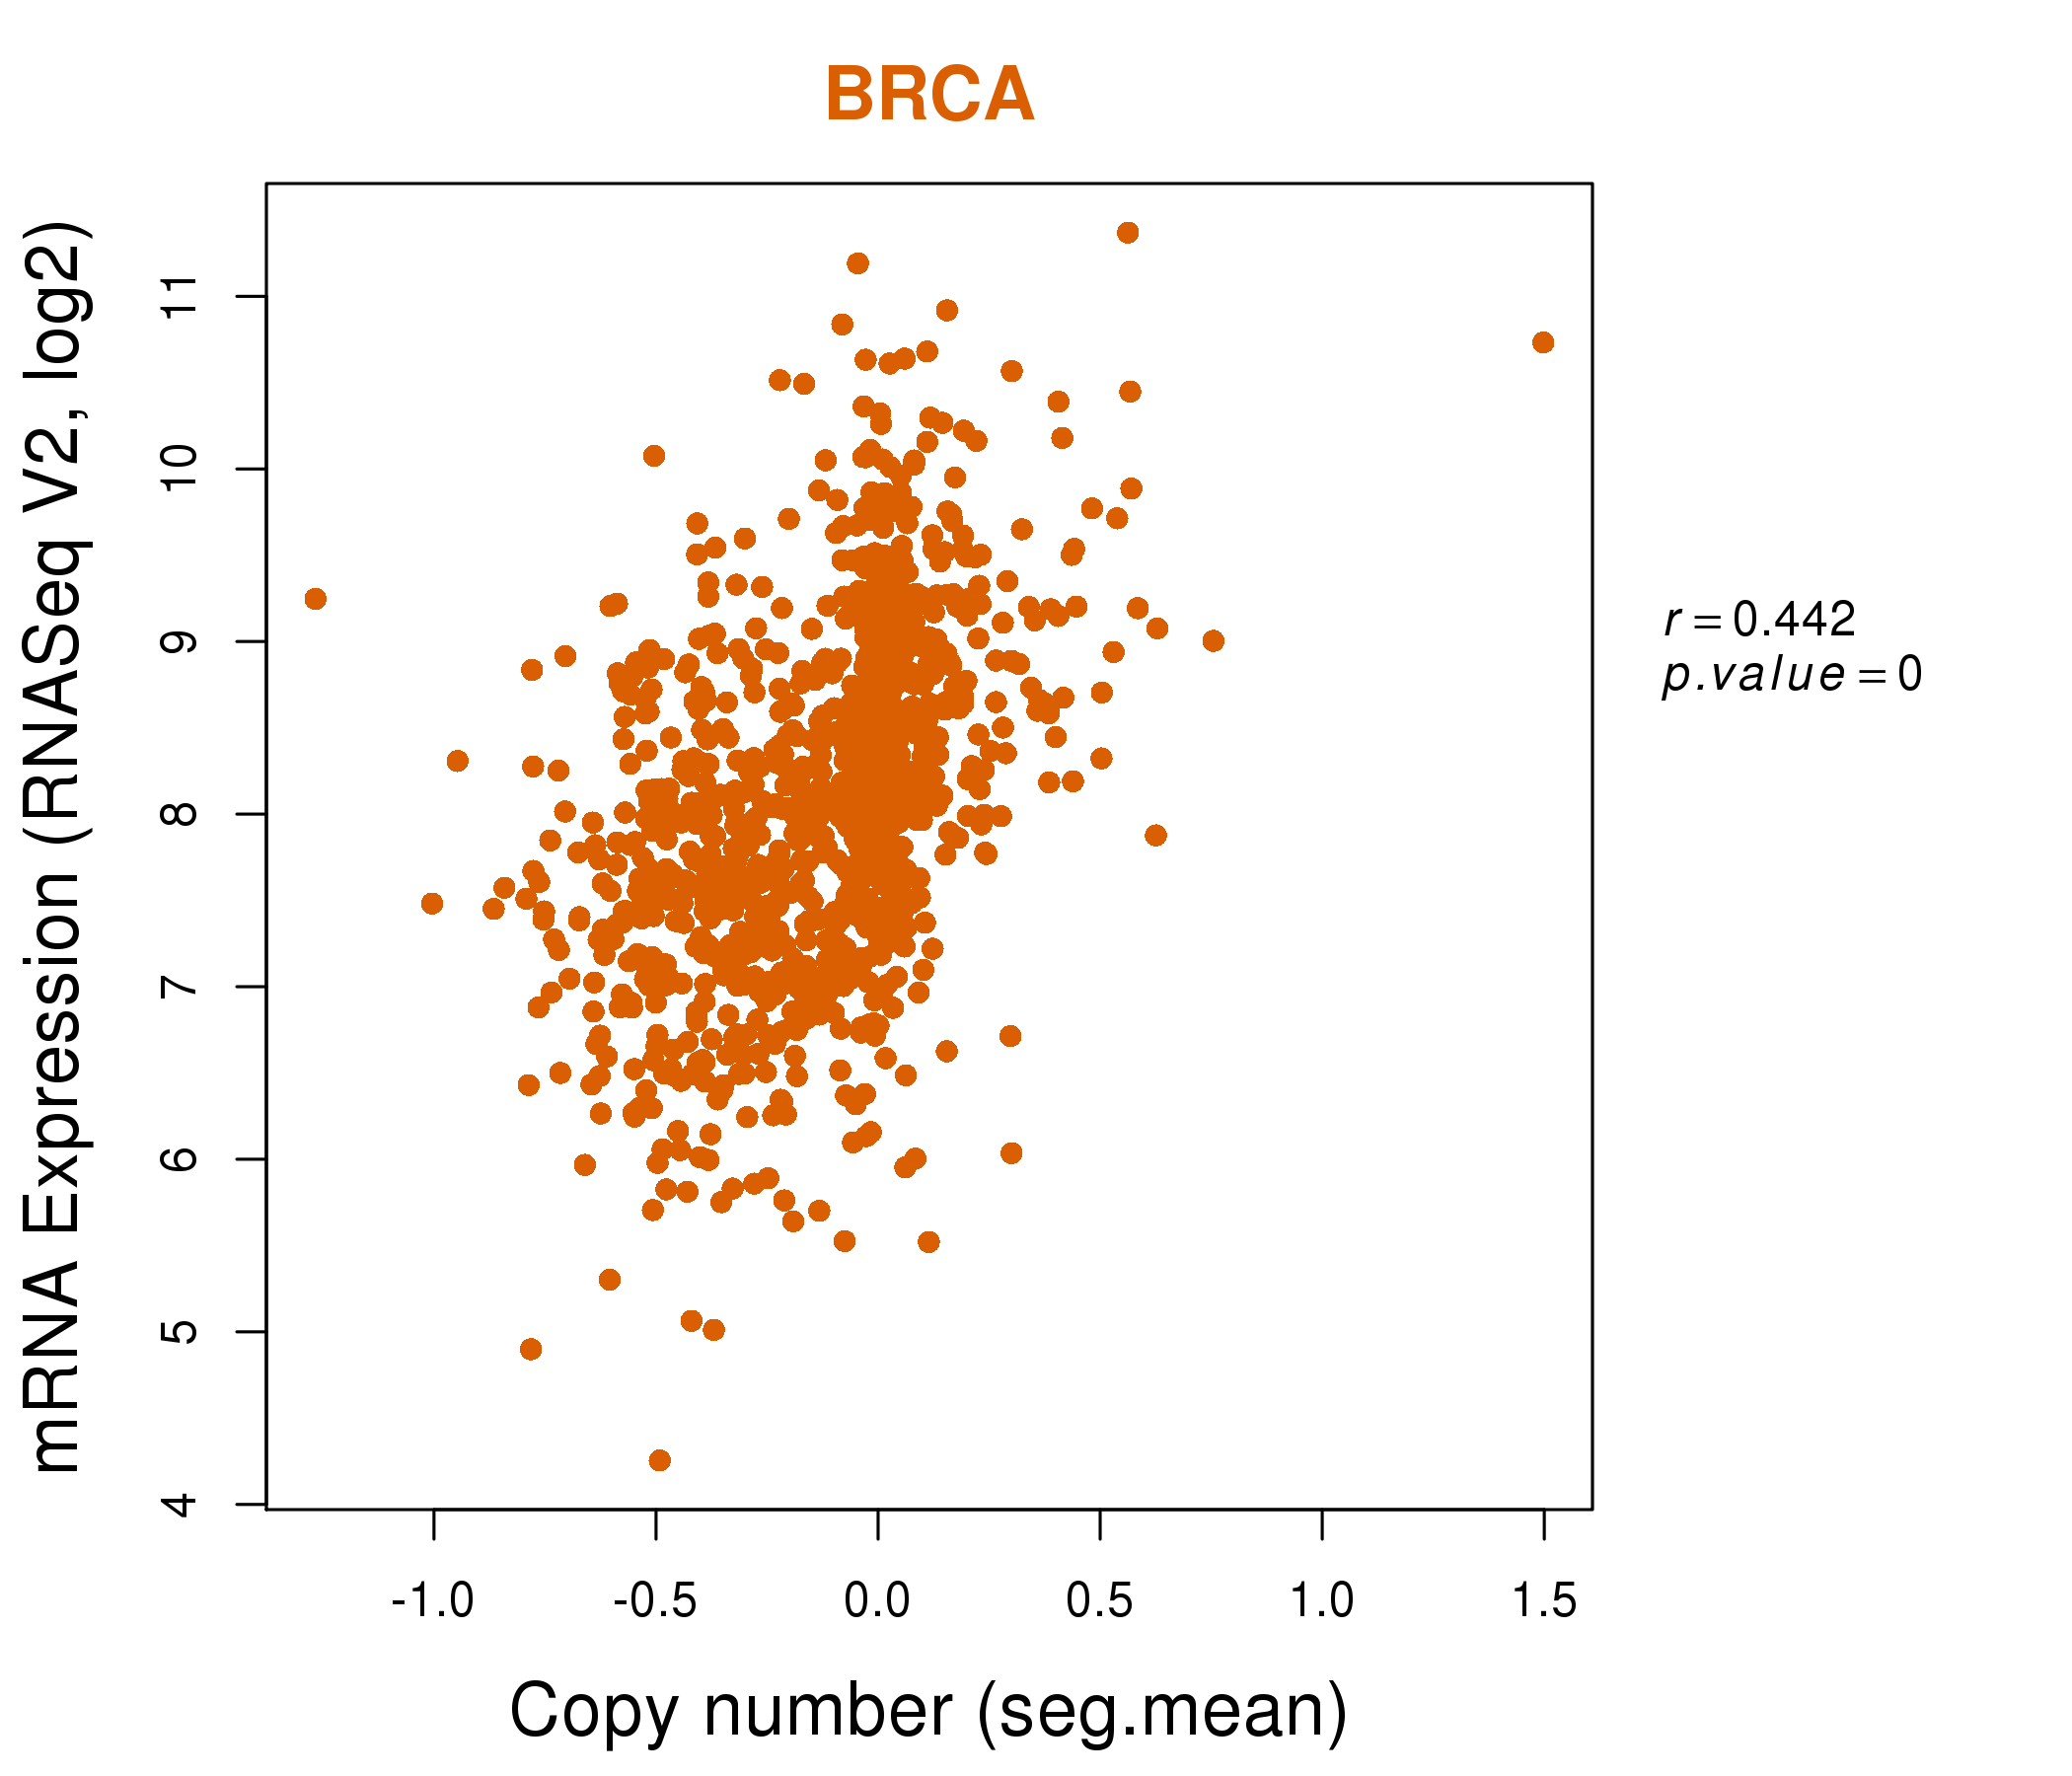
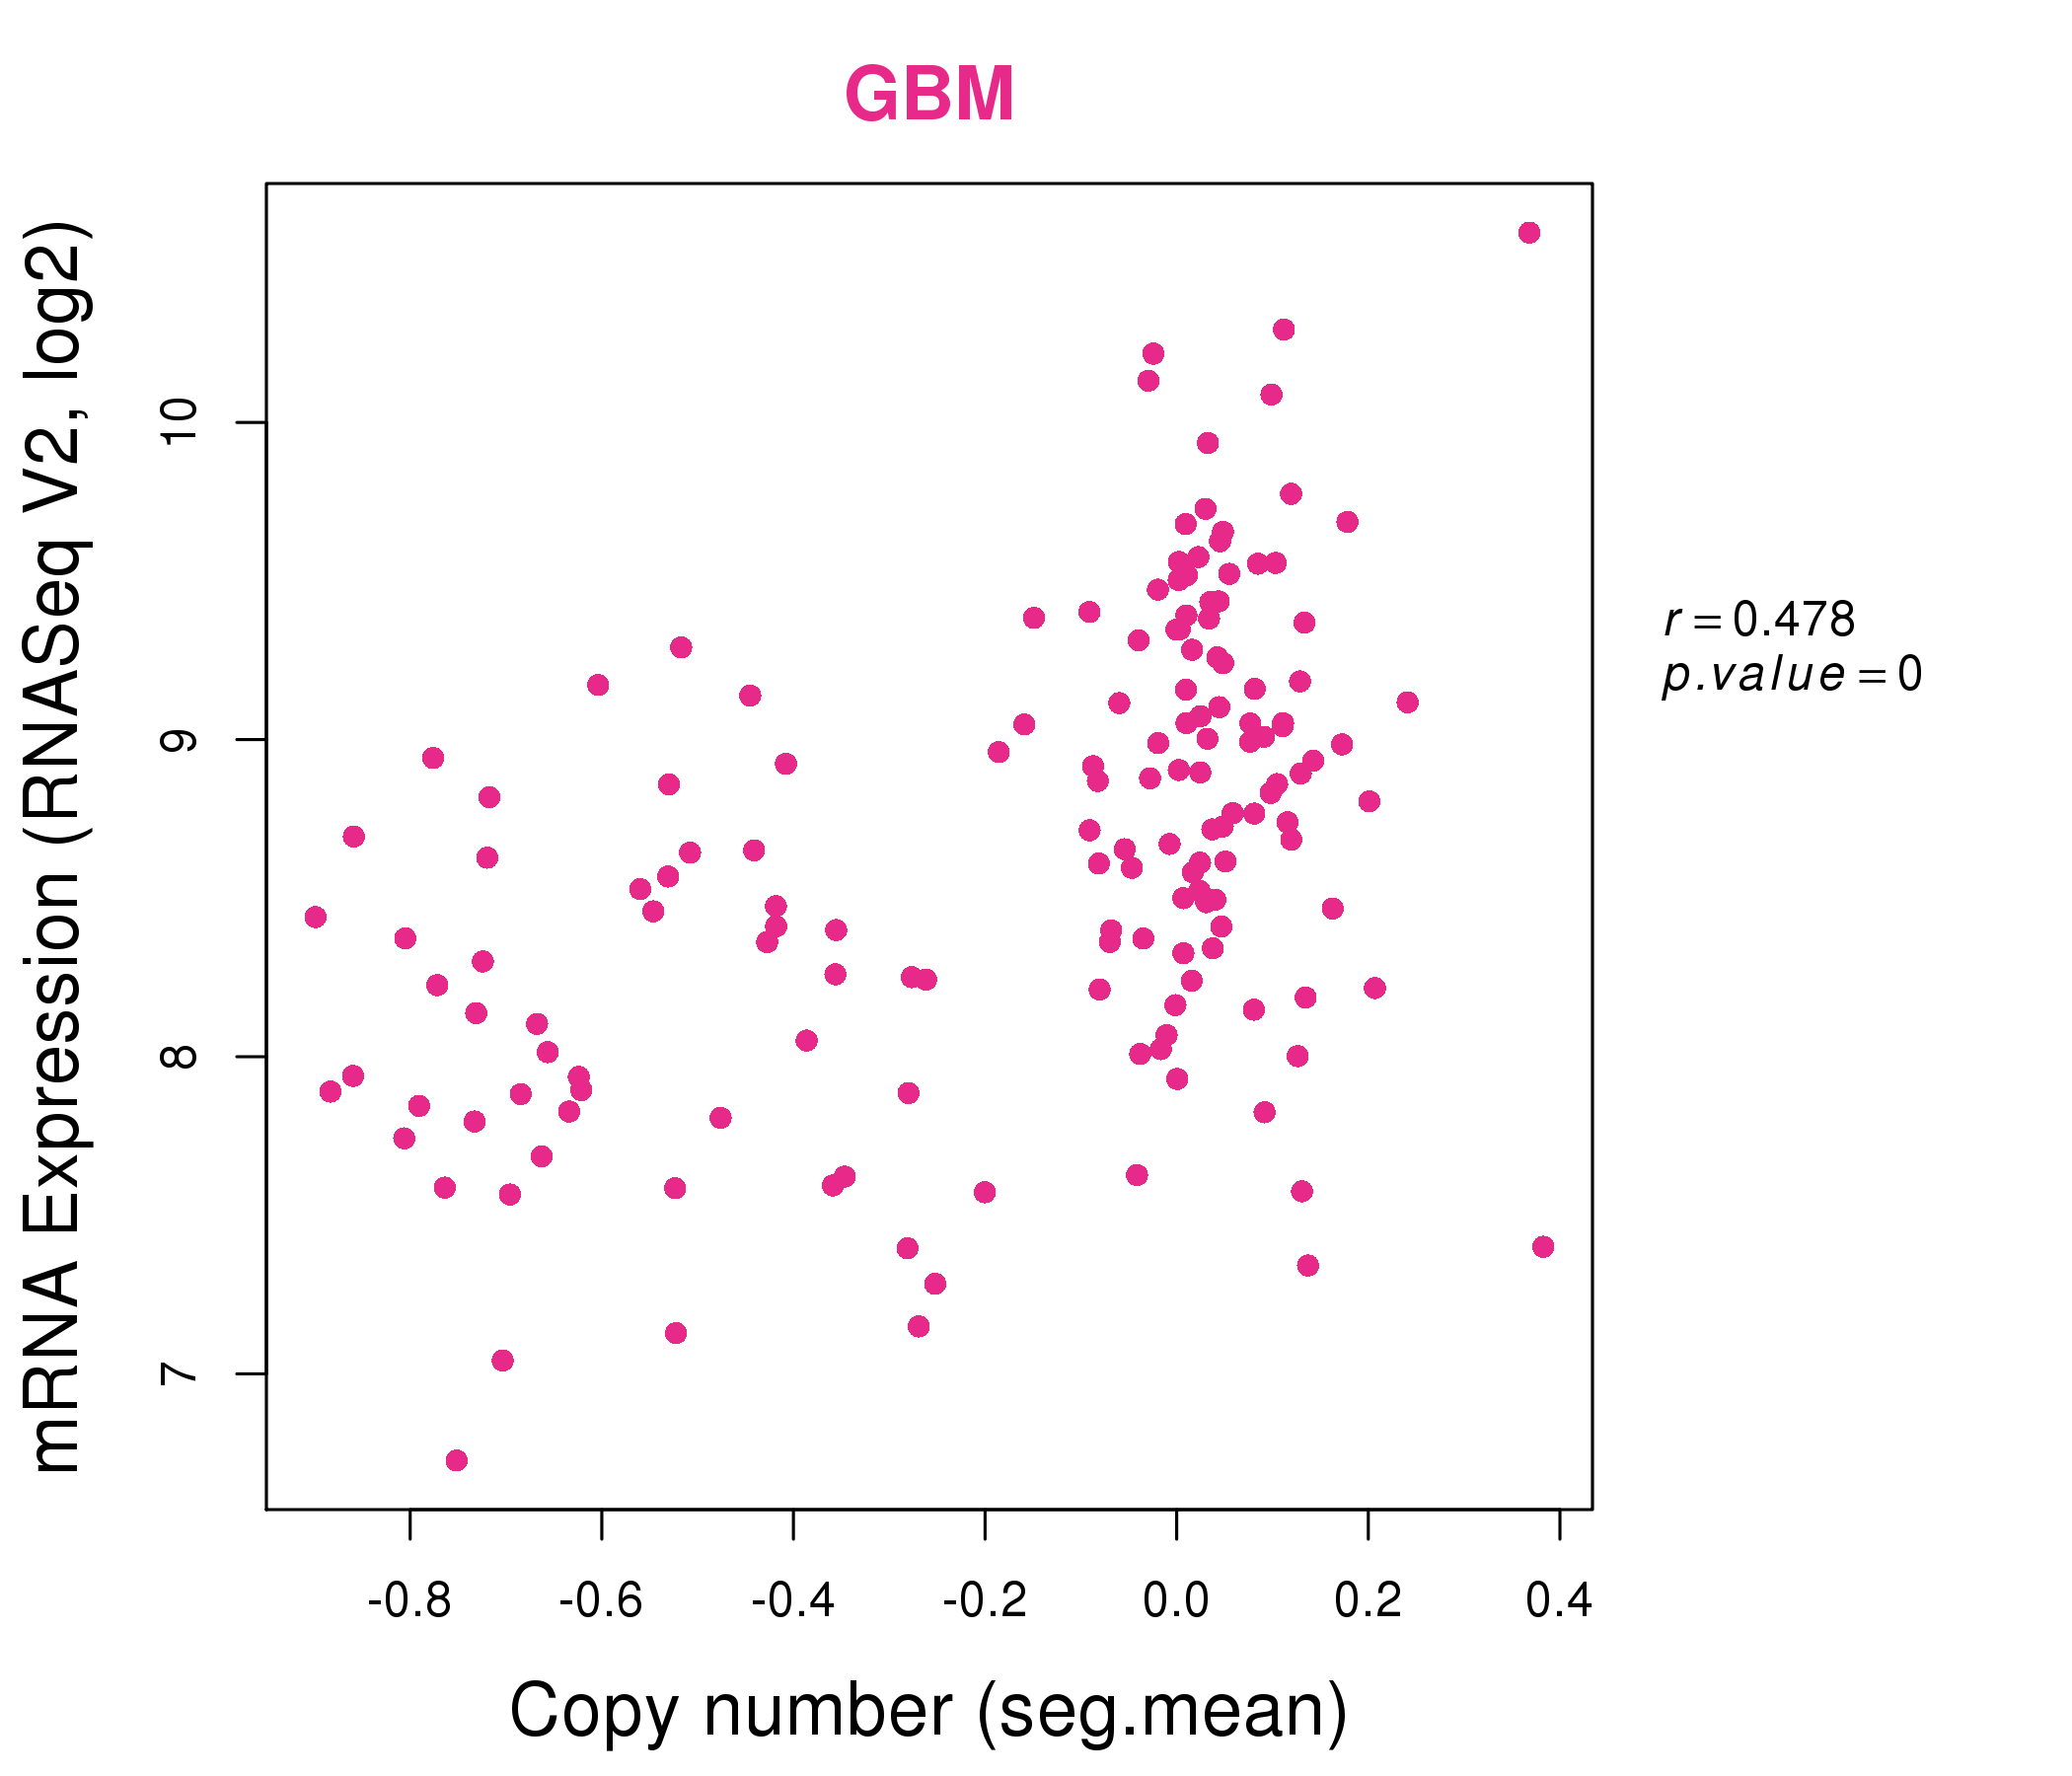
| * Normalized gene expression data of RNASeqV2 was extracted from TCGA using R package TCGA-Assembler. The URLs of all public data files on TCGA DCC data server were gathered at Jan-05-2015. Only eight cancer types have enough normal control samples for differential expression analysis. (t test, adjusted p<0.05 (using Benjamini-Hochberg FDR)) |
 |
| Top |
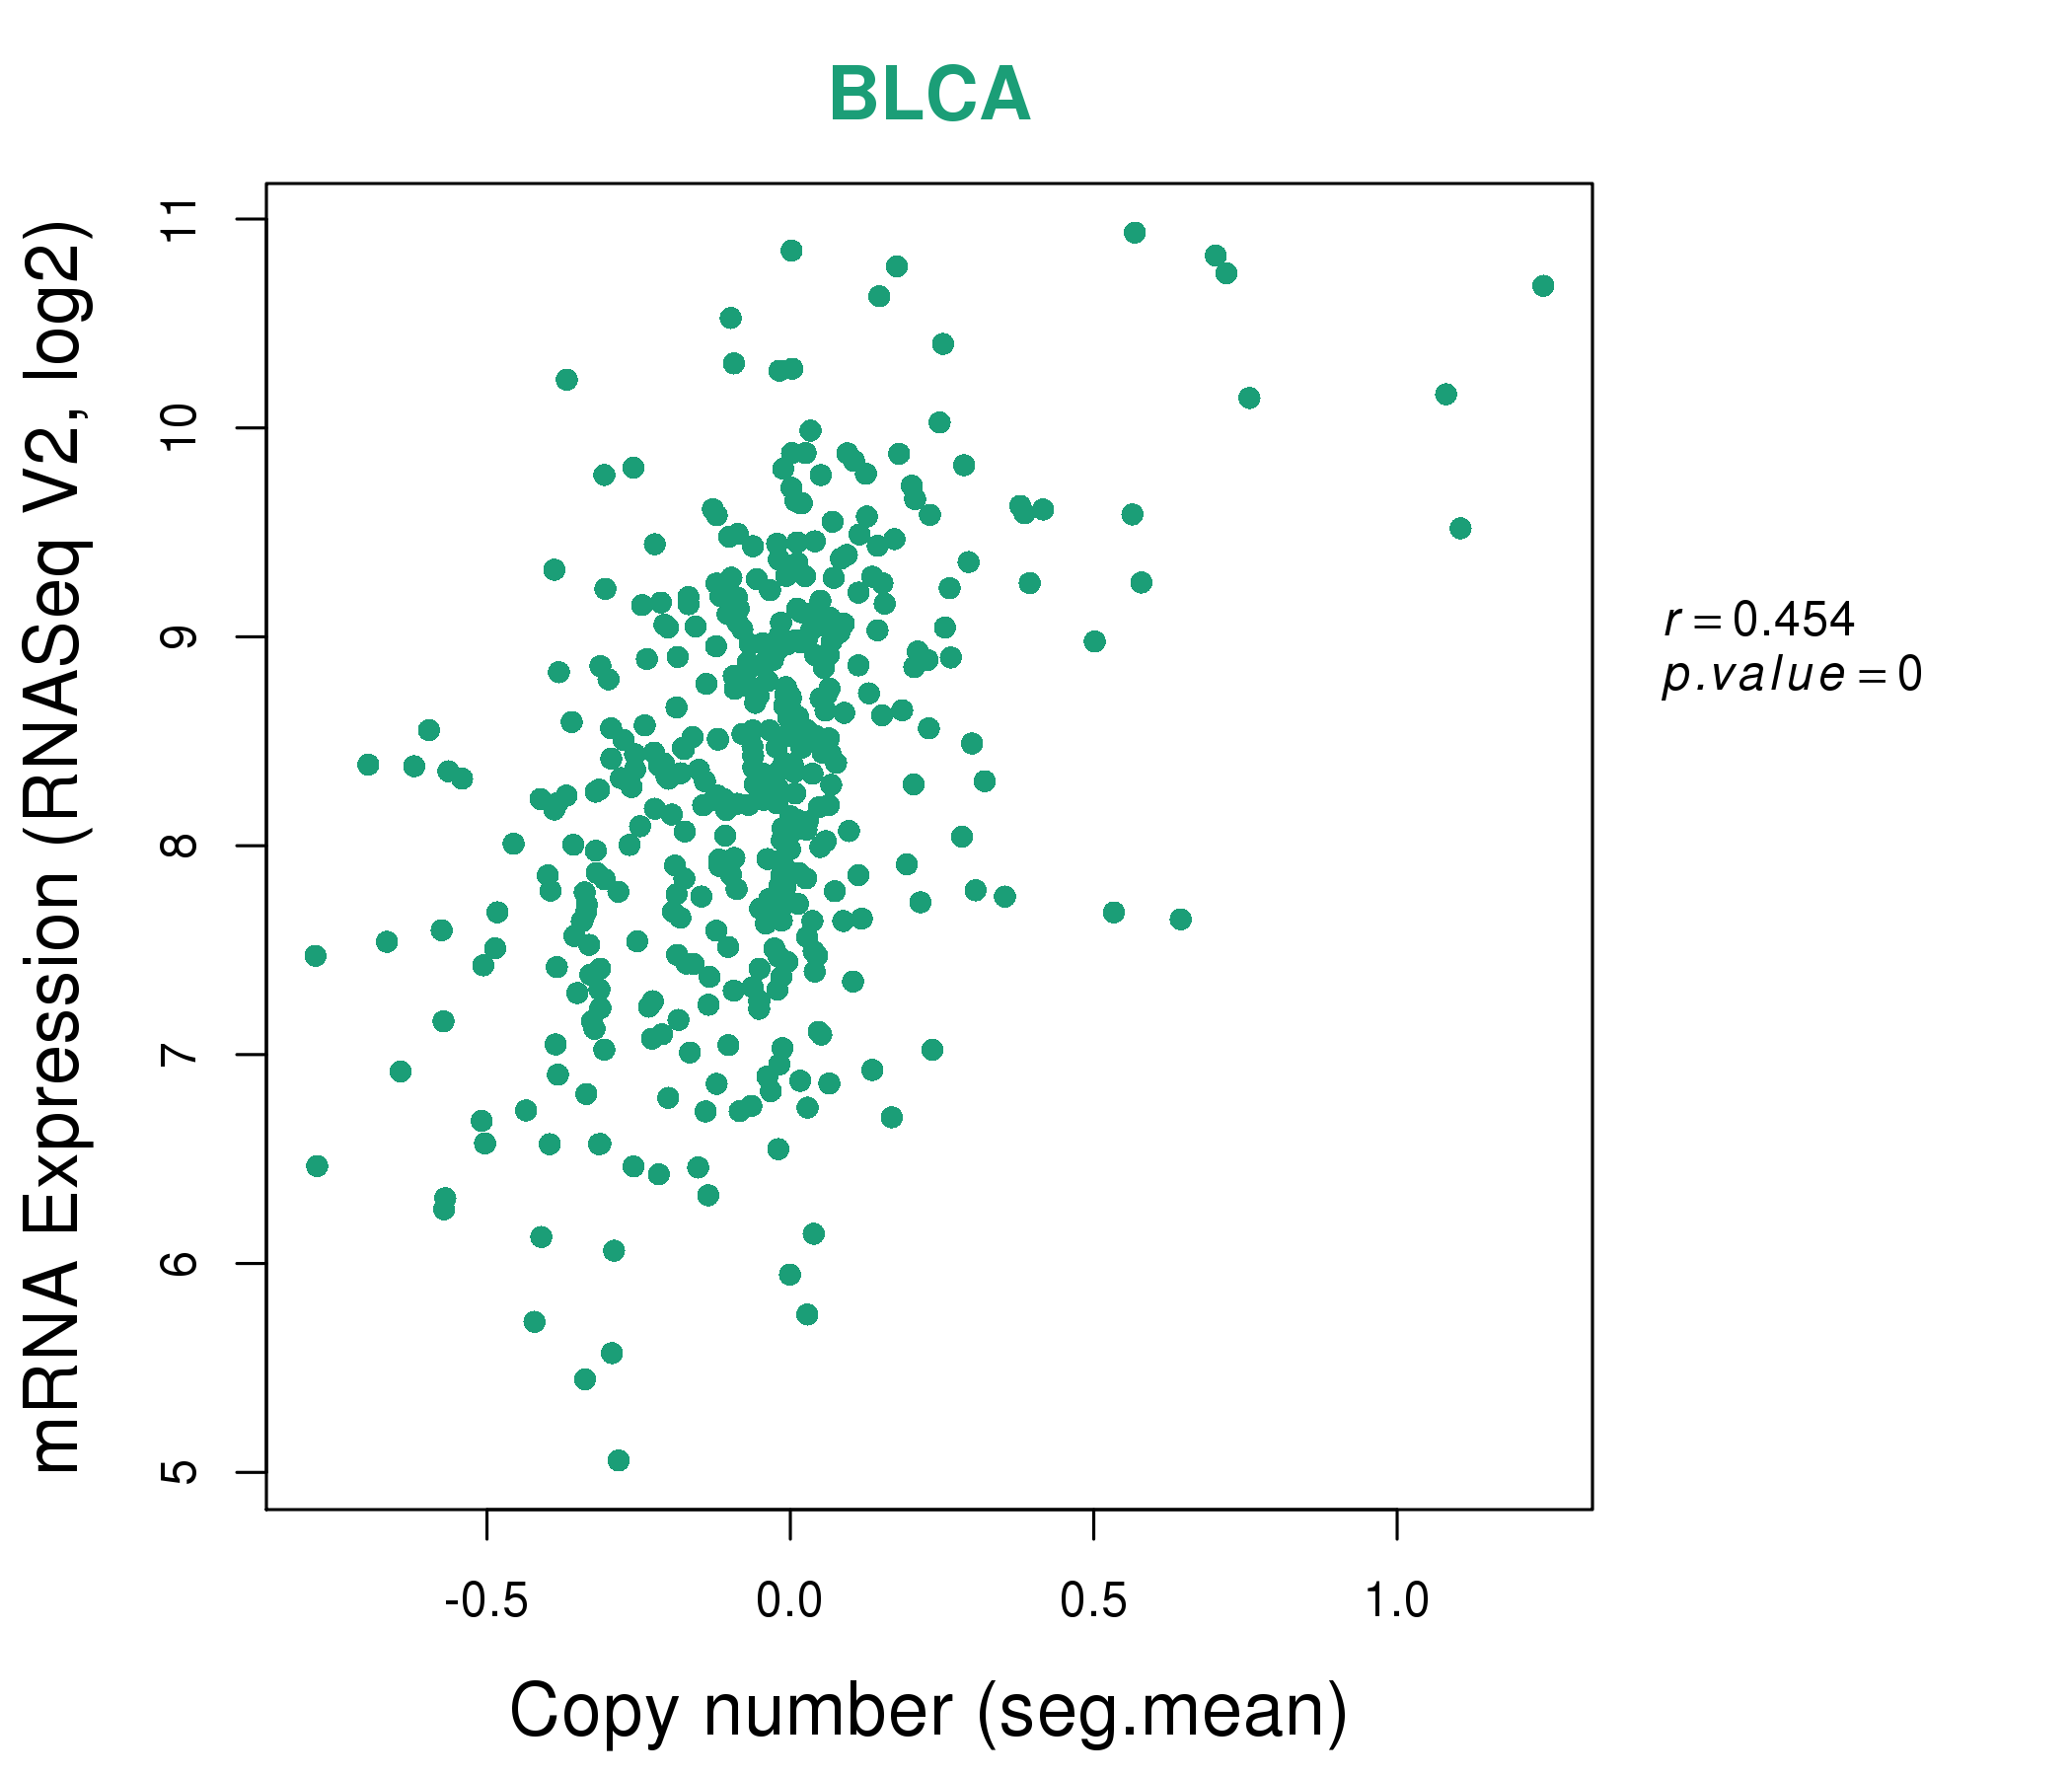
| * This plots show the correlation between CNV and gene expression. |
: Open all plots for all cancer types
 |
|
 |
|
| Top |
| Gene-Gene Network Information |
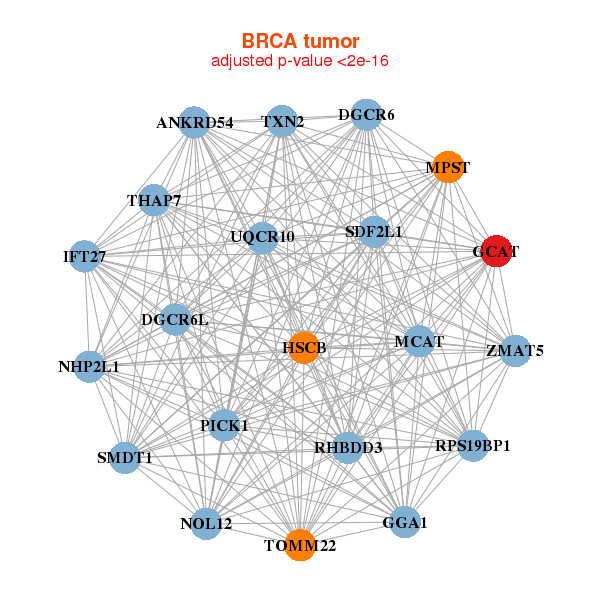
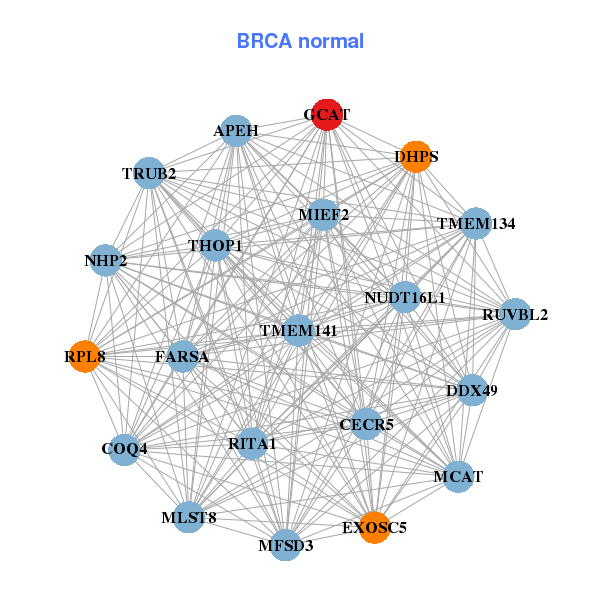
| * Co-Expression network figures were drawn using R package igraph. Only the top 20 genes with the highest correlations were shown. Red circle: input gene, orange circle: cell metabolism gene, sky circle: other gene |
: Open all plots for all cancer types
 |
| ||||
| ANKRD54,SMDT1,DGCR6,DGCR6L,GCAT,GGA1,HSCB, IFT27,MCAT,MPST,NHP2L1,NOL12,PICK1,RHBDD3, RPS19BP1,SDF2L1,THAP7,TOMM22,TXN2,UQCR10,ZMAT5 | APEH,RITA1,CECR5,COQ4,DDX49,DHPS,EXOSC5, FARSA,GCAT,MCAT,MFSD3,MLST8,NHP2,NUDT16L1, RPL8,RUVBL2,MIEF2,THOP1,TMEM134,TMEM141,TRUB2 | ||||
 |
| ||||
| ATPAF2,CENPM,DGCR6L,DHRS13,ENDOG,F12,GCAT, HSCB,DANCR,NAA38,MCAT,MTFP1,NPM3,POLR2L, PUSL1,SDF2L1,TIMM13,TMEM52,TSPO,TXN2,UQCR10 | AHCY,CD320,ECSIT,EIF4EBP1,EXOSC5,FBXW9,GCAT, HIST3H2A,LAGE3,MLST8,MMACHC,MRPL37,MRPL4,MRPS18A, MRPS2,PAFAH1B3,PPP1R1B,PRMT7,SFXN4,TARBP2,TIMM13 |
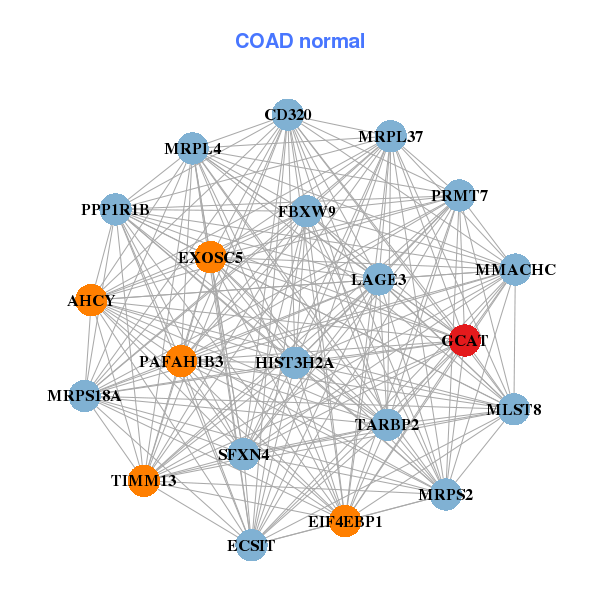
| * Co-Expression network figures were drawn using R package igraph. Only the top 20 genes with the highest correlations were shown. Red circle: input gene, orange circle: cell metabolism gene, sky circle: other gene |
: Open all plots for all cancer types
| Top |
: Open all interacting genes' information including KEGG pathway for all interacting genes from DAVID
| Top |
| Pharmacological Information for GCAT |
| DB Category | DB Name | DB's ID and Url link |
| * Gene Centered Interaction Network. |
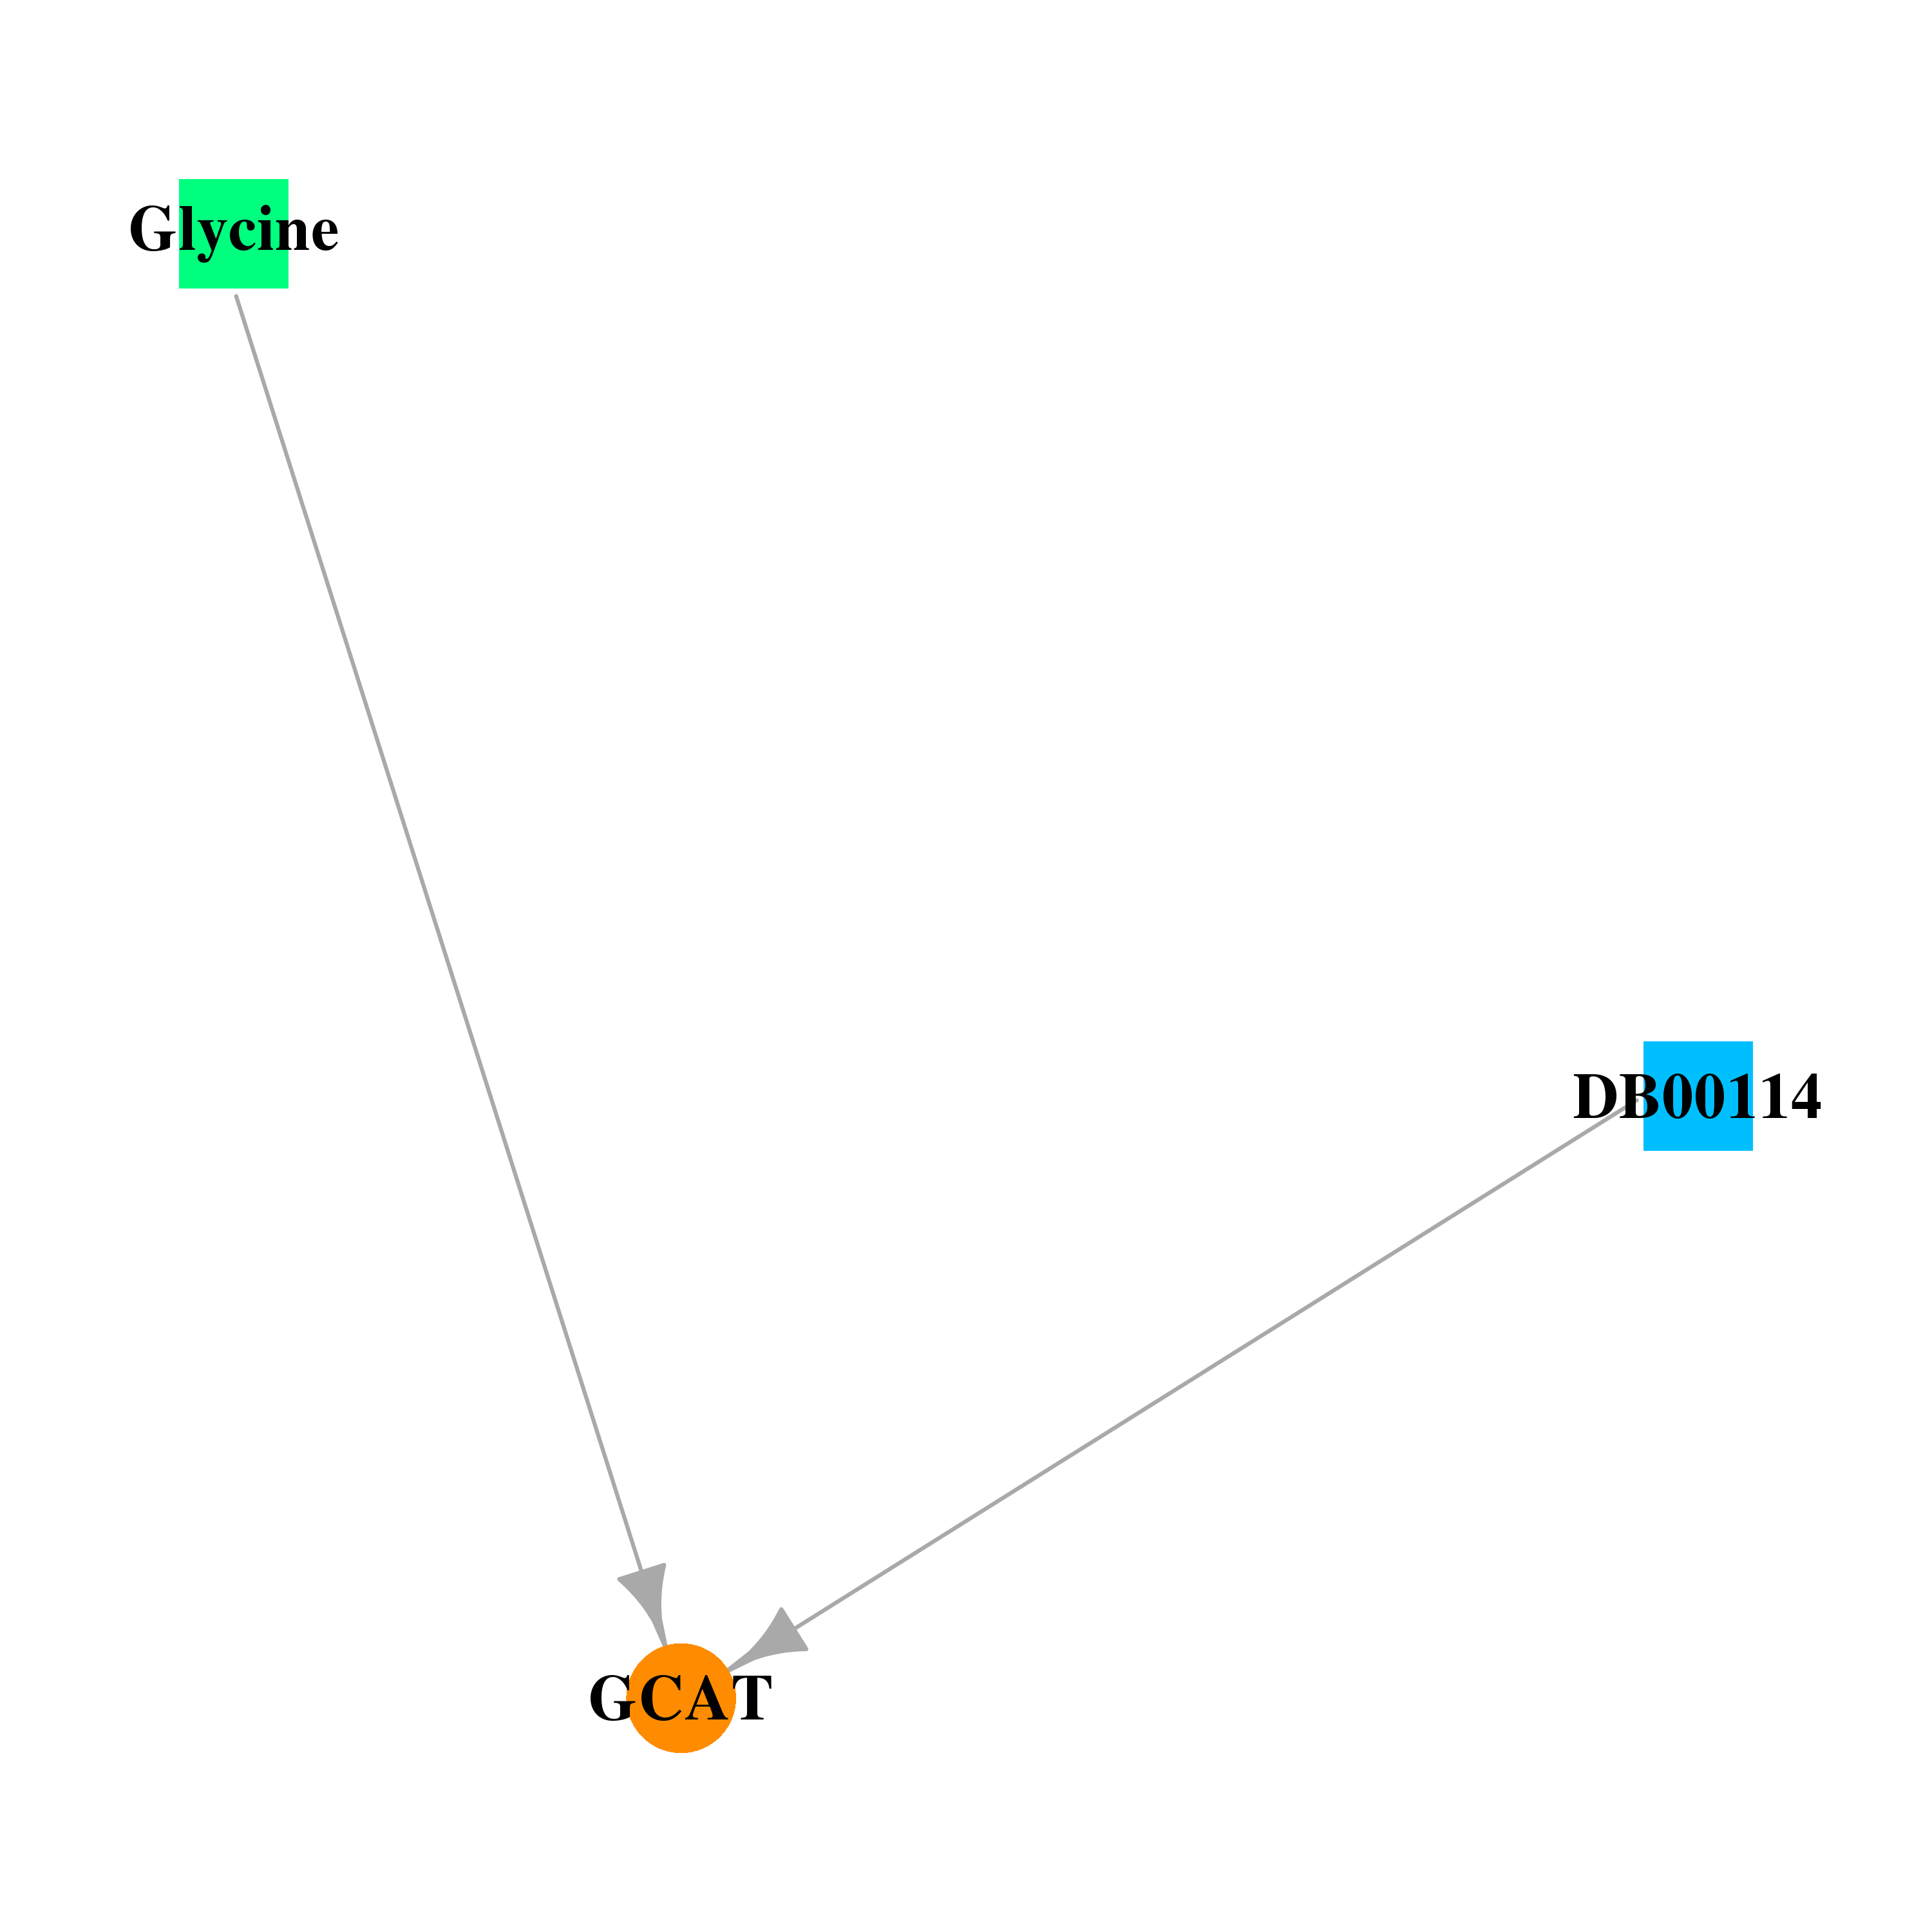 |
| * Drug Centered Interaction Network. |
| DrugBank ID | Target Name | Drug Groups | Generic Name | Drug Centered Network | Drug Structure |
| DB00114 | glycine C-acetyltransferase | nutraceutical | Pyridoxal Phosphate |  |  |
| DB00145 | glycine C-acetyltransferase | approved; nutraceutical | Glycine |  |  |
| Top |
| Cross referenced IDs for GCAT |
| * We obtained these cross-references from Uniprot database. It covers 150 different DBs, 18 categories. http://www.uniprot.org/help/cross_references_section |
: Open all cross reference information
|
Copyright © 2016-Present - The Univsersity of Texas Health Science Center at Houston @ |