|
|||||||||||||||||||||||||||||||||||||||||||||||||||||||||||||||||||||||||||||||||||||||||||||||||||||||||||||||||||||||||||||||||||||||||||||||||||||||||||||||||||||||||||||||||||||||||||||||||||||||||||||||||||||||||||||||||||||||||||||||||||||||||||||||||||||||||||||||||||||||||||||||||||||||||||||||||||||||||||||||||||||||||||||
| |
| Phenotypic Information (metabolism pathway, cancer, disease, phenome) |
| |
| |
| Gene-Gene Network Information: Co-Expression Network, Interacting Genes & KEGG |
| |
|


| Gene Summary for TRAM1 |
| Basic gene info. | Gene symbol | TRAM1 |
| Gene name | translocation associated membrane protein 1 | |
| Synonyms | PNAS8|TRAM|TRAMP | |
| Cytomap | UCSC genome browser: 8q13.3 | |
| Genomic location | chr8 :71485452-71520694 | |
| Type of gene | protein-coding | |
| RefGenes | NM_014294.5, | |
| Ensembl id | ENSG00000067167 | |
| Description | translocating chain-associated membrane protein 1translocating chain-associating membrane proteintranslocation-associating membrane protein 1 | |
| Modification date | 20141207 | |
| dbXrefs | MIM : 605190 | |
| HGNC : HGNC | ||
| Ensembl : ENSG00000067167 | ||
| HPRD : 05545 | ||
| Vega : OTTHUMG00000164428 | ||
| Protein | UniProt: go to UniProt's Cross Reference DB Table | |
| Expression | CleanEX: HS_TRAM1 | |
| BioGPS: 23471 | ||
| Gene Expression Atlas: ENSG00000067167 | ||
| The Human Protein Atlas: ENSG00000067167 | ||
| Pathway | NCI Pathway Interaction Database: TRAM1 | |
| KEGG: TRAM1 | ||
| REACTOME: TRAM1 | ||
| ConsensusPathDB | ||
| Pathway Commons: TRAM1 | ||
| Metabolism | MetaCyc: TRAM1 | |
| HUMANCyc: TRAM1 | ||
| Regulation | Ensembl's Regulation: ENSG00000067167 | |
| miRBase: chr8 :71,485,452-71,520,694 | ||
| TargetScan: NM_014294 | ||
| cisRED: ENSG00000067167 | ||
| Context | iHOP: TRAM1 | |
| cancer metabolism search in PubMed: TRAM1 | ||
| UCL Cancer Institute: TRAM1 | ||
| Assigned class in ccmGDB | C | |
| Top |
| Phenotypic Information for TRAM1(metabolism pathway, cancer, disease, phenome) |
| Cancer | CGAP: TRAM1 |
| Familial Cancer Database: TRAM1 | |
| * This gene is included in those cancer gene databases. |
|
|
|
|
|
| . | |||||||||||||||||||||||||||||||||||||||||||||||||||||||||||||||||||||||||||||||||||||||||||||||||||||||||||||||||||||||||||||||||||||||||||||||||||||||||||||||||||||||||||||||||||||||||||||||||||||||||||||||||||||||||||||||||||||||||||||||||||||||||||||||||||||||||||||||||||||||||||||||||||||||||||||||||||||||||||||||||||||||
Oncogene 1 | Significant driver gene in | ||||||||||||||||||||||||||||||||||||||||||||||||||||||||||||||||||||||||||||||||||||||||||||||||||||||||||||||||||||||||||||||||||||||||||||||||||||||||||||||||||||||||||||||||||||||||||||||||||||||||||||||||||||||||||||||||||||||||||||||||||||||||||||||||||||||||||||||||||||||||||||||||||||||||||||||||||||||||||||||||||||||||||||
| cf) number; DB name 1 Oncogene; http://nar.oxfordjournals.org/content/35/suppl_1/D721.long, 2 Tumor Suppressor gene; https://bioinfo.uth.edu/TSGene/, 3 Cancer Gene Census; http://www.nature.com/nrc/journal/v4/n3/abs/nrc1299.html, 4 CancerGenes; http://nar.oxfordjournals.org/content/35/suppl_1/D721.long, 5 Network of Cancer Gene; http://ncg.kcl.ac.uk/index.php, 1Therapeutic Vulnerabilities in Cancer; http://cbio.mskcc.org/cancergenomics/statius/ |
| REACTOME_METABOLISM_OF_PROTEINS | |
| OMIM | |
| Orphanet | |
| Disease | KEGG Disease: TRAM1 |
| MedGen: TRAM1 (Human Medical Genetics with Condition) | |
| ClinVar: TRAM1 | |
| Phenotype | MGI: TRAM1 (International Mouse Phenotyping Consortium) |
| PhenomicDB: TRAM1 | |
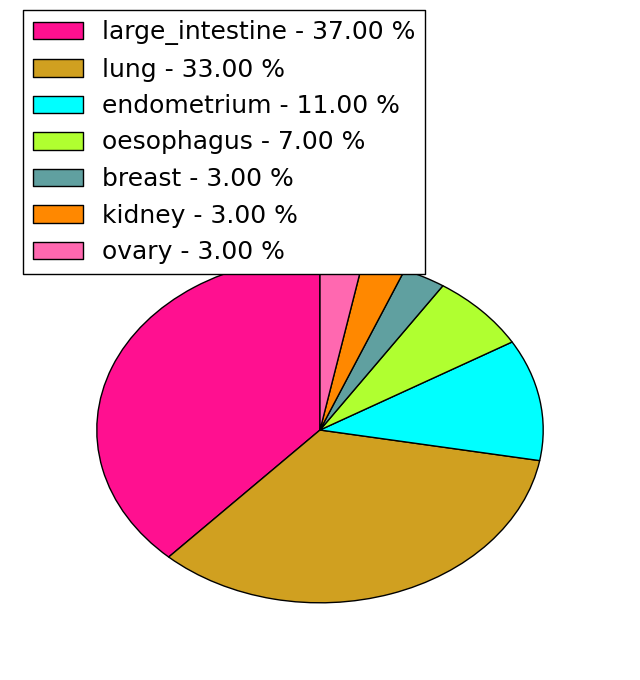
| Mutations for TRAM1 |
| * Under tables are showing count per each tissue to give us broad intuition about tissue specific mutation patterns.You can go to the detailed page for each mutation database's web site. |
| - Statistics for Tissue and Mutation type | Top |
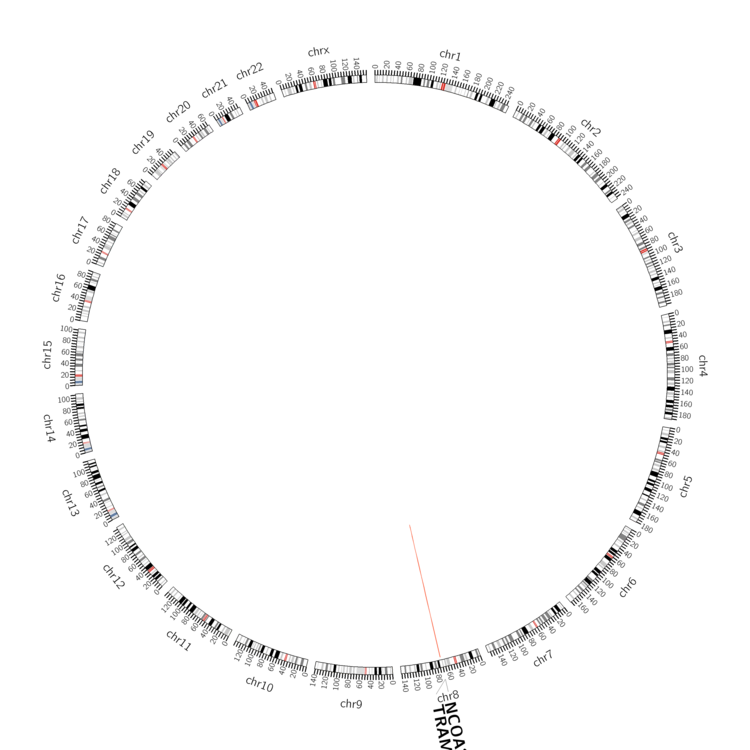 |
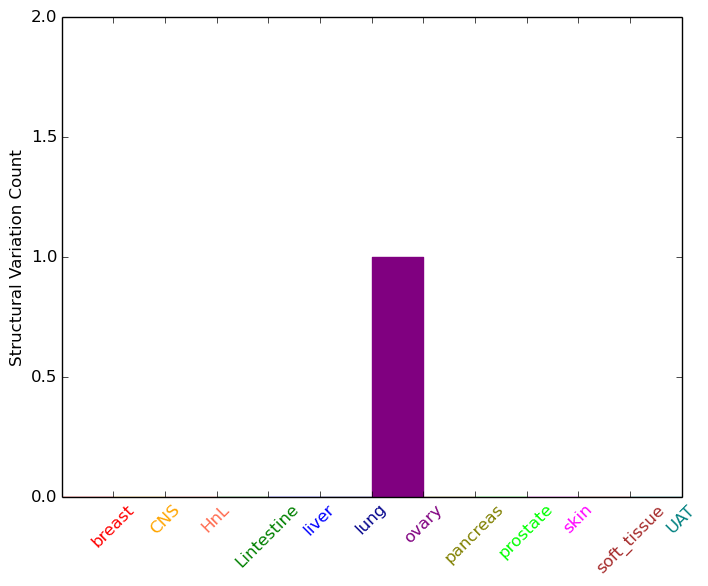
| - For Inter-chromosomal Variations |
| There's no inter-chromosomal structural variation. |
| - For Intra-chromosomal Variations |
| * Intra-chromosomal variantions includes 'intrachromosomal amplicon to amplicon', 'intrachromosomal amplicon to non-amplified dna', 'intrachromosomal deletion', 'intrachromosomal fold-back inversion', 'intrachromosomal inversion', 'intrachromosomal tandem duplication', 'Intrachromosomal unknown type', 'intrachromosomal with inverted orientation', 'intrachromosomal with non-inverted orientation'. |
 |
| Sample | Symbol_a | Chr_a | Start_a | End_a | Symbol_b | Chr_b | Start_b | End_b |
| ovary | TRAM1 | chr8 | 71486908 | 71486928 | NCOA2 | chr8 | 71055314 | 71055334 |
| cf) Tissue number; Tissue name (1;Breast, 2;Central_nervous_system, 3;Haematopoietic_and_lymphoid_tissue, 4;Large_intestine, 5;Liver, 6;Lung, 7;Ovary, 8;Pancreas, 9;Prostate, 10;Skin, 11;Soft_tissue, 12;Upper_aerodigestive_tract) |
| * From mRNA Sanger sequences, Chitars2.0 arranged chimeric transcripts. This table shows TRAM1 related fusion information. |
| ID | Head Gene | Tail Gene | Accession | Gene_a | qStart_a | qEnd_a | Chromosome_a | tStart_a | tEnd_a | Gene_a | qStart_a | qEnd_a | Chromosome_a | tStart_a | tEnd_a |
| W89040 | AUTS2 | 1 | 65 | 7 | 69624608 | 69624672 | TRAM1 | 58 | 237 | 8 | 71507291 | 71507470 | |
| AI207431 | TRAM1 | 1 | 216 | 8 | 71516081 | 71516296 | RAP1A | 209 | 673 | 1 | 112255277 | 112255741 | |
| Top |
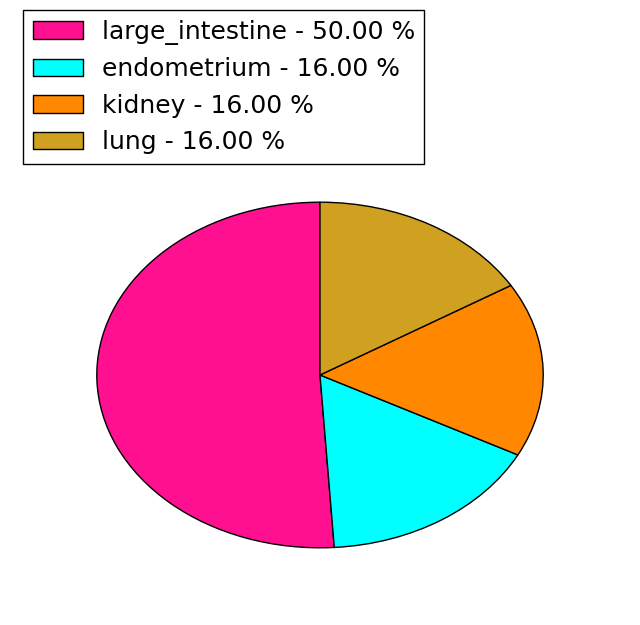
| Mutation type/ Tissue ID | brca | cns | cerv | endome | haematopo | kidn | Lintest | liver | lung | ns | ovary | pancre | prost | skin | stoma | thyro | urina | |||
| Total # sample | 3 | 1 | 1 | |||||||||||||||||
| GAIN (# sample) | 2 | 1 | ||||||||||||||||||
| LOSS (# sample) | 1 | 1 |
| cf) Tissue ID; Tissue type (1; Breast, 2; Central_nervous_system, 3; Cervix, 4; Endometrium, 5; Haematopoietic_and_lymphoid_tissue, 6; Kidney, 7; Large_intestine, 8; Liver, 9; Lung, 10; NS, 11; Ovary, 12; Pancreas, 13; Prostate, 14; Skin, 15; Stomach, 16; Thyroid, 17; Urinary_tract) |
| Top |
|
 |
| Top |
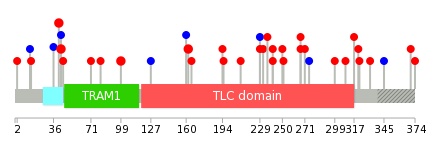
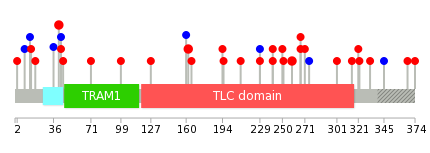
| Stat. for Non-Synonymous SNVs (# total SNVs=27) | (# total SNVs=6) |
 |  |
(# total SNVs=0) | (# total SNVs=0) |
| Top |
| * When you move the cursor on each content, you can see more deailed mutation information on the Tooltip. Those are primary_site,primary_histology,mutation(aa),pubmedID. |
| GRCh37 position | Mutation(aa) | Unique sampleID count |
| chr8:71510383-71510383 | p.E99Q | 2 |
| chr8:71495976-71495976 | p.L267I | 2 |
| chr8:71508498-71508498 | p.T162I | 2 |
| chr8:71512313-71512313 | p.T43M | 2 |
| chr8:71520314-71520314 | p.E41Q | 2 |
| chr8:71510234-71510234 | p.R108* | 1 |
| chr8:71495501-71495501 | p.N317H | 1 |
| chr8:71520391-71520391 | p.S15I | 1 |
| chr8:71499182-71499182 | p.L232I | 1 |
| chr8:71510247-71510247 | p.? | 1 |
| Top |
|
 |
| Point Mutation/ Tissue ID | 1 | 2 | 3 | 4 | 5 | 6 | 7 | 8 | 9 | 10 | 11 | 12 | 13 | 14 | 15 | 16 | 17 | 18 | 19 | 20 |
| # sample | 3 | 1 | 9 | 3 | 2 | 4 | 3 | 1 | 1 | 4 | 3 | 4 | ||||||||
| # mutation | 2 | 1 | 10 | 3 | 2 | 4 | 3 | 1 | 1 | 3 | 3 | 4 | ||||||||
| nonsynonymous SNV | 1 | 1 | 7 | 2 | 1 | 4 | 3 | 1 | 1 | 3 | 2 | 3 | ||||||||
| synonymous SNV | 1 | 3 | 1 | 1 | 1 | 1 |
| cf) Tissue ID; Tissue type (1; BLCA[Bladder Urothelial Carcinoma], 2; BRCA[Breast invasive carcinoma], 3; CESC[Cervical squamous cell carcinoma and endocervical adenocarcinoma], 4; COAD[Colon adenocarcinoma], 5; GBM[Glioblastoma multiforme], 6; Glioma Low Grade, 7; HNSC[Head and Neck squamous cell carcinoma], 8; KICH[Kidney Chromophobe], 9; KIRC[Kidney renal clear cell carcinoma], 10; KIRP[Kidney renal papillary cell carcinoma], 11; LAML[Acute Myeloid Leukemia], 12; LUAD[Lung adenocarcinoma], 13; LUSC[Lung squamous cell carcinoma], 14; OV[Ovarian serous cystadenocarcinoma ], 15; PAAD[Pancreatic adenocarcinoma], 16; PRAD[Prostate adenocarcinoma], 17; SKCM[Skin Cutaneous Melanoma], 18:STAD[Stomach adenocarcinoma], 19:THCA[Thyroid carcinoma], 20:UCEC[Uterine Corpus Endometrial Carcinoma]) |
| Top |
| * We represented just top 10 SNVs. When you move the cursor on each content, you can see more deailed mutation information on the Tooltip. Those are primary_site, primary_histology, mutation(aa), pubmedID. |
| Genomic Position | Mutation(aa) | Unique sampleID count |
| chr8:71520314 | p.L267F | 2 |
| chr8:71495976 | p.L259F | 2 |
| chr8:71495998 | p.E41Q | 2 |
| chr8:71508498 | p.T162I | 2 |
| chr8:71512312 | p.S71F | 1 |
| chr8:71495549 | p.K45N | 1 |
| chr8:71499350 | p.S251F | 1 |
| chr8:71512313 | p.T43T | 1 |
| chr8:71495950 | p.F250L | 1 |
| chr8:71499399 | p.T43M | 1 |
| * Copy number data were extracted from TCGA using R package TCGA-Assembler. The URLs of all public data files on TCGA DCC data server were gathered on Jan-05-2015. Function ProcessCNAData in TCGA-Assembler package was used to obtain gene-level copy number value which is calculated as the average copy number of the genomic region of a gene. |
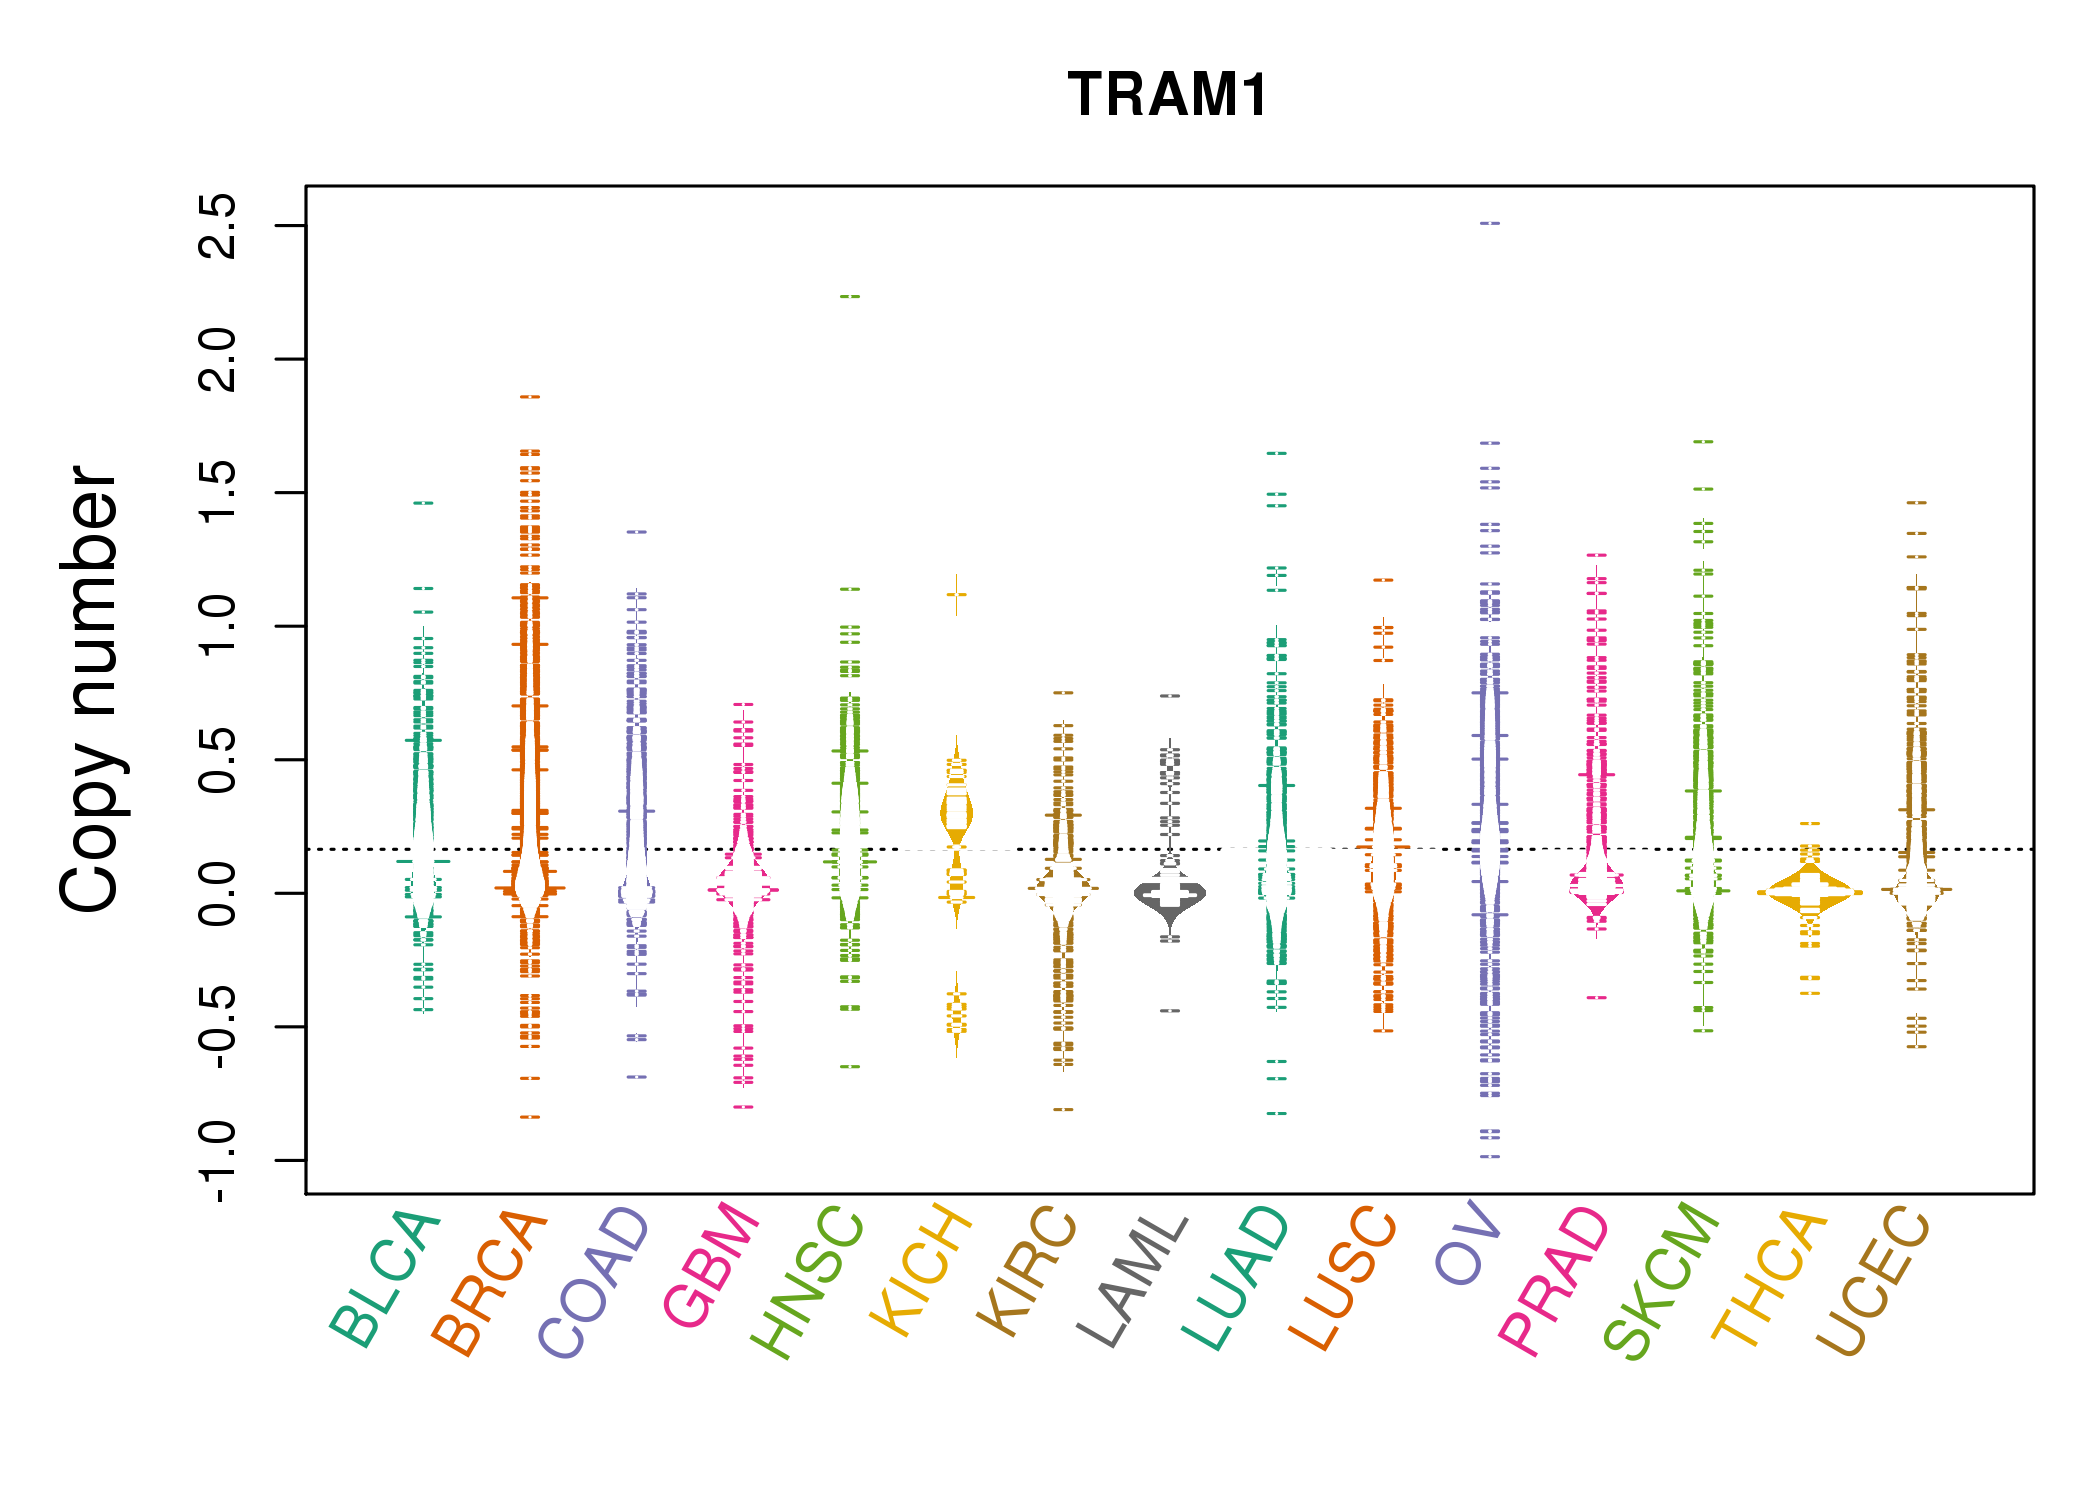 |
| cf) Tissue ID[Tissue type]: BLCA[Bladder Urothelial Carcinoma], BRCA[Breast invasive carcinoma], CESC[Cervical squamous cell carcinoma and endocervical adenocarcinoma], COAD[Colon adenocarcinoma], GBM[Glioblastoma multiforme], Glioma Low Grade, HNSC[Head and Neck squamous cell carcinoma], KICH[Kidney Chromophobe], KIRC[Kidney renal clear cell carcinoma], KIRP[Kidney renal papillary cell carcinoma], LAML[Acute Myeloid Leukemia], LUAD[Lung adenocarcinoma], LUSC[Lung squamous cell carcinoma], OV[Ovarian serous cystadenocarcinoma ], PAAD[Pancreatic adenocarcinoma], PRAD[Prostate adenocarcinoma], SKCM[Skin Cutaneous Melanoma], STAD[Stomach adenocarcinoma], THCA[Thyroid carcinoma], UCEC[Uterine Corpus Endometrial Carcinoma] |
| Top |
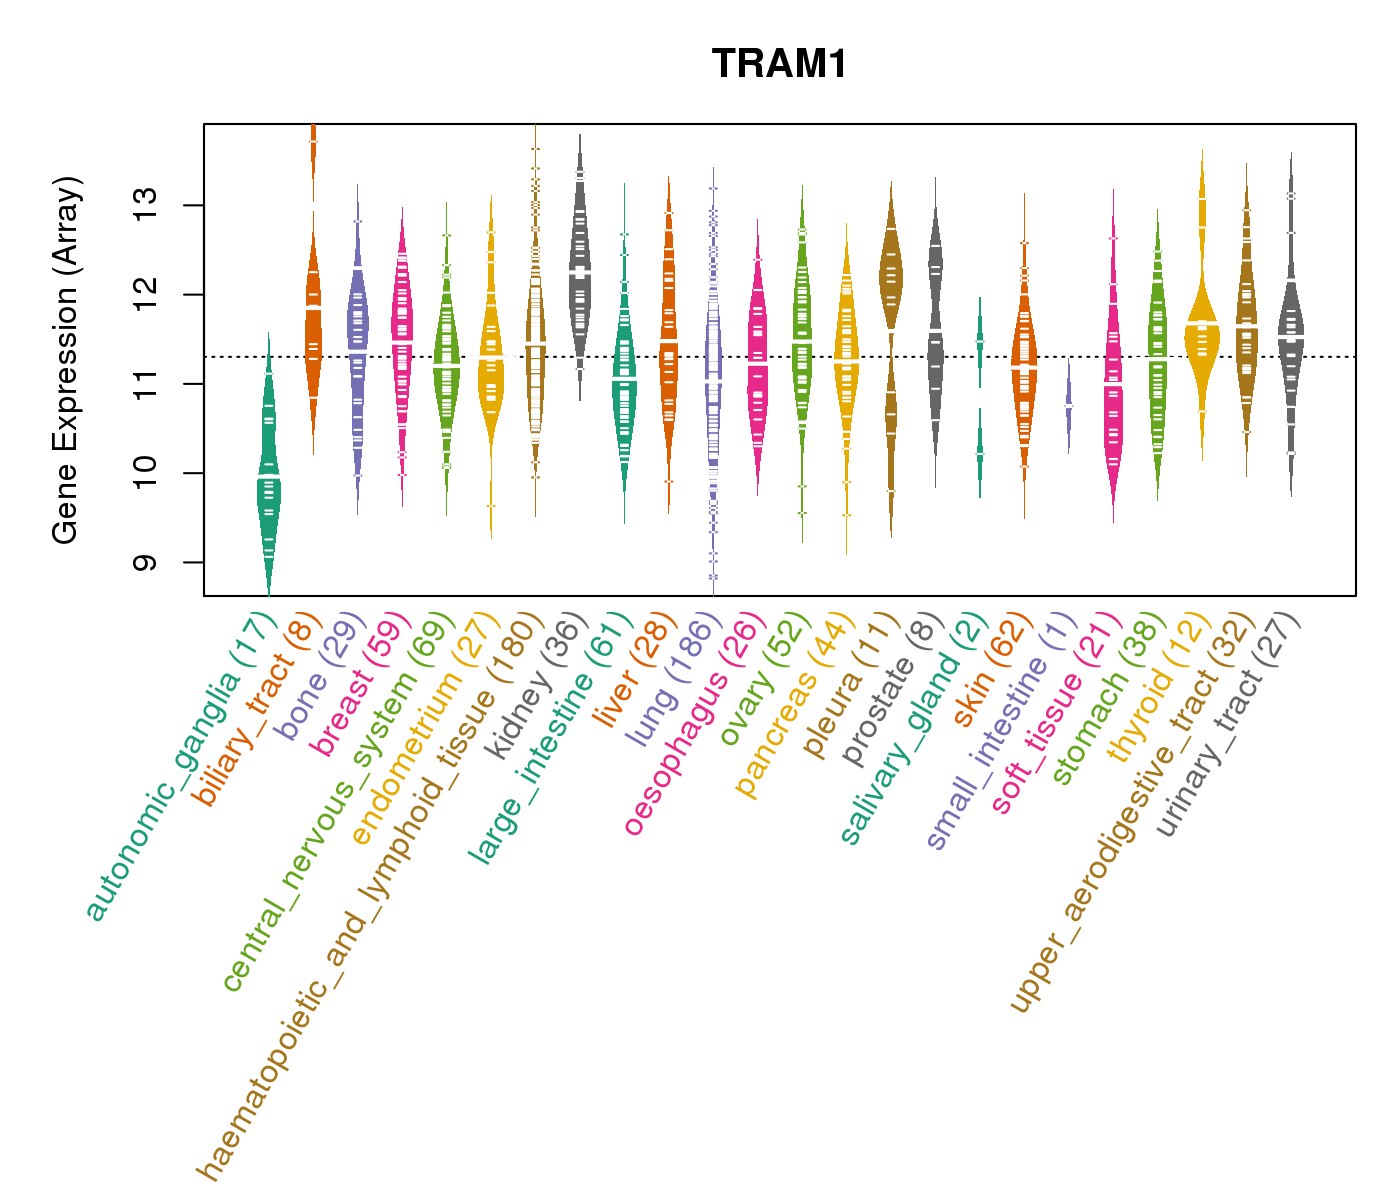
| Gene Expression for TRAM1 |
| * CCLE gene expression data were extracted from CCLE_Expression_Entrez_2012-10-18.res: Gene-centric RMA-normalized mRNA expression data. |
 |
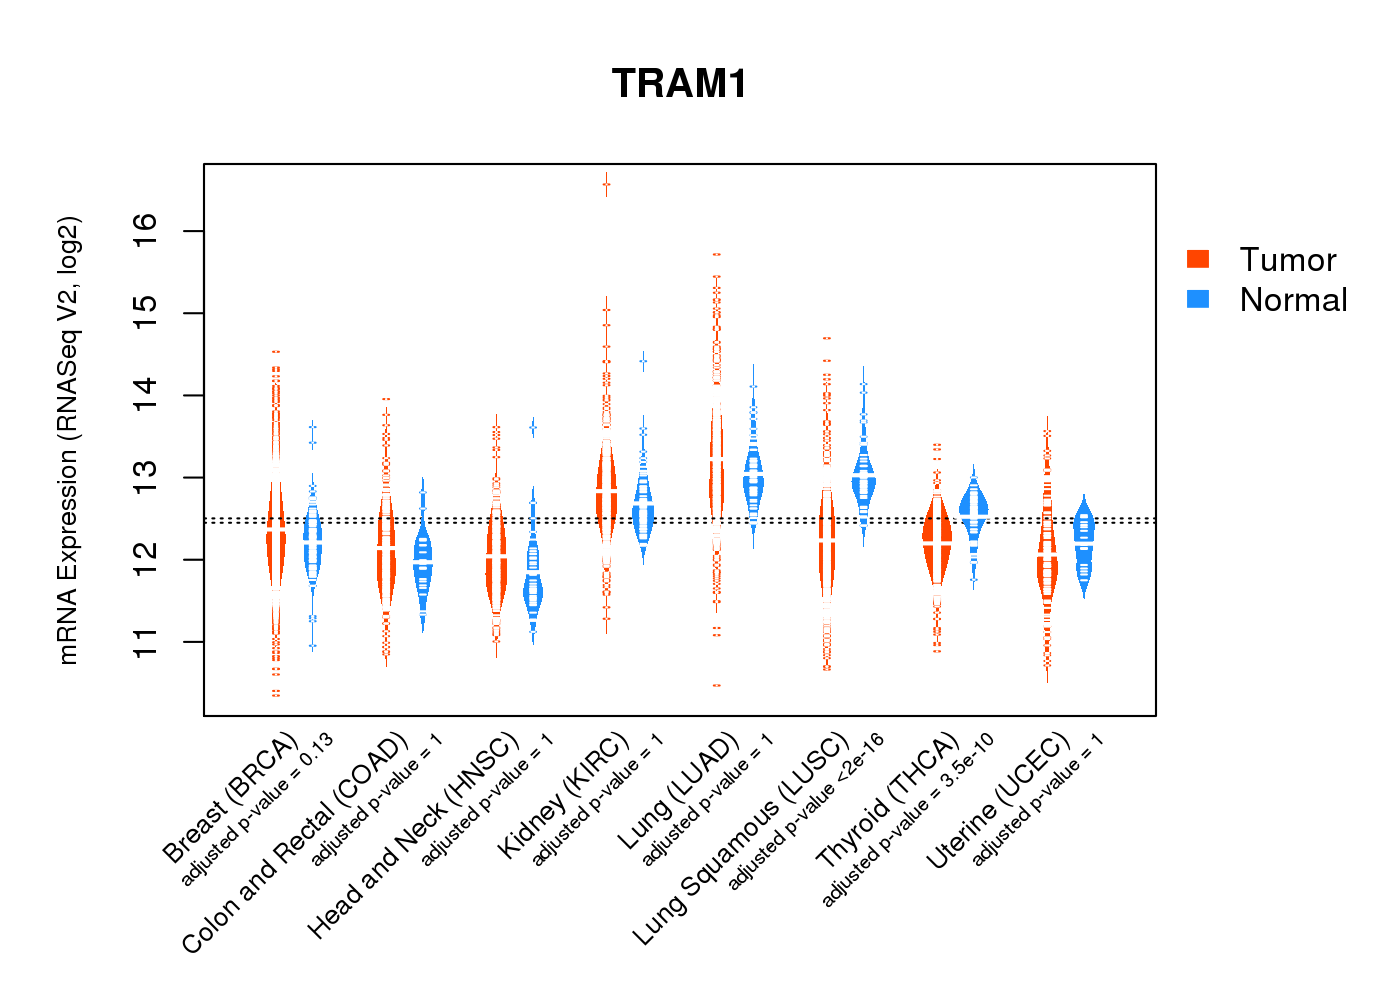
| * Normalized gene expression data of RNASeqV2 was extracted from TCGA using R package TCGA-Assembler. The URLs of all public data files on TCGA DCC data server were gathered at Jan-05-2015. Only eight cancer types have enough normal control samples for differential expression analysis. (t test, adjusted p<0.05 (using Benjamini-Hochberg FDR)) |
 |
| Top |
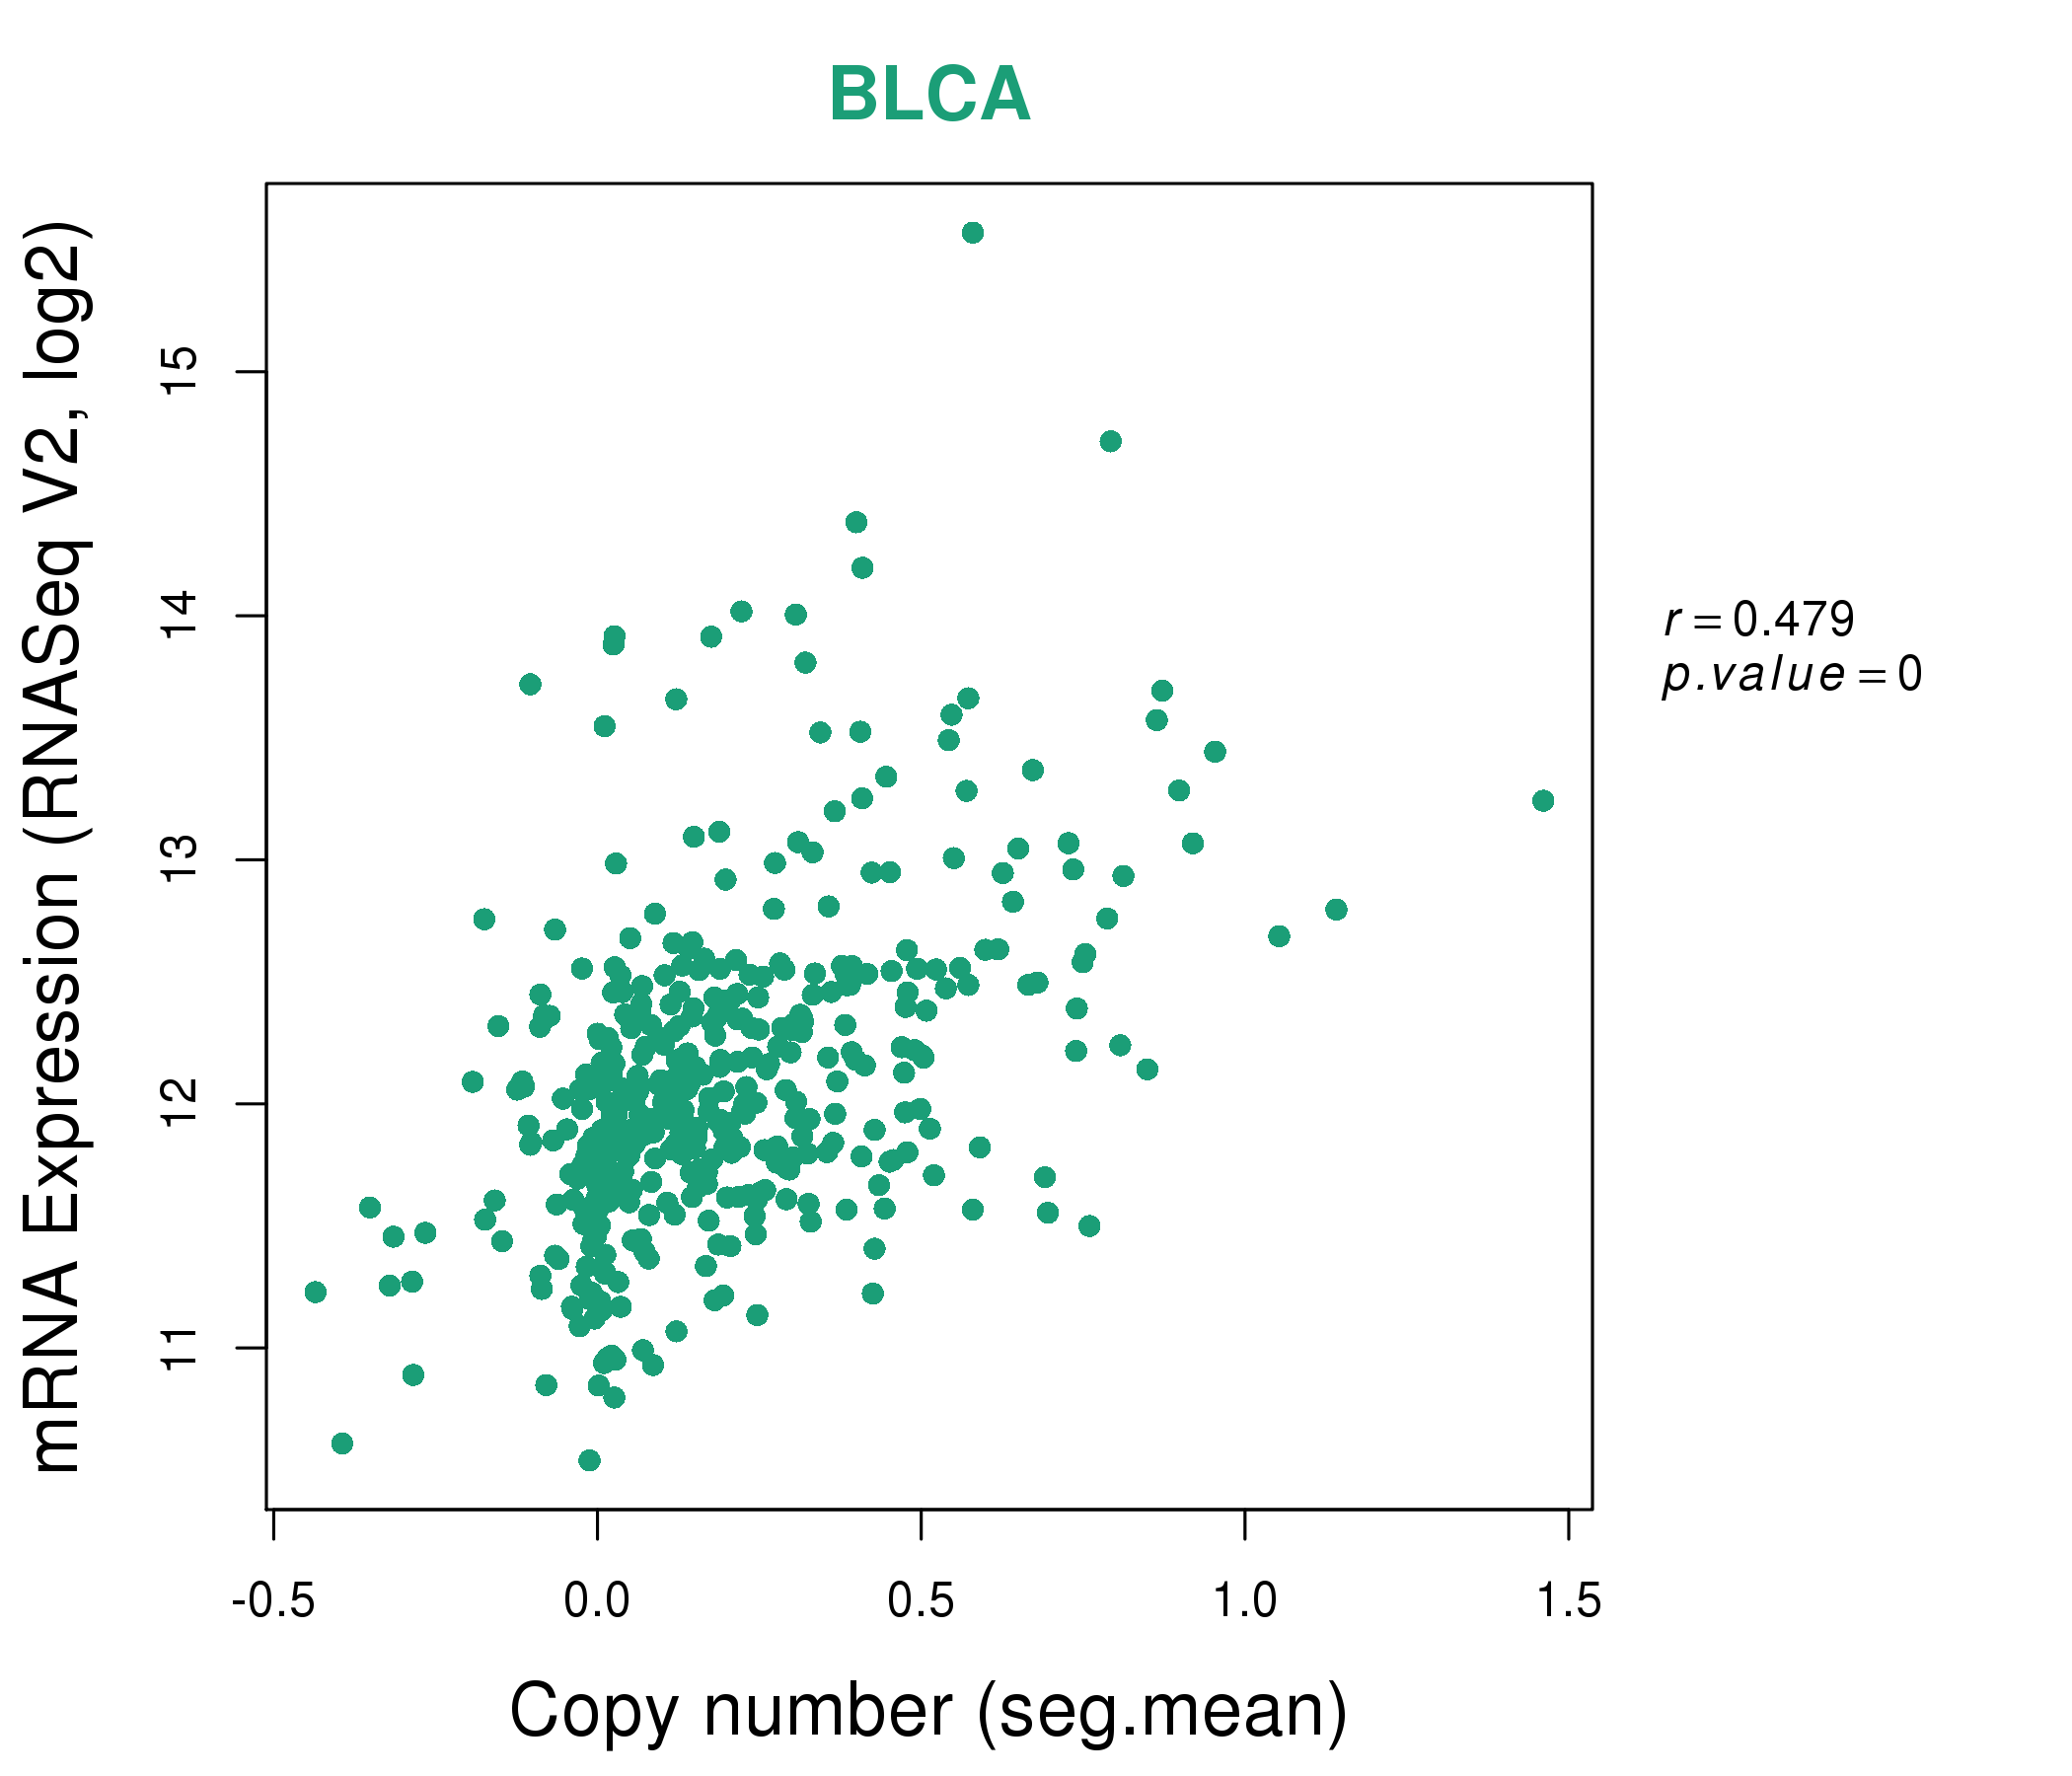
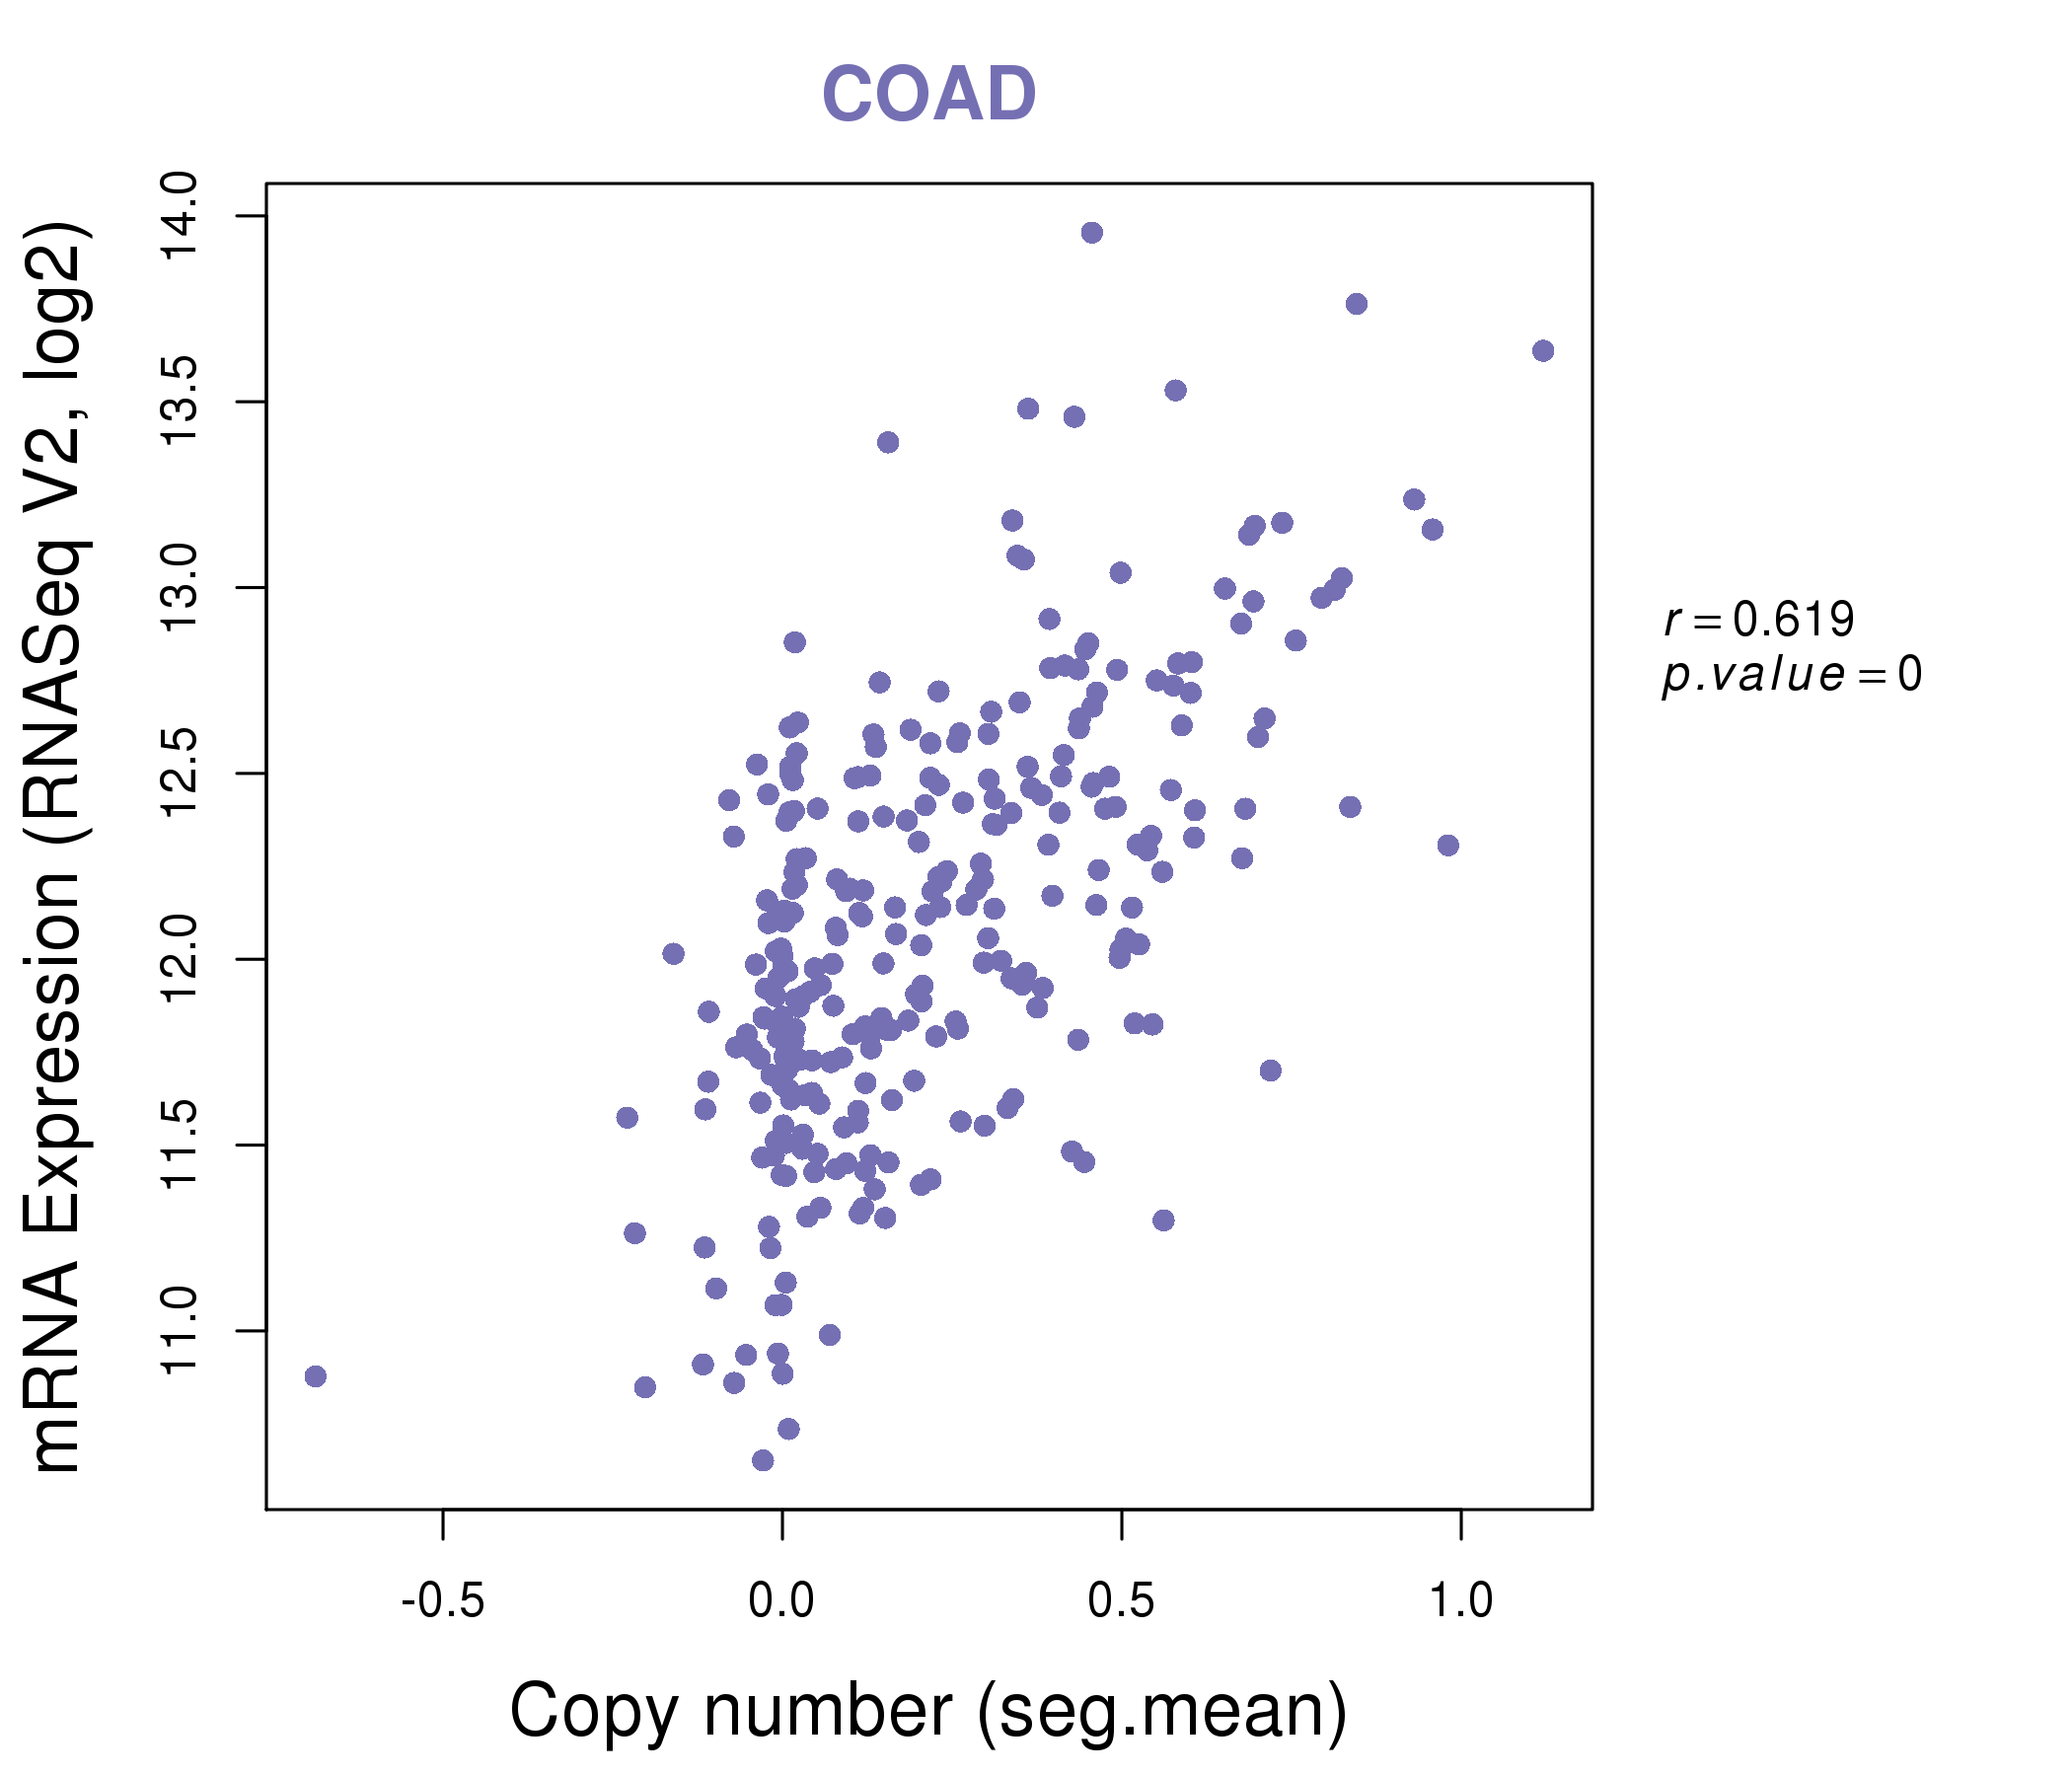
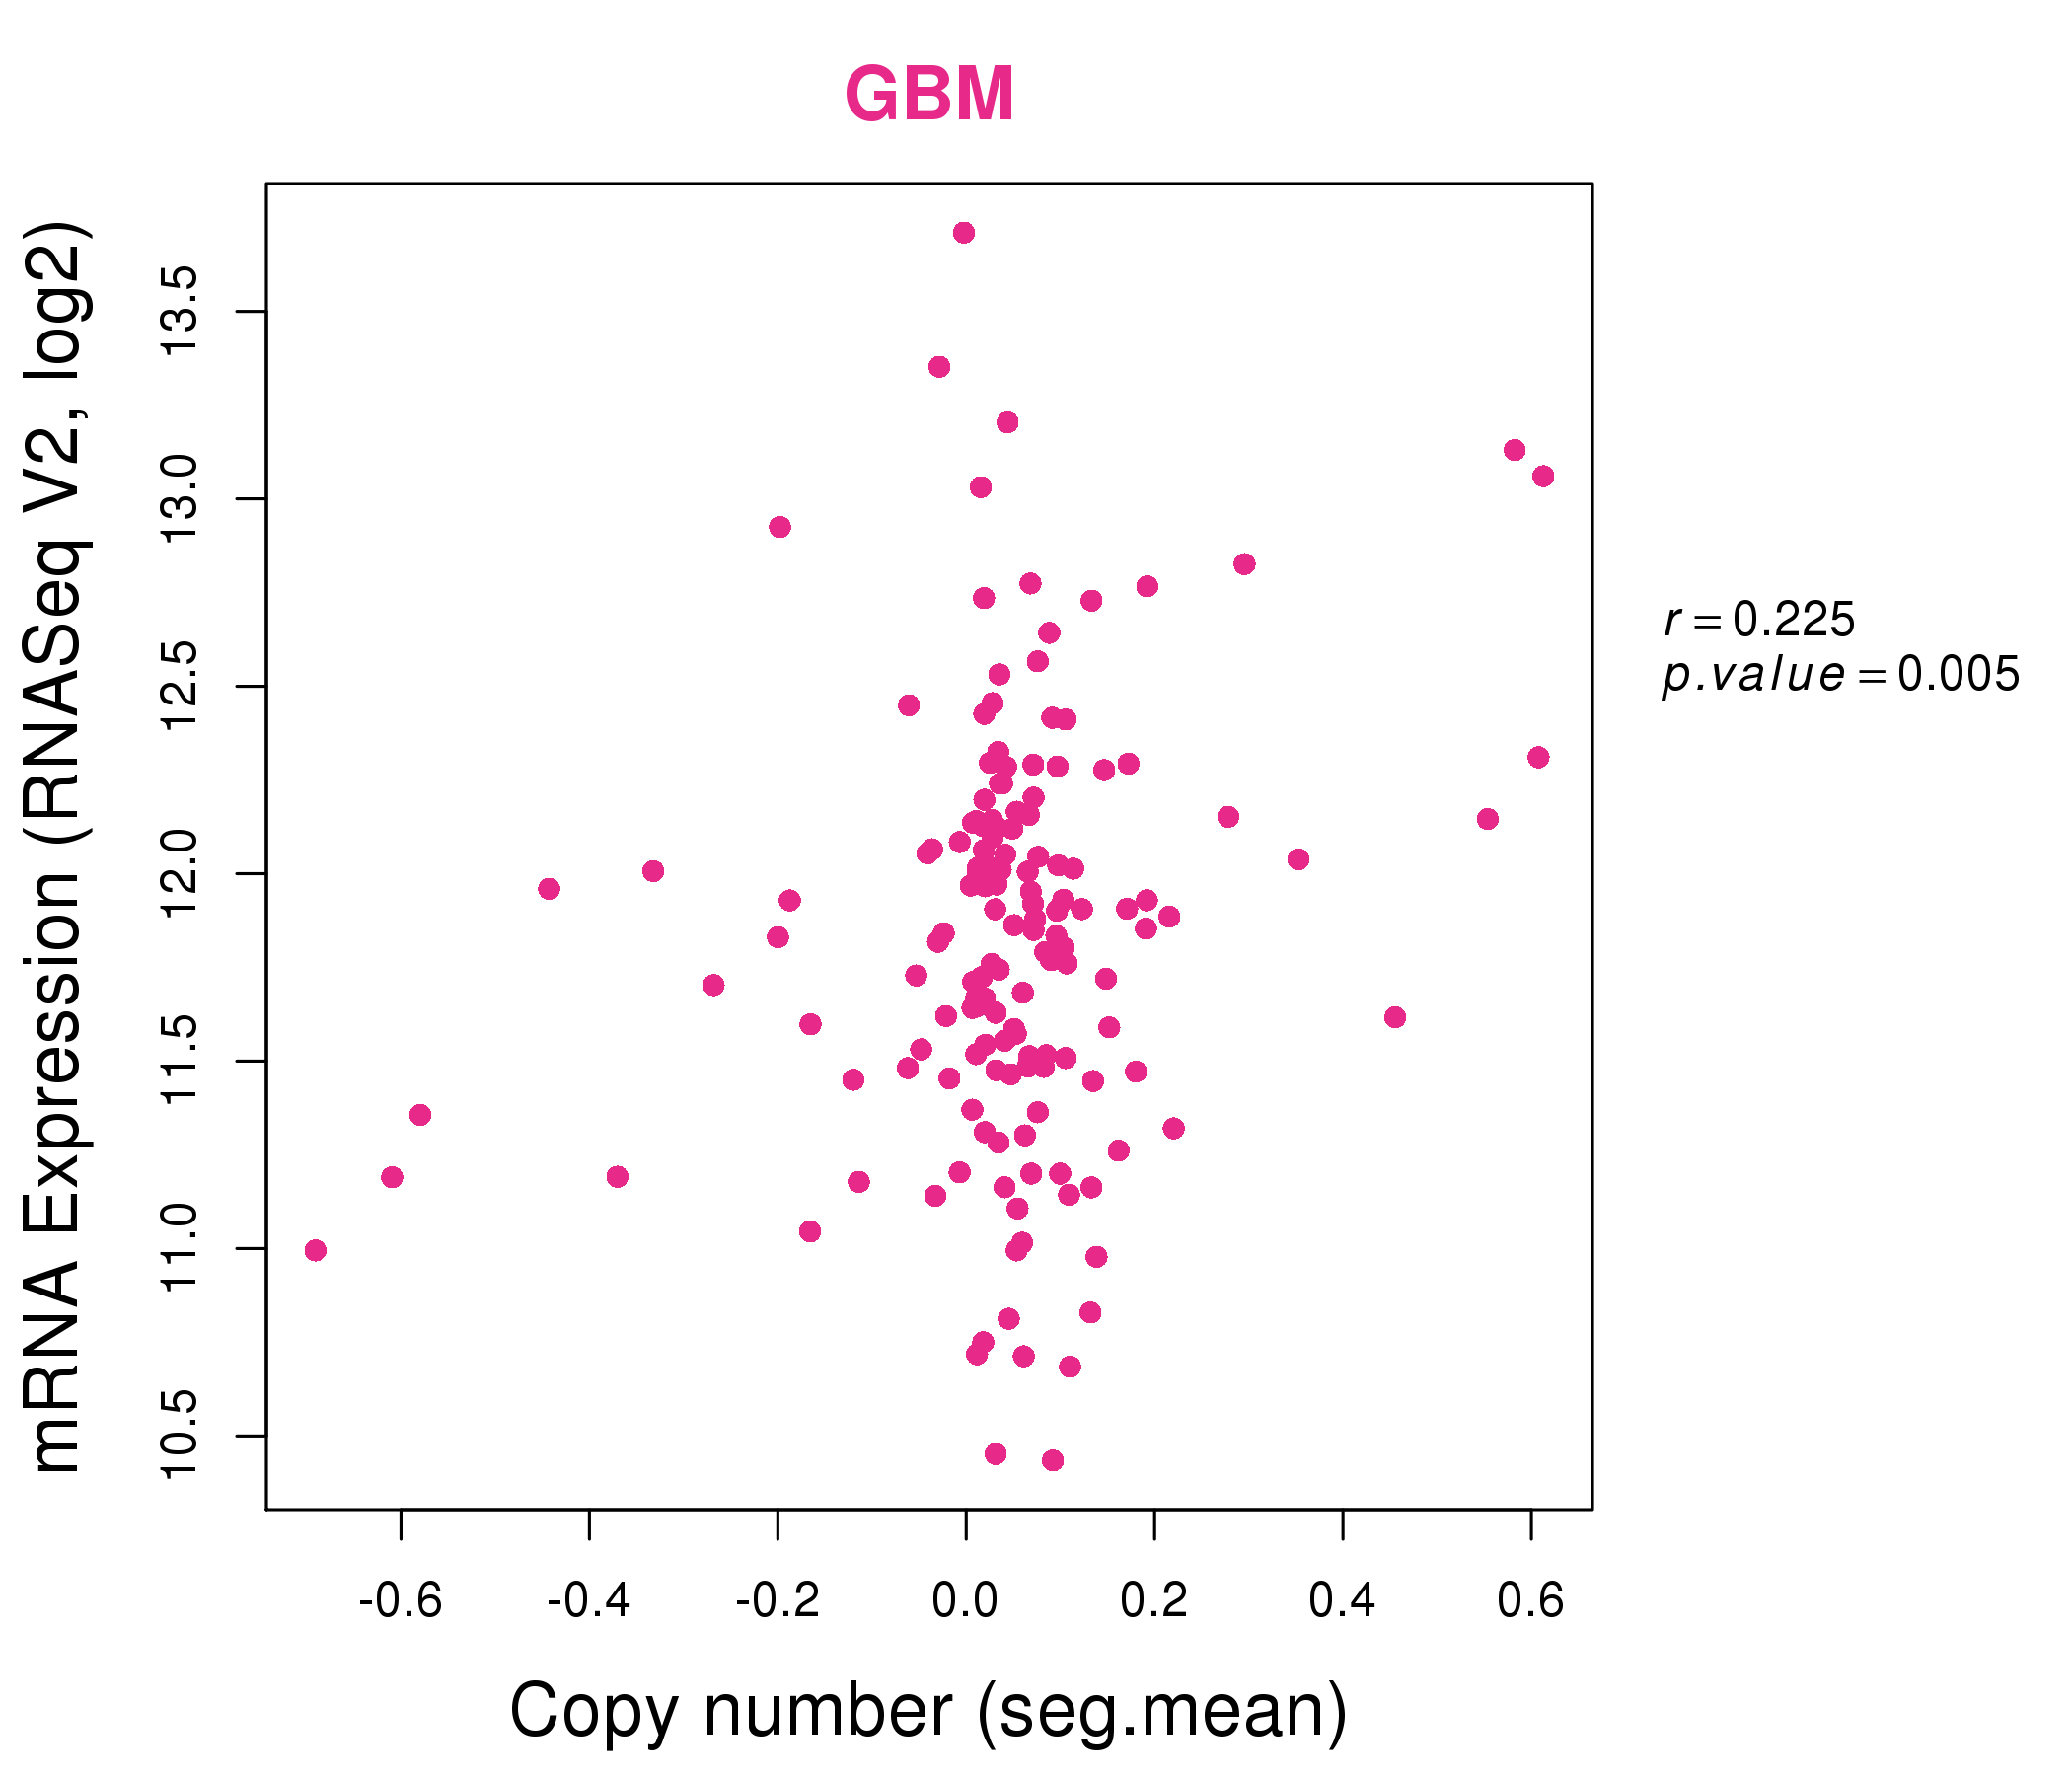
| * This plots show the correlation between CNV and gene expression. |
: Open all plots for all cancer types
 |
|
 |
|

| Top |
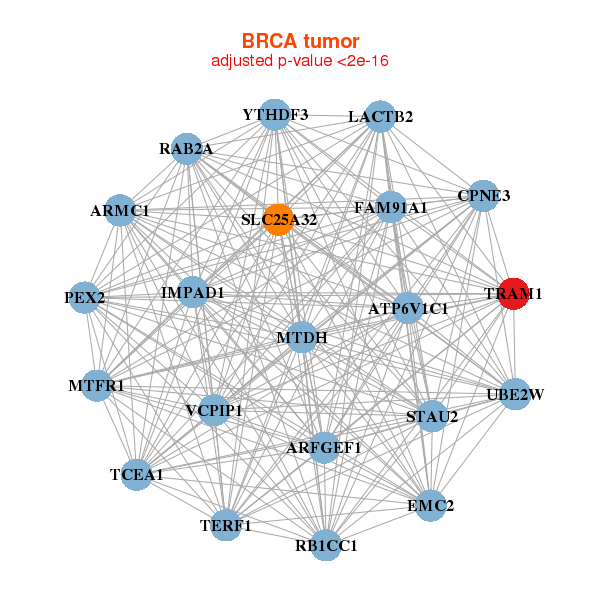
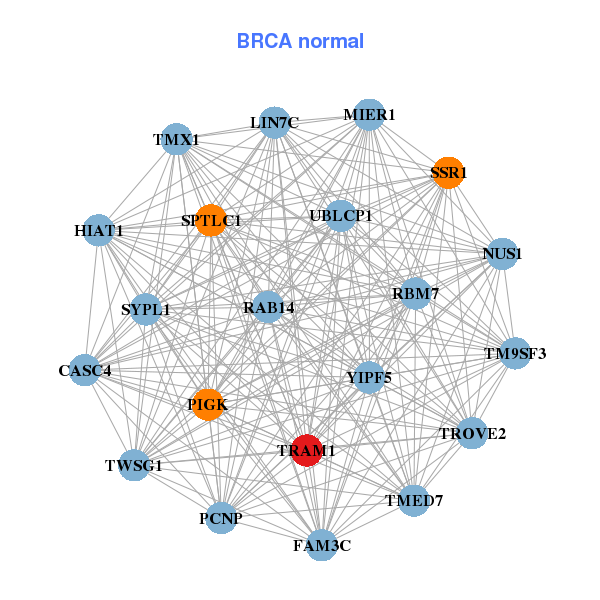
| Gene-Gene Network Information |
| * Co-Expression network figures were drawn using R package igraph. Only the top 20 genes with the highest correlations were shown. Red circle: input gene, orange circle: cell metabolism gene, sky circle: other gene |
: Open all plots for all cancer types
 |
| ||||
| ARFGEF1,ARMC1,ATP6V1C1,CPNE3,FAM91A1,IMPAD1,LACTB2, MTDH,MTFR1,PEX2,RAB2A,RB1CC1,SLC25A32,STAU2, TCEA1,TERF1,TRAM1,EMC2,UBE2W,VCPIP1,YTHDF3 | CASC4,FAM3C,HIAT1,LIN7C,MIER1,NUS1,PCNP, PIGK,RAB14,RBM7,SPTLC1,SSR1,SYPL1,TM9SF3, TMED7,TMX1,TRAM1,TROVE2,TWSG1,UBLCP1,YIPF5 | ||||
 |
| ||||
| ARMC1,AZIN1,CPNE3,DERL1,DPY19L4,FAM91A1,HNF4G, LACTB2,MAL2,MTDH,MTFR1,NUDCD1,PEX2,PLEKHF2, RNF139,SLC25A32,STK3,TRAM1,UBE2W,YTHDF3,YWHAZ | ATG5,BET1,C18orf32,CCNC,CISD2,CNIH1,DNAJB9, HSBP1,MAGT1,MMADHC,OSTC,PEX2,RAP1B,SEP15, SNX6,SUB1,TPT1,TRAM1,UBE2D3,UBE2W,ZNF410 |
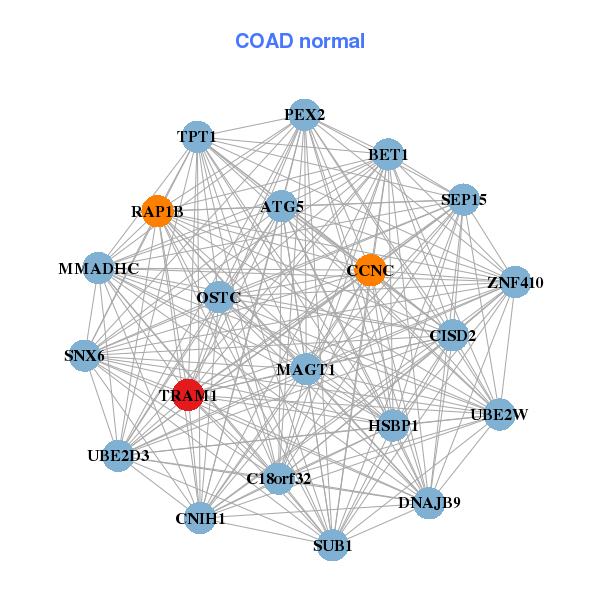
| * Co-Expression network figures were drawn using R package igraph. Only the top 20 genes with the highest correlations were shown. Red circle: input gene, orange circle: cell metabolism gene, sky circle: other gene |
: Open all plots for all cancer types
| Top |
: Open all interacting genes' information including KEGG pathway for all interacting genes from DAVID
| Top |
| Pharmacological Information for TRAM1 |
| DB Category | DB Name | DB's ID and Url link |
| * Gene Centered Interaction Network. |
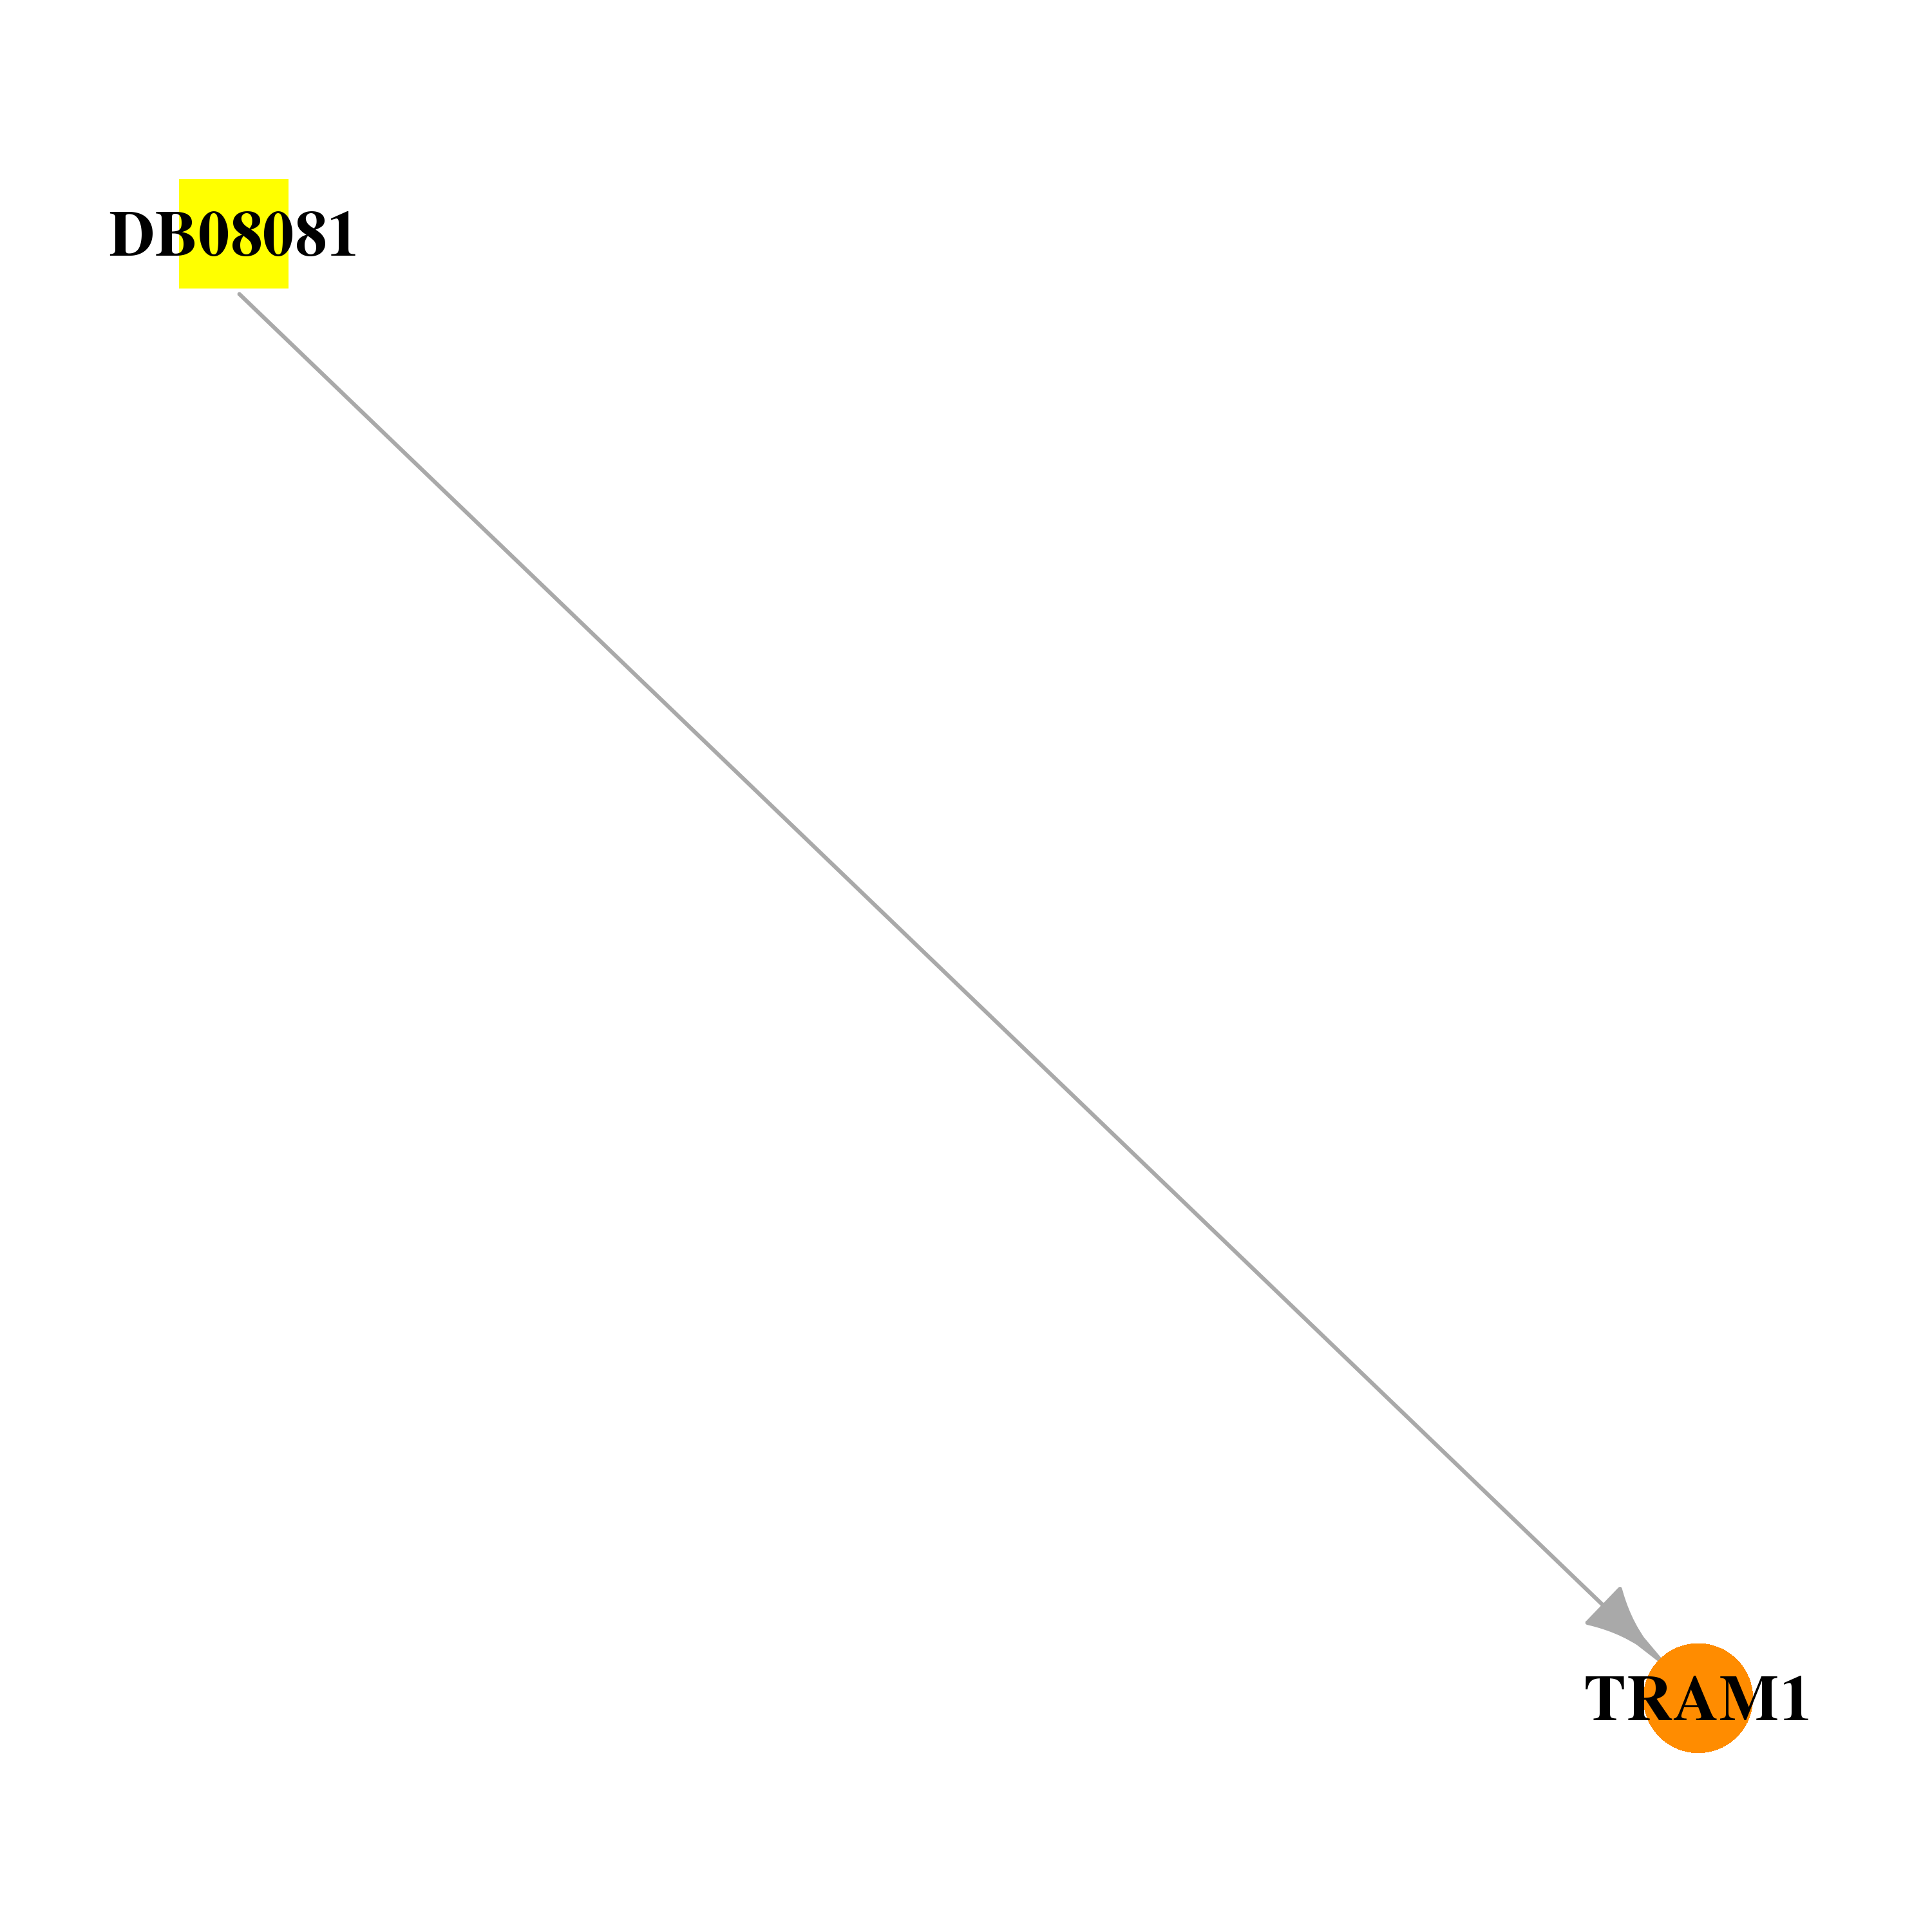 |
| * Drug Centered Interaction Network. |
| DrugBank ID | Target Name | Drug Groups | Generic Name | Drug Centered Network | Drug Structure |
| DB08081 | translocation associated membrane protein 1 | experimental | 3-OXO-OCTANOIC ACID (2-OXO-TETRAHYDRO-FURAN-3-YL)-AMIDE |  |  |
| Top |
| Cross referenced IDs for TRAM1 |
| * We obtained these cross-references from Uniprot database. It covers 150 different DBs, 18 categories. http://www.uniprot.org/help/cross_references_section |
: Open all cross reference information
|
Copyright © 2016-Present - The Univsersity of Texas Health Science Center at Houston @ |