|
||||||||||||||||||||
| |
| Phenotypic Information (metabolism pathway, cancer, disease, phenome) |
| |
| |
| Gene-Gene Network Information: Co-Expression Network, Interacting Genes & KEGG |
| |
|


| Gene Summary for RPL13A |
| Top |
| Phenotypic Information for RPL13A(metabolism pathway, cancer, disease, phenome) |
| Cancer | CGAP: RPL13A |
| Familial Cancer Database: RPL13A | |
| * This gene is included in those cancer gene databases. |
|
|
|
|
|
| . | ||||||||||||||
Oncogene 1 | Significant driver gene in | |||||||||||||||||||
| cf) number; DB name 1 Oncogene; http://nar.oxfordjournals.org/content/35/suppl_1/D721.long, 2 Tumor Suppressor gene; https://bioinfo.uth.edu/TSGene/, 3 Cancer Gene Census; http://www.nature.com/nrc/journal/v4/n3/abs/nrc1299.html, 4 CancerGenes; http://nar.oxfordjournals.org/content/35/suppl_1/D721.long, 5 Network of Cancer Gene; http://ncg.kcl.ac.uk/index.php, 1Therapeutic Vulnerabilities in Cancer; http://cbio.mskcc.org/cancergenomics/statius/ |
| REACTOME_METABOLISM_OF_PROTEINS REACTOME_METABOLISM_OF_MRNA REACTOME_METABOLISM_OF_RNA | |
| OMIM | |
| Orphanet | |
| Disease | KEGG Disease: RPL13A |
| MedGen: RPL13A (Human Medical Genetics with Condition) | |
| ClinVar: RPL13A | |
| Phenotype | MGI: RPL13A (International Mouse Phenotyping Consortium) |
| PhenomicDB: RPL13A | |
| Mutations for RPL13A |
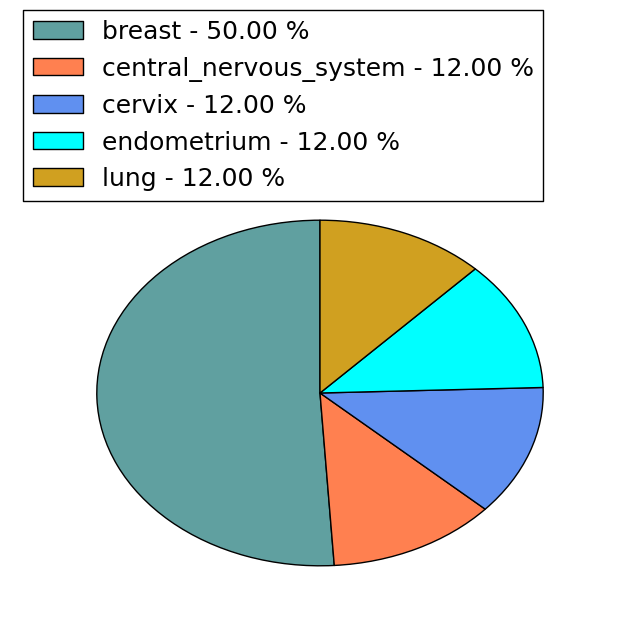
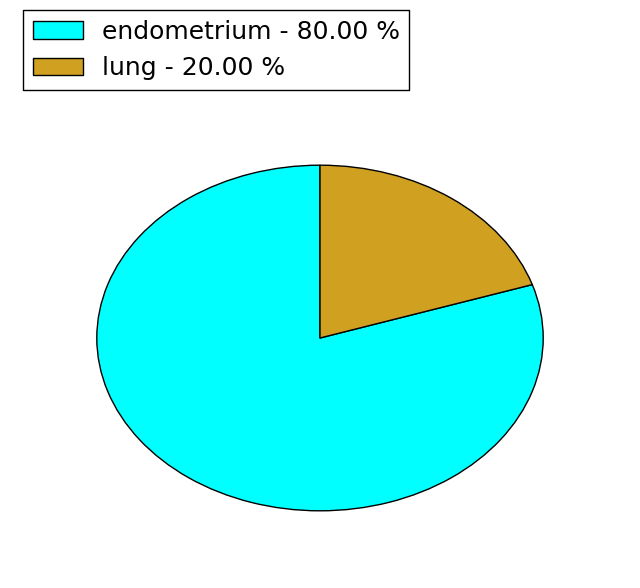
| * Under tables are showing count per each tissue to give us broad intuition about tissue specific mutation patterns.You can go to the detailed page for each mutation database's web site. |
| There's no structural variation information in COSMIC data for this gene. |
| * From mRNA Sanger sequences, Chitars2.0 arranged chimeric transcripts. This table shows RPL13A related fusion information. |
| ID | Head Gene | Tail Gene | Accession | Gene_a | qStart_a | qEnd_a | Chromosome_a | tStart_a | tEnd_a | Gene_a | qStart_a | qEnd_a | Chromosome_a | tStart_a | tEnd_a |
| EC557264 | RPL13A | 1 | 68 | 19 | 49993738 | 49993805 | GTF2IP1 | 62 | 128 | 7 | 74601404 | 74601470 | |
| BP333446 | RPL13A | 1 | 251 | 19 | 49995135 | 49995386 | KAZN | 243 | 262 | 1 | 15306034 | 15306053 | |
| BG255829 | BHLHE40 | 1 | 348 | 3 | 5024668 | 5025014 | RPL13A | 343 | 638 | 19 | 49993758 | 49994768 | |
| AX747058 | ANKRD52 | 1 | 2297 | 12 | 56636333 | 56645863 | RPL13A | 2294 | 2707 | 19 | 49993801 | 49995097 | |
| BM677070 | RPL13A | 12 | 150 | 19 | 49995427 | 49995565 | ACTG1 | 144 | 683 | 17 | 79478723 | 79479353 | |
| BM723492 | RPL13A | 1 | 101 | 19 | 49993117 | 49993526 | ARL6IP5 | 101 | 243 | 3 | 69153989 | 69154131 | |
| X06537 | RPL13A | 1 | 163 | 19 | 49995147 | 49995310 | LCAT | 151 | 1447 | 16 | 67973786 | 67977957 | |
| BU683473 | RPL13A | 16 | 69 | 19 | 49995512 | 49995565 | FZD7 | 63 | 684 | 2 | 202902537 | 202903164 | |
| BM838228 | RPL13A | 1 | 94 | 19 | 49487554 | 49492308 | ACTG1 | 94 | 601 | 17 | 81509971 | 81512890 | |
| Top |
| There's no copy number variation information in COSMIC data for this gene. |
| Top |
|
 |
| Top |
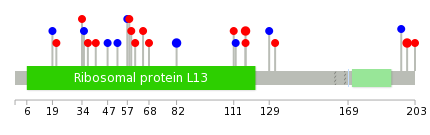
| Stat. for Non-Synonymous SNVs (# total SNVs=8) | (# total SNVs=5) |
 |  |
(# total SNVs=0) | (# total SNVs=0) |
| Top |
| * When you move the cursor on each content, you can see more deailed mutation information on the Tooltip. Those are primary_site,primary_histology,mutation(aa),pubmedID. |
| GRCh37 position | Mutation(aa) | Unique sampleID count |
| chr19:49993823-49993823 | p.R82R | 2 |
| chr19:49994304-49994304 | p.R117Q | 2 |
| chr19:49995055-49995055 | p.H199Y | 2 |
| chr19:49993501-49993501 | p.V34A | 1 |
| chr19:49993780-49993780 | p.R68Q | 1 |
| chr19:49995067-49995067 | p.V203L | 1 |
| chr19:49993505-49993505 | p.V35V | 1 |
| chr19:49993509-49993509 | p.R37G | 1 |
| chr19:49994111-49994111 | p.P111L | 1 |
| chr19:49993523-49993523 | p.I41M | 1 |
| Top |
|
 |
| Point Mutation/ Tissue ID | 1 | 2 | 3 | 4 | 5 | 6 | 7 | 8 | 9 | 10 | 11 | 12 | 13 | 14 | 15 | 16 | 17 | 18 | 19 | 20 |
| # sample | 3 | 2 | 1 | 1 | 2 | 4 | 2 | 4 | ||||||||||||
| # mutation | 3 | 2 | 1 | 1 | 2 | 4 | 2 | 5 | ||||||||||||
| nonsynonymous SNV | 3 | 2 | 1 | 1 | 1 | 2 | 2 | 1 | ||||||||||||
| synonymous SNV | 1 | 2 | 4 |
| cf) Tissue ID; Tissue type (1; BLCA[Bladder Urothelial Carcinoma], 2; BRCA[Breast invasive carcinoma], 3; CESC[Cervical squamous cell carcinoma and endocervical adenocarcinoma], 4; COAD[Colon adenocarcinoma], 5; GBM[Glioblastoma multiforme], 6; Glioma Low Grade, 7; HNSC[Head and Neck squamous cell carcinoma], 8; KICH[Kidney Chromophobe], 9; KIRC[Kidney renal clear cell carcinoma], 10; KIRP[Kidney renal papillary cell carcinoma], 11; LAML[Acute Myeloid Leukemia], 12; LUAD[Lung adenocarcinoma], 13; LUSC[Lung squamous cell carcinoma], 14; OV[Ovarian serous cystadenocarcinoma ], 15; PAAD[Pancreatic adenocarcinoma], 16; PRAD[Prostate adenocarcinoma], 17; SKCM[Skin Cutaneous Melanoma], 18:STAD[Stomach adenocarcinoma], 19:THCA[Thyroid carcinoma], 20:UCEC[Uterine Corpus Endometrial Carcinoma]) |
| Top |
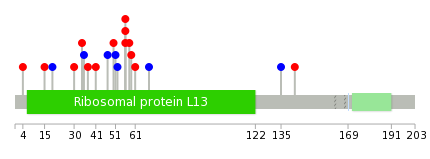
| * We represented just top 10 SNVs. When you move the cursor on each content, you can see more deailed mutation information on the Tooltip. Those are primary_site, primary_histology, mutation(aa), pubmedID. |
| Genomic Position | Mutation(aa) | Unique sampleID count |
| chr19:49993501 | p.N4K,RPL13A | 1 |
| chr19:49993803 | p.P15S,RPL13A | 1 |
| chr19:49993505 | p.P50L,RPL13A | 1 |
| chr19:49994111 | p.Y51Y,RPL13A | 1 |
| chr19:49993509 | p.L19L | 1 |
| chr19:49994115 | p.R56W,RPL13A | 1 |
| chr19:49993523 | p.G30S | 1 |
| chr19:49994303 | p.R56Q,RPL13A | 1 |
| chr19:49993541 | p.V34A | 1 |
| chr19:49994304 | p.L68L,RPL13A | 1 |
| * Copy number data were extracted from TCGA using R package TCGA-Assembler. The URLs of all public data files on TCGA DCC data server were gathered on Jan-05-2015. Function ProcessCNAData in TCGA-Assembler package was used to obtain gene-level copy number value which is calculated as the average copy number of the genomic region of a gene. |
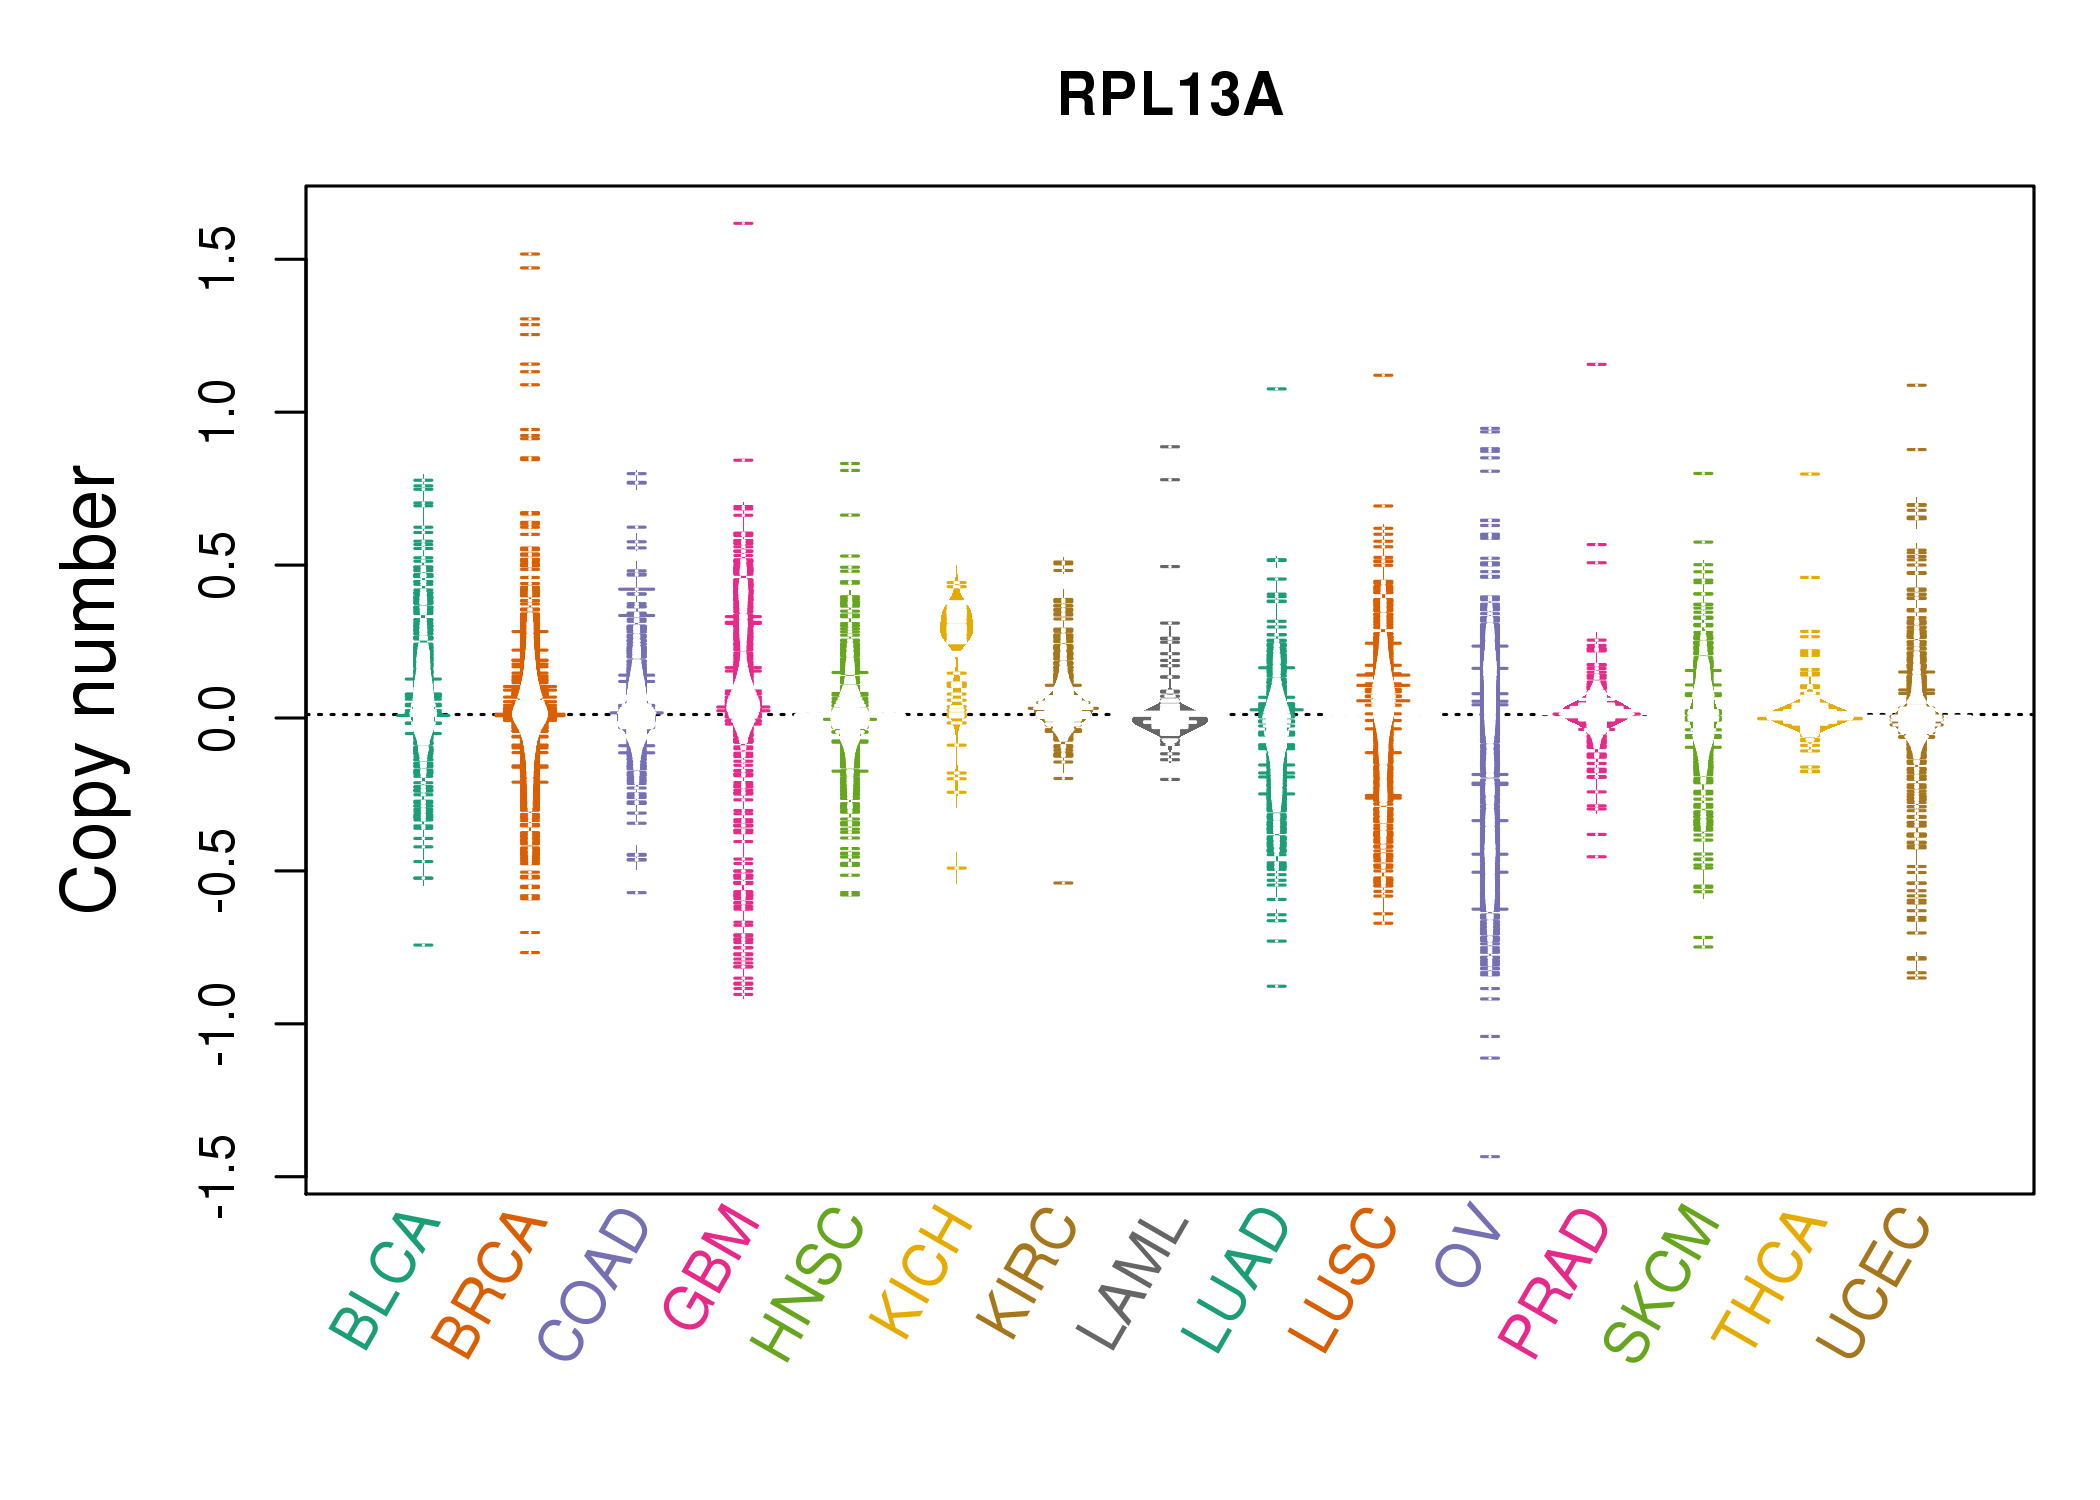 |
| cf) Tissue ID[Tissue type]: BLCA[Bladder Urothelial Carcinoma], BRCA[Breast invasive carcinoma], CESC[Cervical squamous cell carcinoma and endocervical adenocarcinoma], COAD[Colon adenocarcinoma], GBM[Glioblastoma multiforme], Glioma Low Grade, HNSC[Head and Neck squamous cell carcinoma], KICH[Kidney Chromophobe], KIRC[Kidney renal clear cell carcinoma], KIRP[Kidney renal papillary cell carcinoma], LAML[Acute Myeloid Leukemia], LUAD[Lung adenocarcinoma], LUSC[Lung squamous cell carcinoma], OV[Ovarian serous cystadenocarcinoma ], PAAD[Pancreatic adenocarcinoma], PRAD[Prostate adenocarcinoma], SKCM[Skin Cutaneous Melanoma], STAD[Stomach adenocarcinoma], THCA[Thyroid carcinoma], UCEC[Uterine Corpus Endometrial Carcinoma] |
| Top |
| Gene Expression for RPL13A |
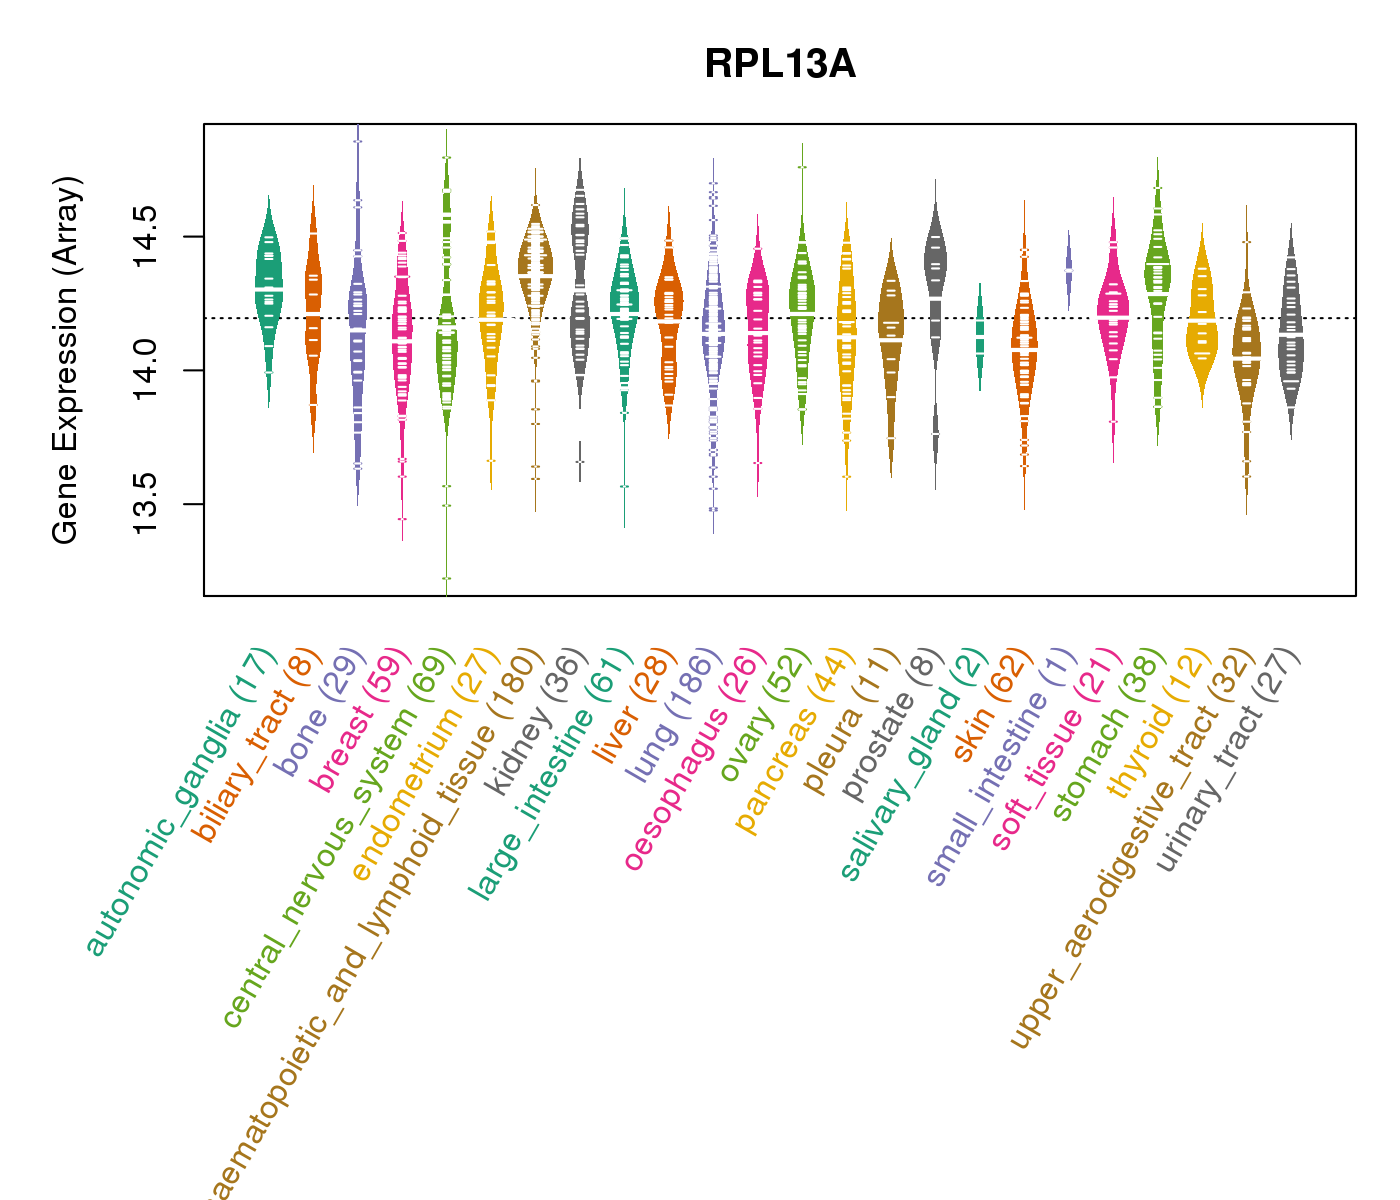
| * CCLE gene expression data were extracted from CCLE_Expression_Entrez_2012-10-18.res: Gene-centric RMA-normalized mRNA expression data. |
 |
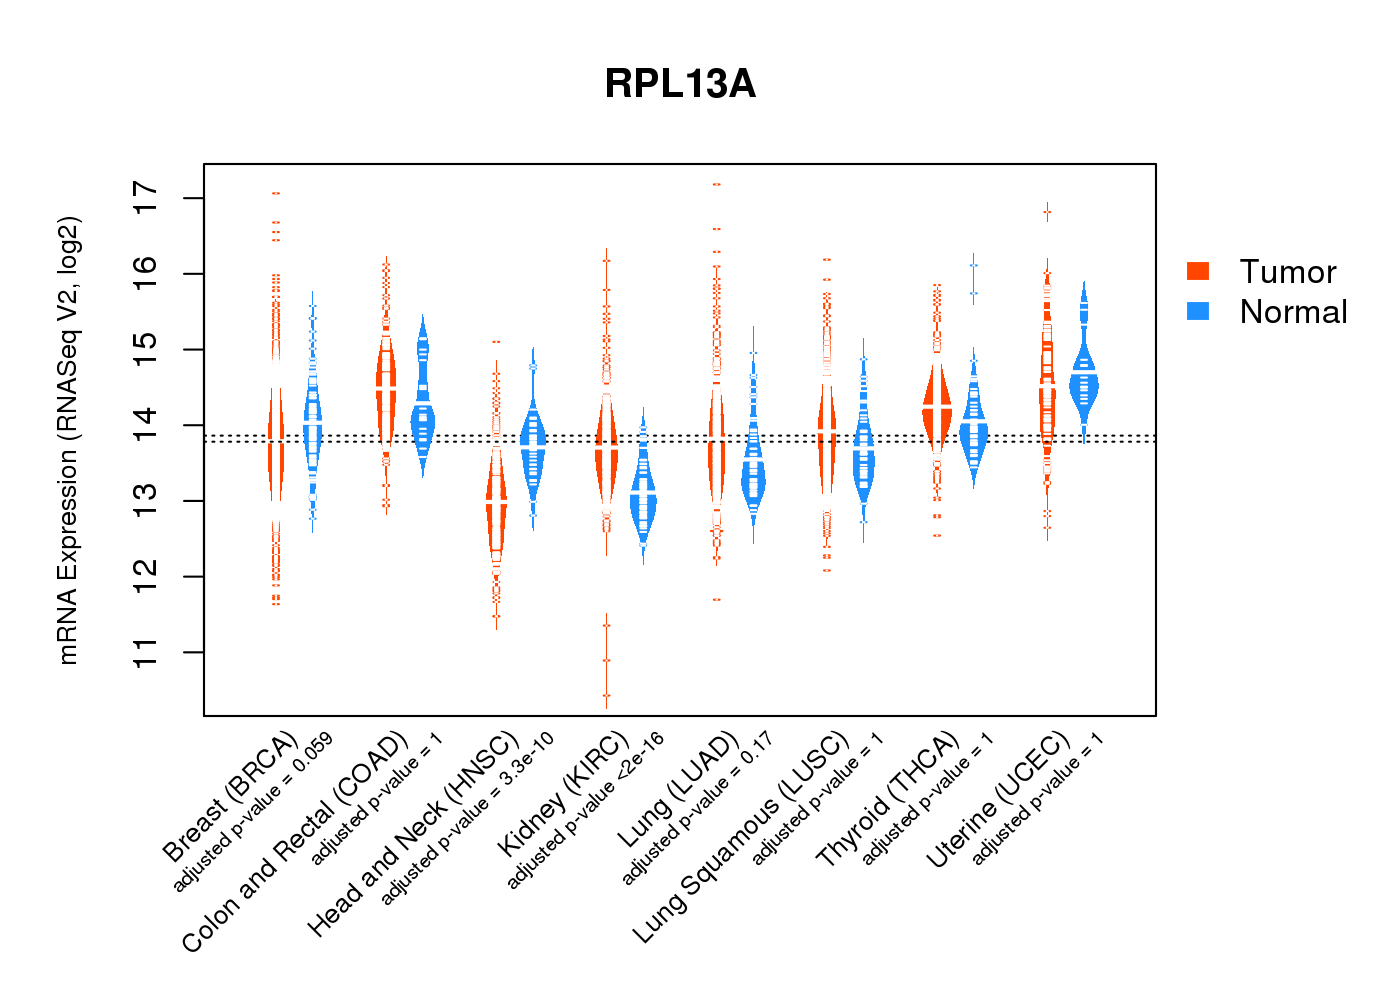
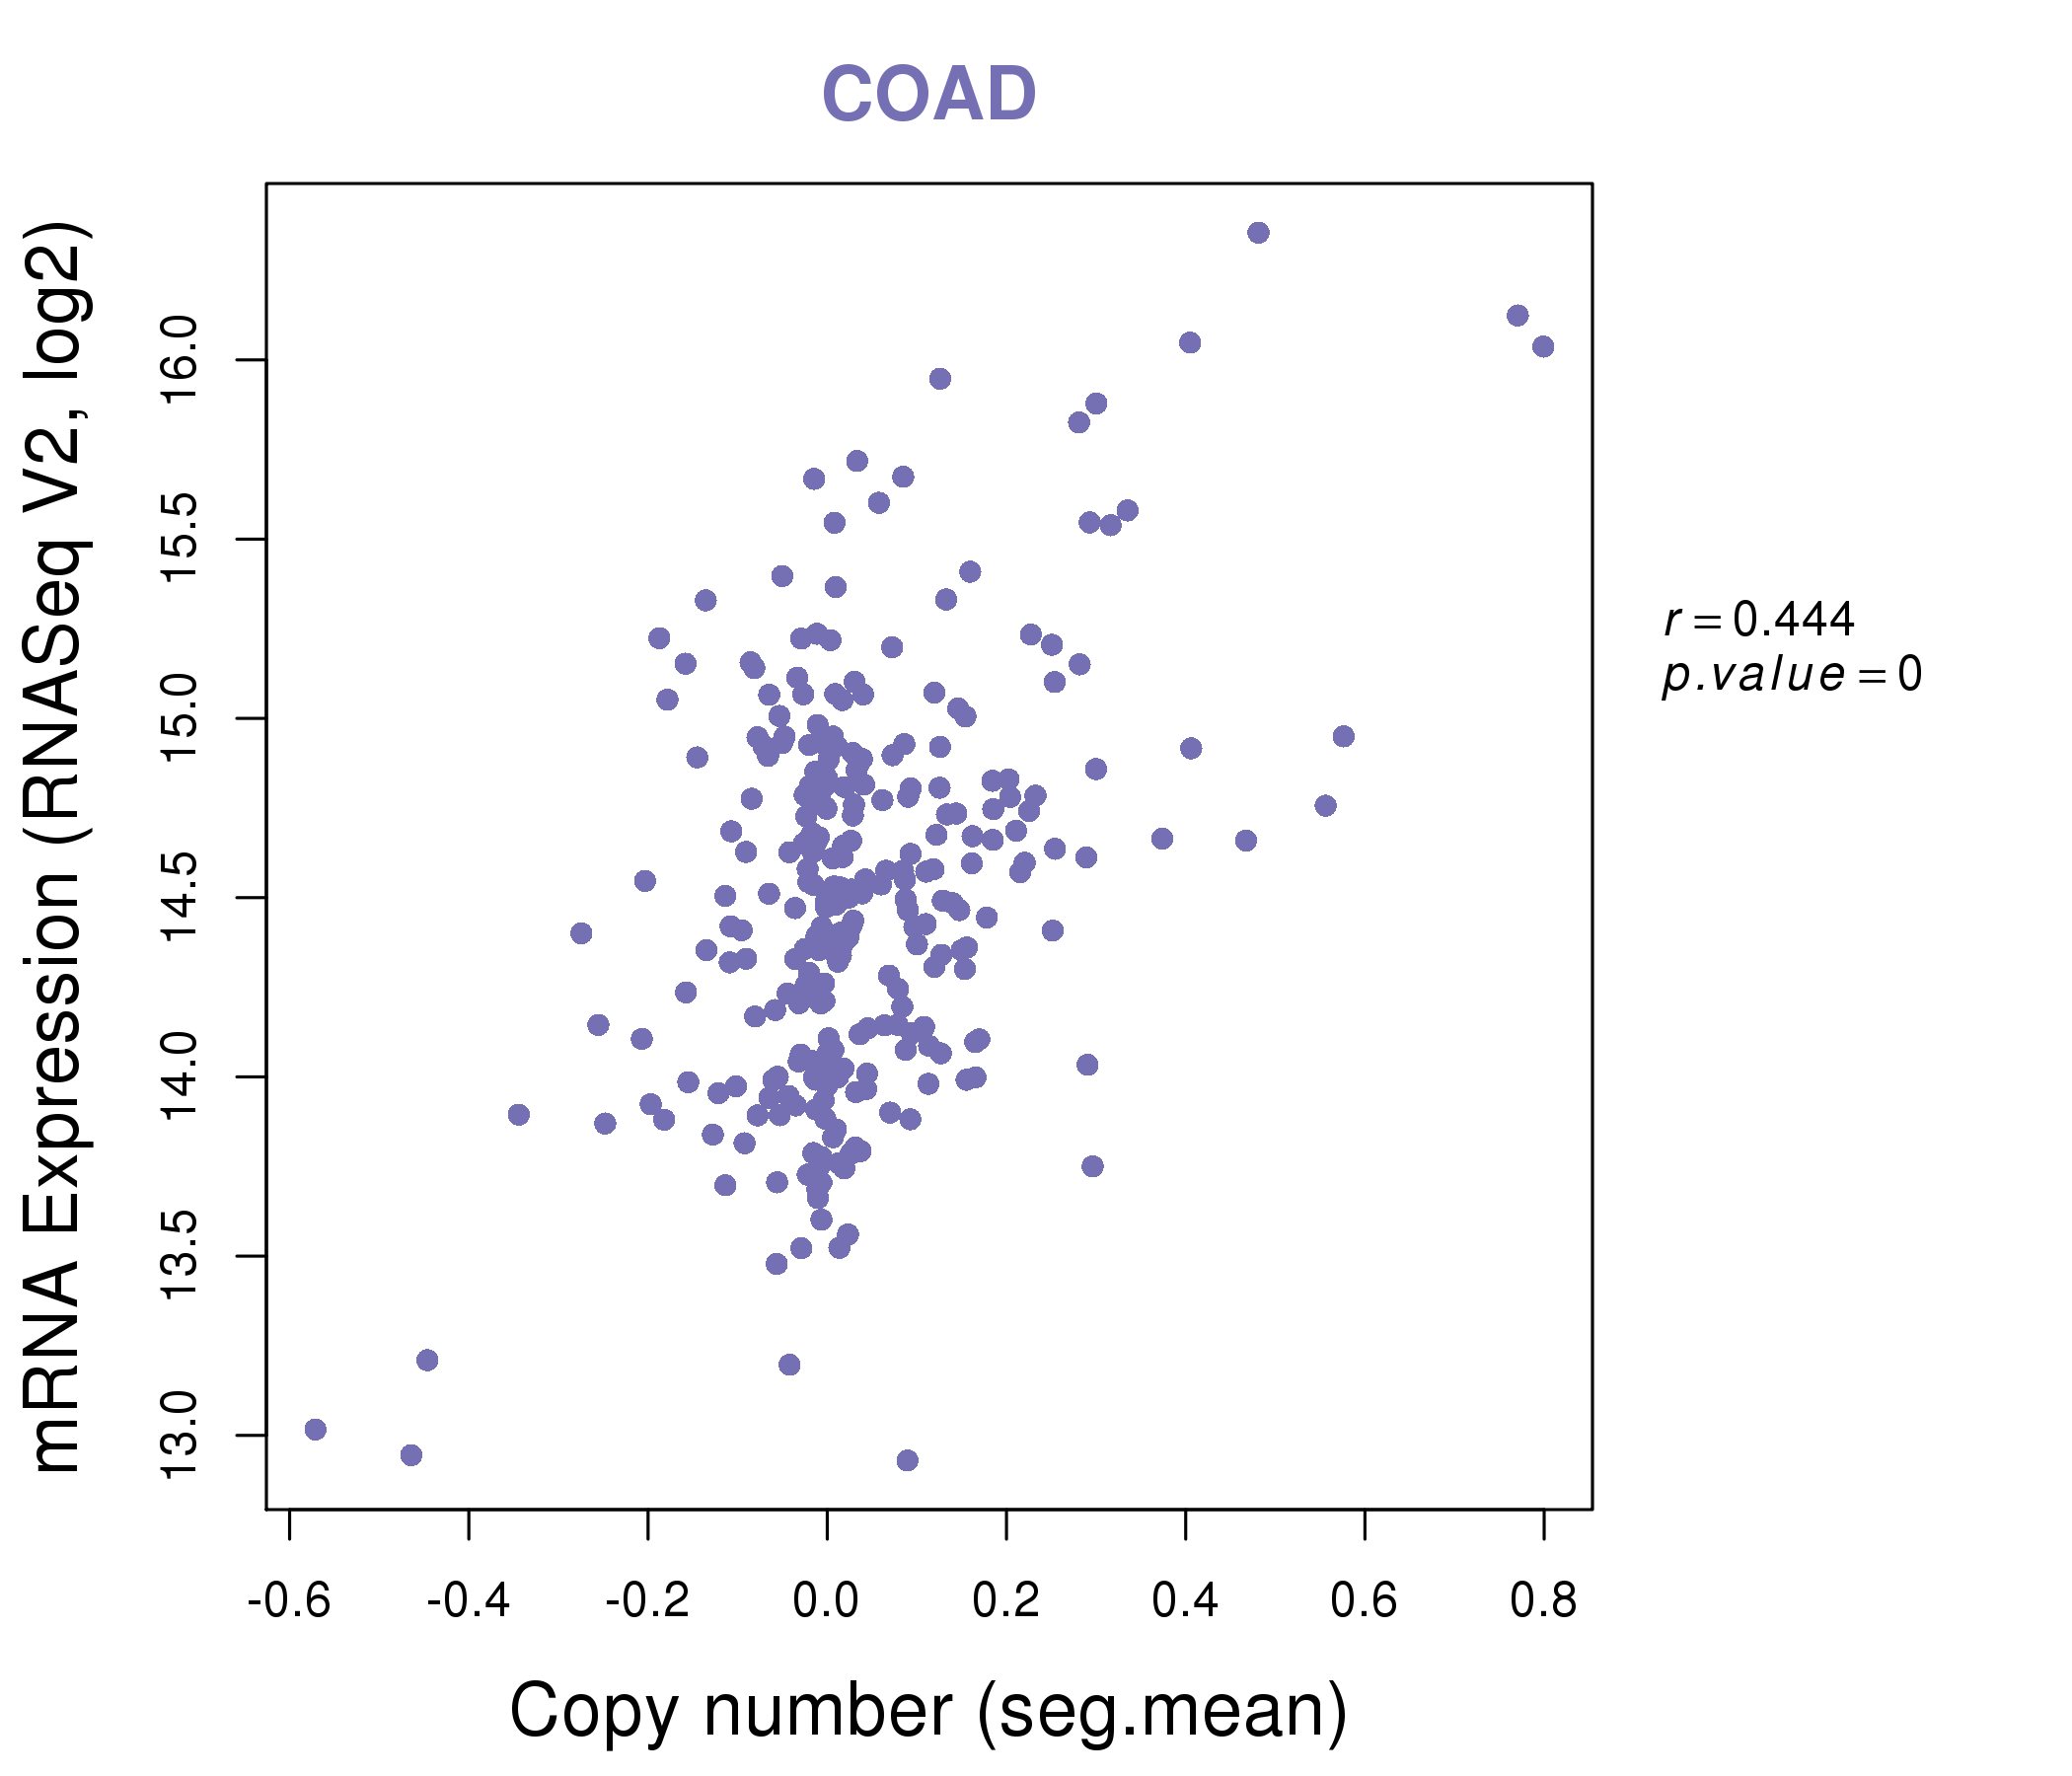
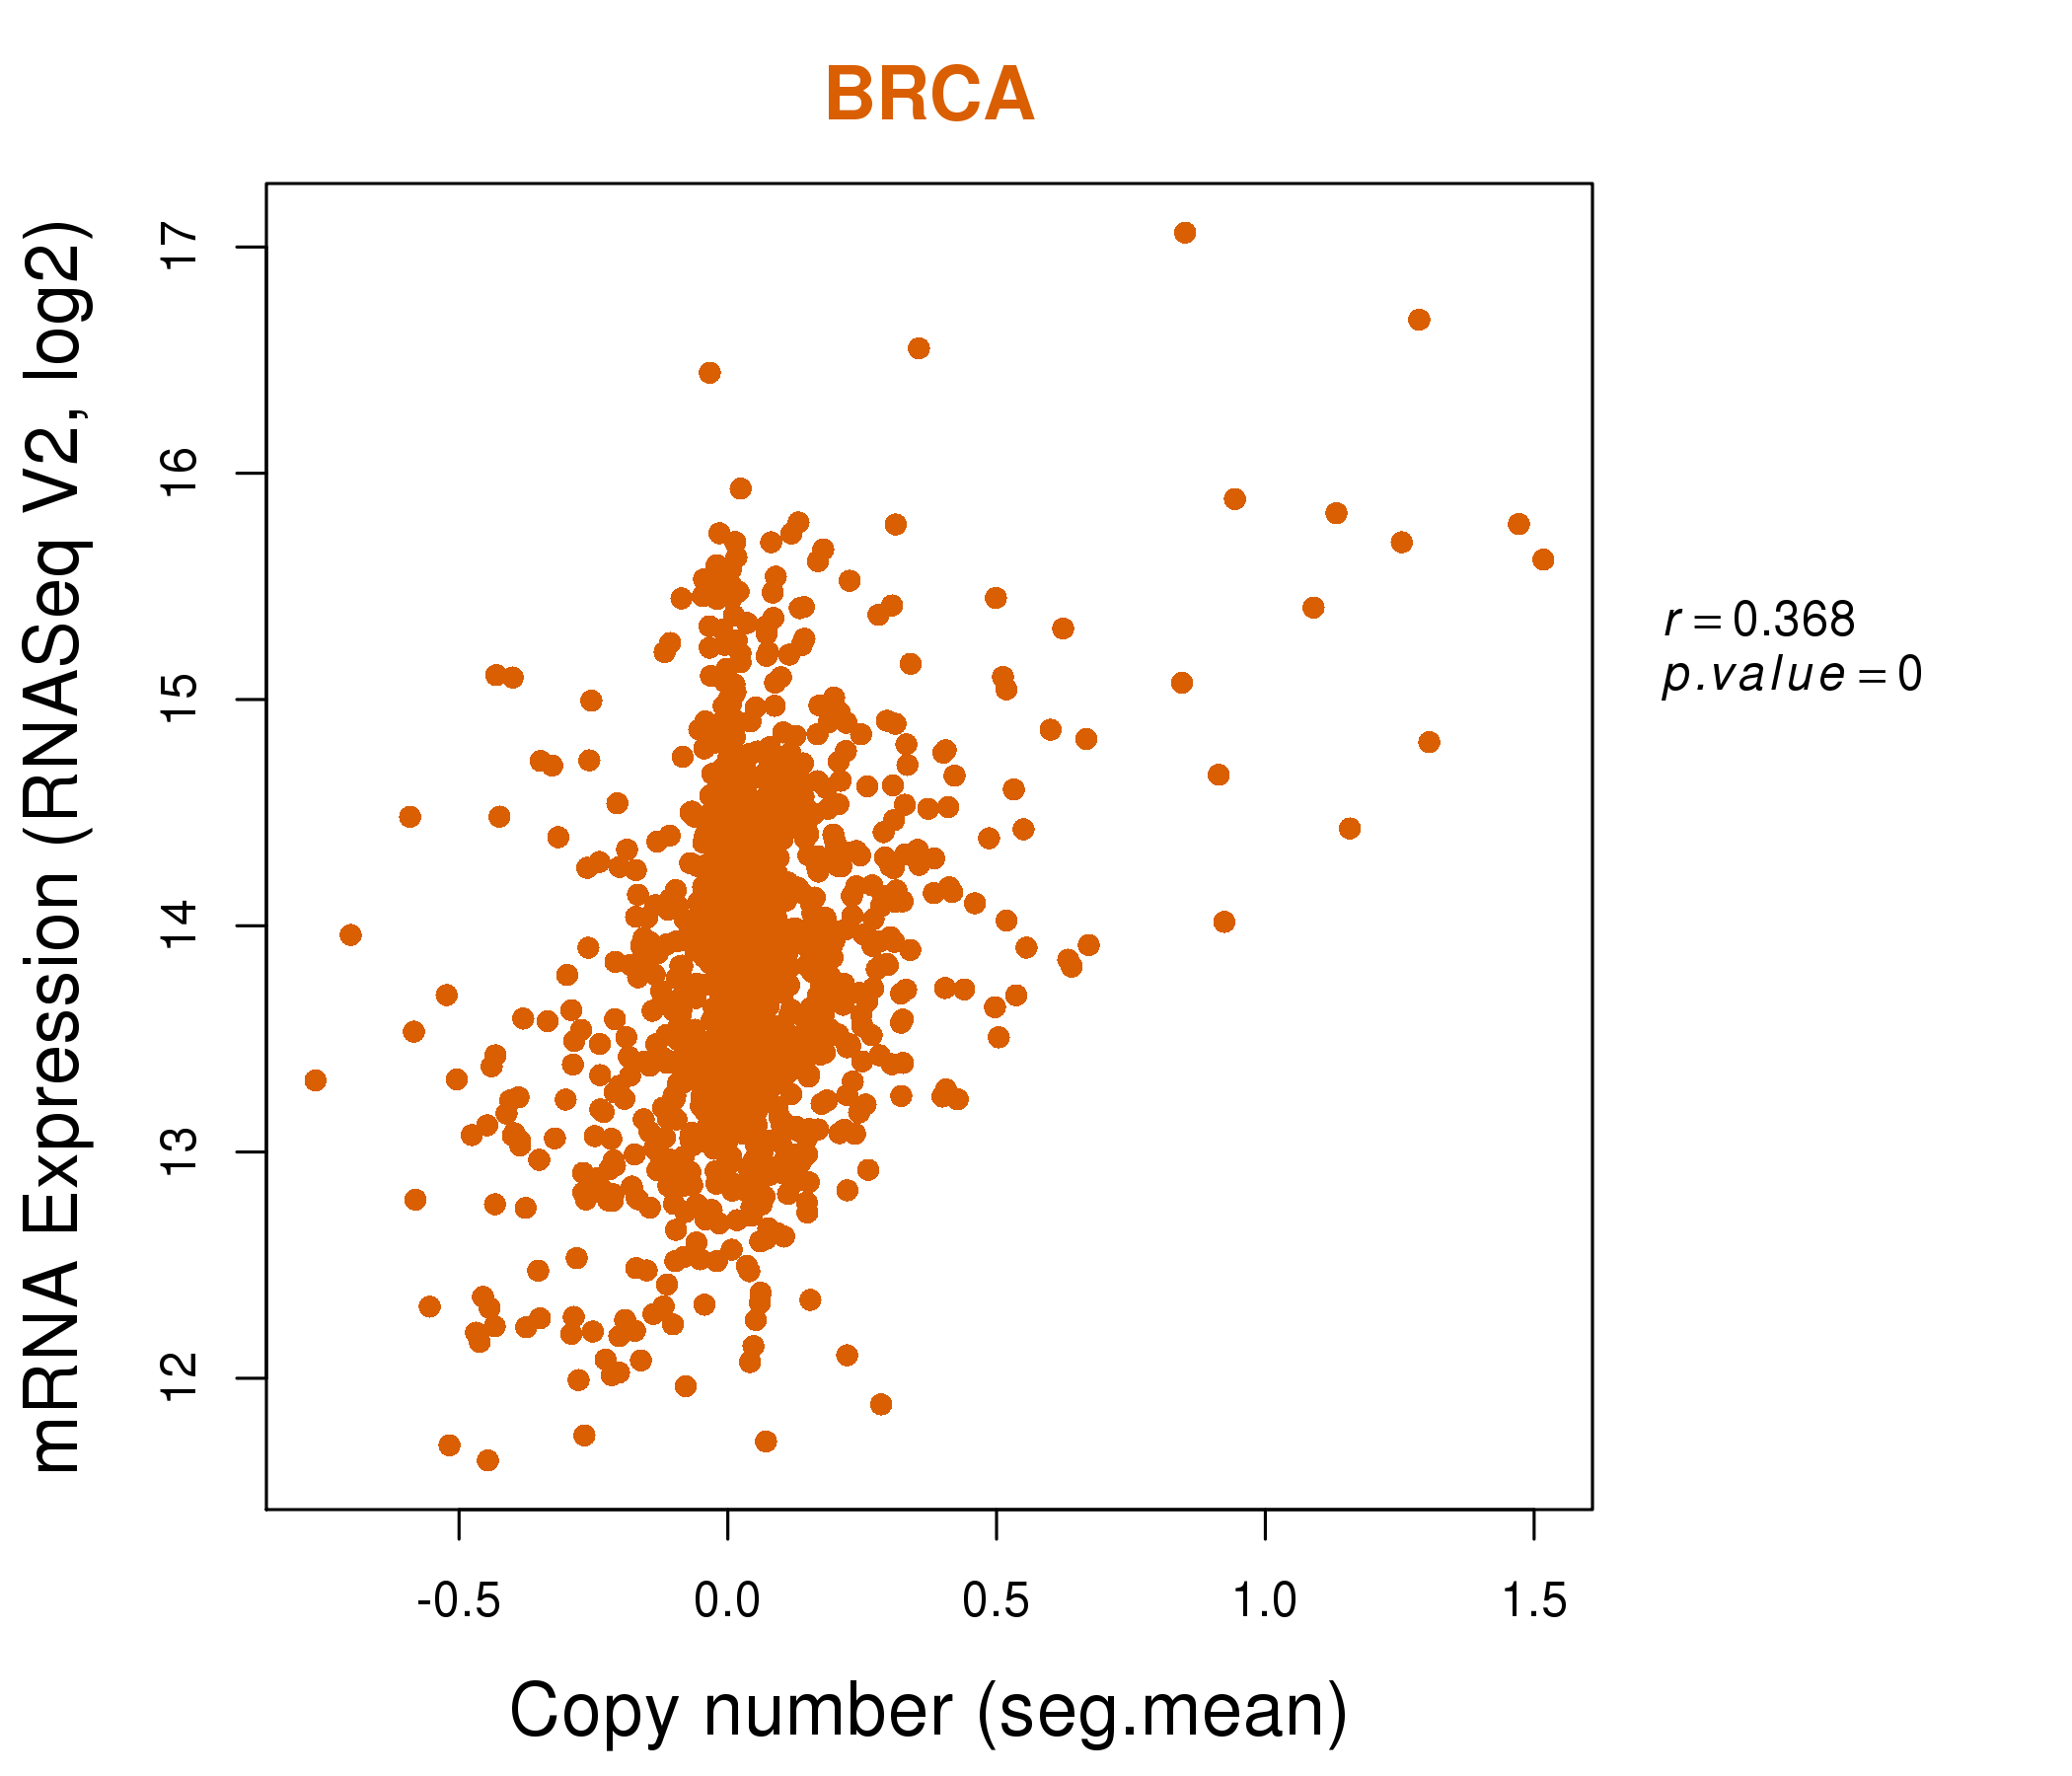
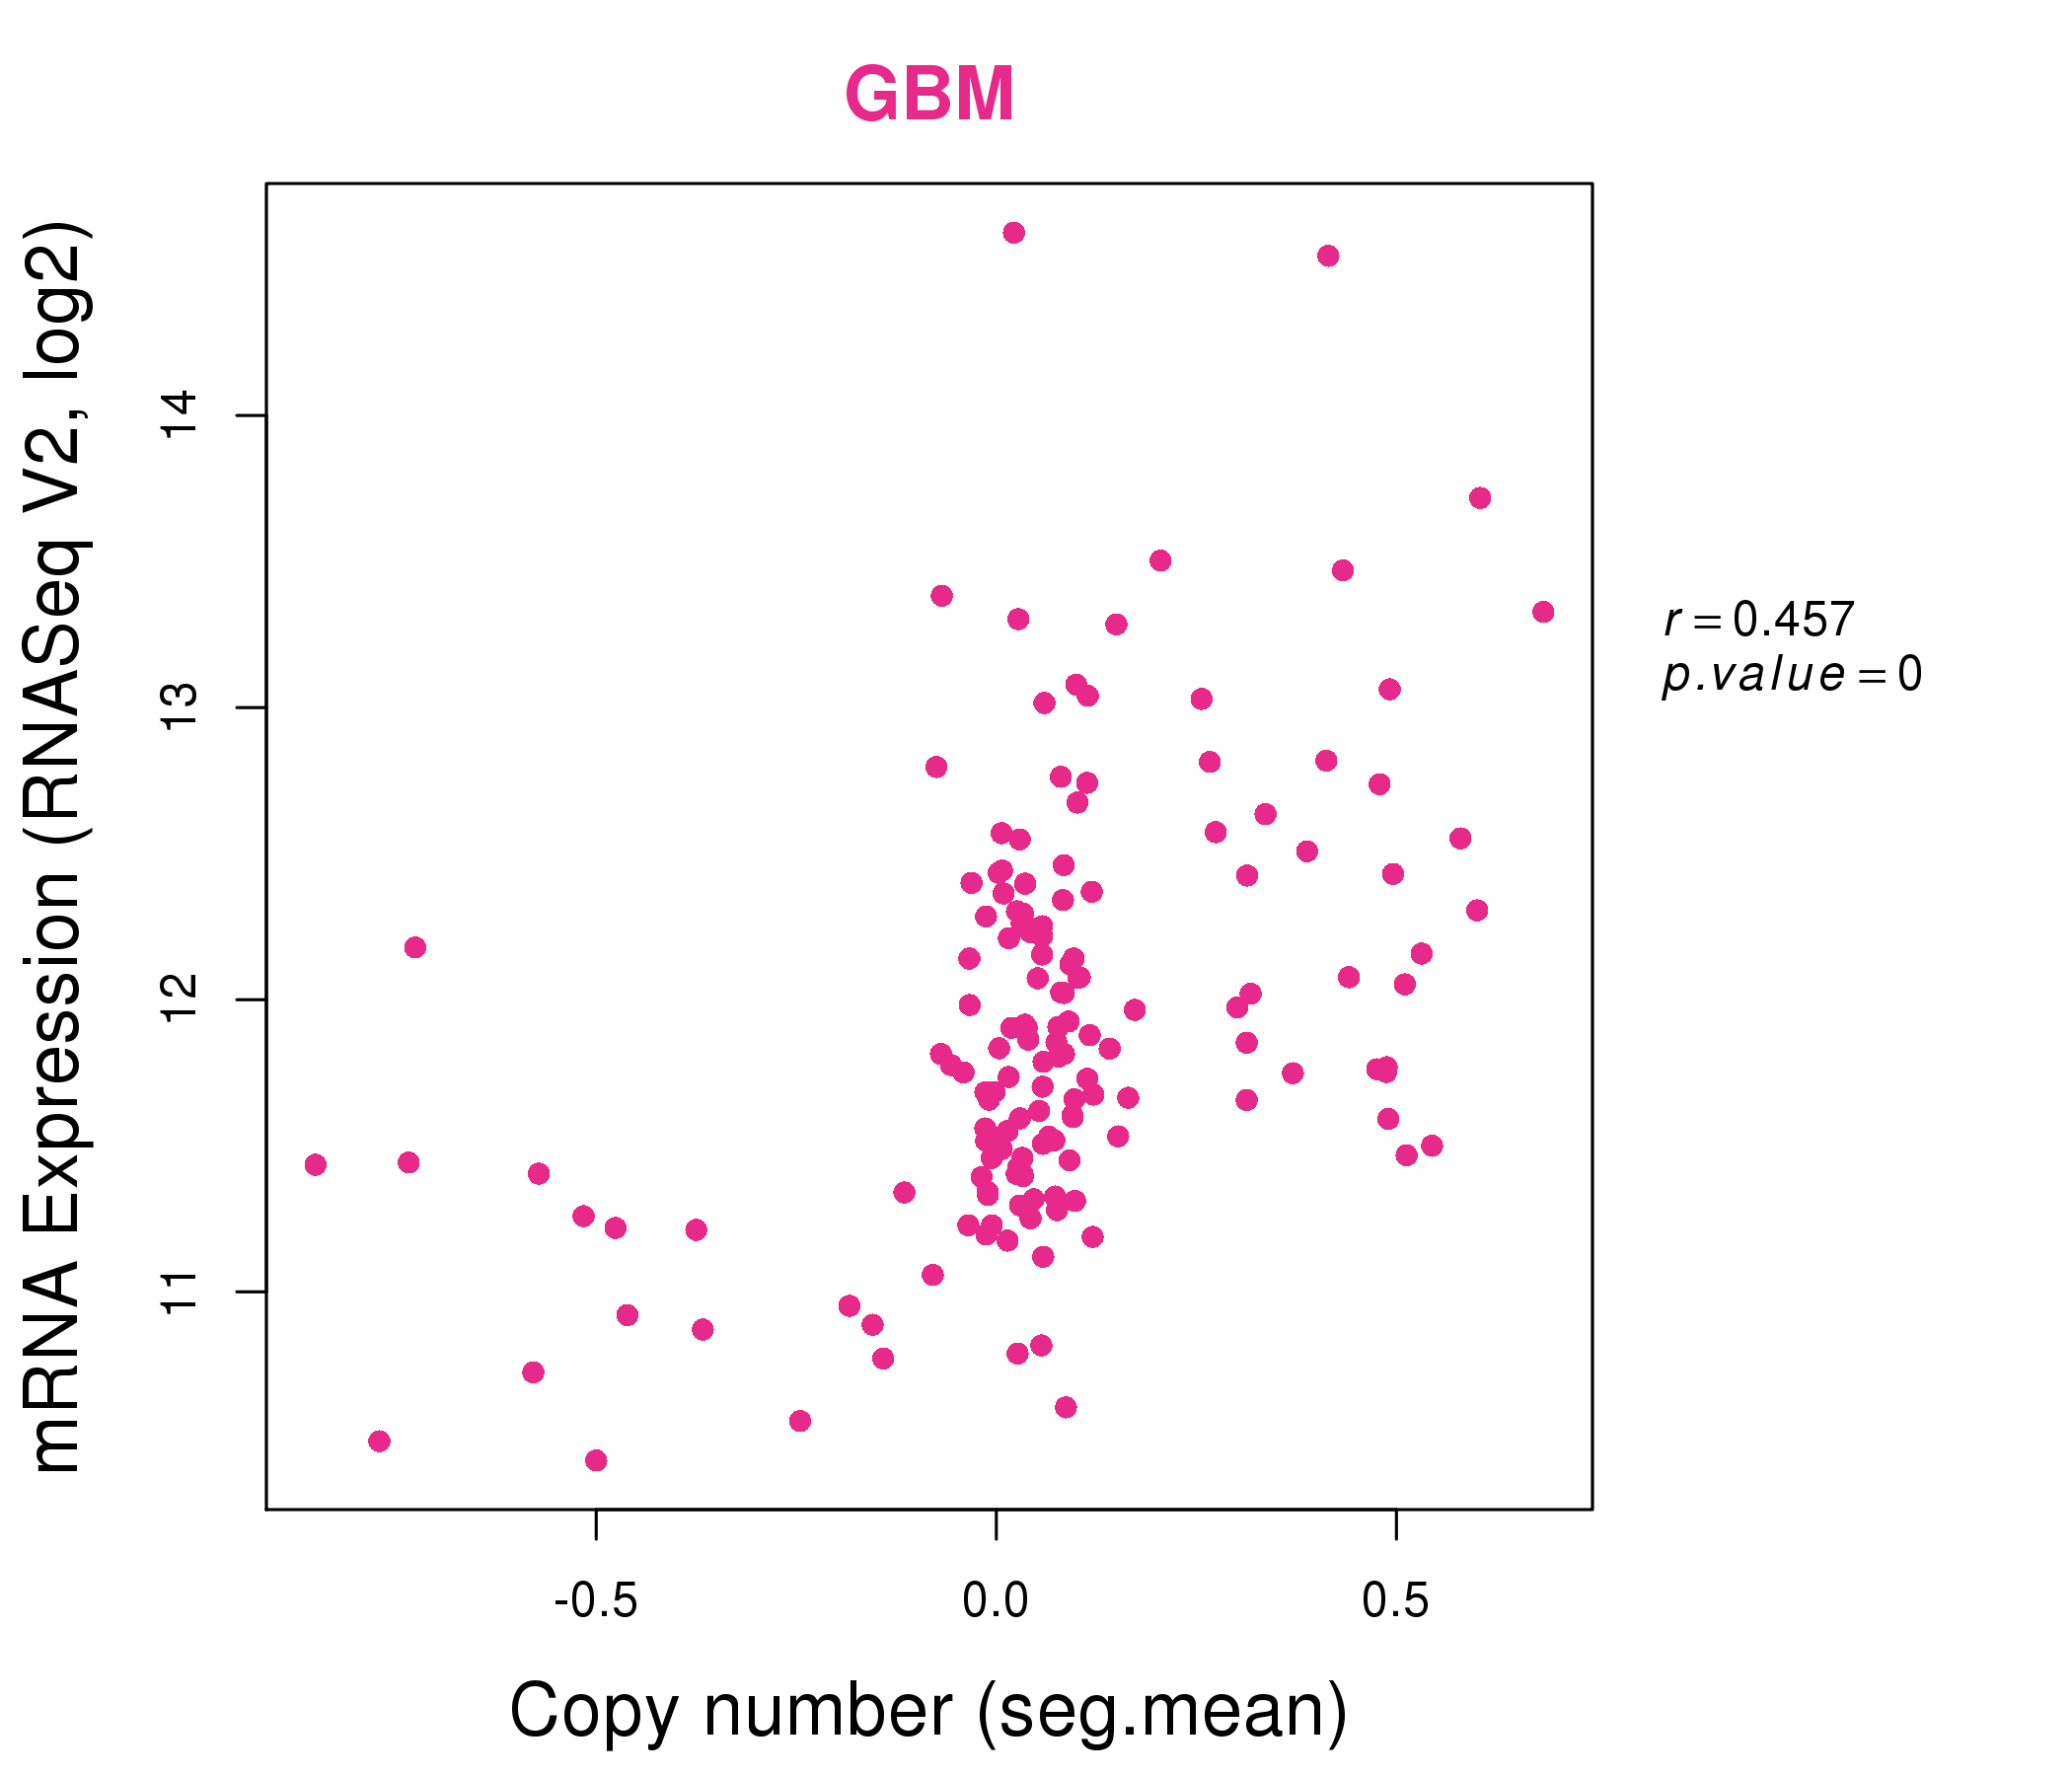
| * Normalized gene expression data of RNASeqV2 was extracted from TCGA using R package TCGA-Assembler. The URLs of all public data files on TCGA DCC data server were gathered at Jan-05-2015. Only eight cancer types have enough normal control samples for differential expression analysis. (t test, adjusted p<0.05 (using Benjamini-Hochberg FDR)) |
 |
| Top |
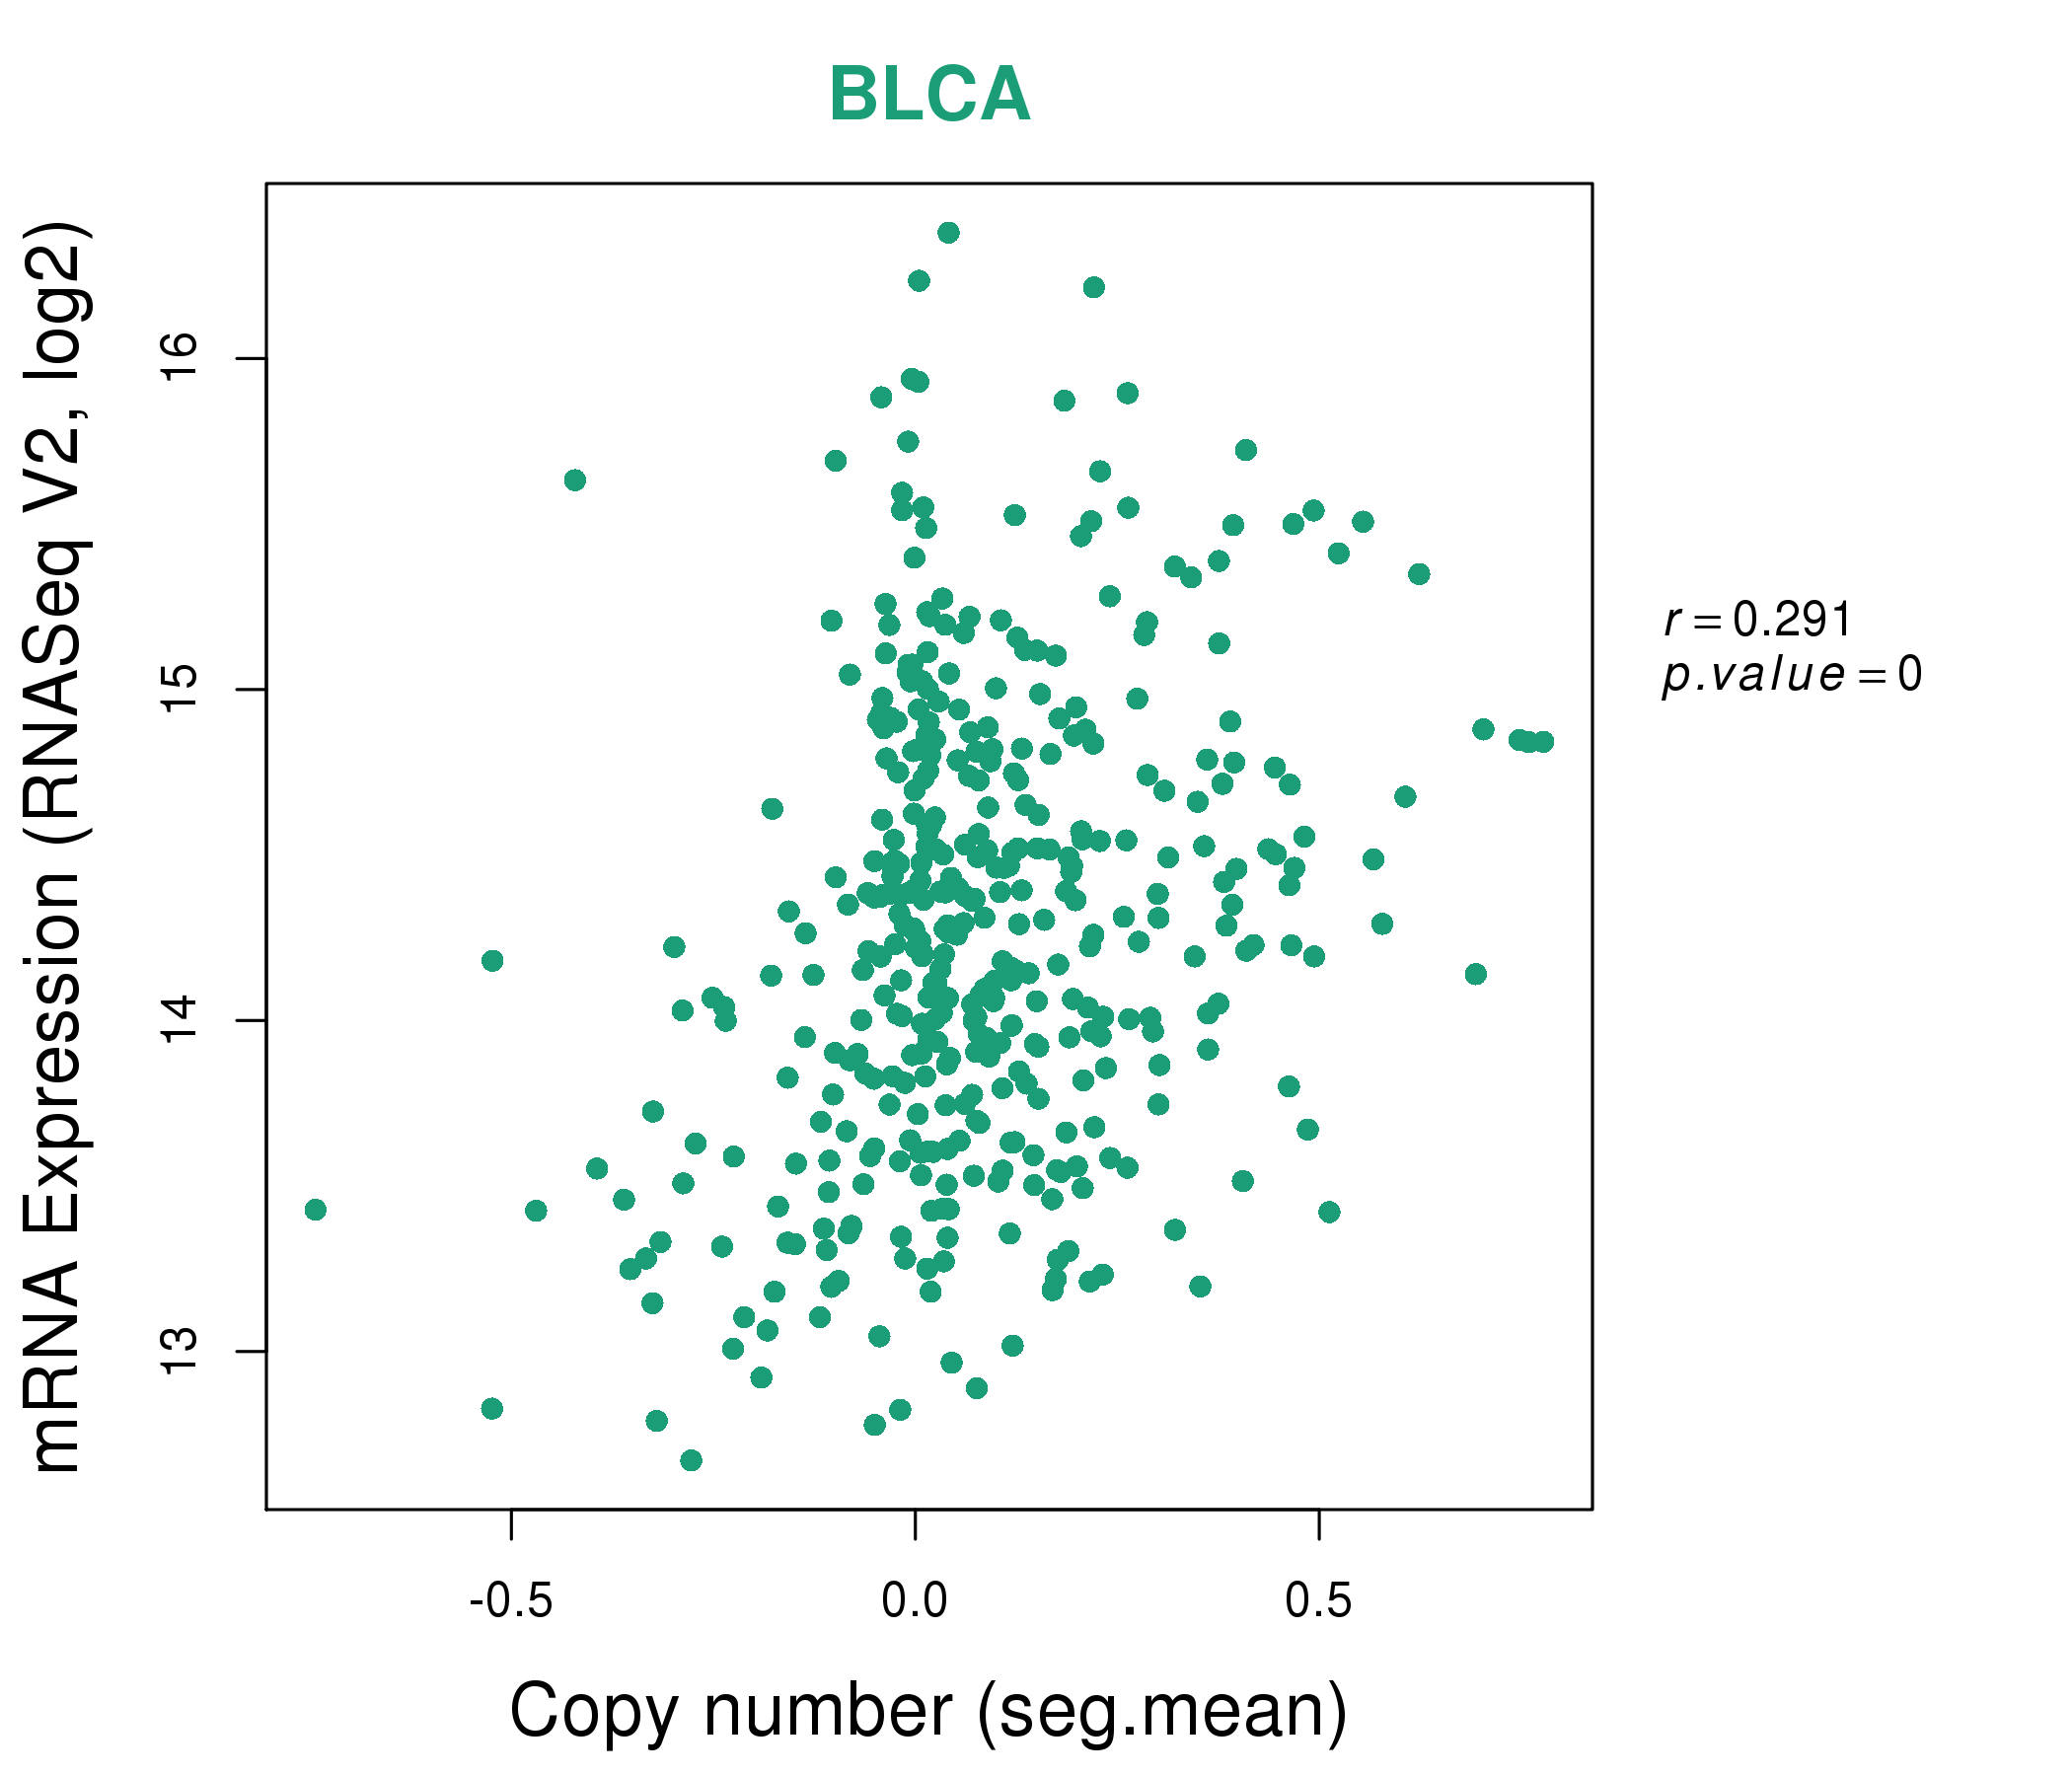
| * This plots show the correlation between CNV and gene expression. |
: Open all plots for all cancer types
 |
|
 |
|
| Top |
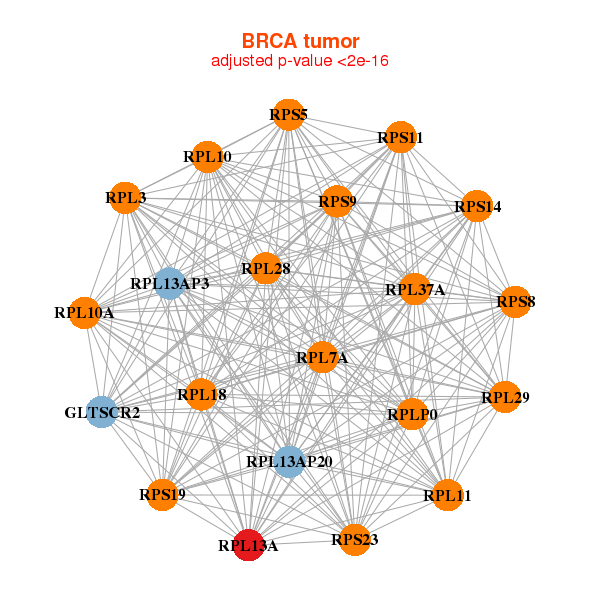
| Gene-Gene Network Information |
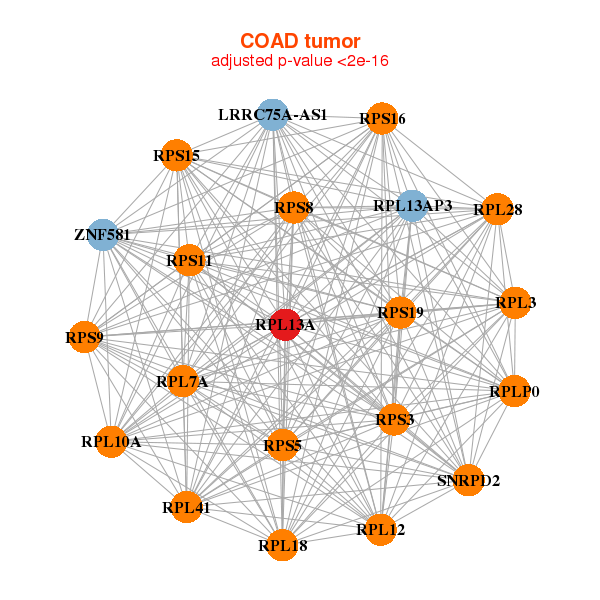
| * Co-Expression network figures were drawn using R package igraph. Only the top 20 genes with the highest correlations were shown. Red circle: input gene, orange circle: cell metabolism gene, sky circle: other gene |
: Open all plots for all cancer types
 |
| ||||
| GLTSCR2,RPL10,RPL10A,RPL11,RPL13A,RPL13AP20,RPL13AP3, RPL18,RPL28,RPL29,RPL3,RPL37A,RPL7A,RPLP0, RPS11,RPS14,RPS19,RPS23,RPS5,RPS8,RPS9 | FBL,GNB2L1,RPL10,RPL10A,RPL13,RPL13A,RPL18, RPL18A,RPL19,RPL29,RPL3,RPL36,RPL7A,RPL8, RPS14,RPS19,RPS21,RPS2,RPS3,RPS5,RPS8 | ||||
 |
| ||||
| LRRC75A-AS1,RPL10A,RPL12,RPL13A,RPL13AP3,RPL18,RPL28, RPL3,RPL41,RPL7A,RPLP0,RPS11,RPS15,RPS16, RPS19,RPS3,RPS5,RPS8,RPS9,SNRPD2,ZNF581 | ATP5G2,RPL10,RPL13A,RPL14,RPL18,RPL18A,RPL19, RPL29,RPL32,RPL3,RPL36,RPL7A,RPL8,RPLP0, RPLP1,RPS11,RPS12,RPS3,RPS5,RPS8,RPS9 |
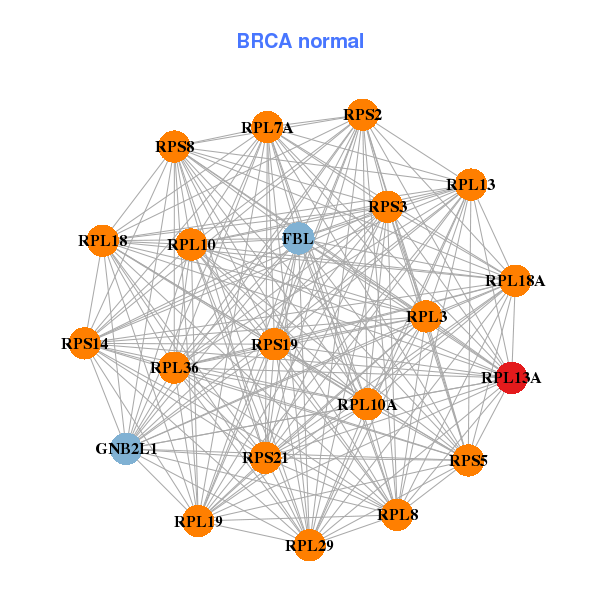
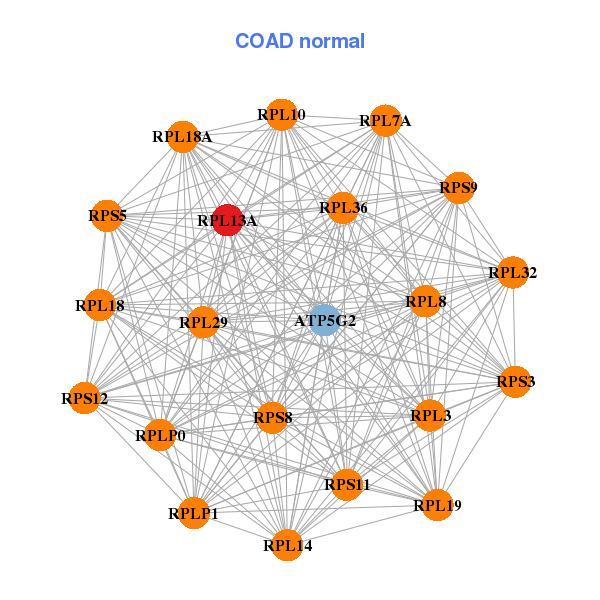
| * Co-Expression network figures were drawn using R package igraph. Only the top 20 genes with the highest correlations were shown. Red circle: input gene, orange circle: cell metabolism gene, sky circle: other gene |
: Open all plots for all cancer types
| Top |
: Open all interacting genes' information including KEGG pathway for all interacting genes from DAVID
| Top |
| Pharmacological Information for RPL13A |
| DB Category | DB Name | DB's ID and Url link |
| * Gene Centered Interaction Network. |
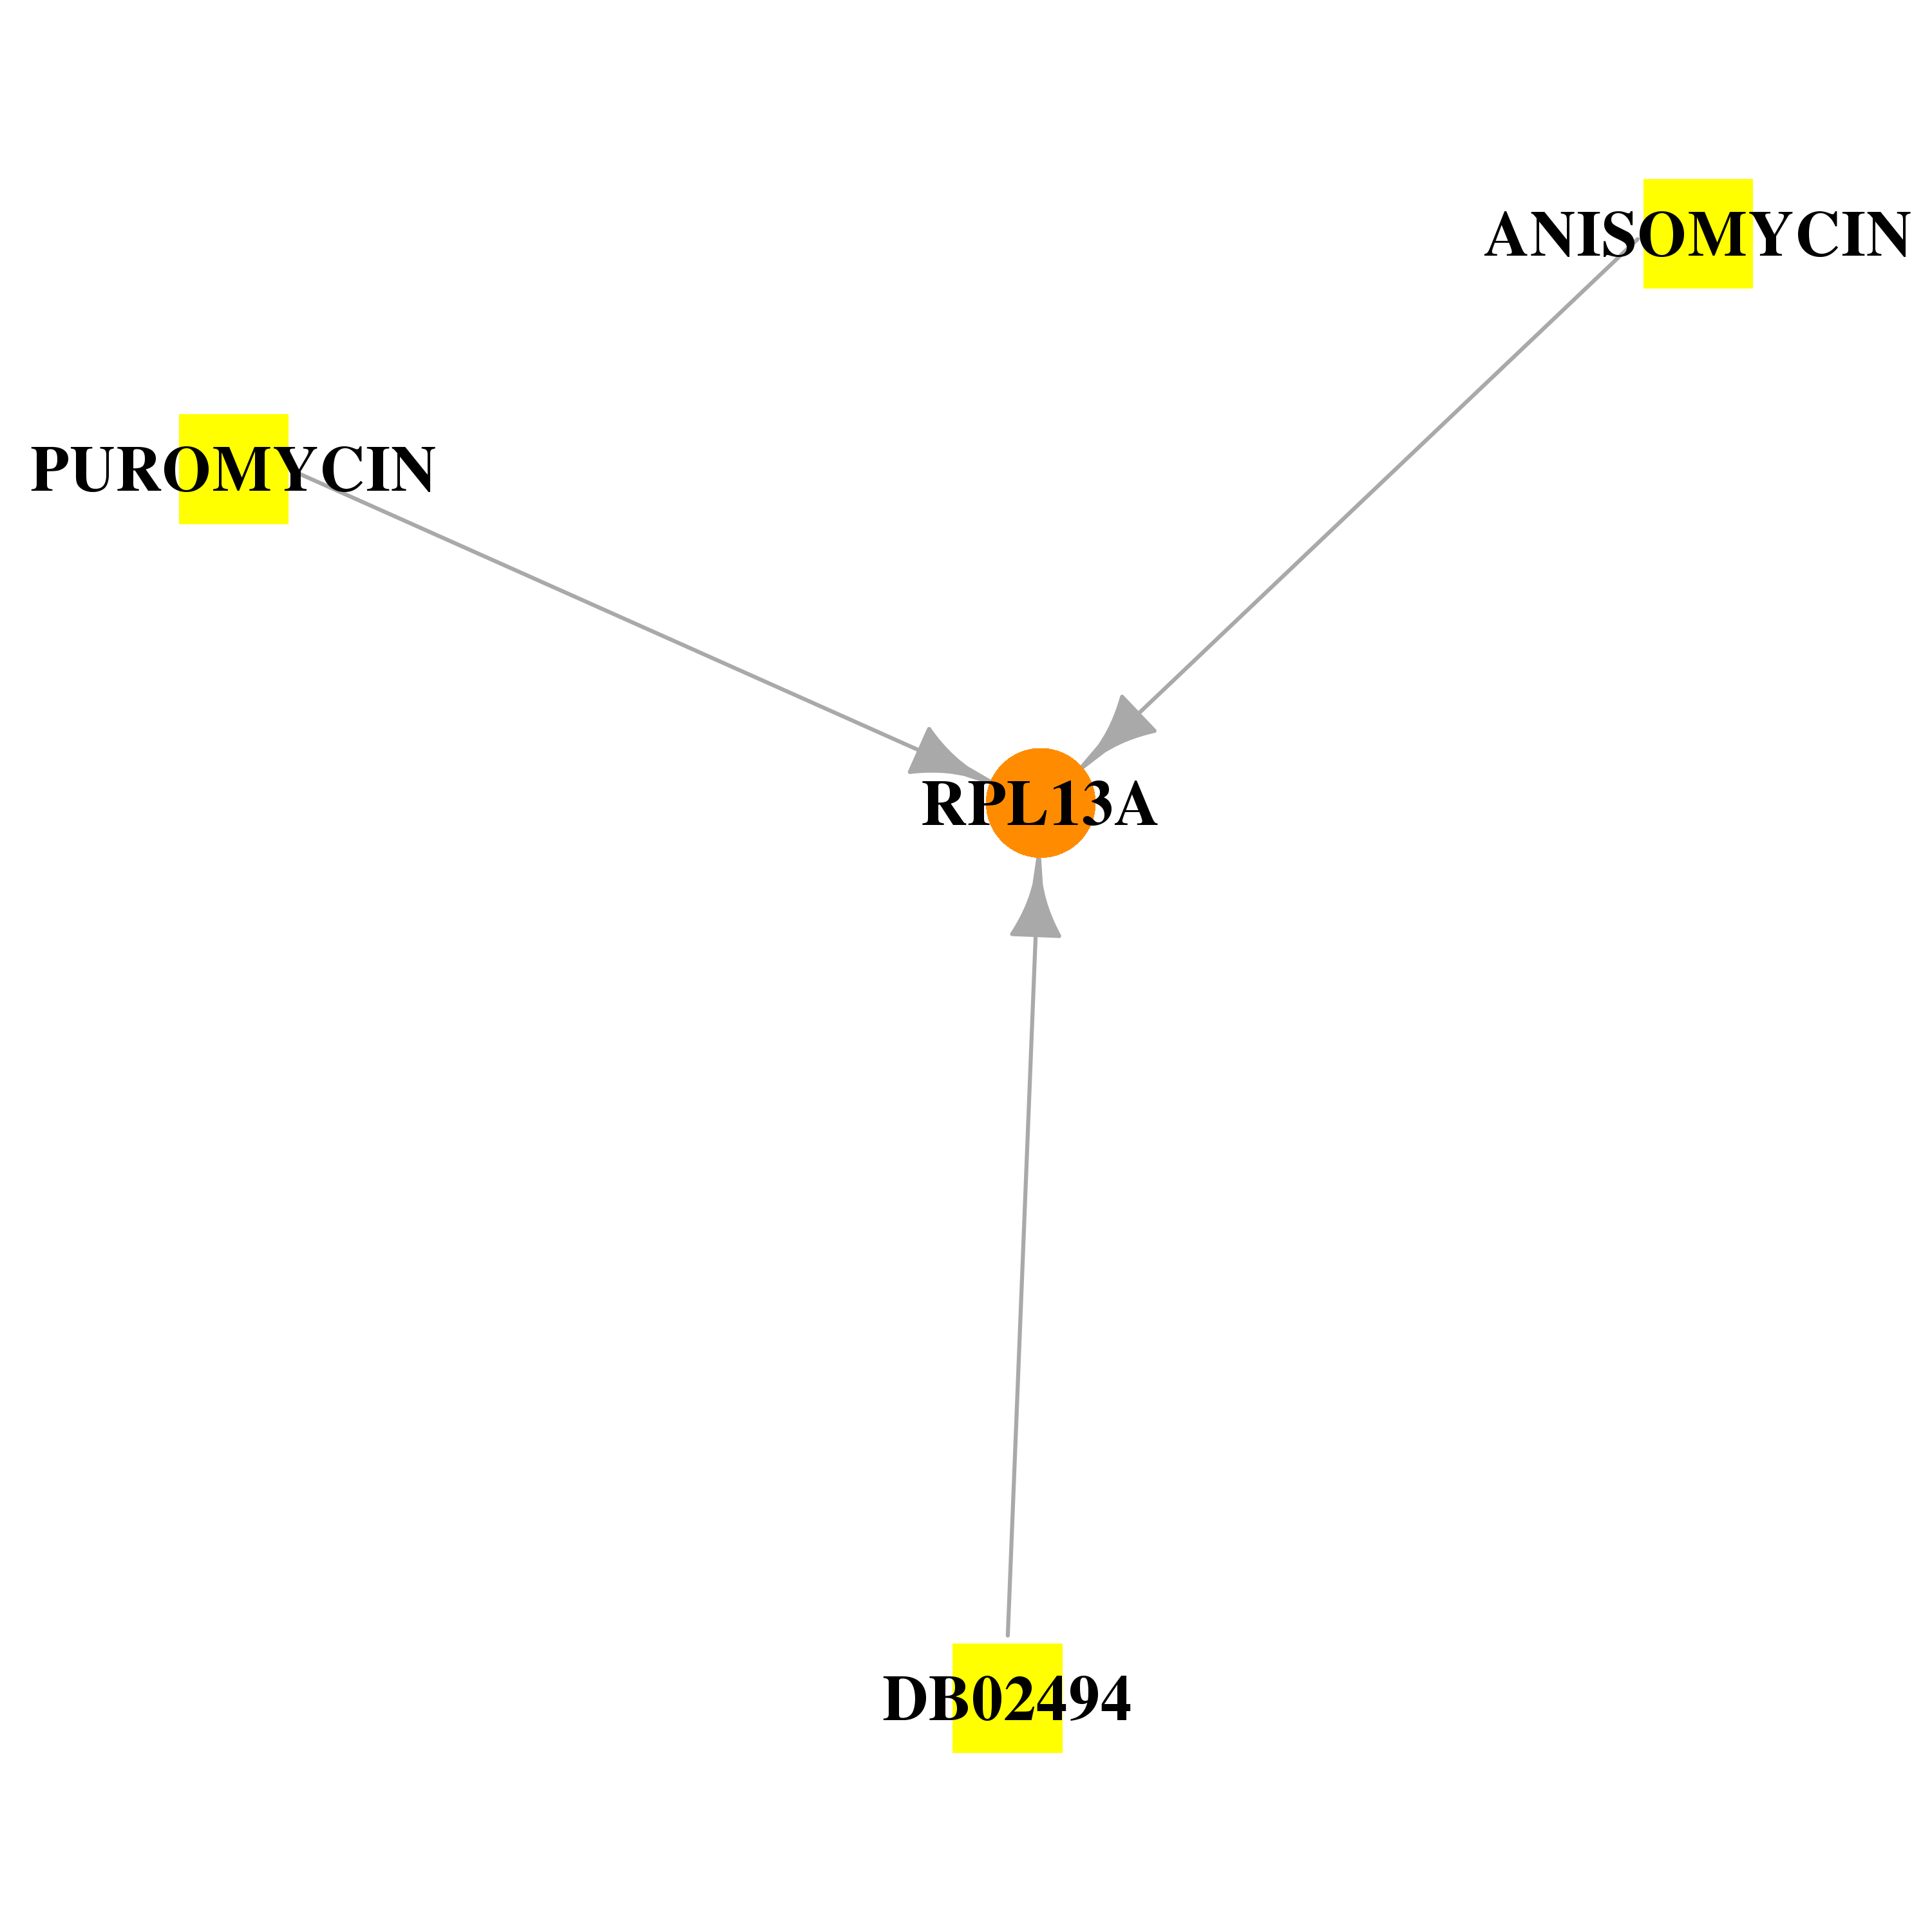 |
| * Drug Centered Interaction Network. |
| DrugBank ID | Target Name | Drug Groups | Generic Name | Drug Centered Network | Drug Structure |
| DB02494 | ribosomal protein L13a | experimental | Alpha-Hydroxy-Beta-Phenyl-Propionic Acid | 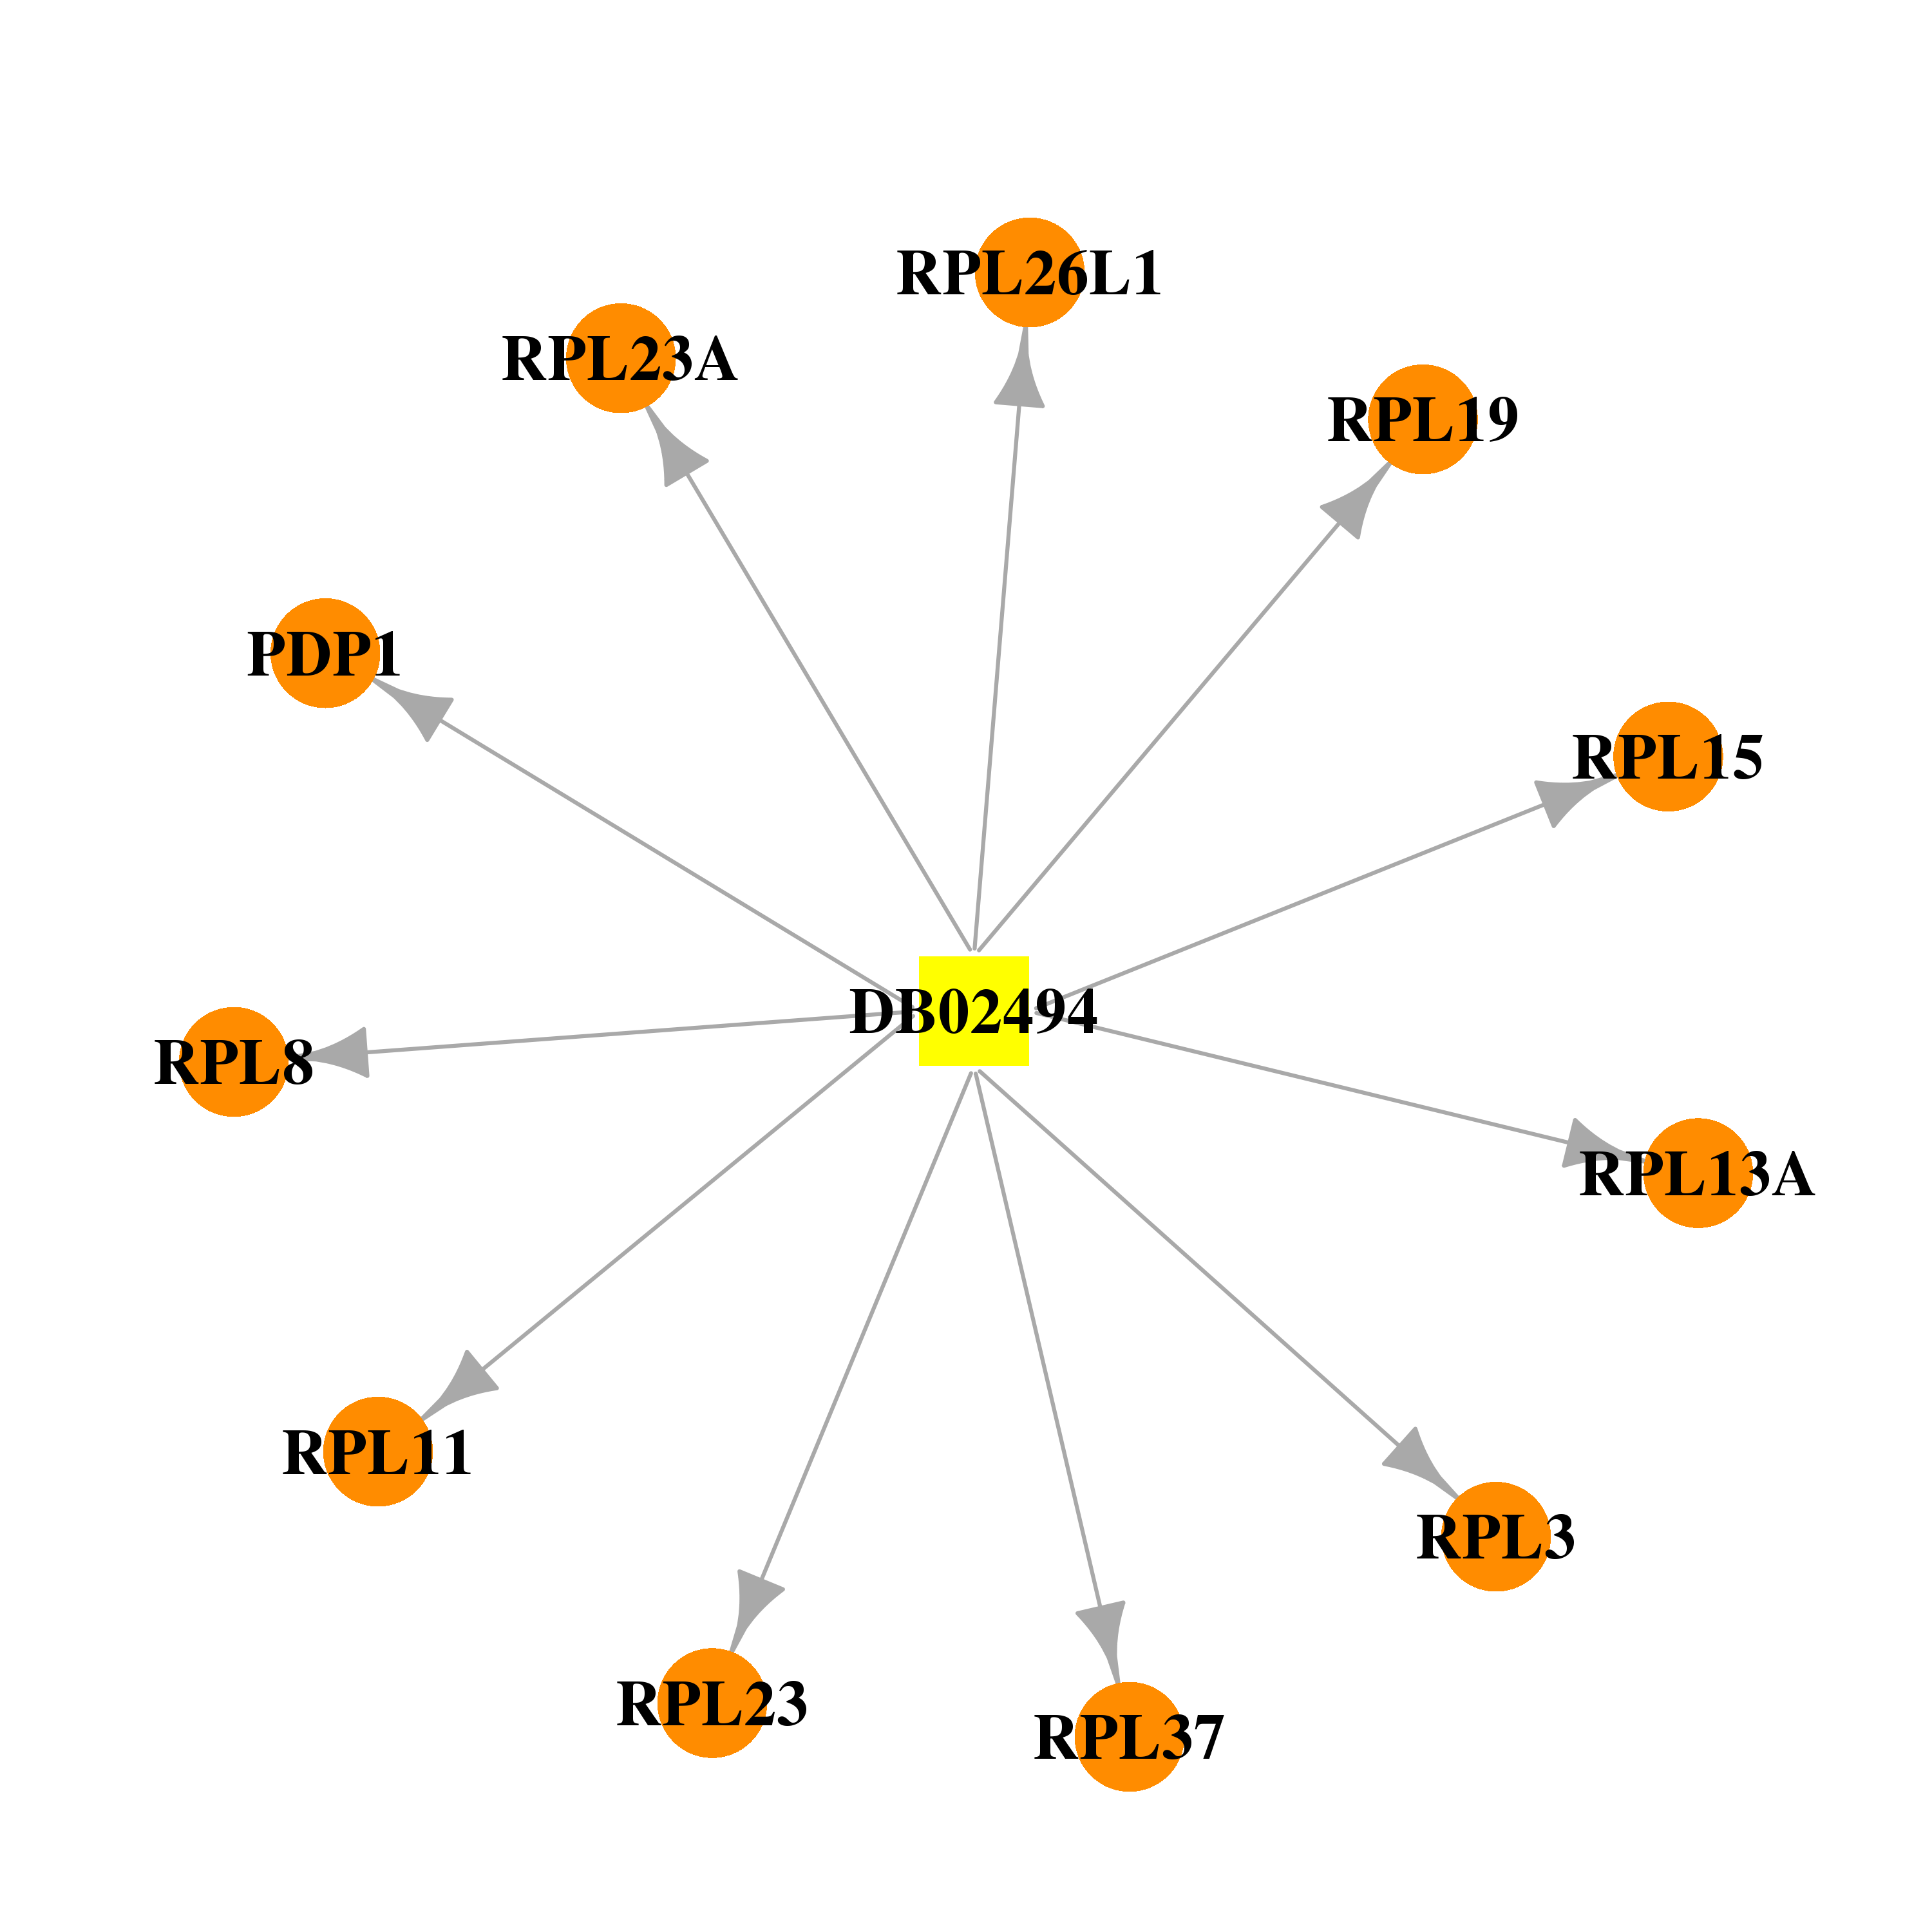 | 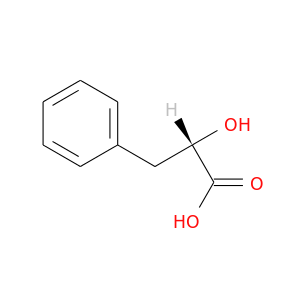 |
| DB07374 | ribosomal protein L13a | experimental | ANISOMYCIN |  | 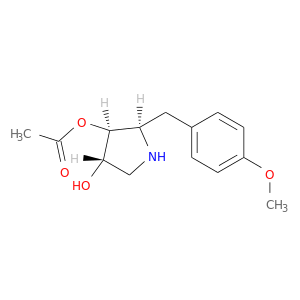 |
| DB08437 | ribosomal protein L13a | experimental | PUROMYCIN |  | 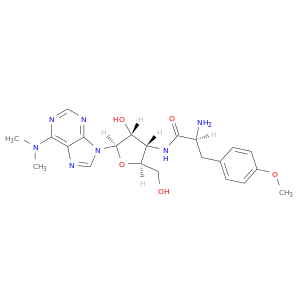 |
| Top |
| Cross referenced IDs for RPL13A |
| * We obtained these cross-references from Uniprot database. It covers 150 different DBs, 18 categories. http://www.uniprot.org/help/cross_references_section |
: Open all cross reference information
|
Copyright © 2016-Present - The Univsersity of Texas Health Science Center at Houston @ |