|
||||||||||||||||||||||||||||||||||||||||||||||||||||||||||||||||||||||||||||||||||||||||||||||||||||||||||||||||||||||||||||||||||||||||||||||||||||||||||||||||||||||||||||||||||||||||||||||||||||||||||||||||||||||||||||||||||||||||||||||||||||||||||||||||||||||||||||||||||||||||||||||||||||||||||||||||||||||||||
| |
| Phenotypic Information (metabolism pathway, cancer, disease, phenome) |
| |
| |
| Gene-Gene Network Information: Co-Expression Network, Interacting Genes & KEGG |
| |
|


| Gene Summary for PIK3R5 |
| Basic gene info. | Gene symbol | PIK3R5 |
| Gene name | phosphoinositide-3-kinase, regulatory subunit 5 | |
| Synonyms | F730038I15Rik|FOAP-2|P101-PI3K|p101 | |
| Cytomap | UCSC genome browser: 17p13.1 | |
| Genomic location | chr17 :8782232-8869029 | |
| Type of gene | protein-coding | |
| RefGenes | NM_001142633.2, NM_001251851.1,NM_001251852.1,NM_001251853.1,NM_001251855.1, NM_014308.3, | |
| Ensembl id | ENSG00000141506 | |
| Description | PI3-kinase p101 subunitphosphatidylinositol 4,5-bisphosphate 3-kinase regulatory subunitphosphatidylinositol-4,5-bisphosphate 3-kinase regulatory subunitphosphoinositide 3-kinase regulatory subunit 5protein FOAP-2ptdIns-3-kinase p101 | |
| Modification date | 20141207 | |
| dbXrefs | MIM : 611317 | |
| HGNC : HGNC | ||
| Ensembl : ENSG00000141506 | ||
| HPRD : 11433 | ||
| Vega : OTTHUMG00000108197 | ||
| Protein | UniProt: go to UniProt's Cross Reference DB Table | |
| Expression | CleanEX: HS_PIK3R5 | |
| BioGPS: 23533 | ||
| Gene Expression Atlas: ENSG00000141506 | ||
| The Human Protein Atlas: ENSG00000141506 | ||
| Pathway | NCI Pathway Interaction Database: PIK3R5 | |
| KEGG: PIK3R5 | ||
| REACTOME: PIK3R5 | ||
| ConsensusPathDB | ||
| Pathway Commons: PIK3R5 | ||
| Metabolism | MetaCyc: PIK3R5 | |
| HUMANCyc: PIK3R5 | ||
| Regulation | Ensembl's Regulation: ENSG00000141506 | |
| miRBase: chr17 :8,782,232-8,869,029 | ||
| TargetScan: NM_001142633 | ||
| cisRED: ENSG00000141506 | ||
| Context | iHOP: PIK3R5 | |
| cancer metabolism search in PubMed: PIK3R5 | ||
| UCL Cancer Institute: PIK3R5 | ||
| Assigned class in ccmGDB | C | |
| Top |
| Phenotypic Information for PIK3R5(metabolism pathway, cancer, disease, phenome) |
| Cancer | CGAP: PIK3R5 |
| Familial Cancer Database: PIK3R5 | |
| * This gene is included in those cancer gene databases. |
|
|
|
|
|
|
| ||||||||||||||||||||||||||||||||||||||||||||||||||||||||||||||||||||||||||||||||||||||||||||||||||||||||||||||||||||||||||||||||||||||||||||||||||||||||||||||||||||||||||||||||||||||||||||||||||||||||||||||||||||||||||||||||||||||||||||||||||||||||||||||||||||||||||||||||||||||||||||||||||||||||||||||||||||
Oncogene 1 | Significant driver gene in | |||||||||||||||||||||||||||||||||||||||||||||||||||||||||||||||||||||||||||||||||||||||||||||||||||||||||||||||||||||||||||||||||||||||||||||||||||||||||||||||||||||||||||||||||||||||||||||||||||||||||||||||||||||||||||||||||||||||||||||||||||||||||||||||||||||||||||||||||||||||||||||||||||||||||||||||||||||||||
| cf) number; DB name 1 Oncogene; http://nar.oxfordjournals.org/content/35/suppl_1/D721.long, 2 Tumor Suppressor gene; https://bioinfo.uth.edu/TSGene/, 3 Cancer Gene Census; http://www.nature.com/nrc/journal/v4/n3/abs/nrc1299.html, 4 CancerGenes; http://nar.oxfordjournals.org/content/35/suppl_1/D721.long, 5 Network of Cancer Gene; http://ncg.kcl.ac.uk/index.php, 1Therapeutic Vulnerabilities in Cancer; http://cbio.mskcc.org/cancergenomics/statius/ |
| KEGG_FC_GAMMA_R_MEDIATED_PHAGOCYTOSIS REACTOME_PHOSPHOLIPID_METABOLISM REACTOME_PI_METABOLISM REACTOME_METABOLISM_OF_LIPIDS_AND_LIPOPROTEINS | |
| OMIM | |
| Orphanet | |
| Disease | KEGG Disease: PIK3R5 |
| MedGen: PIK3R5 (Human Medical Genetics with Condition) | |
| ClinVar: PIK3R5 | |
| Phenotype | MGI: PIK3R5 (International Mouse Phenotyping Consortium) |
| PhenomicDB: PIK3R5 | |
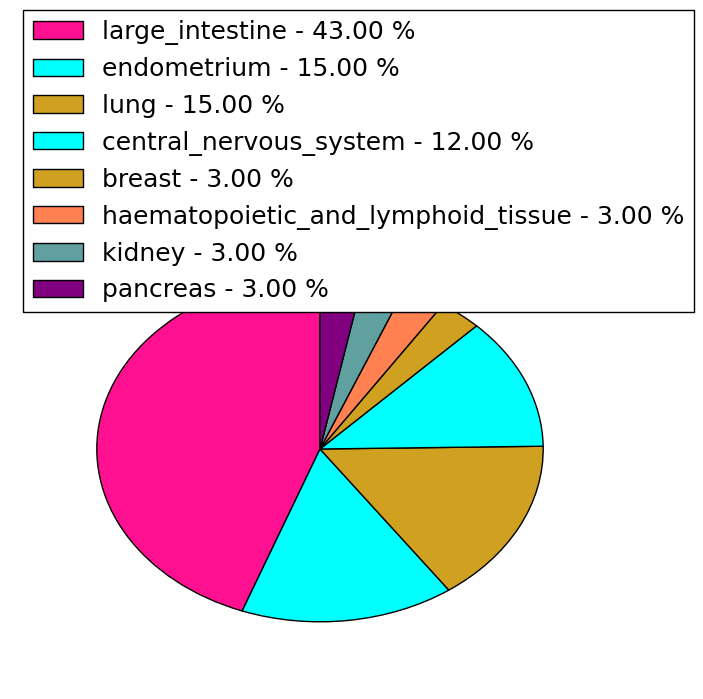
| Mutations for PIK3R5 |
| * Under tables are showing count per each tissue to give us broad intuition about tissue specific mutation patterns.You can go to the detailed page for each mutation database's web site. |
| - Statistics for Tissue and Mutation type | Top |
 |
| - For Inter-chromosomal Variations |
| There's no inter-chromosomal structural variation. |
| - For Intra-chromosomal Variations |
| * Intra-chromosomal variantions includes 'intrachromosomal amplicon to amplicon', 'intrachromosomal amplicon to non-amplified dna', 'intrachromosomal deletion', 'intrachromosomal fold-back inversion', 'intrachromosomal inversion', 'intrachromosomal tandem duplication', 'Intrachromosomal unknown type', 'intrachromosomal with inverted orientation', 'intrachromosomal with non-inverted orientation'. |
 |
| Sample | Symbol_a | Chr_a | Start_a | End_a | Symbol_b | Chr_b | Start_b | End_b |
| pancreas | PIK3R5 | chr17 | 8793992 | 8794012 | PIK3R5 | chr17 | 8797816 | 8797836 |
| cf) Tissue number; Tissue name (1;Breast, 2;Central_nervous_system, 3;Haematopoietic_and_lymphoid_tissue, 4;Large_intestine, 5;Liver, 6;Lung, 7;Ovary, 8;Pancreas, 9;Prostate, 10;Skin, 11;Soft_tissue, 12;Upper_aerodigestive_tract) |
| * From mRNA Sanger sequences, Chitars2.0 arranged chimeric transcripts. This table shows PIK3R5 related fusion information. |
| ID | Head Gene | Tail Gene | Accession | Gene_a | qStart_a | qEnd_a | Chromosome_a | tStart_a | tEnd_a | Gene_a | qStart_a | qEnd_a | Chromosome_a | tStart_a | tEnd_a |
| BF903043 | GOLGA3 | 1 | 183 | 12 | 133378421 | 133381351 | PIK3R5 | 178 | 223 | 17 | 8847922 | 8847967 | |
| BF902971 | GOLGA3 | 23 | 209 | 12 | 133378421 | 133381354 | PIK3R5 | 204 | 249 | 17 | 8847922 | 8847967 | |
| BM549901 | MS4A7 | 26 | 465 | 11 | 60146050 | 60157054 | PIK3R5 | 457 | 884 | 17 | 8818109 | 8818534 | |
| CT002985 | PIK3R5 | 5 | 100 | 17 | 8868910 | 8869005 | RNF135 | 96 | 848 | 17 | 29311633 | 29326072 | |
| BF849586 | PIK3R5 | 16 | 238 | 17 | 8863944 | 8864167 | INPP5D | 226 | 307 | 2 | 234105025 | 234105106 | |
| Top |
| Mutation type/ Tissue ID | brca | cns | cerv | endome | haematopo | kidn | Lintest | liver | lung | ns | ovary | pancre | prost | skin | stoma | thyro | urina | |||
| Total # sample | 1 | 1 | ||||||||||||||||||
| GAIN (# sample) | 1 | |||||||||||||||||||
| LOSS (# sample) | 1 |
| cf) Tissue ID; Tissue type (1; Breast, 2; Central_nervous_system, 3; Cervix, 4; Endometrium, 5; Haematopoietic_and_lymphoid_tissue, 6; Kidney, 7; Large_intestine, 8; Liver, 9; Lung, 10; NS, 11; Ovary, 12; Pancreas, 13; Prostate, 14; Skin, 15; Stomach, 16; Thyroid, 17; Urinary_tract) |
| Top |
|
 |
| Top |
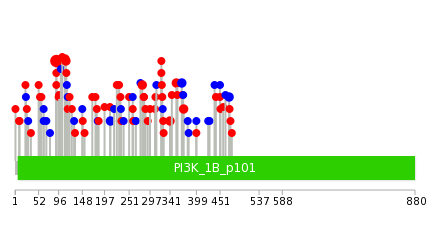
| Stat. for Non-Synonymous SNVs (# total SNVs=67) | (# total SNVs=32) |
 |  |
(# total SNVs=1) | (# total SNVs=1) |
 |  |
| Top |
| * When you move the cursor on each content, you can see more deailed mutation information on the Tooltip. Those are primary_site,primary_histology,mutation(aa),pubmedID. |
| GRCh37 position | Mutation(aa) | Unique sampleID count |
| chr17:8792171-8792171 | p.L311L | 5 |
| chr17:8792003-8792003 | p.S367S | 3 |
| chr17:8793325-8793325 | p.A259V | 3 |
| chr17:8791611-8791611 | p.R498H | 3 |
| chr17:8785177-8785177 | p.R743C | 3 |
| chr17:8785182-8785182 | p.R741Q | 3 |
| chr17:8784028-8784028 | p.P857P | 2 |
| chr17:8809023-8809023 | p.T79S | 2 |
| chr17:8792082-8792082 | p.A341V | 2 |
| chr17:8784088-8784088 | p.P837P | 2 |
| Top |
|
 |
| Point Mutation/ Tissue ID | 1 | 2 | 3 | 4 | 5 | 6 | 7 | 8 | 9 | 10 | 11 | 12 | 13 | 14 | 15 | 16 | 17 | 18 | 19 | 20 |
| # sample | 3 | 7 | 15 | 7 | 5 | 14 | 4 | 3 | 2 | 20 | 10 | 2 | 12 | |||||||
| # mutation | 3 | 7 | 8 | 7 | 4 | 17 | 4 | 3 | 2 | 20 | 12 | 2 | 14 | |||||||
| nonsynonymous SNV | 3 | 5 | 5 | 3 | 15 | 2 | 3 | 14 | 9 | 2 | 9 | |||||||||
| synonymous SNV | 3 | 4 | 3 | 2 | 1 | 2 | 2 | 2 | 6 | 3 | 5 |
| cf) Tissue ID; Tissue type (1; BLCA[Bladder Urothelial Carcinoma], 2; BRCA[Breast invasive carcinoma], 3; CESC[Cervical squamous cell carcinoma and endocervical adenocarcinoma], 4; COAD[Colon adenocarcinoma], 5; GBM[Glioblastoma multiforme], 6; Glioma Low Grade, 7; HNSC[Head and Neck squamous cell carcinoma], 8; KICH[Kidney Chromophobe], 9; KIRC[Kidney renal clear cell carcinoma], 10; KIRP[Kidney renal papillary cell carcinoma], 11; LAML[Acute Myeloid Leukemia], 12; LUAD[Lung adenocarcinoma], 13; LUSC[Lung squamous cell carcinoma], 14; OV[Ovarian serous cystadenocarcinoma ], 15; PAAD[Pancreatic adenocarcinoma], 16; PRAD[Prostate adenocarcinoma], 17; SKCM[Skin Cutaneous Melanoma], 18:STAD[Stomach adenocarcinoma], 19:THCA[Thyroid carcinoma], 20:UCEC[Uterine Corpus Endometrial Carcinoma]) |
| Top |
| * We represented just top 10 SNVs. When you move the cursor on each content, you can see more deailed mutation information on the Tooltip. Those are primary_site, primary_histology, mutation(aa), pubmedID. |
| Genomic Position | Mutation(aa) | Unique sampleID count |
| chr17:8791675 | p.R91G,PIK3R5 | 10 |
| chr17:8794082 | p.P471P,PIK3R5 | 2 |
| chr17:8789831 | p.R355Q,PIK3R5 | 2 |
| chr17:8784028 | p.L371R,PIK3R5 | 2 |
| chr17:8792082 | p.A280V,PIK3R5 | 2 |
| chr17:8785182 | p.R112H,PIK3R5 | 2 |
| chr17:8791611 | p.A341V,PIK3R5 | 2 |
| chr17:8791618 | p.A110T,PIK3R5 | 2 |
| chr17:8791992 | p.D210D,PIK3R5 | 2 |
| chr17:8792182 | p.R26L,PIK3R5 | 1 |
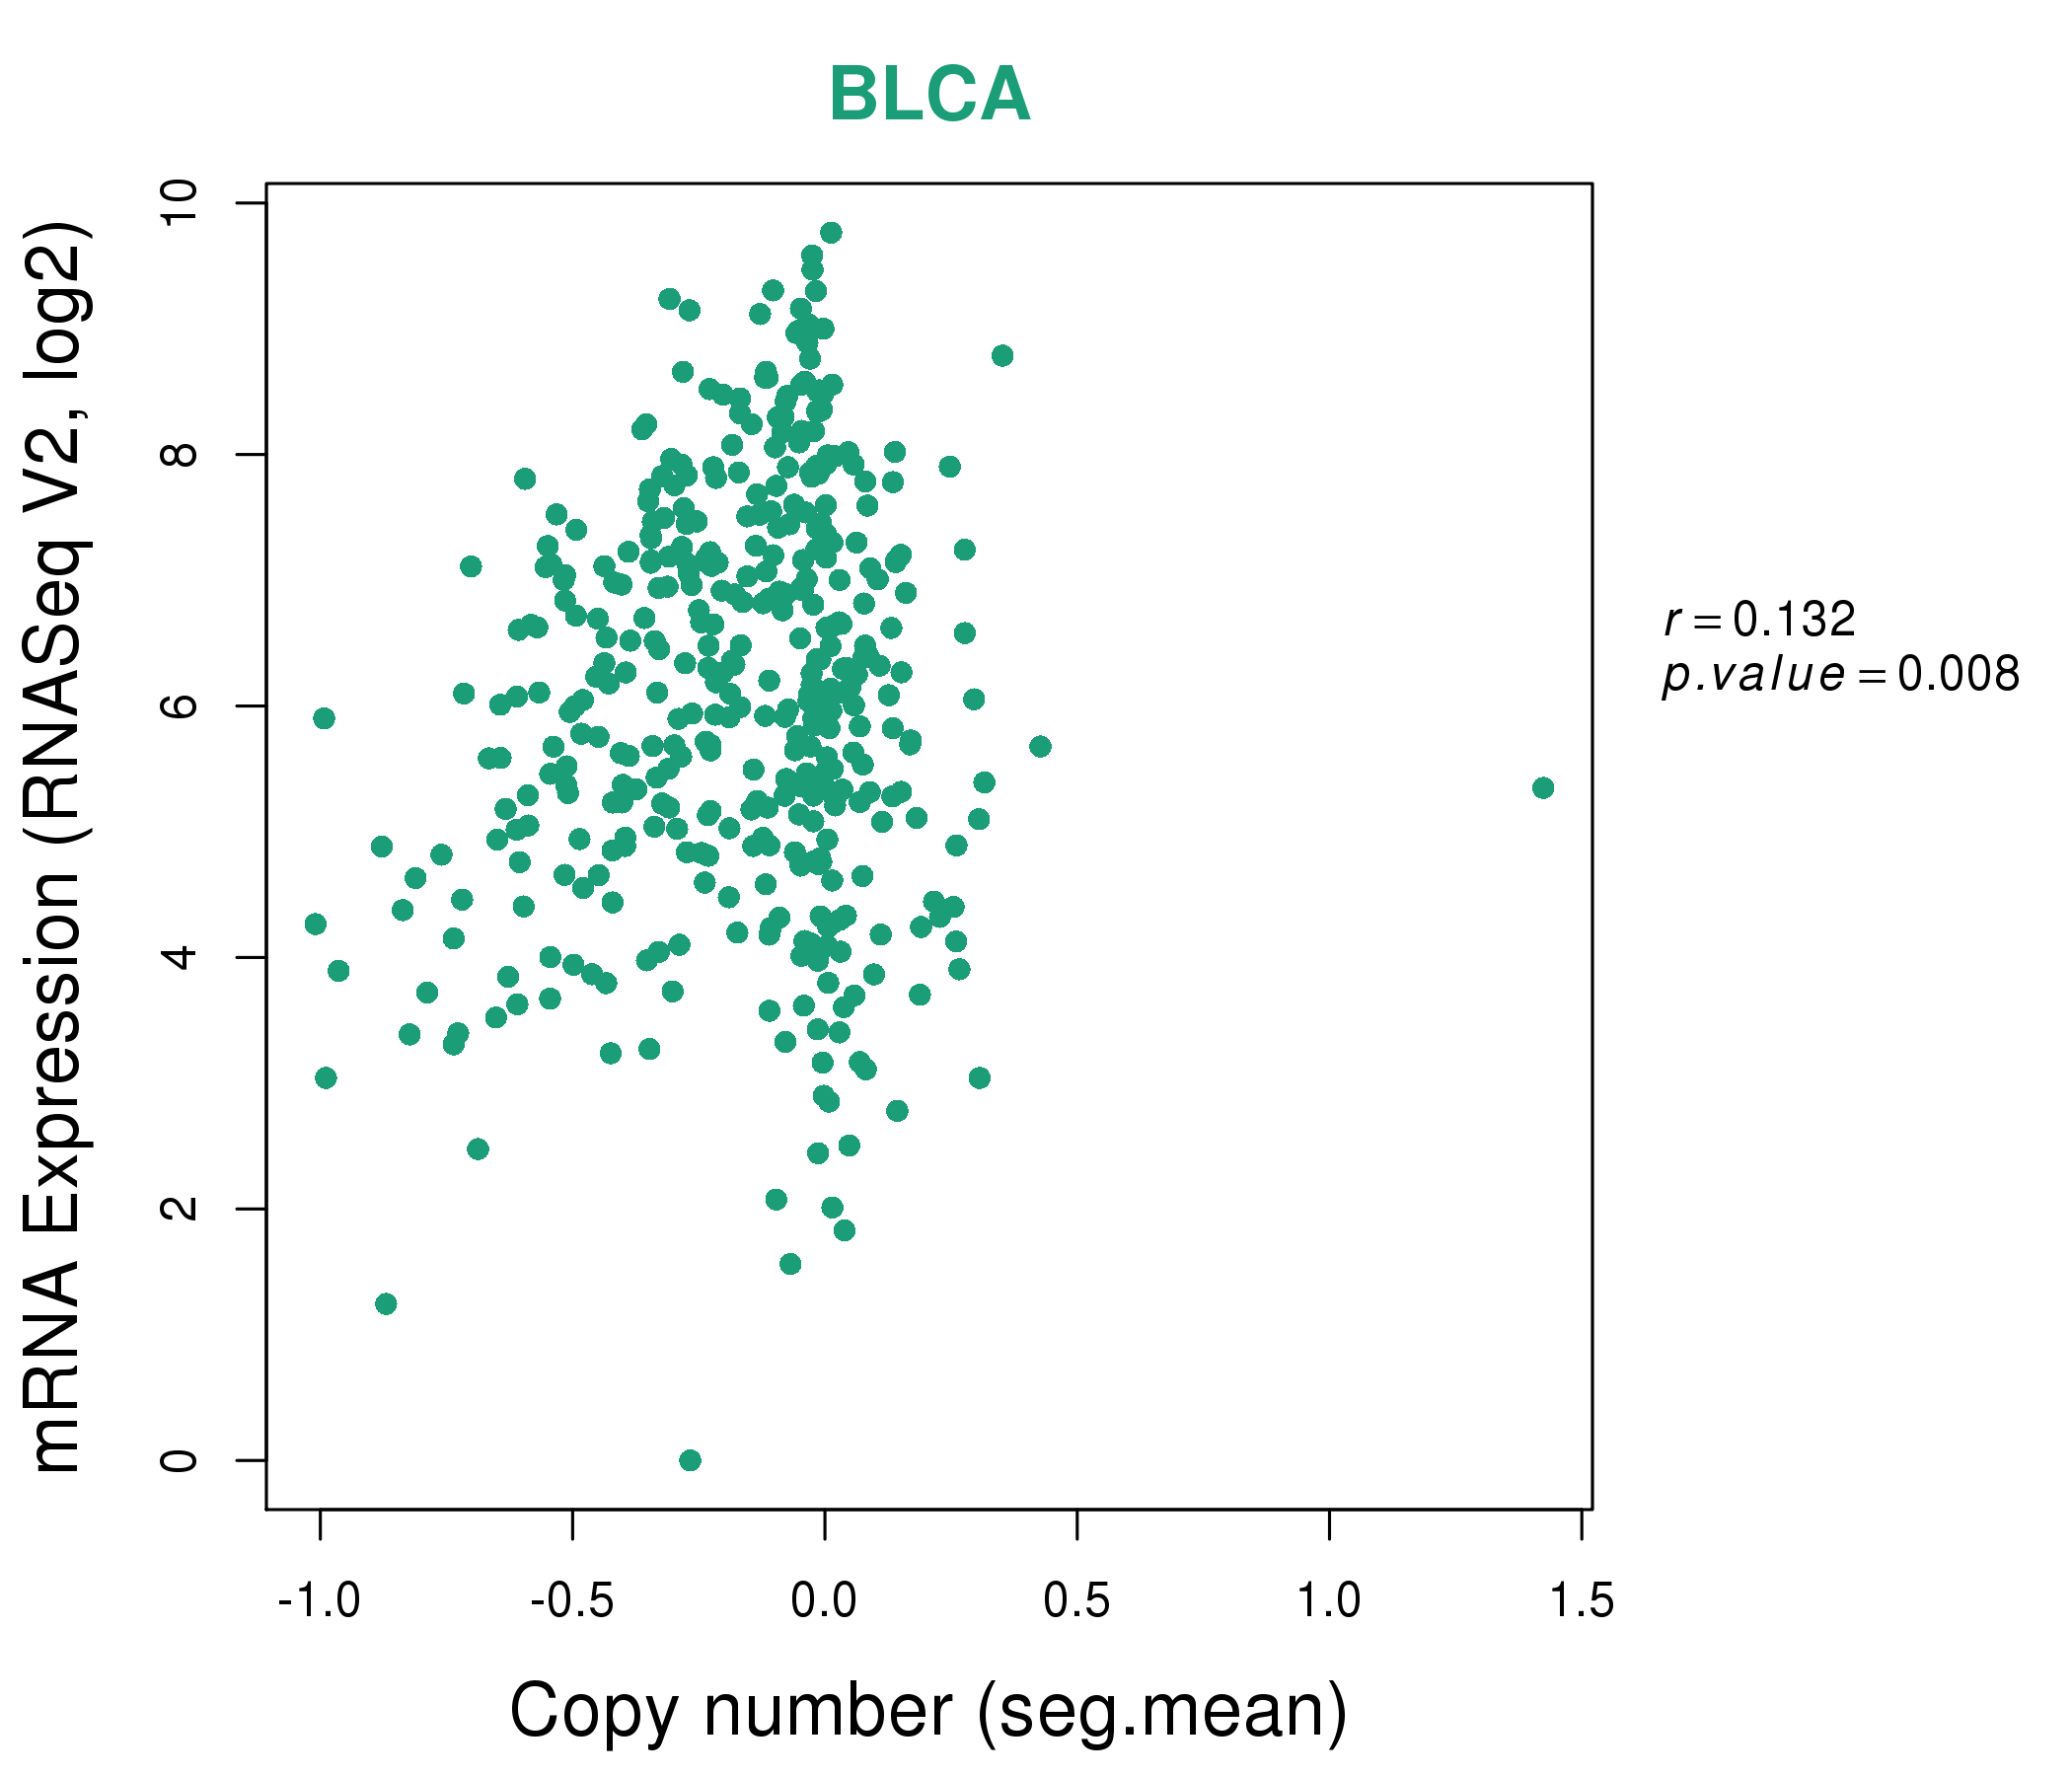
| * Copy number data were extracted from TCGA using R package TCGA-Assembler. The URLs of all public data files on TCGA DCC data server were gathered on Jan-05-2015. Function ProcessCNAData in TCGA-Assembler package was used to obtain gene-level copy number value which is calculated as the average copy number of the genomic region of a gene. |
 |
| cf) Tissue ID[Tissue type]: BLCA[Bladder Urothelial Carcinoma], BRCA[Breast invasive carcinoma], CESC[Cervical squamous cell carcinoma and endocervical adenocarcinoma], COAD[Colon adenocarcinoma], GBM[Glioblastoma multiforme], Glioma Low Grade, HNSC[Head and Neck squamous cell carcinoma], KICH[Kidney Chromophobe], KIRC[Kidney renal clear cell carcinoma], KIRP[Kidney renal papillary cell carcinoma], LAML[Acute Myeloid Leukemia], LUAD[Lung adenocarcinoma], LUSC[Lung squamous cell carcinoma], OV[Ovarian serous cystadenocarcinoma ], PAAD[Pancreatic adenocarcinoma], PRAD[Prostate adenocarcinoma], SKCM[Skin Cutaneous Melanoma], STAD[Stomach adenocarcinoma], THCA[Thyroid carcinoma], UCEC[Uterine Corpus Endometrial Carcinoma] |
| Top |
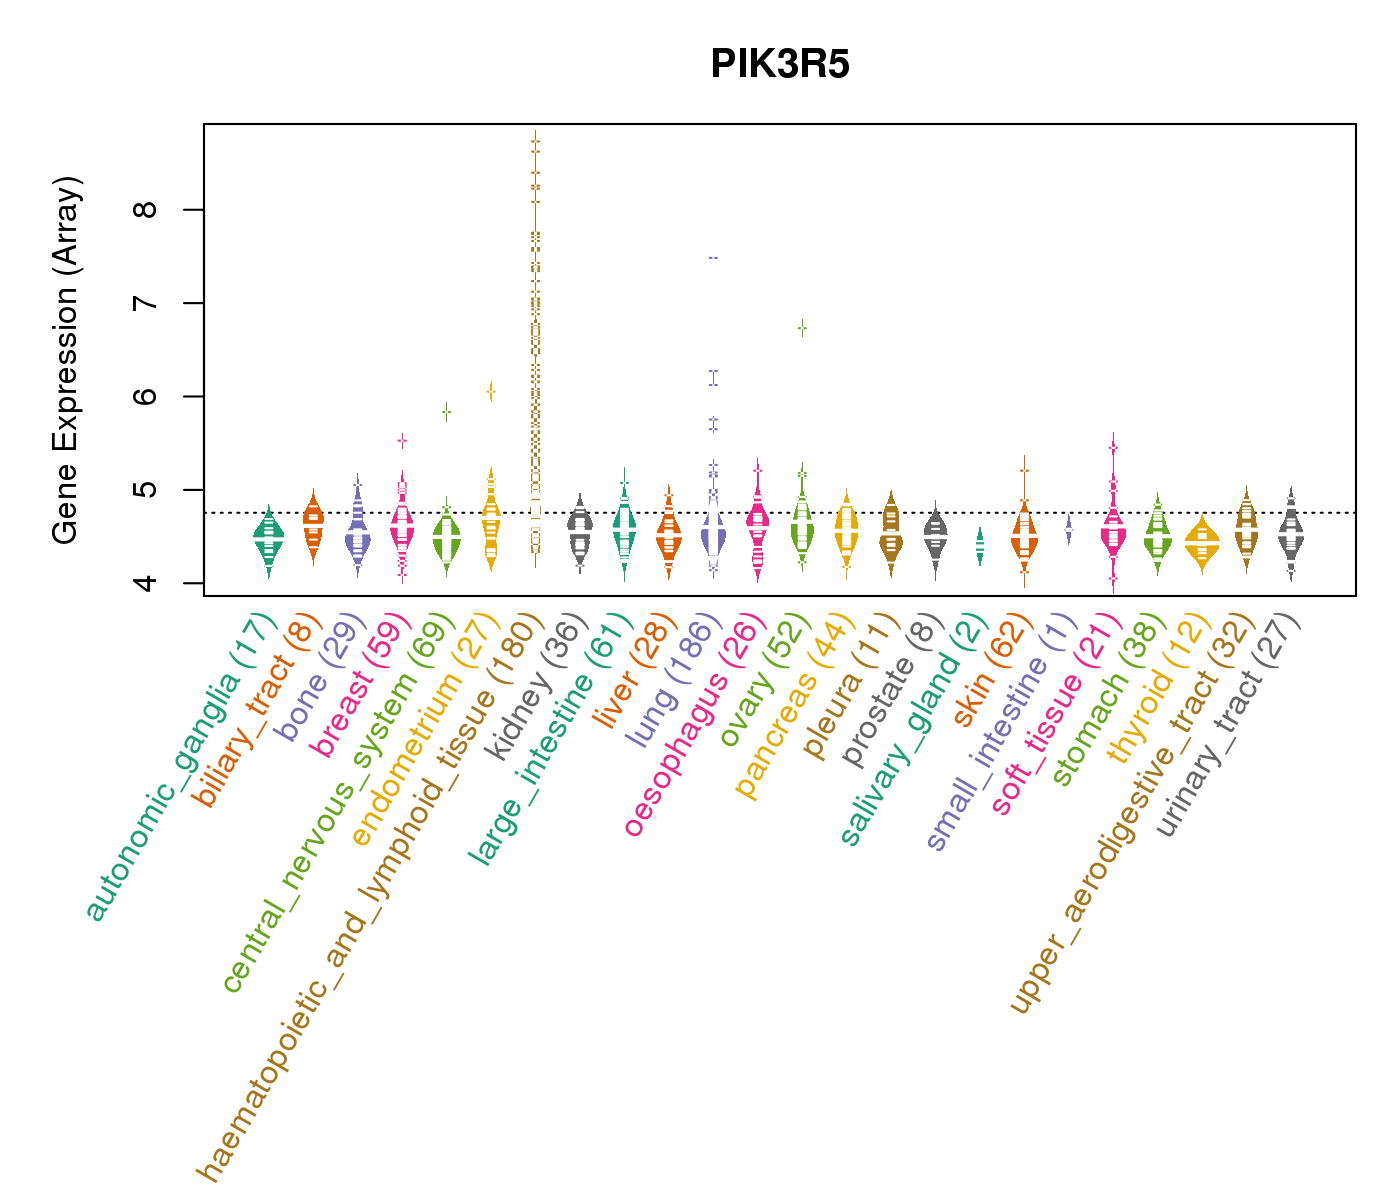
| Gene Expression for PIK3R5 |
| * CCLE gene expression data were extracted from CCLE_Expression_Entrez_2012-10-18.res: Gene-centric RMA-normalized mRNA expression data. |
 |
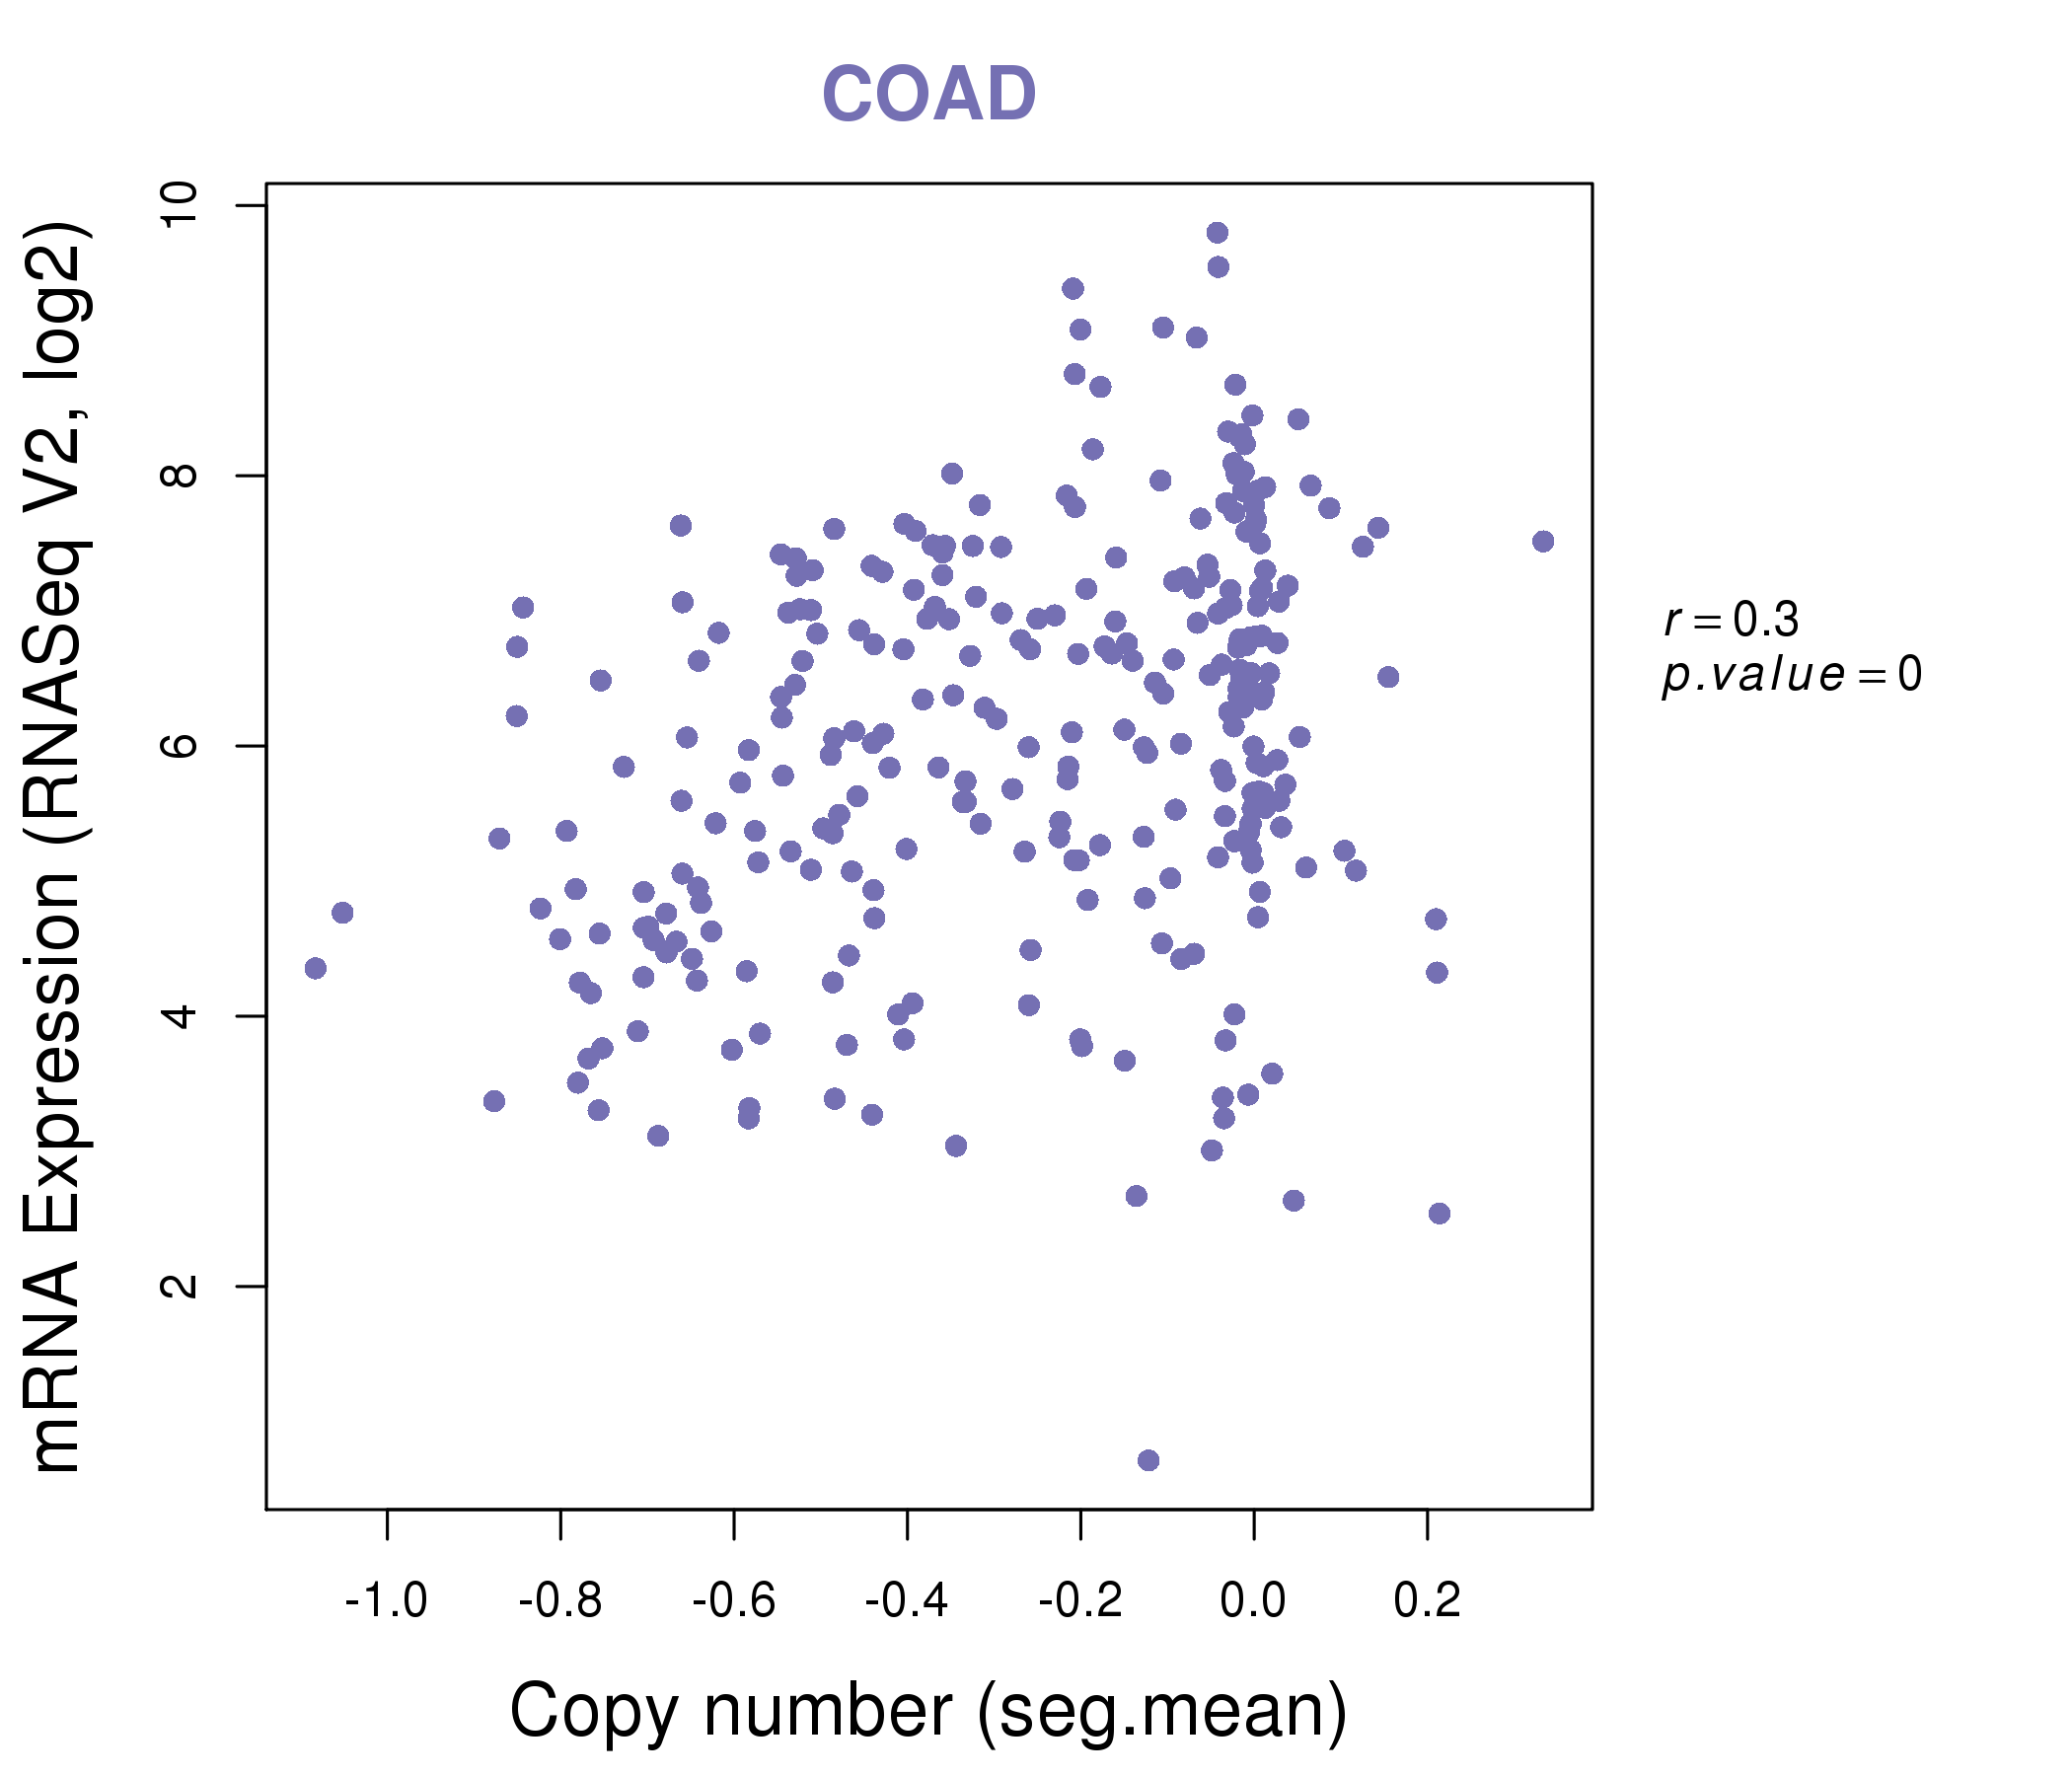
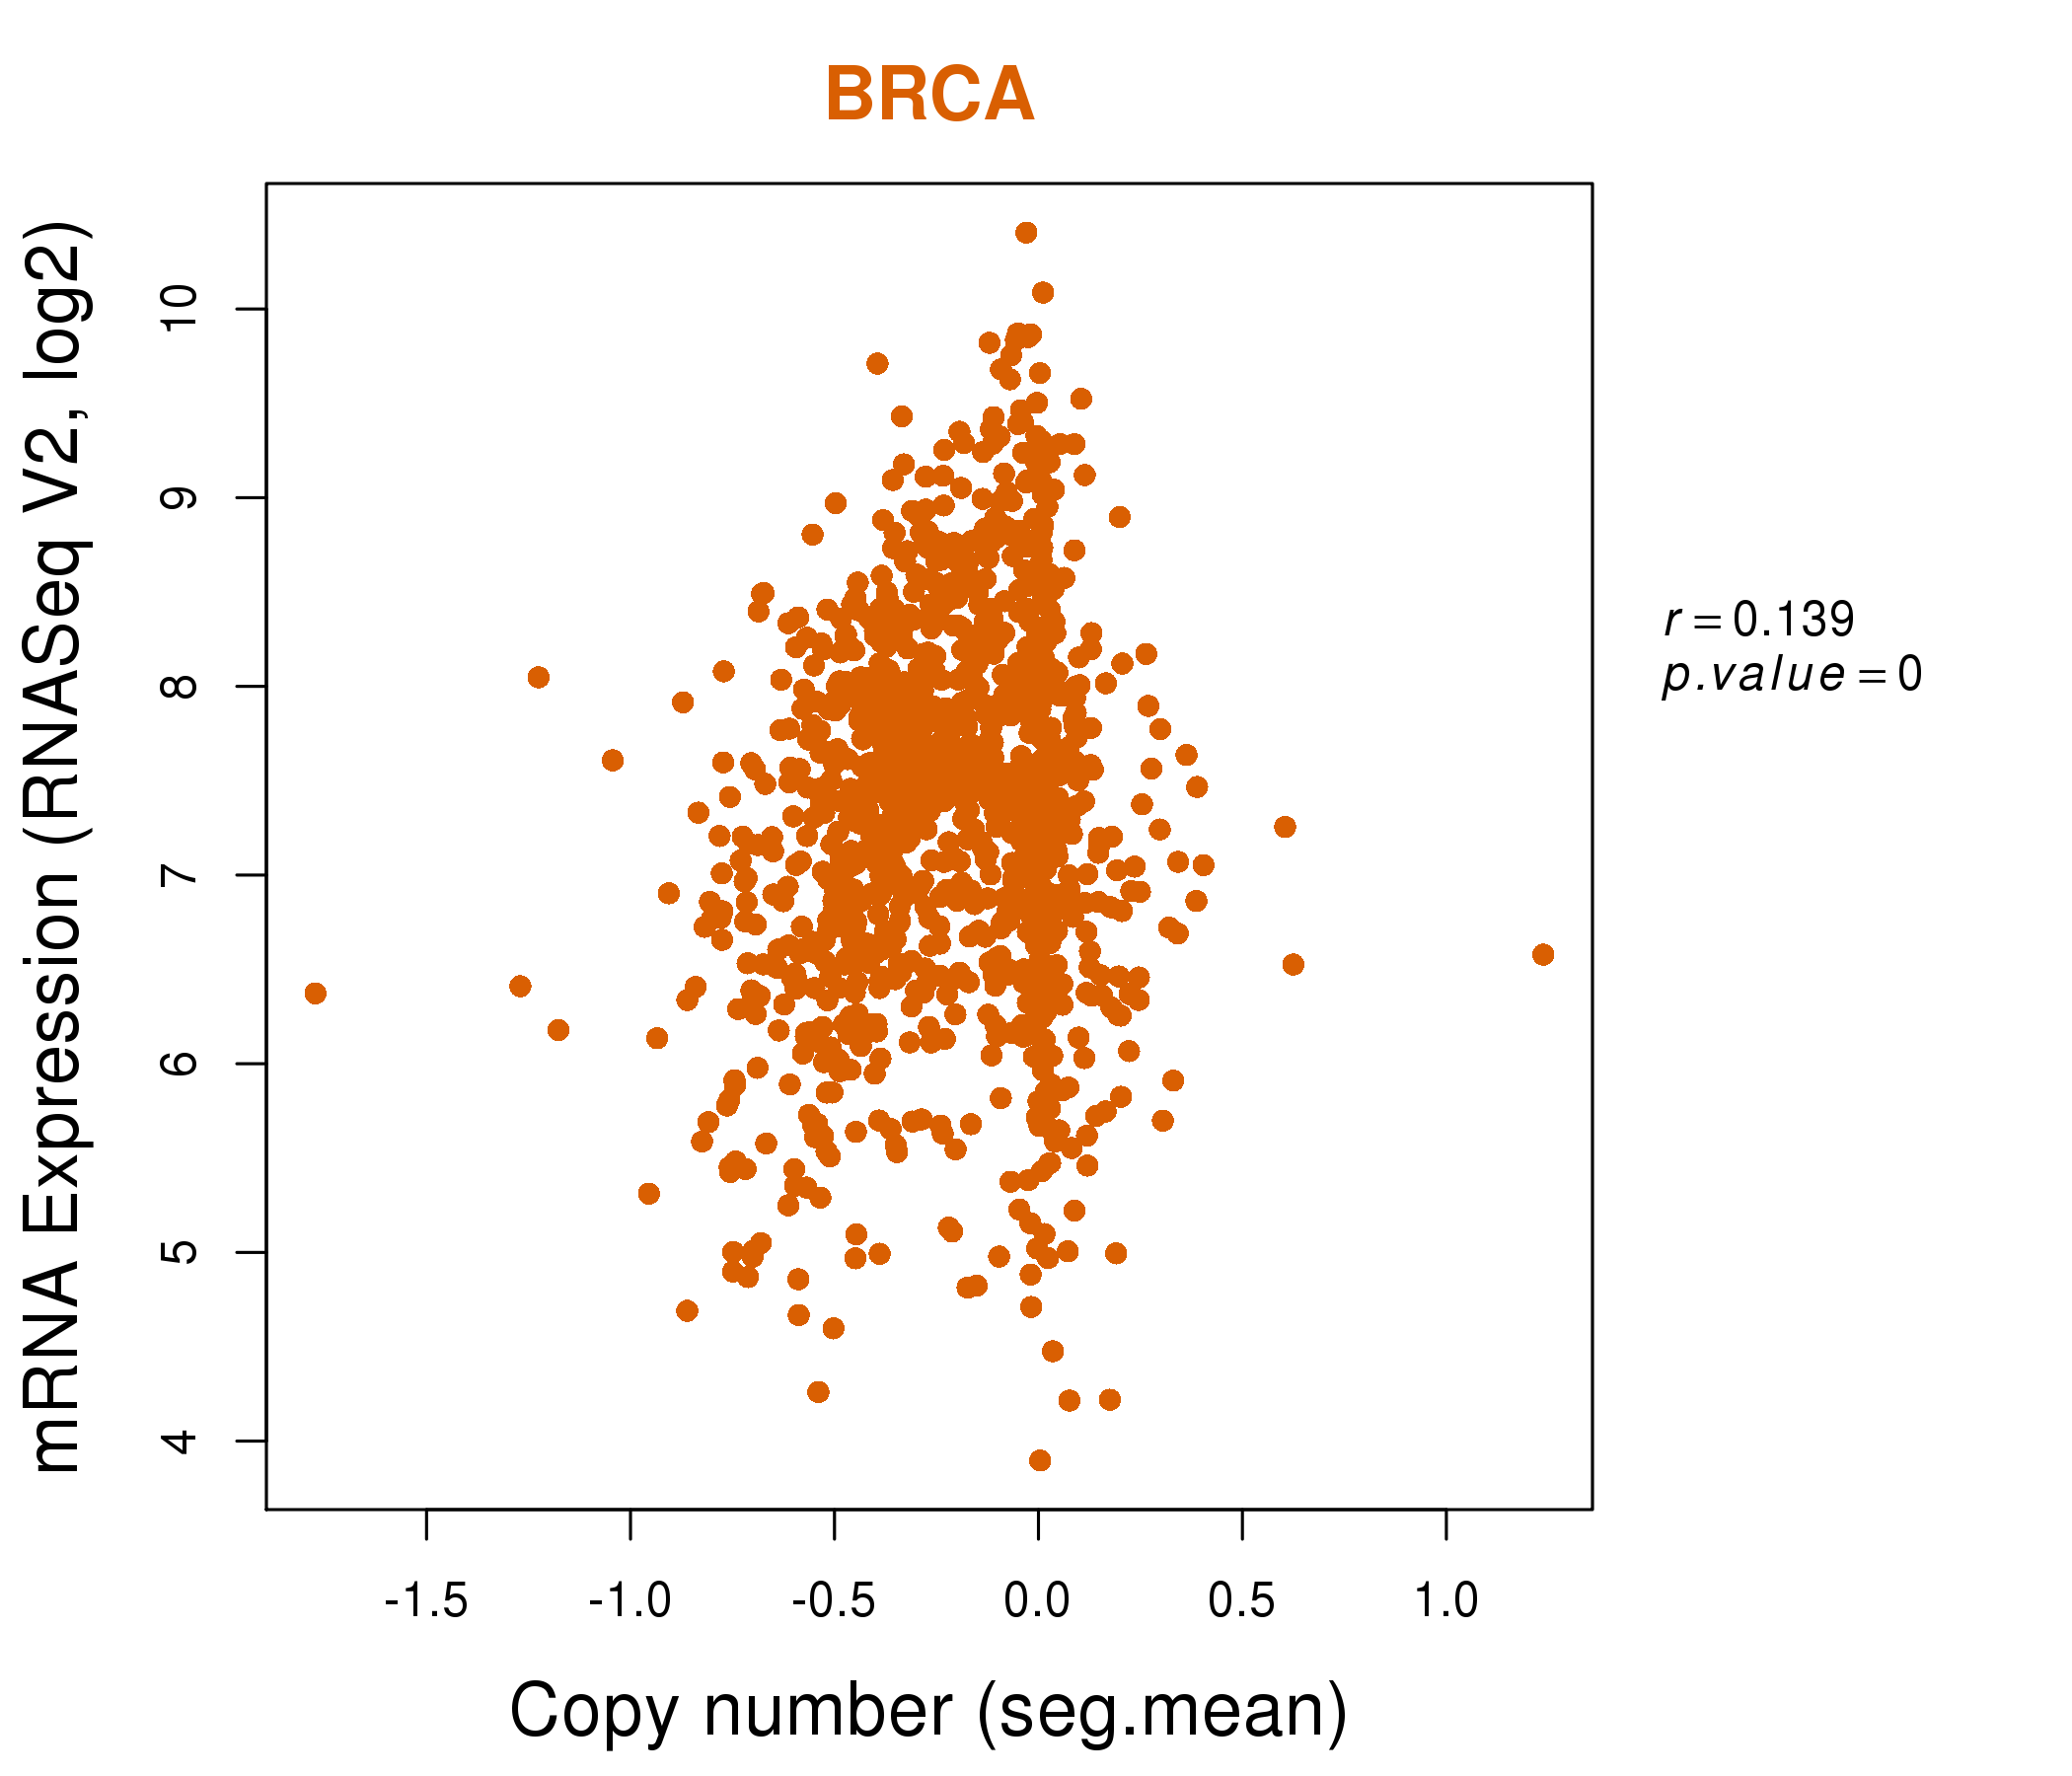
| * Normalized gene expression data of RNASeqV2 was extracted from TCGA using R package TCGA-Assembler. The URLs of all public data files on TCGA DCC data server were gathered at Jan-05-2015. Only eight cancer types have enough normal control samples for differential expression analysis. (t test, adjusted p<0.05 (using Benjamini-Hochberg FDR)) |
 |
| Top |
| * This plots show the correlation between CNV and gene expression. |
: Open all plots for all cancer types
 |
|
 |
|

| Top |
| Gene-Gene Network Information |
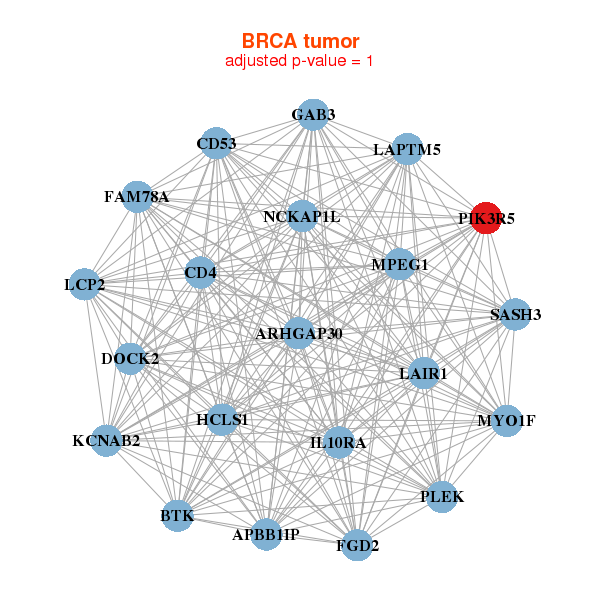
| * Co-Expression network figures were drawn using R package igraph. Only the top 20 genes with the highest correlations were shown. Red circle: input gene, orange circle: cell metabolism gene, sky circle: other gene |
: Open all plots for all cancer types
 |
|
| APBB1IP,ARHGAP30,BTK,CD4,CD53,DOCK2,FAM78A, FGD2,GAB3,HCLS1,IL10RA,KCNAB2,LAIR1,LAPTM5, LCP2,MPEG1,MYO1F,NCKAP1L,PIK3R5,PLEK,SASH3 | CD33,CD4,CD68,CD86,FGD2,HAVCR2,HCK, IL10RA,ITGAM,LILRA6,LILRB2,LRRC25,MSR1,NCKAP1L, NFAM1,NLRC4,PIK3R5,PLEK,SIGLEC9,SLC7A7,SPI1 |
 |
|
| APBB1IP,ARHGAP30,CD53,CD84,CSF2RB,CYTH4,DOCK10, DOCK2,FAM78A,FGD2,FMNL1,FYB,GAB3,HCLS1, IL10RA,LILRB1,MYO1F,NCKAP1L,PIK3R5,SLA,WAS | BHLHA15,CD4,CD84,CMKLR1,CSF1R,CSF2RB,EVI2B, FLT3,GAB3,IL10RA,ITGB2,MYO1F,NFAM1,PIK3R5, PLCB2,PREX1,PTAFR,ST8SIA4,STAB1,TMEM86A,TRPM2 |
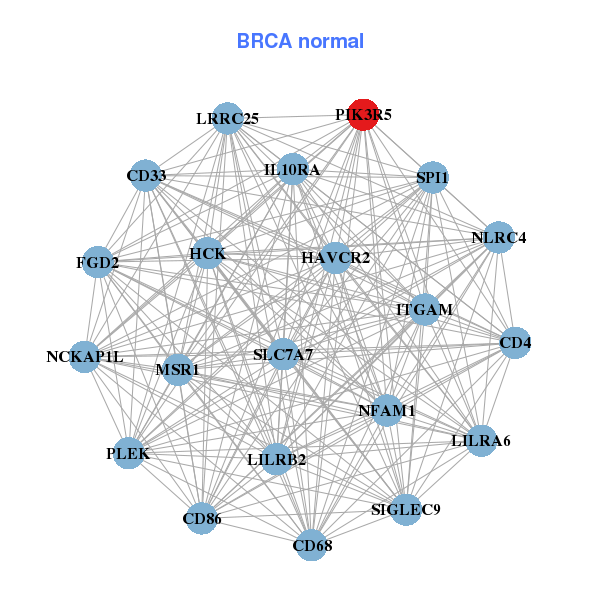
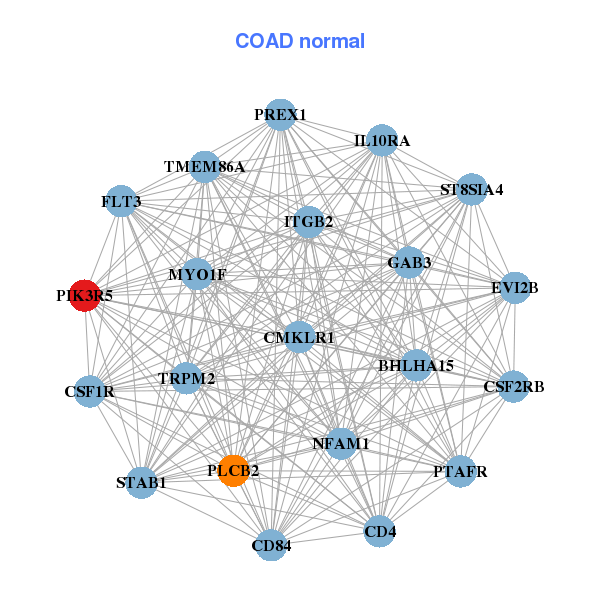
| * Co-Expression network figures were drawn using R package igraph. Only the top 20 genes with the highest correlations were shown. Red circle: input gene, orange circle: cell metabolism gene, sky circle: other gene |
: Open all plots for all cancer types
| Top |
: Open all interacting genes' information including KEGG pathway for all interacting genes from DAVID
| Top |
| Pharmacological Information for PIK3R5 |
| There's no related Drug. |
| Top |
| Cross referenced IDs for PIK3R5 |
| * We obtained these cross-references from Uniprot database. It covers 150 different DBs, 18 categories. http://www.uniprot.org/help/cross_references_section |
: Open all cross reference information
|
Copyright © 2016-Present - The Univsersity of Texas Health Science Center at Houston @ |