|
||||||||||||||||||||
| |
| Phenotypic Information (metabolism pathway, cancer, disease, phenome) |
| |
| |
| Gene-Gene Network Information: Co-Expression Network, Interacting Genes & KEGG |
| |
|


| Gene Summary for FPGS |
| Top |
| Phenotypic Information for FPGS(metabolism pathway, cancer, disease, phenome) |
| Cancer | CGAP: FPGS |
| Familial Cancer Database: FPGS | |
| * This gene is included in those cancer gene databases. |
|
|
|
|
|
| . | ||||||||||||||
Oncogene 1 | Significant driver gene in | |||||||||||||||||||
| cf) number; DB name 1 Oncogene; http://nar.oxfordjournals.org/content/35/suppl_1/D721.long, 2 Tumor Suppressor gene; https://bioinfo.uth.edu/TSGene/, 3 Cancer Gene Census; http://www.nature.com/nrc/journal/v4/n3/abs/nrc1299.html, 4 CancerGenes; http://nar.oxfordjournals.org/content/35/suppl_1/D721.long, 5 Network of Cancer Gene; http://ncg.kcl.ac.uk/index.php, 1Therapeutic Vulnerabilities in Cancer; http://cbio.mskcc.org/cancergenomics/statius/ |
| REACTOME_METABOLISM_OF_VITAMINS_AND_COFACTORS | |
| OMIM | |
| Orphanet | |
| Disease | KEGG Disease: FPGS |
| MedGen: FPGS (Human Medical Genetics with Condition) | |
| ClinVar: FPGS | |
| Phenotype | MGI: FPGS (International Mouse Phenotyping Consortium) |
| PhenomicDB: FPGS | |
| Mutations for FPGS |
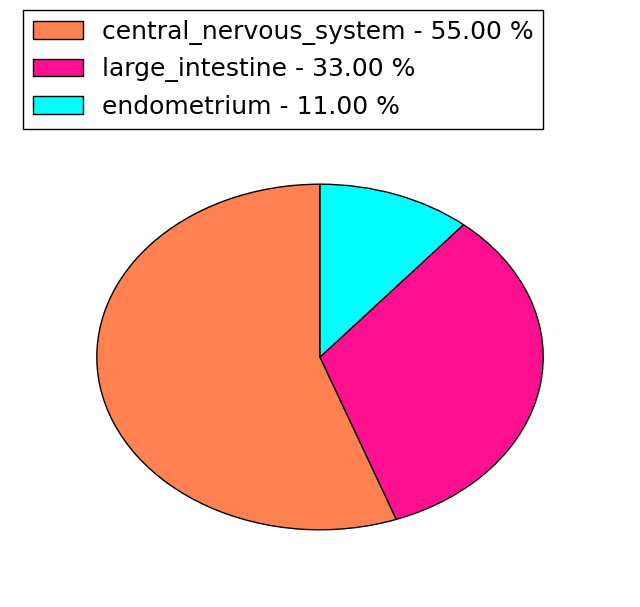
| * Under tables are showing count per each tissue to give us broad intuition about tissue specific mutation patterns.You can go to the detailed page for each mutation database's web site. |
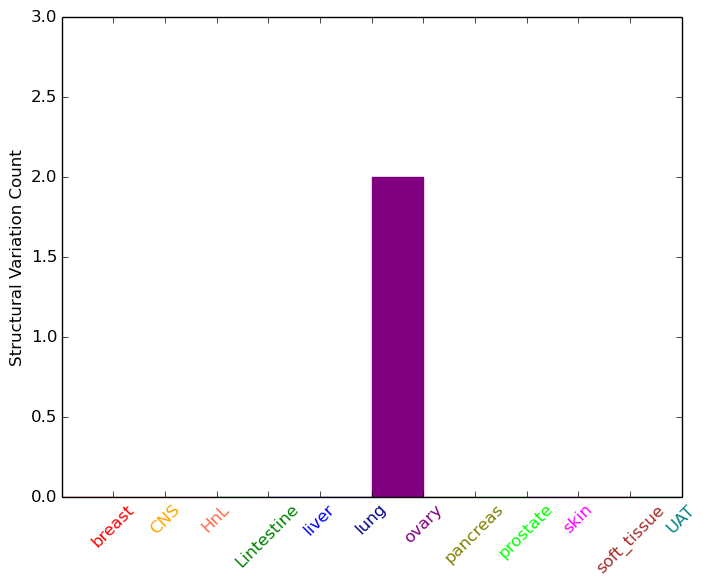
| - Statistics for Tissue and Mutation type | Top |
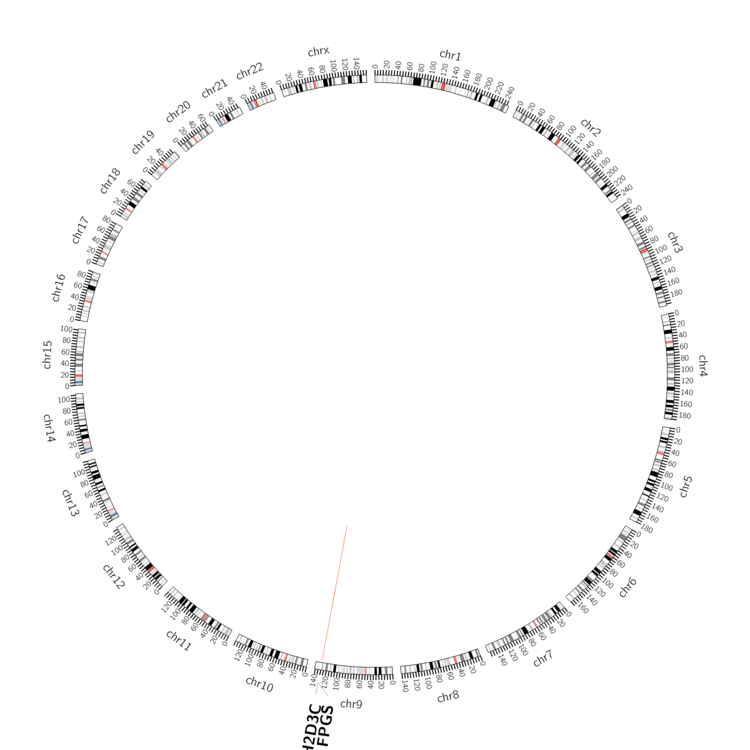 |
| - For Inter-chromosomal Variations |
| There's no inter-chromosomal structural variation. |
| - For Intra-chromosomal Variations |
| * Intra-chromosomal variantions includes 'intrachromosomal amplicon to amplicon', 'intrachromosomal amplicon to non-amplified dna', 'intrachromosomal deletion', 'intrachromosomal fold-back inversion', 'intrachromosomal inversion', 'intrachromosomal tandem duplication', 'Intrachromosomal unknown type', 'intrachromosomal with inverted orientation', 'intrachromosomal with non-inverted orientation'. |
 |
| Sample | Symbol_a | Chr_a | Start_a | End_a | Symbol_b | Chr_b | Start_b | End_b |
| ovary | FPGS | chr9 | 130569321 | 130569341 | SH2D3C | chr9 | 130537332 | 130537352 |
| cf) Tissue number; Tissue name (1;Breast, 2;Central_nervous_system, 3;Haematopoietic_and_lymphoid_tissue, 4;Large_intestine, 5;Liver, 6;Lung, 7;Ovary, 8;Pancreas, 9;Prostate, 10;Skin, 11;Soft_tissue, 12;Upper_aerodigestive_tract) |
| * From mRNA Sanger sequences, Chitars2.0 arranged chimeric transcripts. This table shows FPGS related fusion information. |
| ID | Head Gene | Tail Gene | Accession | Gene_a | qStart_a | qEnd_a | Chromosome_a | tStart_a | tEnd_a | Gene_a | qStart_a | qEnd_a | Chromosome_a | tStart_a | tEnd_a |
| BE514681 | COBL | 213 | 244 | 7 | 51336581 | 51336612 | FPGS | 242 | 481 | 9 | 130572003 | 130573276 | |
| CN275141 | FPGS | 51 | 150 | 9 | 130565894 | 130565993 | FPGS | 145 | 581 | 9 | 130565673 | 130566264 | |
| BF772512 | FPGS | 5 | 103 | 9 | 130569942 | 130570585 | FPGS | 100 | 270 | 9 | 130566642 | 130566979 | |
| Top |
| There's no copy number variation information in COSMIC data for this gene. |
| Top |
|
 |
| Top |
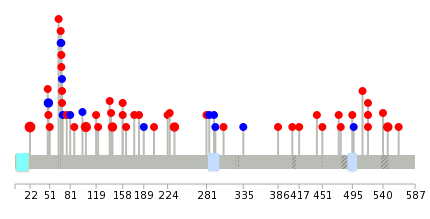
| Stat. for Non-Synonymous SNVs (# total SNVs=40) | (# total SNVs=9) |
 |  |
(# total SNVs=0) | (# total SNVs=0) |
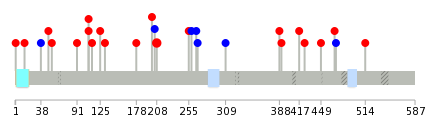
| Top |
| * When you move the cursor on each content, you can see more deailed mutation information on the Tooltip. Those are primary_site,primary_histology,mutation(aa),pubmedID. |
| GRCh37 position | Mutation(aa) | Unique sampleID count |
| chr9:130565267-130565267 | p.I22V | 4 |
| chr9:130566821-130566821 | p.T104M | 3 |
| chr9:130575758-130575758 | p.H547D | 2 |
| chr9:130569923-130569923 | p.D234N | 2 |
| chr9:130569293-130569293 | p.N143S | 2 |
| chr9:130575672-130575672 | p.S518I | 2 |
| chr9:130566572-130566572 | p.V49V | 2 |
| chr9:130573264-130573264 | p.T443K | 1 |
| chr9:130566632-130566632 | p.R69R | 1 |
| chr9:130569287-130569287 | p.R141H | 1 |
| Top |
|
 |
| Point Mutation/ Tissue ID | 1 | 2 | 3 | 4 | 5 | 6 | 7 | 8 | 9 | 10 | 11 | 12 | 13 | 14 | 15 | 16 | 17 | 18 | 19 | 20 |
| # sample | 1 | 1 | 5 | 3 | 1 | 3 | 1 | 2 | 1 | 2 | 2 | 6 | ||||||||
| # mutation | 1 | 1 | 5 | 3 | 1 | 3 | 1 | 2 | 1 | 2 | 2 | 6 | ||||||||
| nonsynonymous SNV | 1 | 1 | 3 | 1 | 1 | 3 | 1 | 2 | 1 | 2 | 1 | 5 | ||||||||
| synonymous SNV | 2 | 2 | 1 | 1 |
| cf) Tissue ID; Tissue type (1; BLCA[Bladder Urothelial Carcinoma], 2; BRCA[Breast invasive carcinoma], 3; CESC[Cervical squamous cell carcinoma and endocervical adenocarcinoma], 4; COAD[Colon adenocarcinoma], 5; GBM[Glioblastoma multiforme], 6; Glioma Low Grade, 7; HNSC[Head and Neck squamous cell carcinoma], 8; KICH[Kidney Chromophobe], 9; KIRC[Kidney renal clear cell carcinoma], 10; KIRP[Kidney renal papillary cell carcinoma], 11; LAML[Acute Myeloid Leukemia], 12; LUAD[Lung adenocarcinoma], 13; LUSC[Lung squamous cell carcinoma], 14; OV[Ovarian serous cystadenocarcinoma ], 15; PAAD[Pancreatic adenocarcinoma], 16; PRAD[Prostate adenocarcinoma], 17; SKCM[Skin Cutaneous Melanoma], 18:STAD[Stomach adenocarcinoma], 19:THCA[Thyroid carcinoma], 20:UCEC[Uterine Corpus Endometrial Carcinoma]) |
| Top |
| * We represented just top 10 SNVs. When you move the cursor on each content, you can see more deailed mutation information on the Tooltip. Those are primary_site, primary_histology, mutation(aa), pubmedID. |
| Genomic Position | Mutation(aa) | Unique sampleID count |
| chr9:130569923 | p.D208N,FPGS | 2 |
| chr9:130575602 | p.L205L,FPGS | 1 |
| chr9:130566821 | p.P255L,FPGS | 1 |
| chr9:130570856 | p.V49M,FPGS | 1 |
| chr9:130575610 | p.A259A,FPGS | 1 |
| chr9:130569287 | p.M1T,FPGS | 1 |
| chr9:130570869 | p.P266P,FPGS | 1 |
| chr9:130575737 | p.Q14R,FPGS | 1 |
| chr9:130569337 | p.T268T,FPGS | 1 |
| chr9:130570890 | p.L38L,FPGS | 1 |
| * Copy number data were extracted from TCGA using R package TCGA-Assembler. The URLs of all public data files on TCGA DCC data server were gathered on Jan-05-2015. Function ProcessCNAData in TCGA-Assembler package was used to obtain gene-level copy number value which is calculated as the average copy number of the genomic region of a gene. |
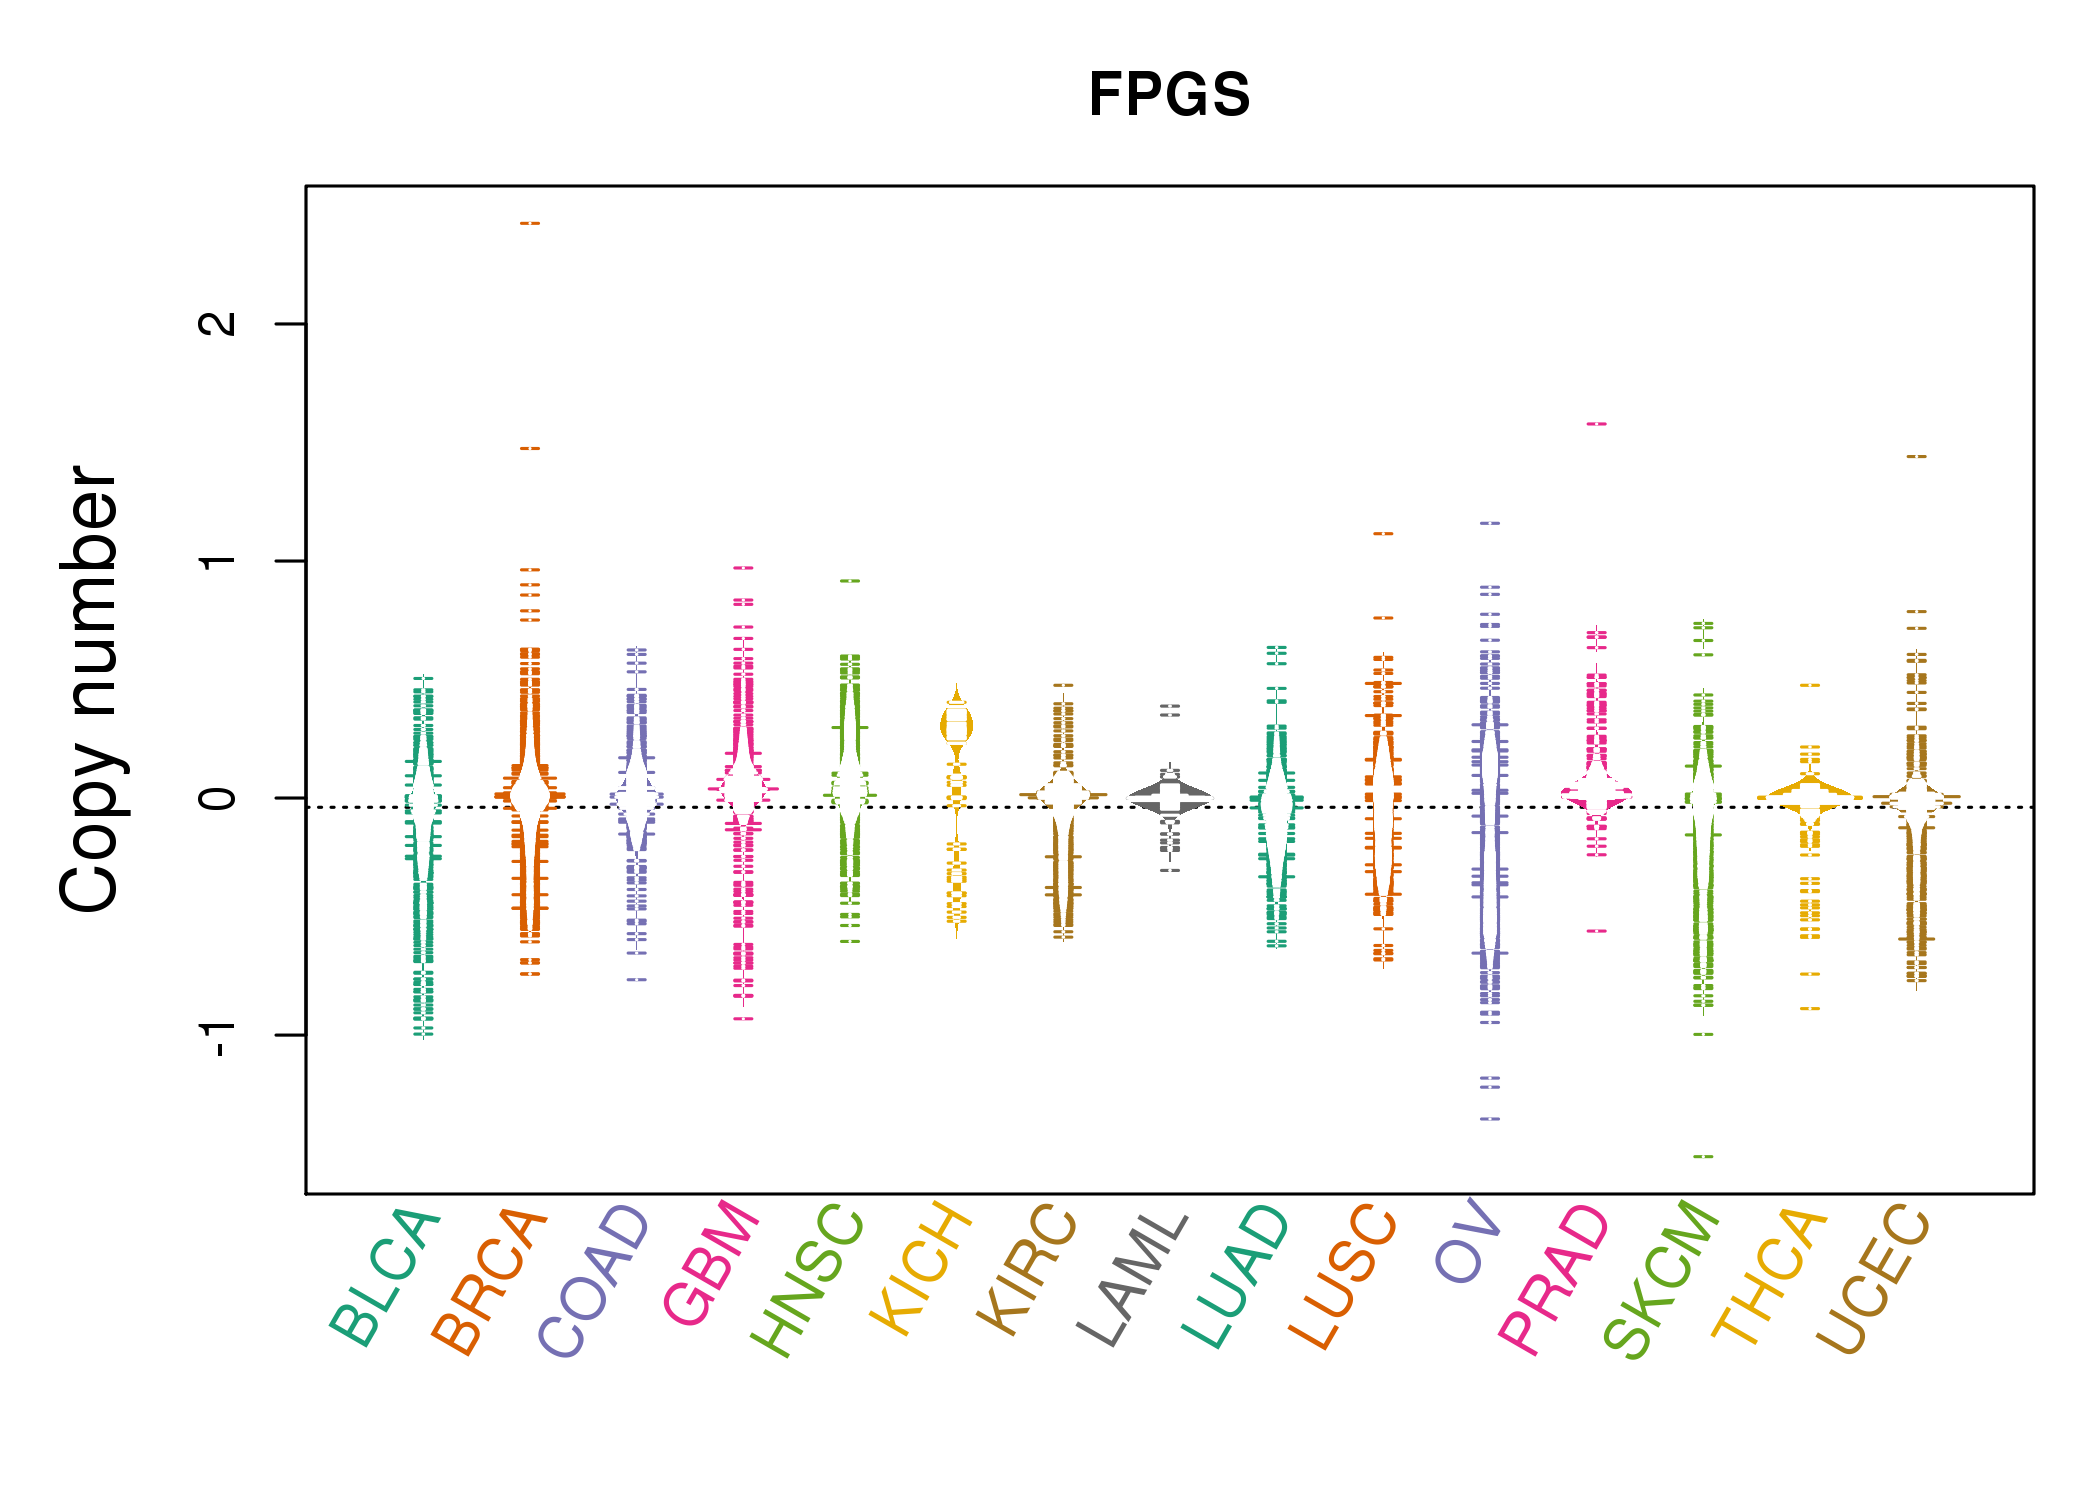 |
| cf) Tissue ID[Tissue type]: BLCA[Bladder Urothelial Carcinoma], BRCA[Breast invasive carcinoma], CESC[Cervical squamous cell carcinoma and endocervical adenocarcinoma], COAD[Colon adenocarcinoma], GBM[Glioblastoma multiforme], Glioma Low Grade, HNSC[Head and Neck squamous cell carcinoma], KICH[Kidney Chromophobe], KIRC[Kidney renal clear cell carcinoma], KIRP[Kidney renal papillary cell carcinoma], LAML[Acute Myeloid Leukemia], LUAD[Lung adenocarcinoma], LUSC[Lung squamous cell carcinoma], OV[Ovarian serous cystadenocarcinoma ], PAAD[Pancreatic adenocarcinoma], PRAD[Prostate adenocarcinoma], SKCM[Skin Cutaneous Melanoma], STAD[Stomach adenocarcinoma], THCA[Thyroid carcinoma], UCEC[Uterine Corpus Endometrial Carcinoma] |
| Top |
| Gene Expression for FPGS |
| * CCLE gene expression data were extracted from CCLE_Expression_Entrez_2012-10-18.res: Gene-centric RMA-normalized mRNA expression data. |
 |
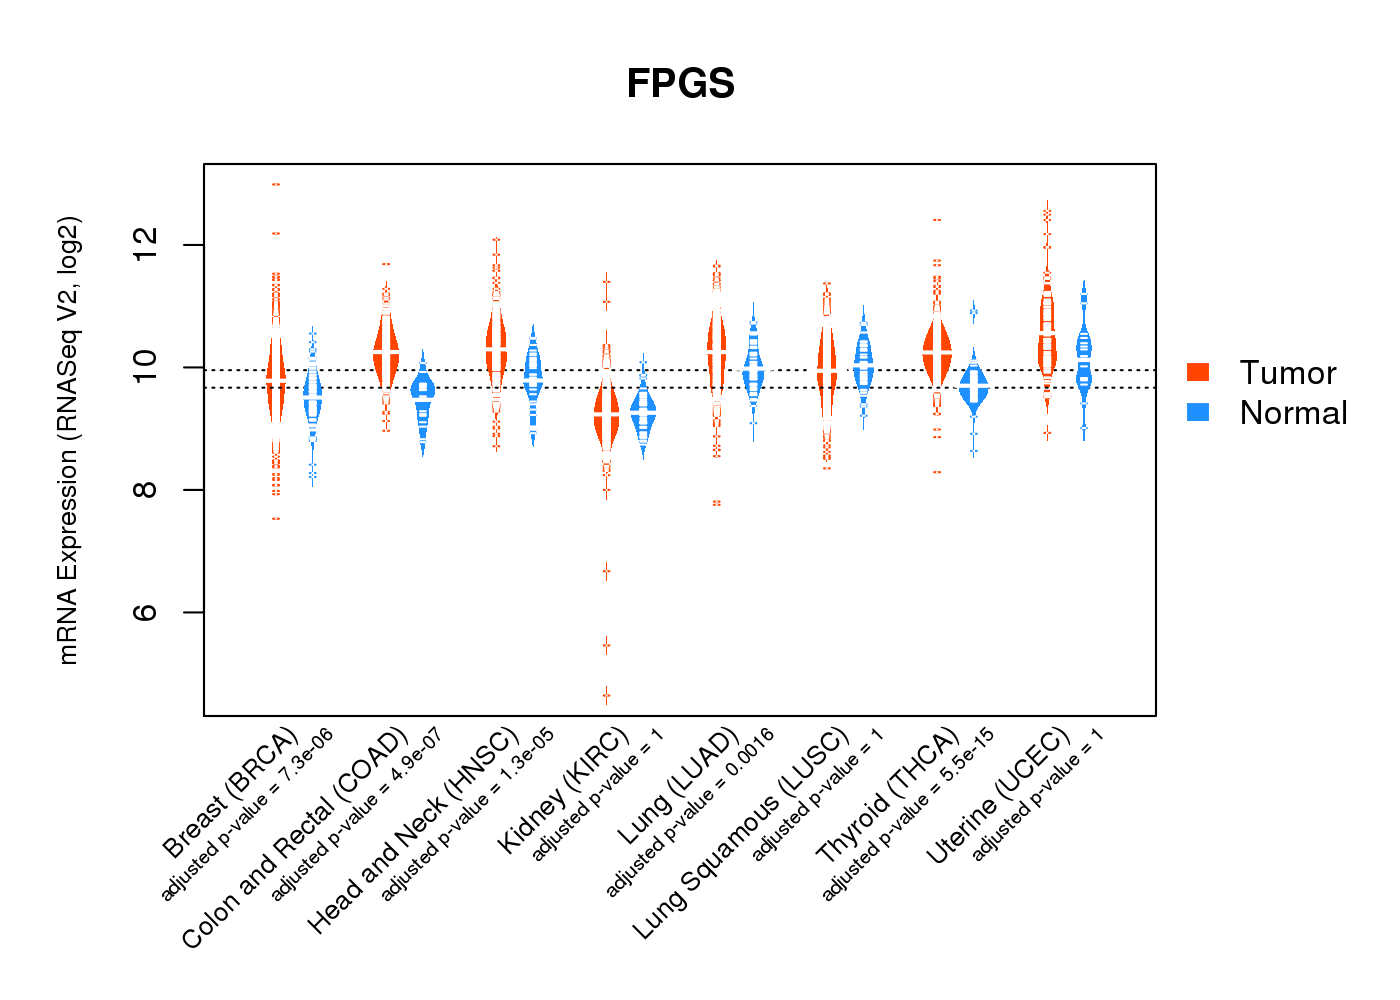
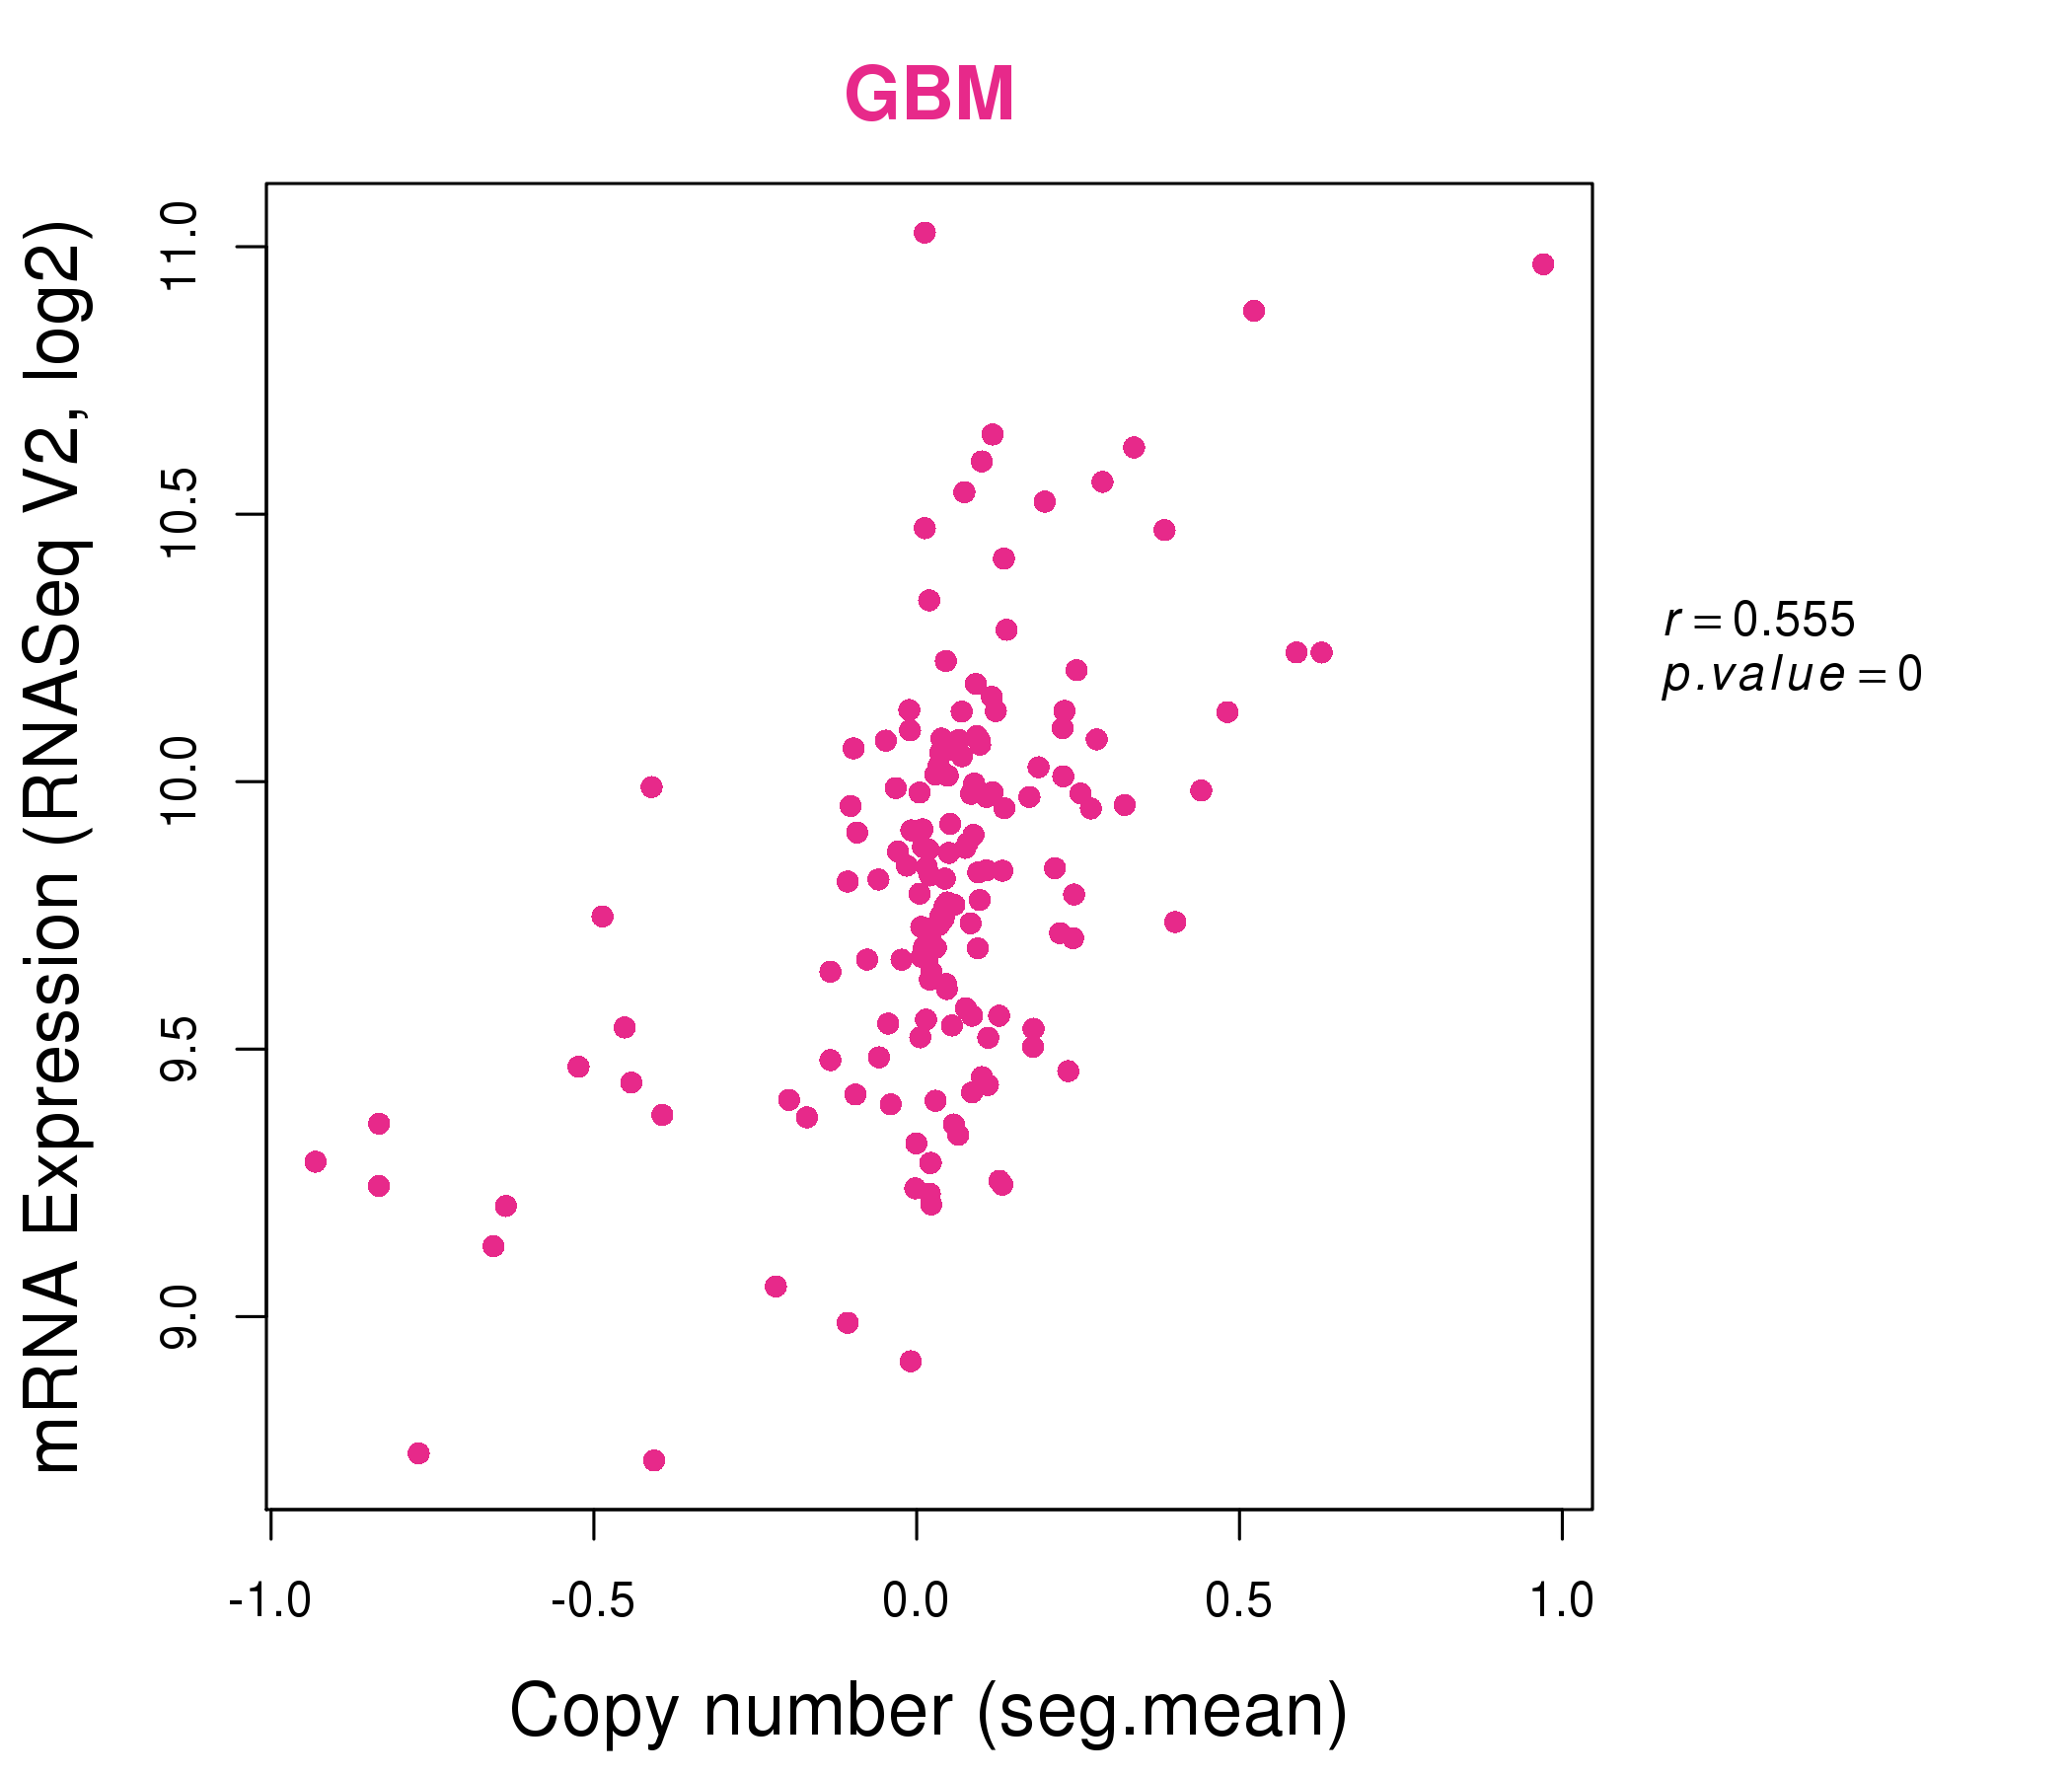
| * Normalized gene expression data of RNASeqV2 was extracted from TCGA using R package TCGA-Assembler. The URLs of all public data files on TCGA DCC data server were gathered at Jan-05-2015. Only eight cancer types have enough normal control samples for differential expression analysis. (t test, adjusted p<0.05 (using Benjamini-Hochberg FDR)) |
 |
| Top |
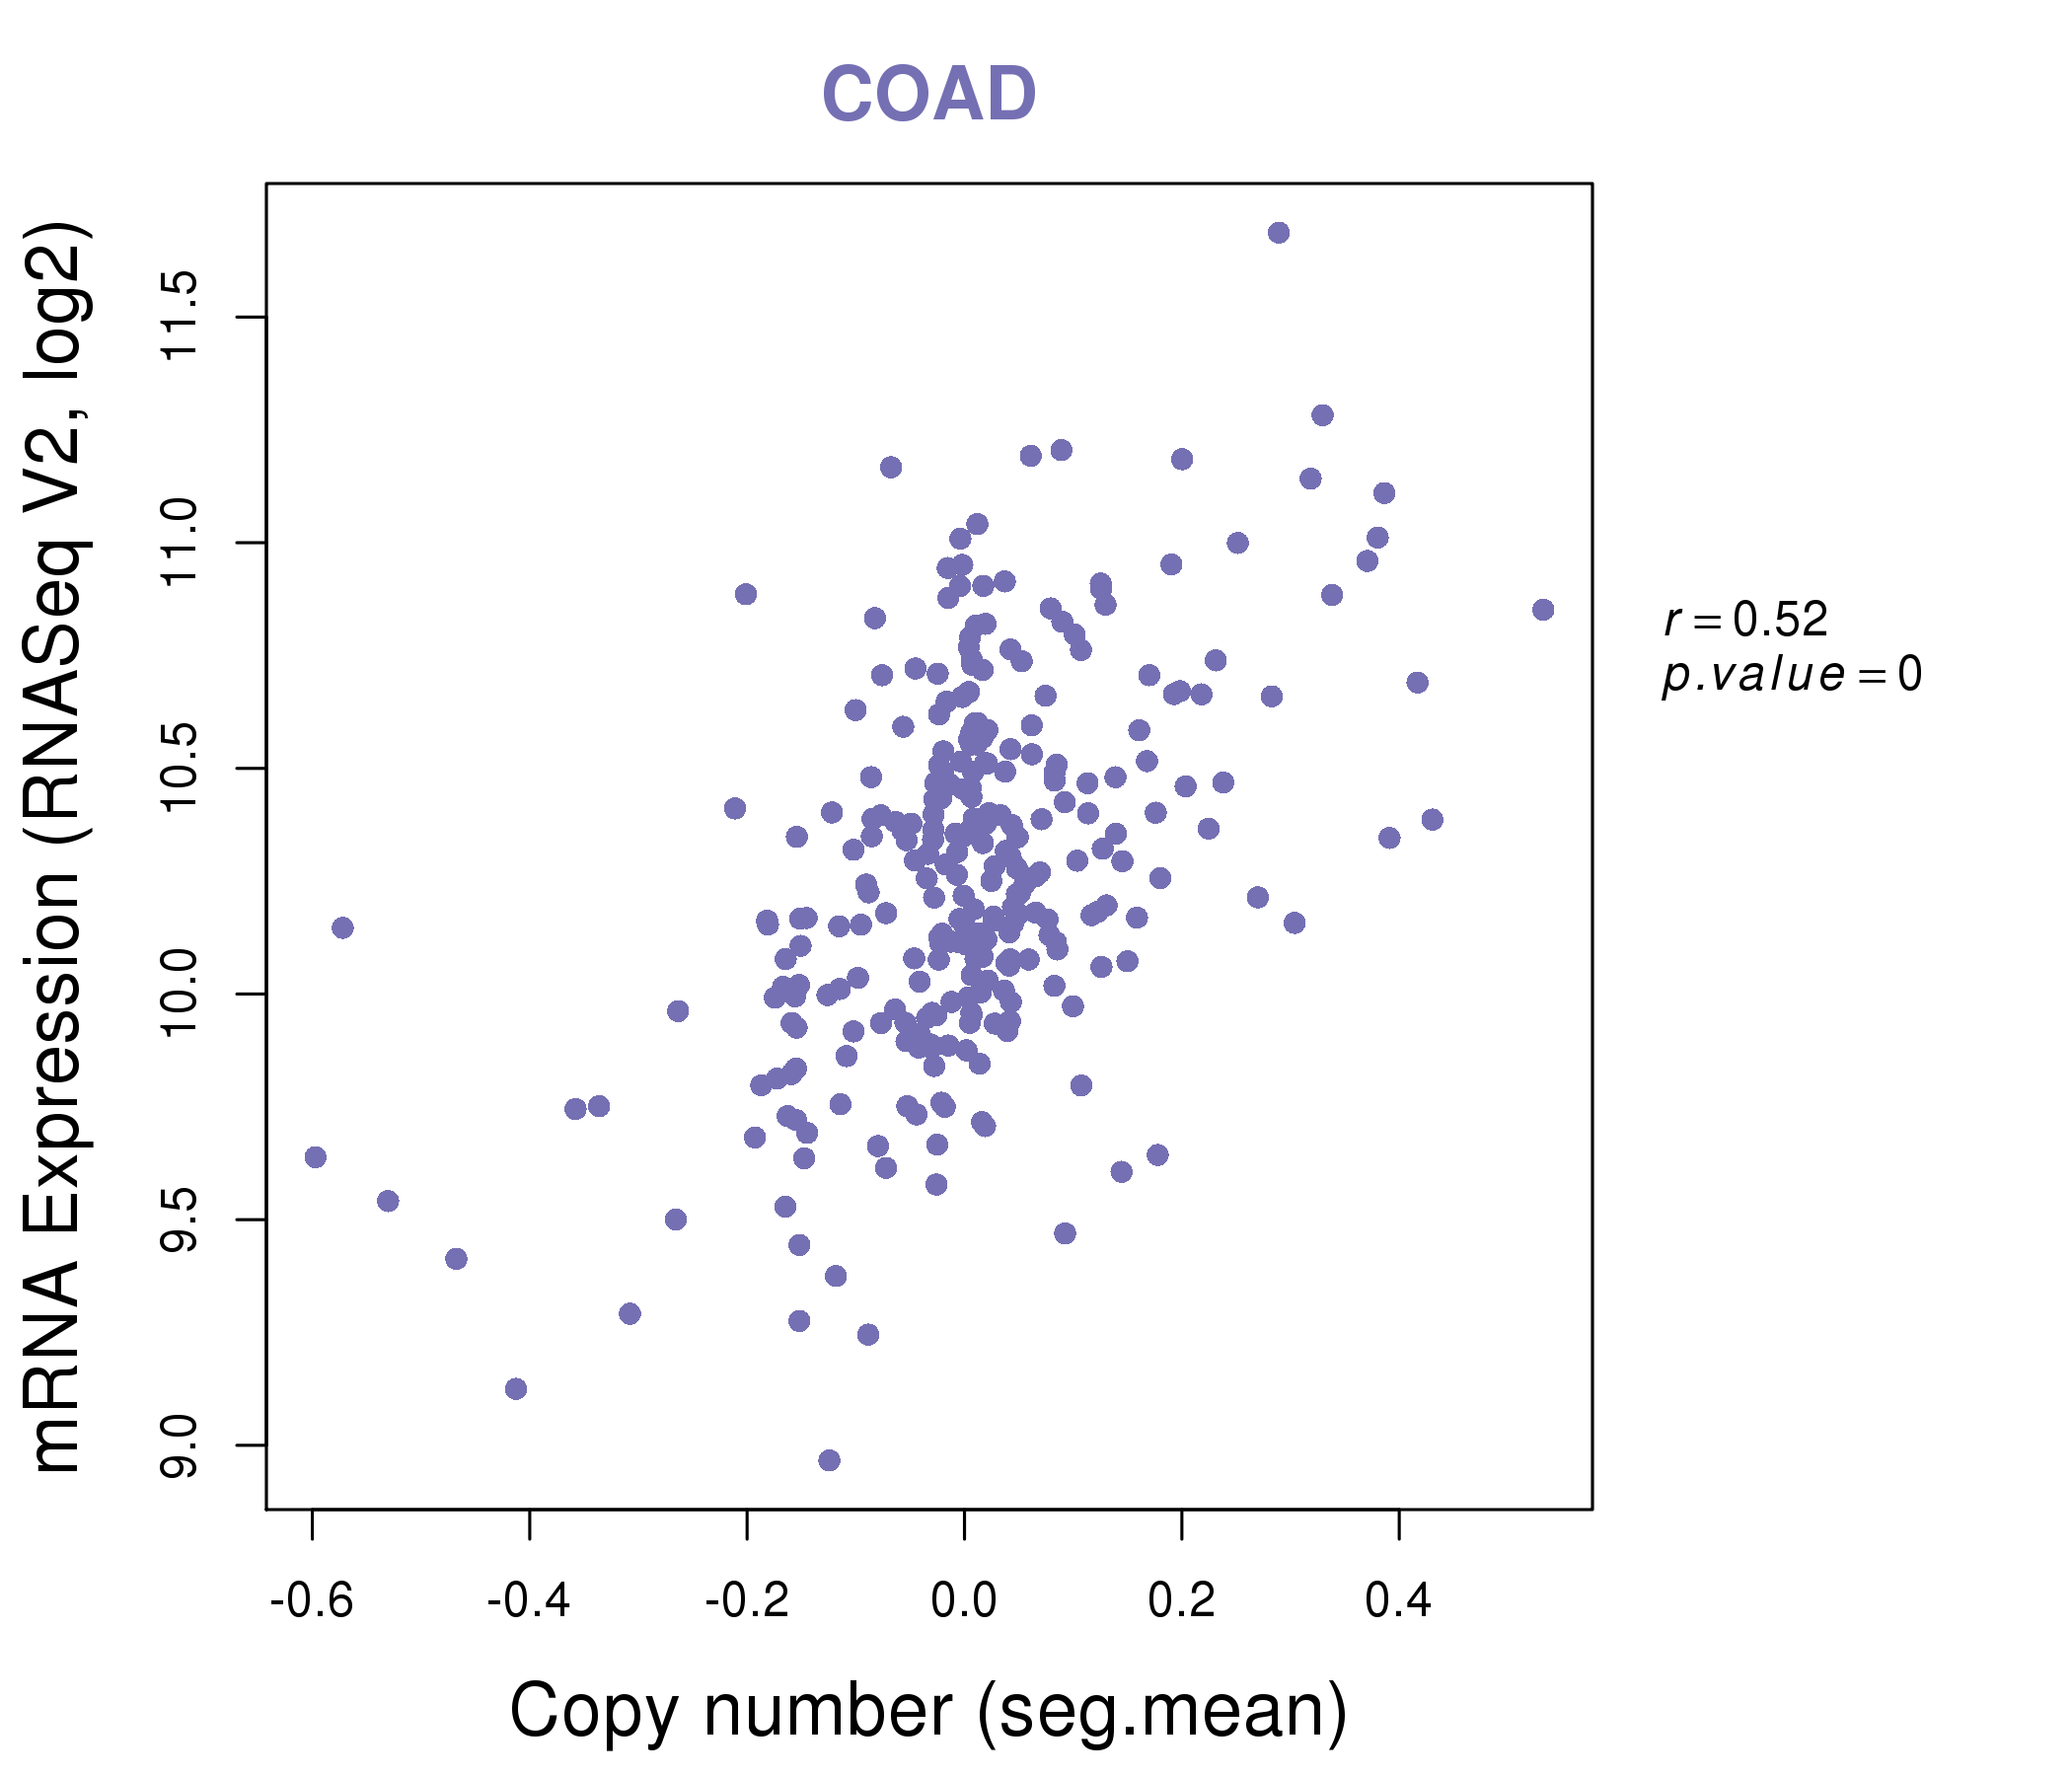
| * This plots show the correlation between CNV and gene expression. |
: Open all plots for all cancer types
 |
|
 |
|

| Top |
| Gene-Gene Network Information |
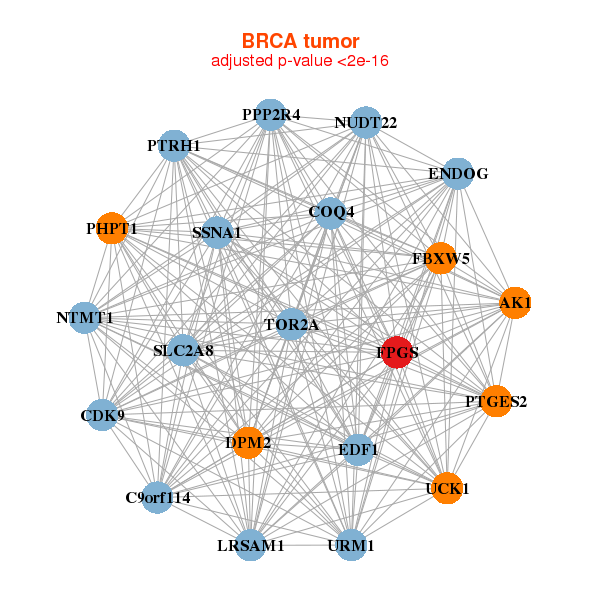
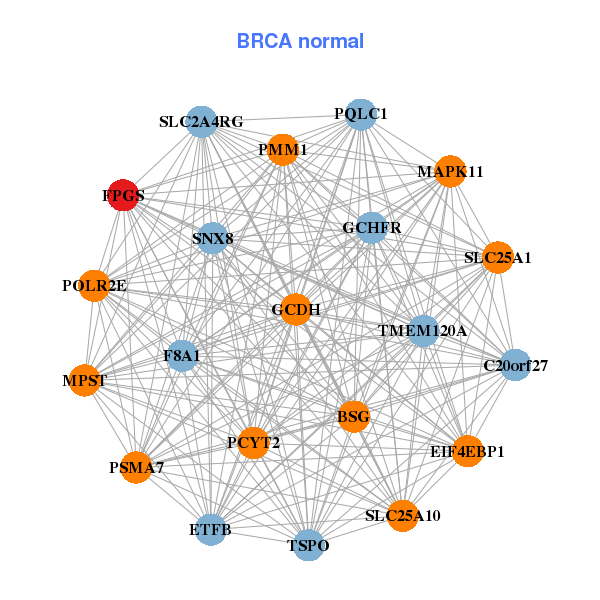
| * Co-Expression network figures were drawn using R package igraph. Only the top 20 genes with the highest correlations were shown. Red circle: input gene, orange circle: cell metabolism gene, sky circle: other gene |
: Open all plots for all cancer types
 |
| ||||
| AK1,C9orf114,CDK9,COQ4,DPM2,EDF1,ENDOG, FBXW5,FPGS,LRSAM1,NTMT1,NUDT22,PHPT1,PPP2R4, PTGES2,PTRH1,SLC2A8,SSNA1,TOR2A,UCK1,URM1 | BSG,C20orf27,EIF4EBP1,ETFB,F8A1,FPGS,GCDH, GCHFR,MAPK11,MPST,PCYT2,PMM1,POLR2E,PQLC1, PSMA7,SLC25A10,SLC25A1,SLC2A4RG,SNX8,TMEM120A,TSPO | ||||
 |
| ||||
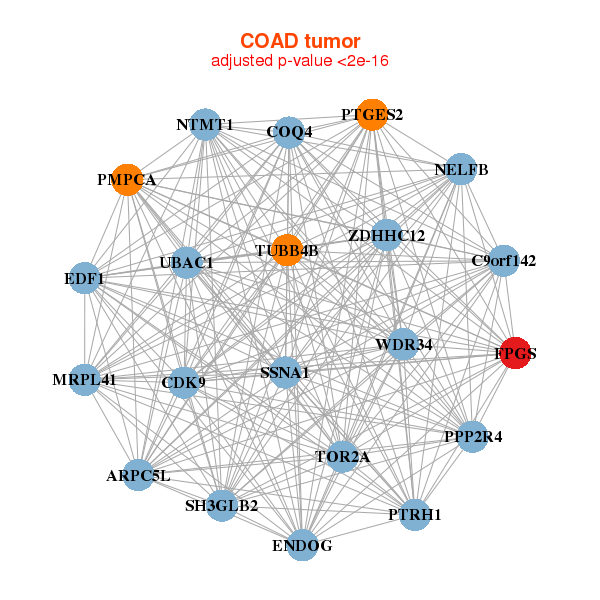
| ARPC5L,C9orf142,CDK9,NELFB,COQ4,EDF1,ENDOG, FPGS,NTMT1,MRPL41,PMPCA,PPP2R4,PTGES2,PTRH1, SH3GLB2,SSNA1,TOR2A,TUBB4B,UBAC1,WDR34,ZDHHC12 | C19orf10,DHRS13,FARSA,FPGS,HMBS,METTL1,MRPL4, MTX1,NUDT8,NUP85,PDF,PMM2,PPIB,PUSL1, PYCR1,PYCRL,RRP9,RUVBL2,ALYREF,THOC6,TSFM |
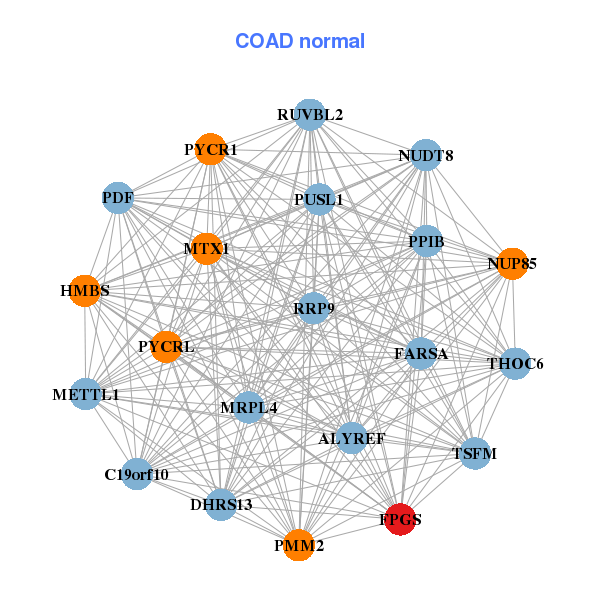
| * Co-Expression network figures were drawn using R package igraph. Only the top 20 genes with the highest correlations were shown. Red circle: input gene, orange circle: cell metabolism gene, sky circle: other gene |
: Open all plots for all cancer types
| Top |
: Open all interacting genes' information including KEGG pathway for all interacting genes from DAVID
| Top |
| Pharmacological Information for FPGS |
| DB Category | DB Name | DB's ID and Url link |
| * Gene Centered Interaction Network. |
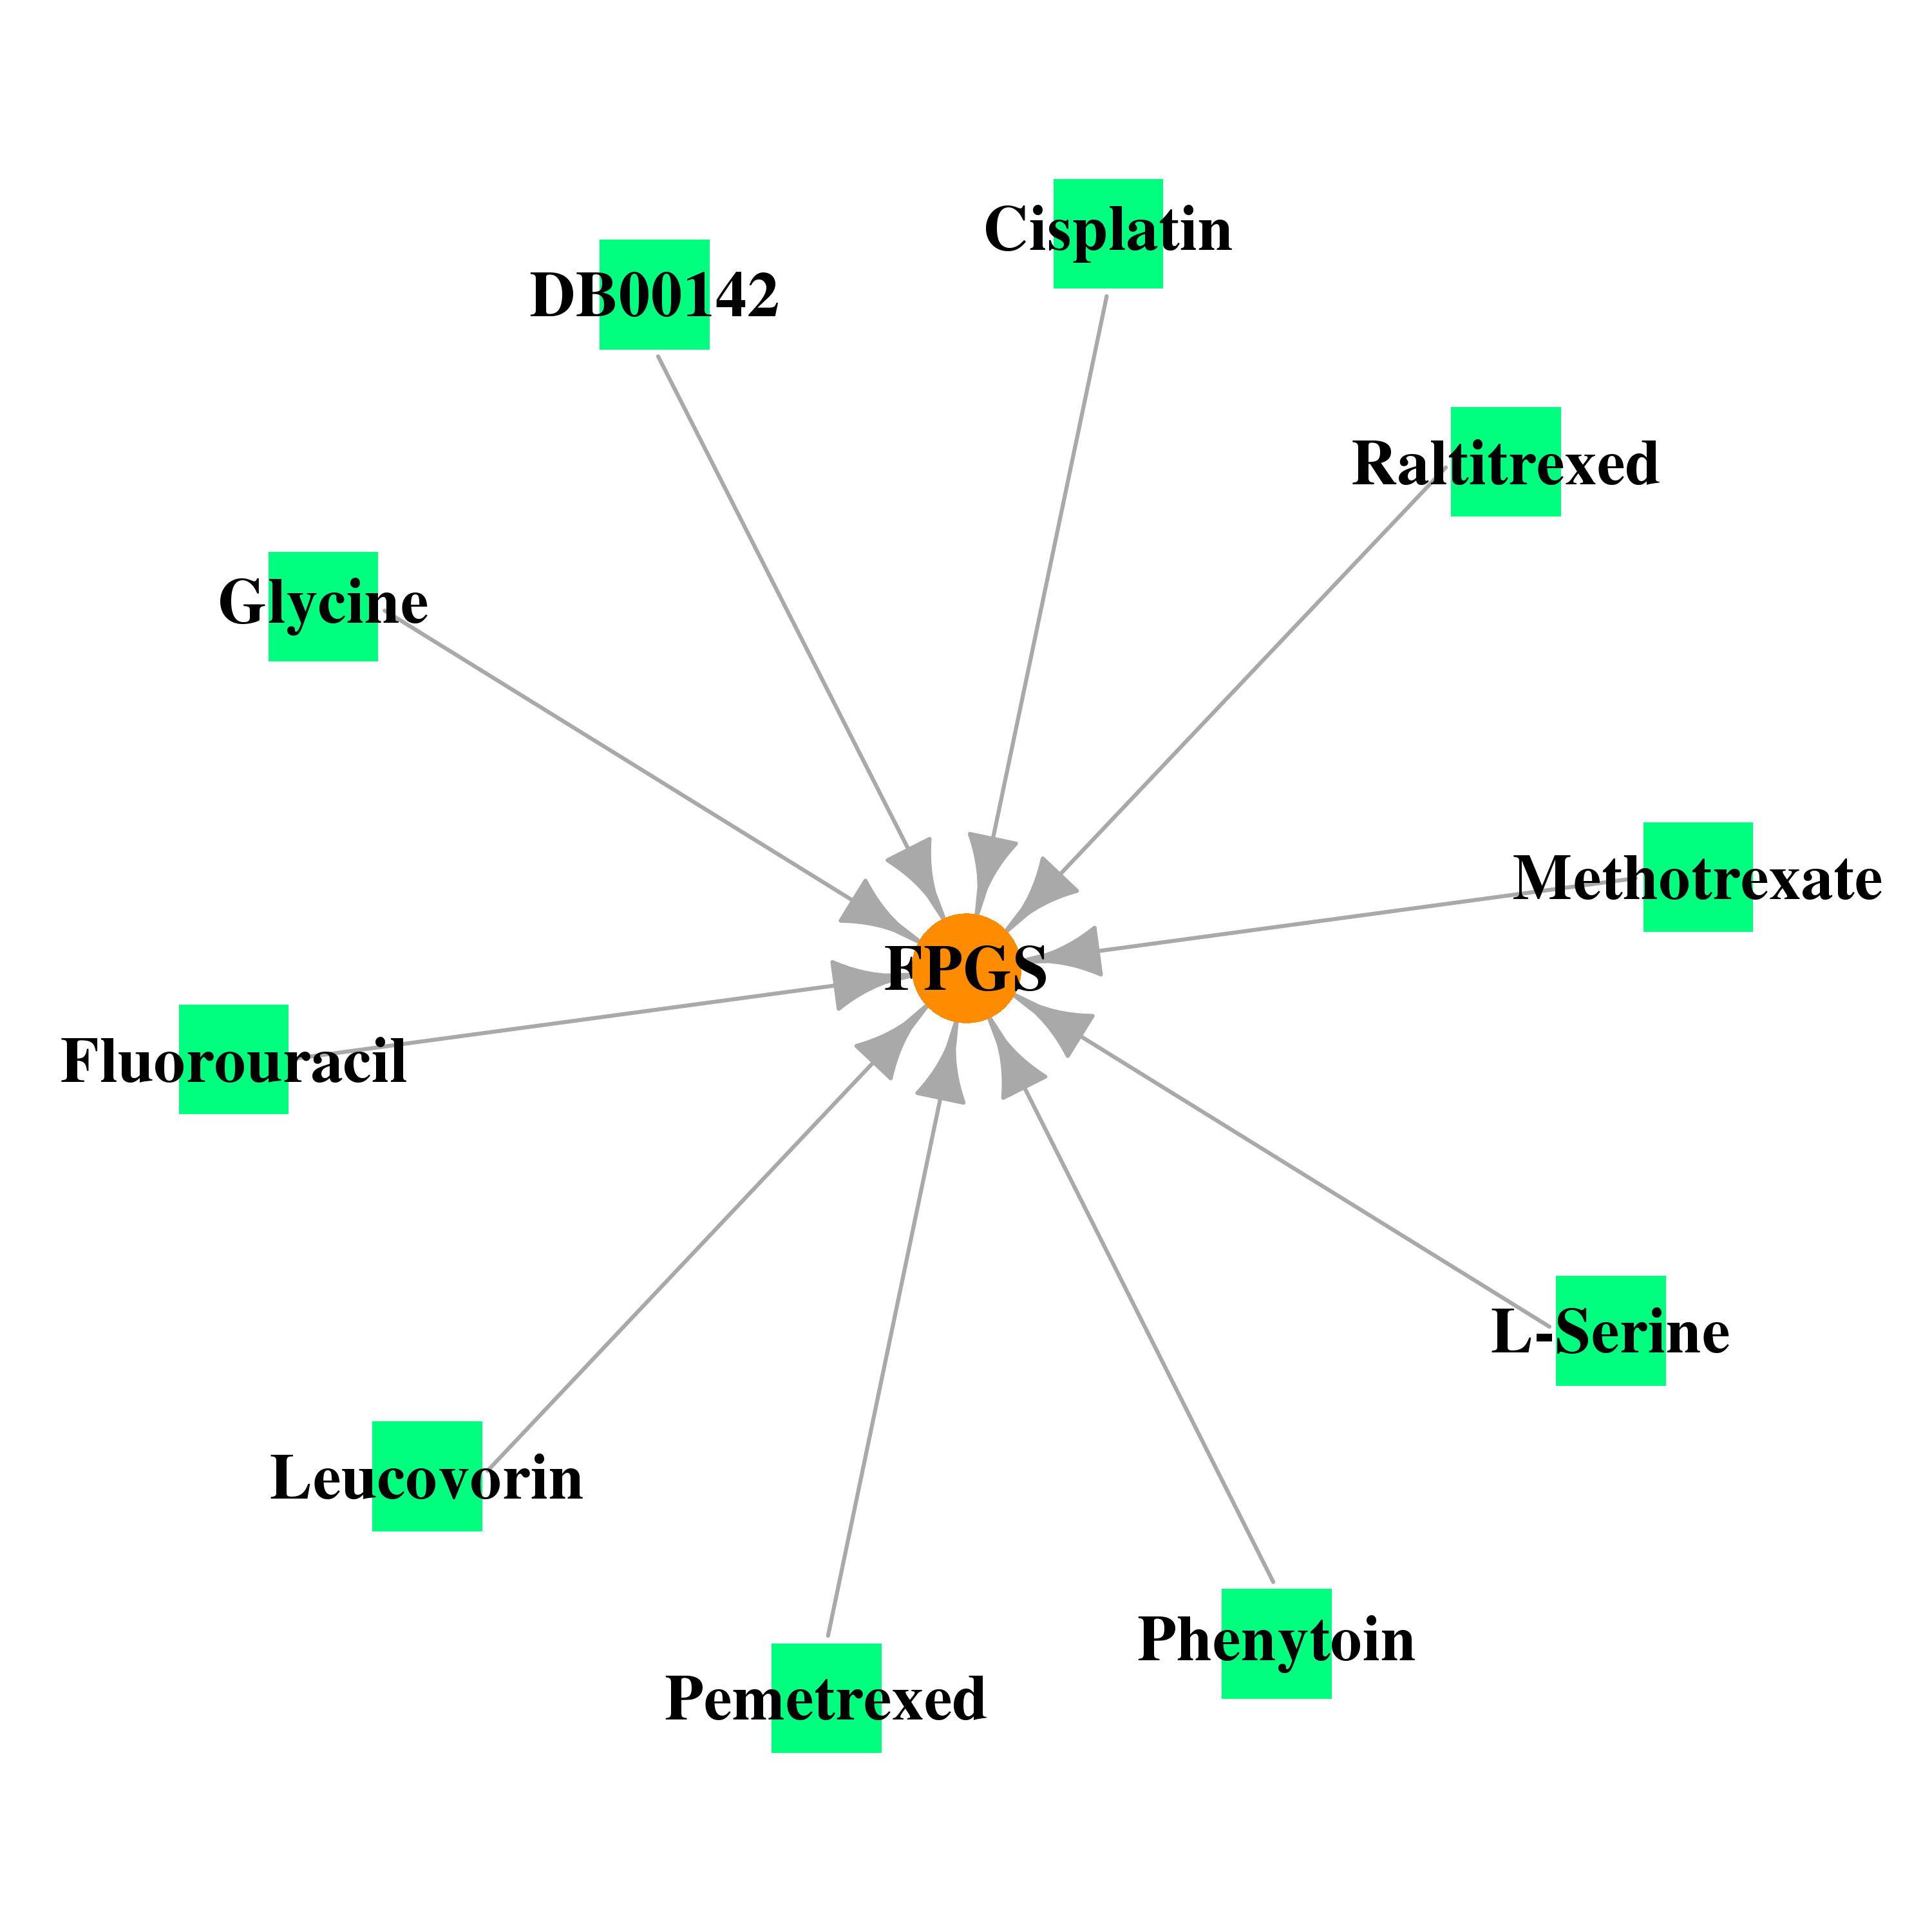 |
| * Drug Centered Interaction Network. |
| DrugBank ID | Target Name | Drug Groups | Generic Name | Drug Centered Network | Drug Structure |
| DB00142 | folylpolyglutamate synthase | approved; nutraceutical | L-Glutamic Acid | 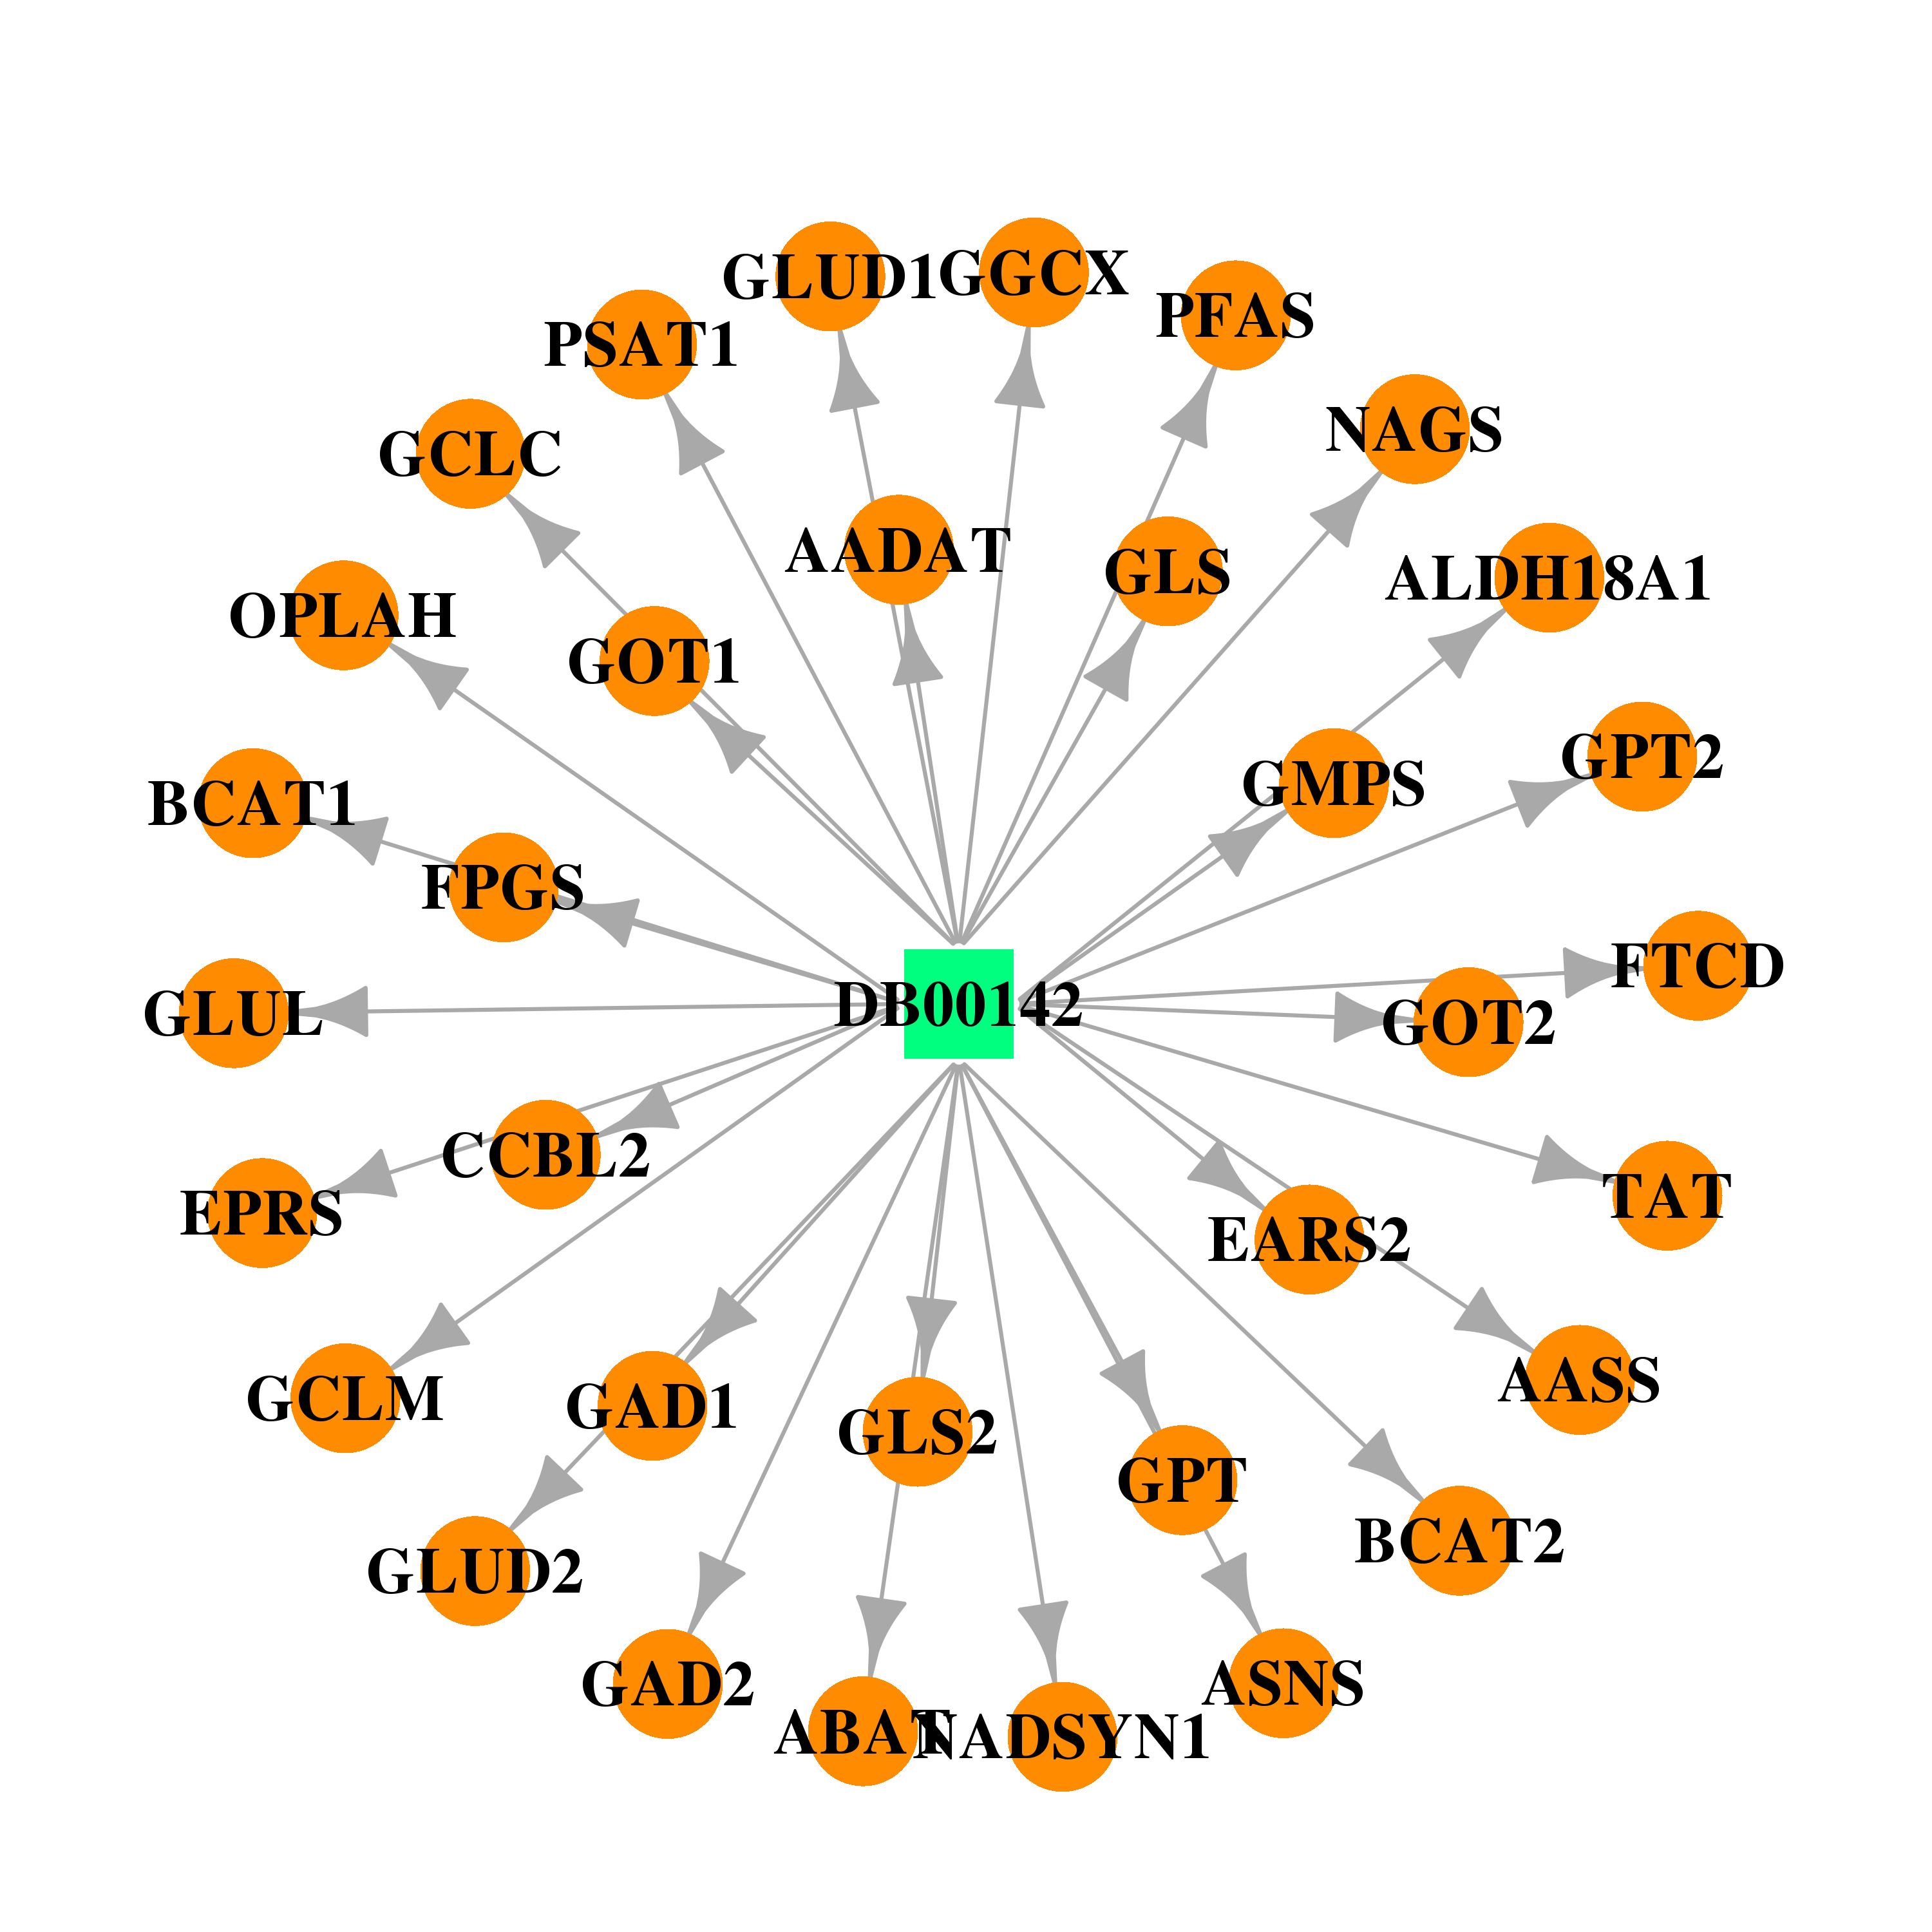 | 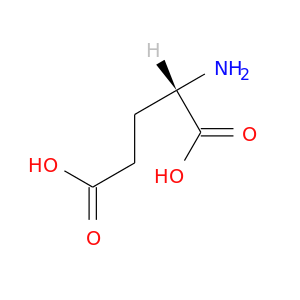 |
| DB00293 | folylpolyglutamate synthase | approved; investigational | Raltitrexed | 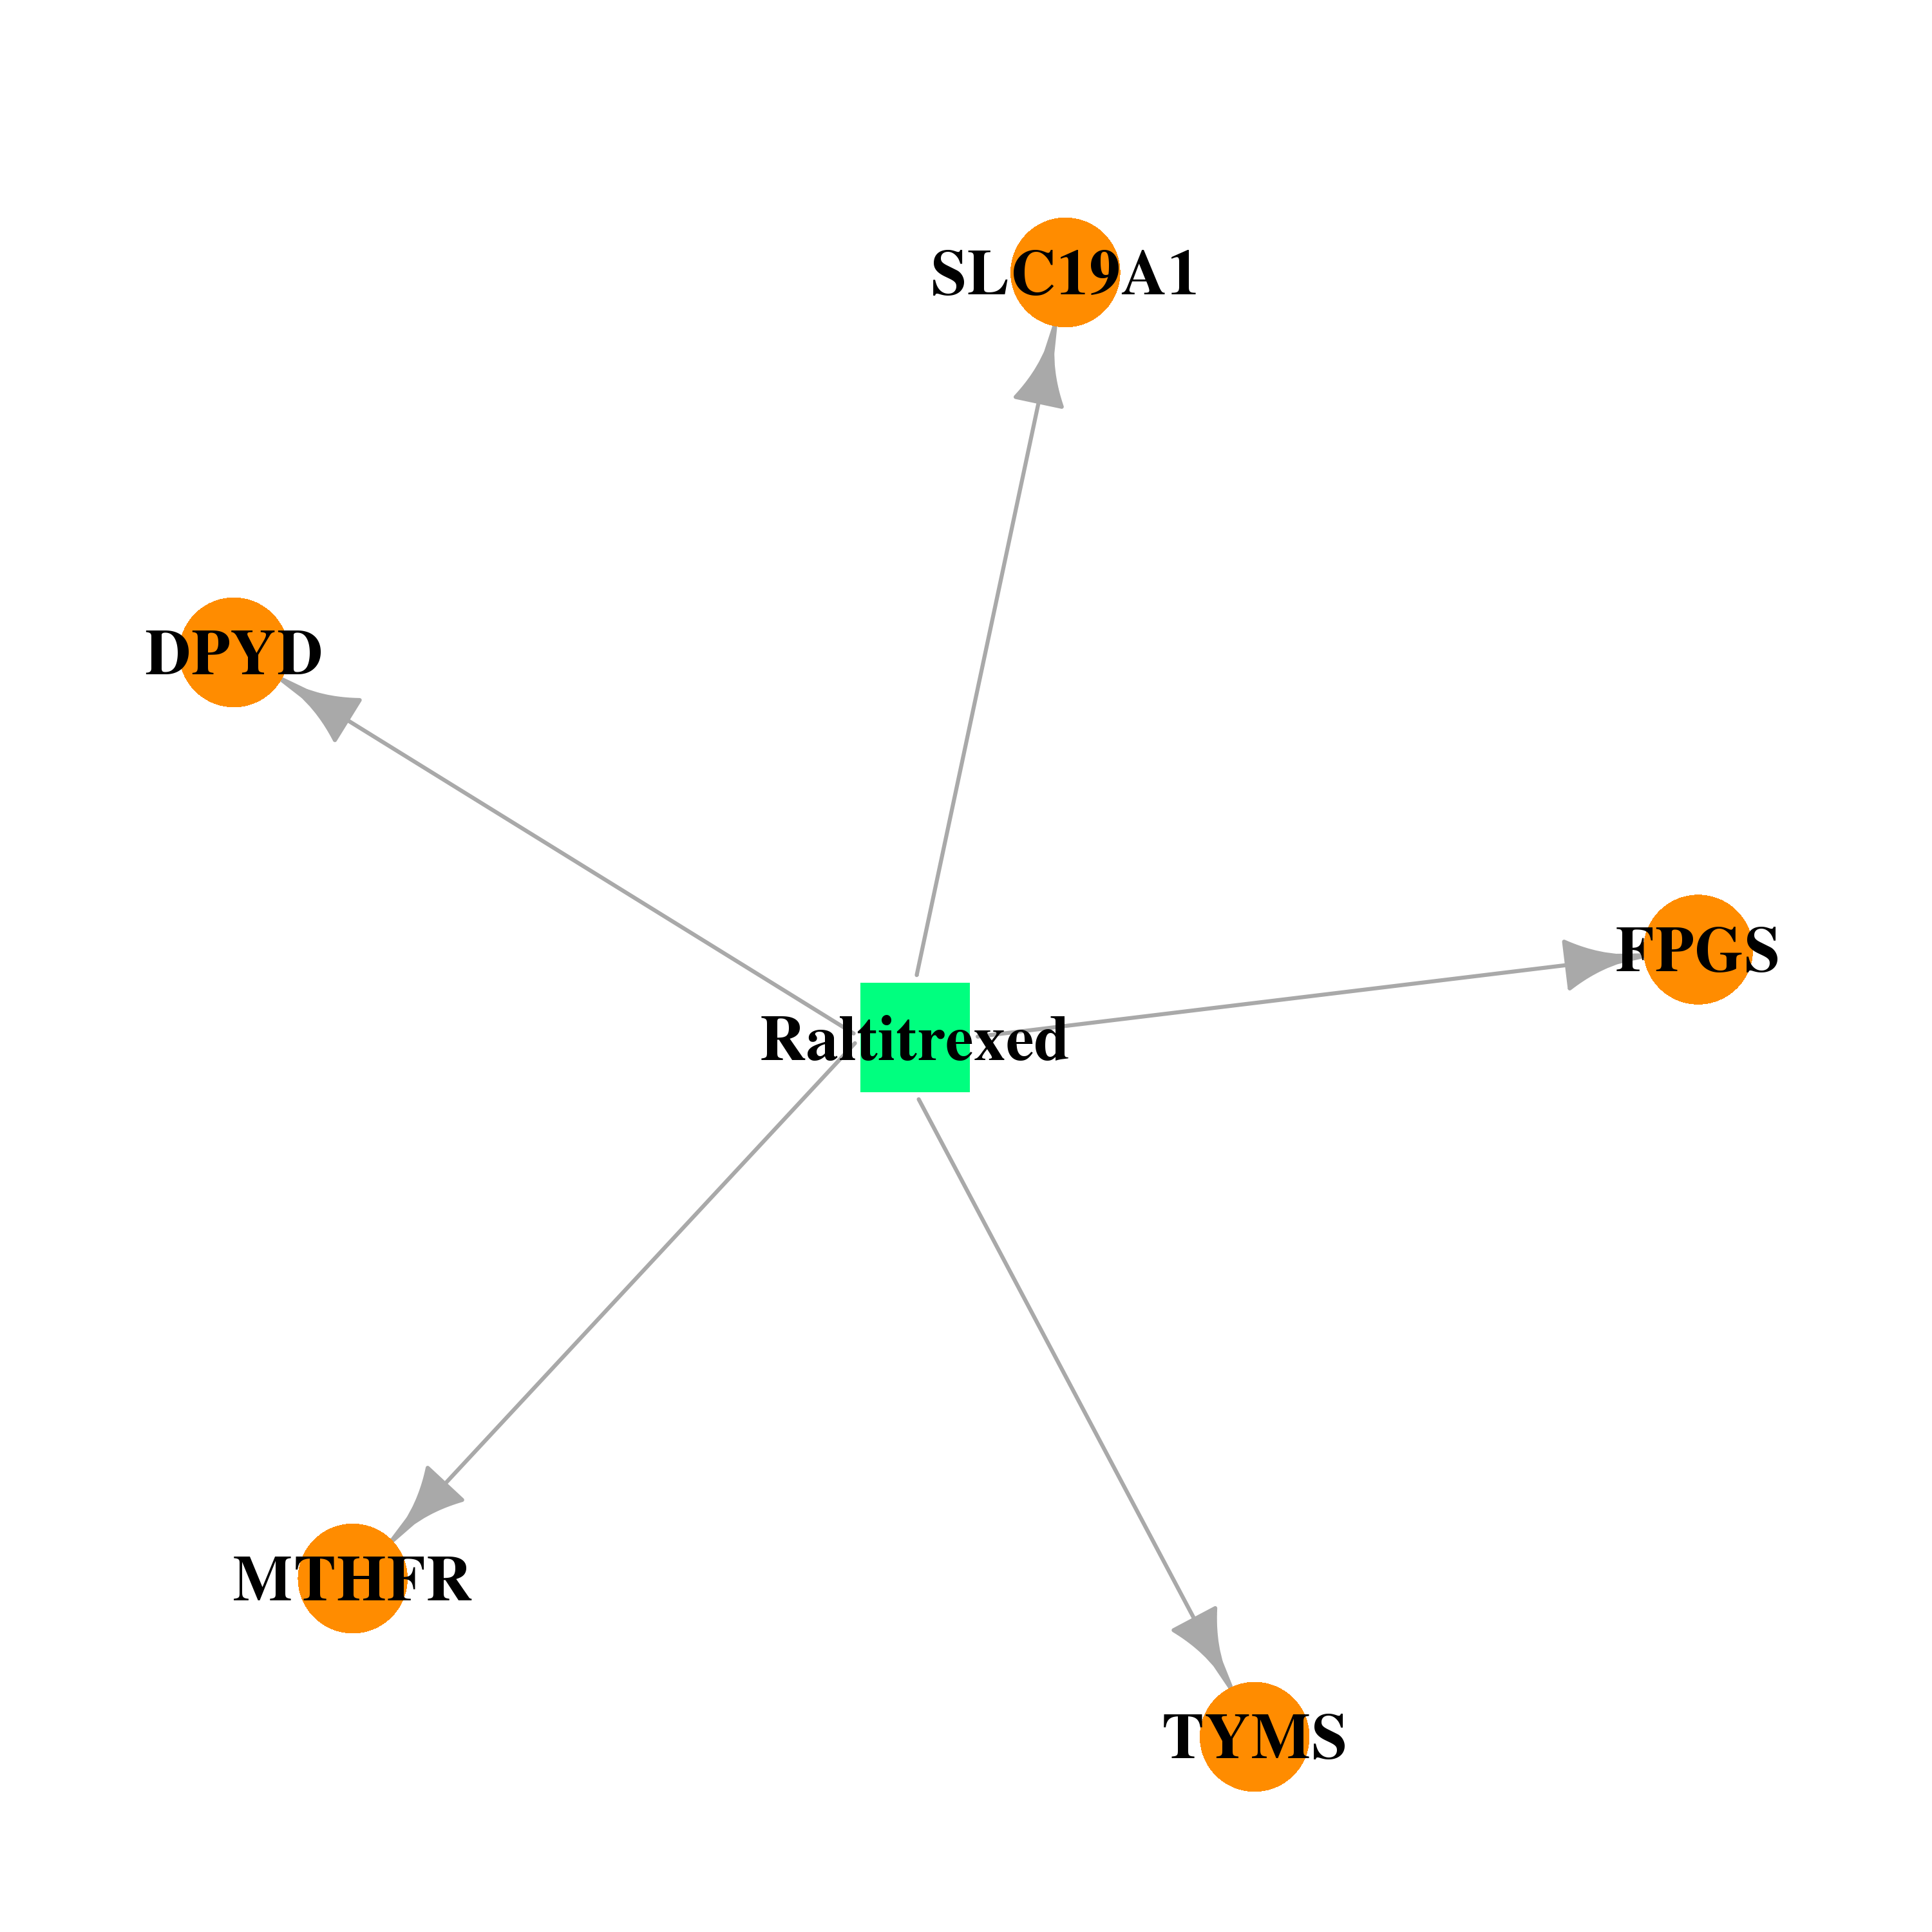 | 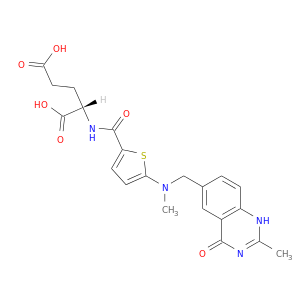 |
| DB00544 | folylpolyglutamate synthase | approved | Fluorouracil |  |  |
| DB00650 | folylpolyglutamate synthase | approved | Leucovorin | 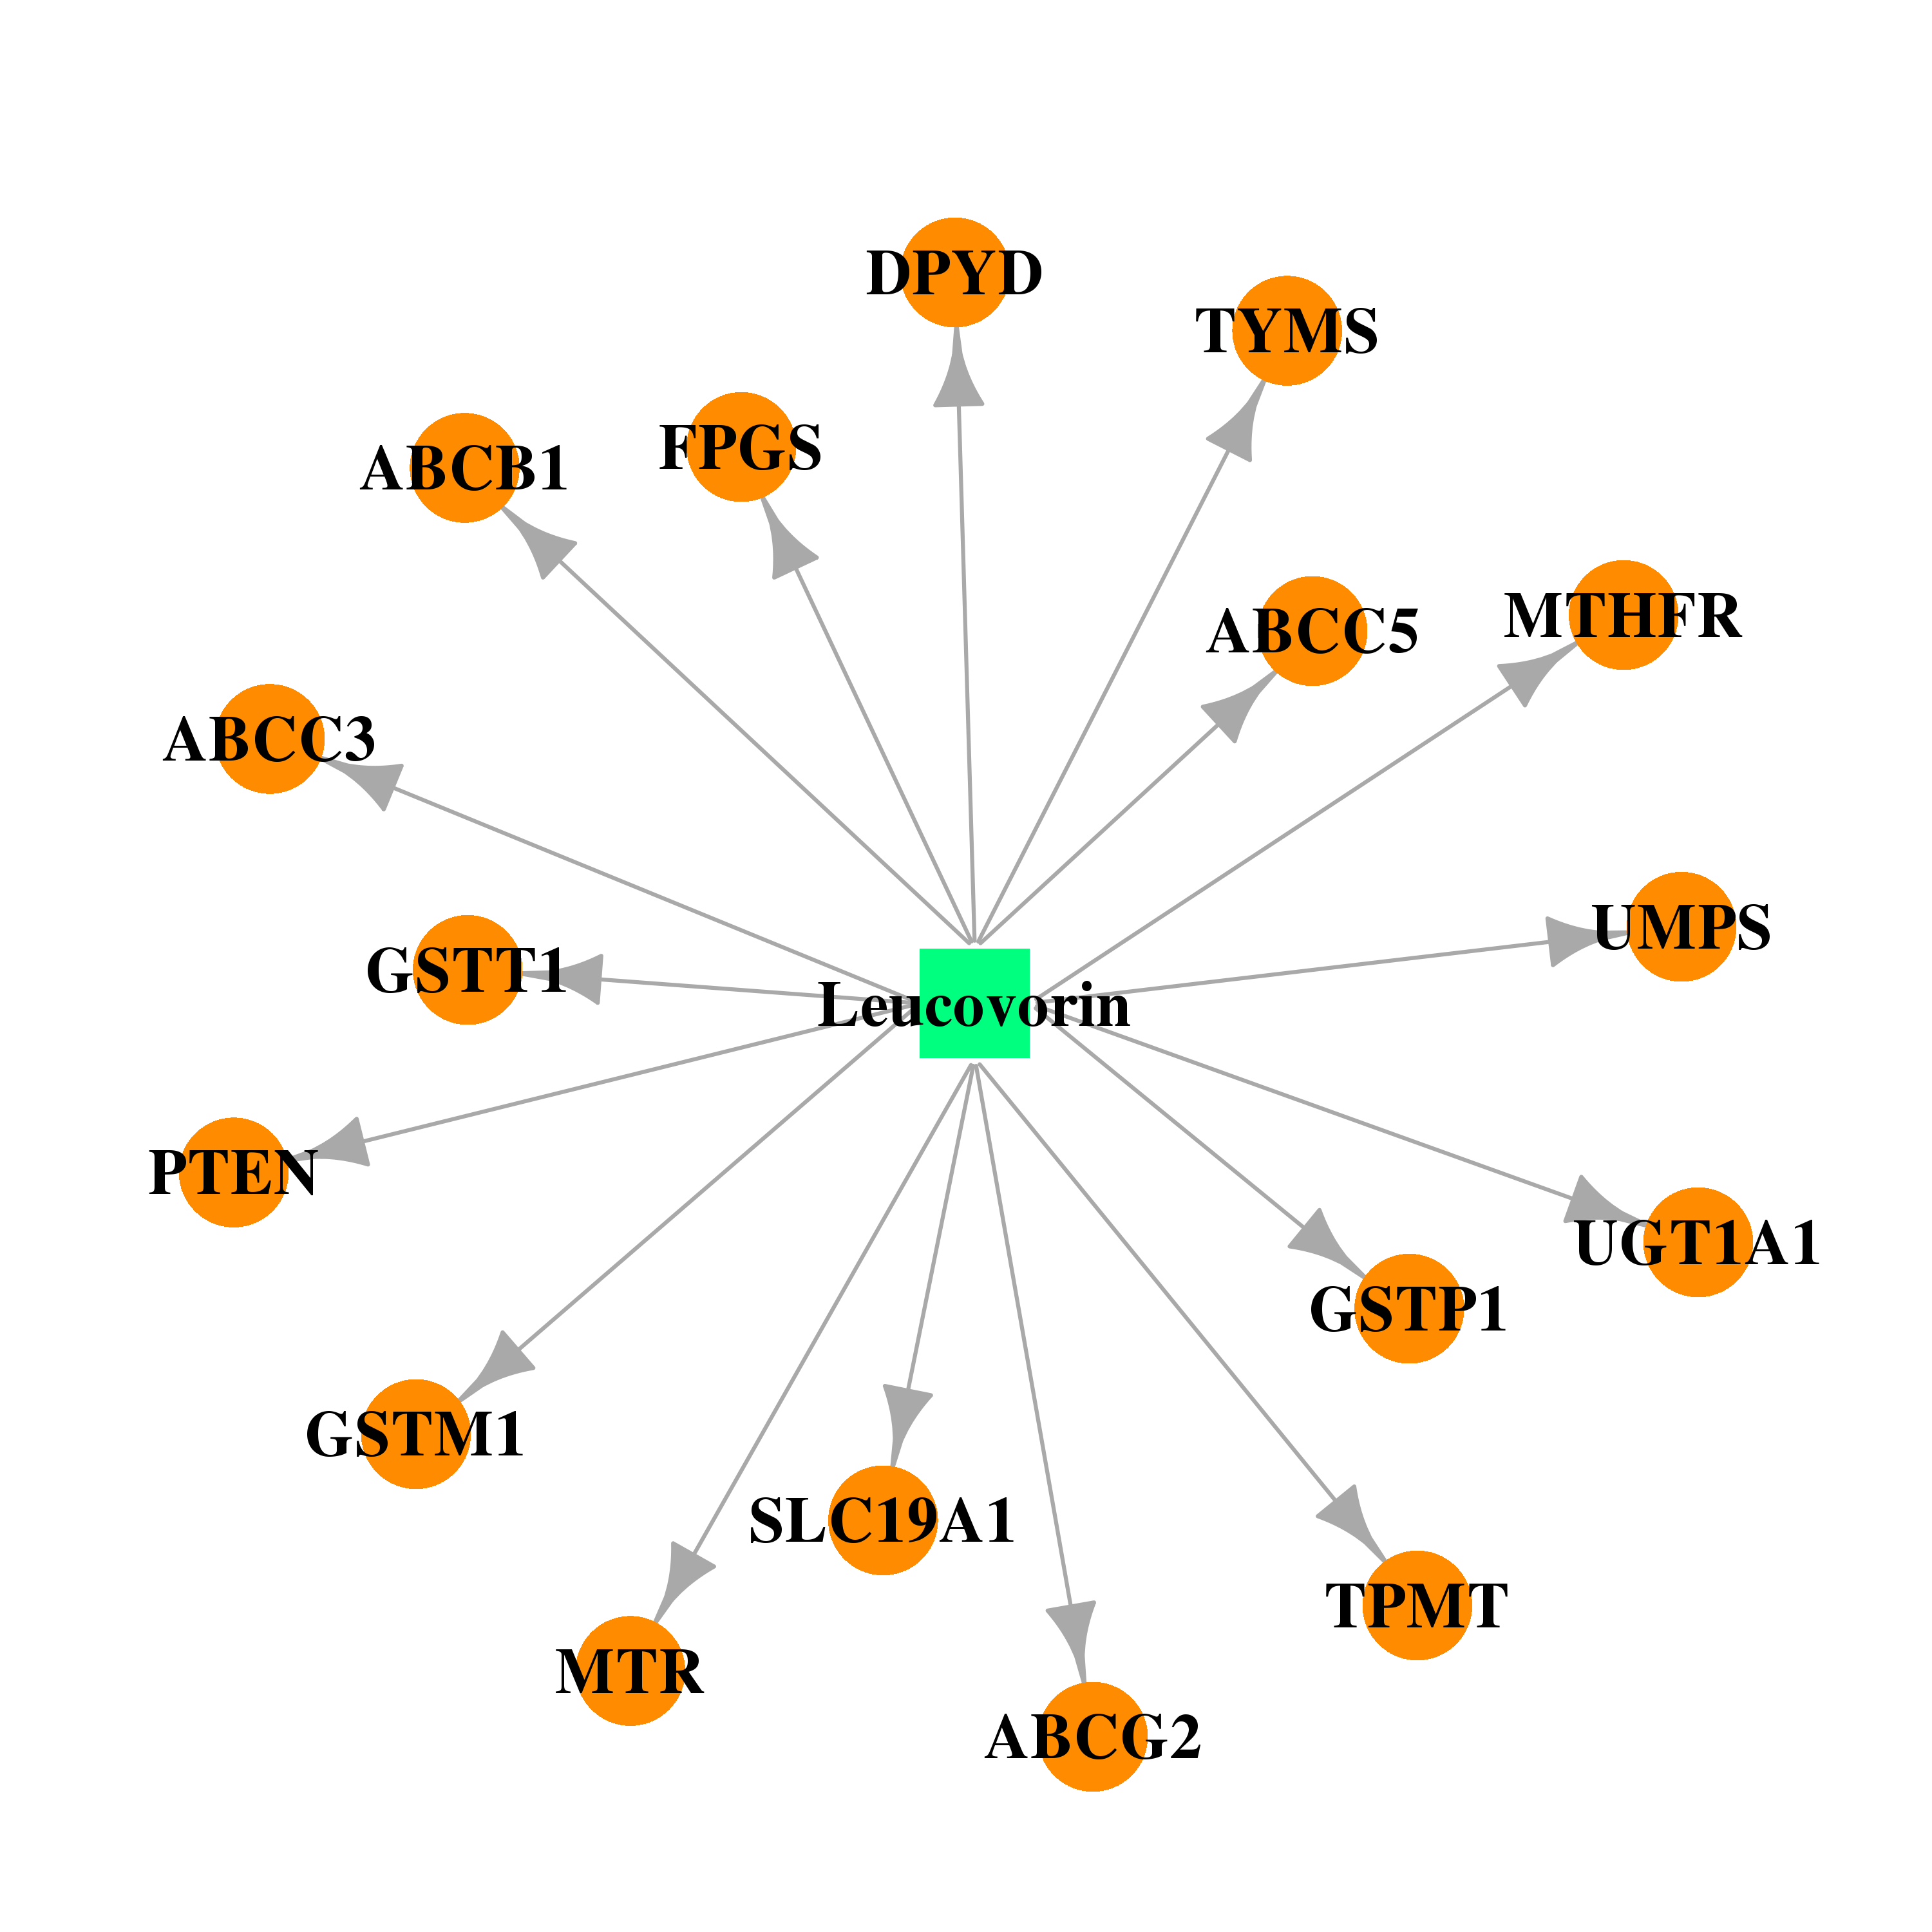 | 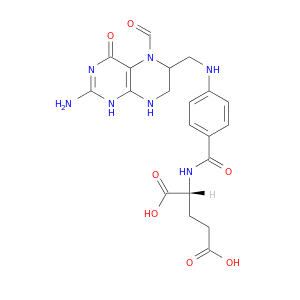 |
| DB00145 | folylpolyglutamate synthase | approved; nutraceutical | Glycine |  |  |
| DB00133 | folylpolyglutamate synthase | approved; nutraceutical | L-Serine | 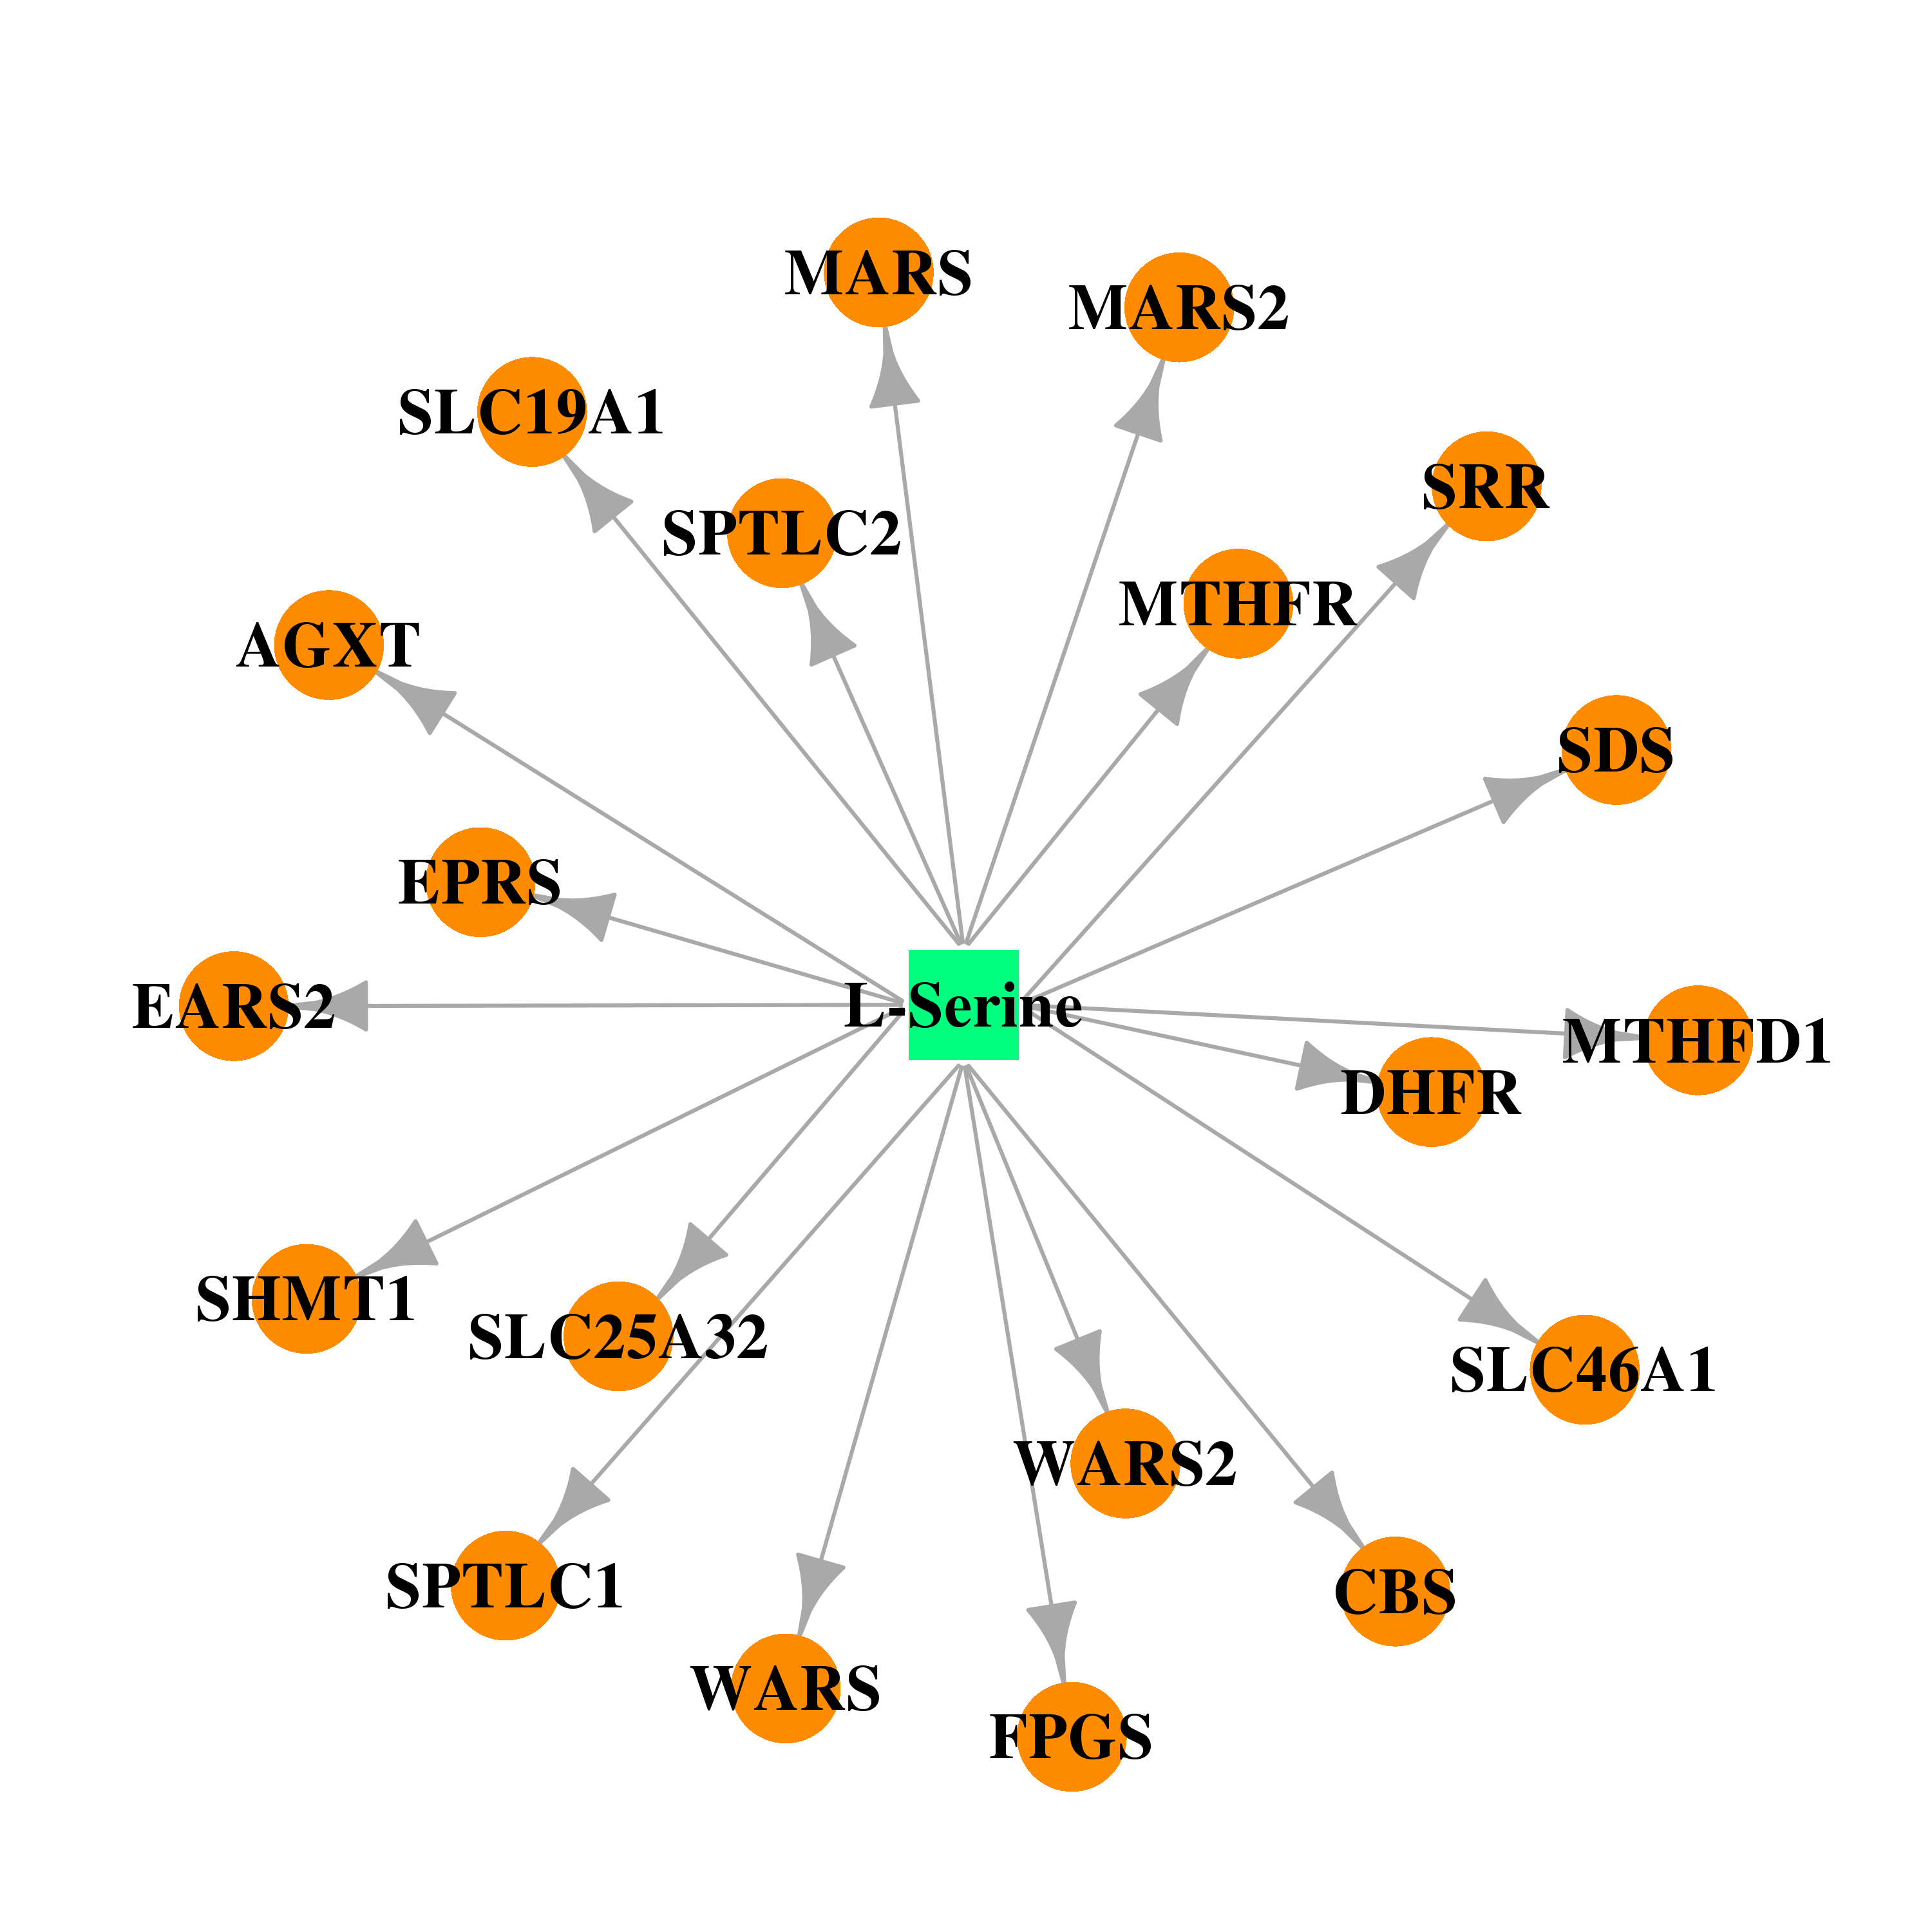 | 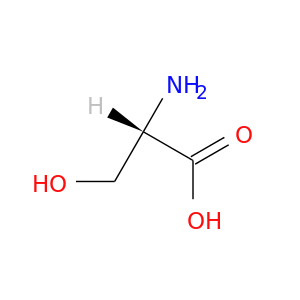 |
| DB00515 | folylpolyglutamate synthase | approved | Cisplatin |  |  |
| DB00252 | folylpolyglutamate synthase | approved | Phenytoin | 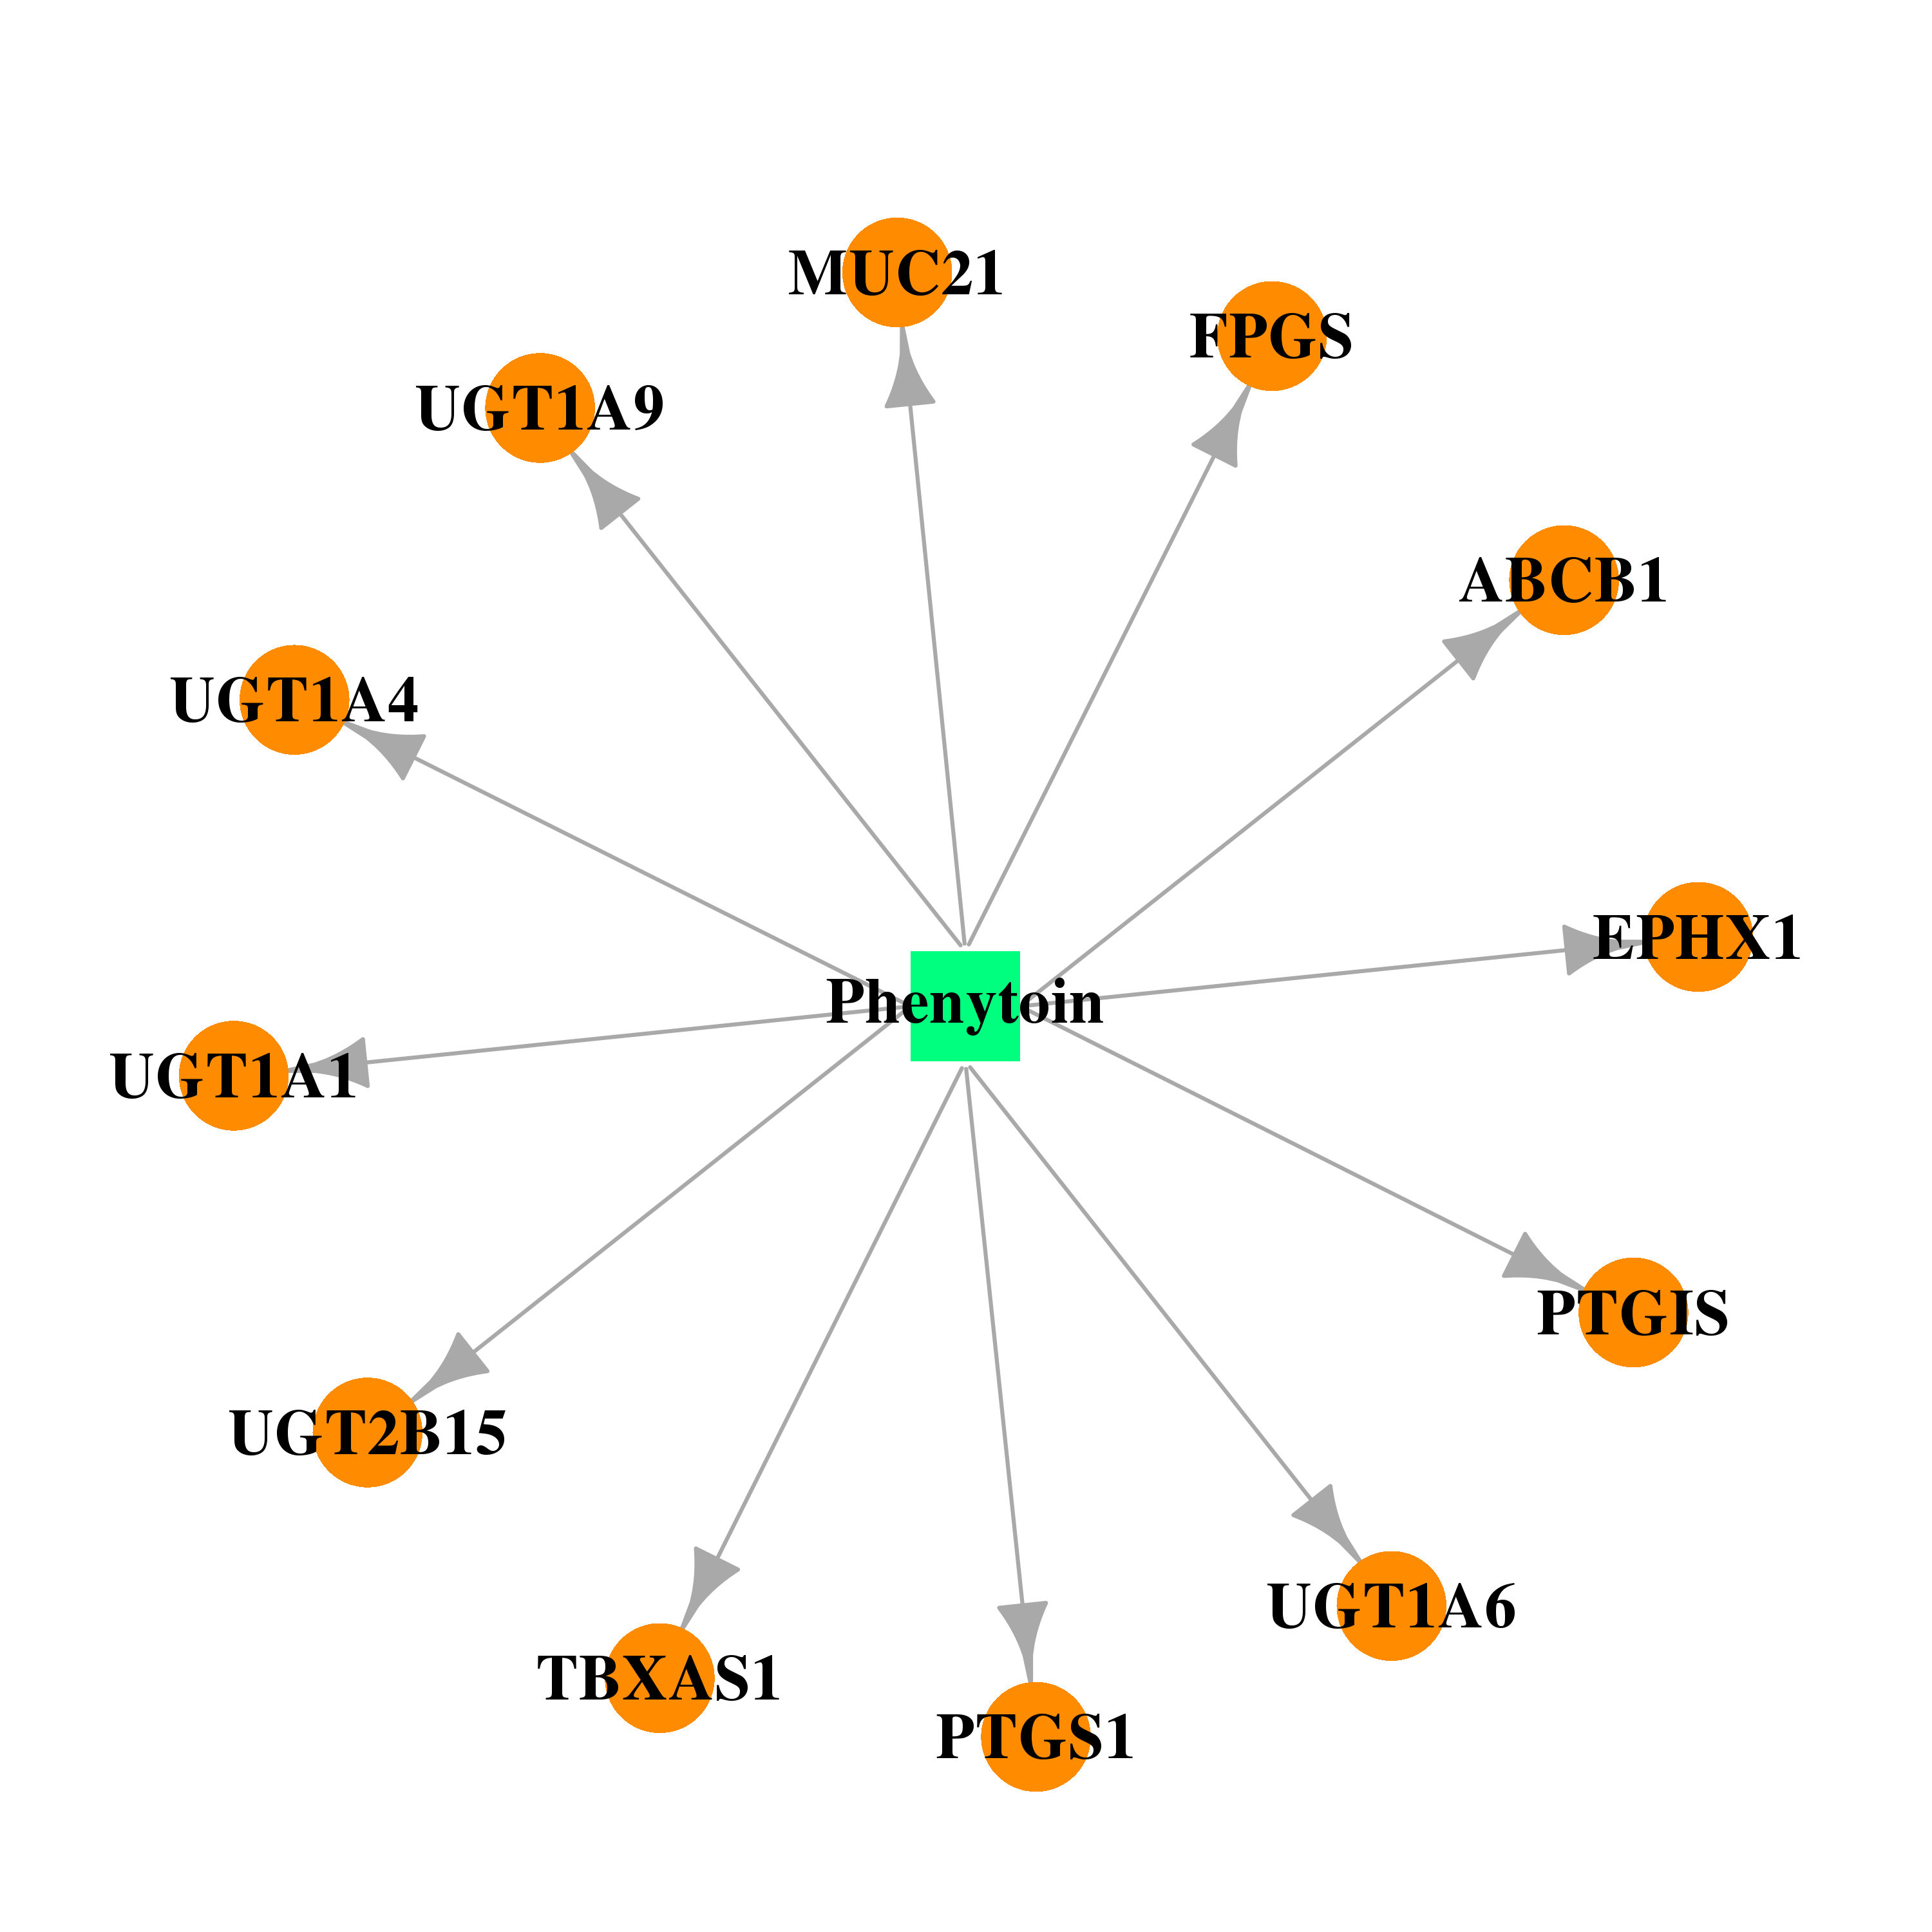 | 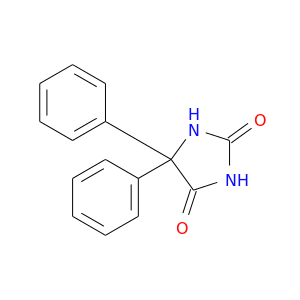 |
| DB00563 | folylpolyglutamate synthase | approved | Methotrexate |  |  |
| DB00642 | folylpolyglutamate synthase | approved; investigational | Pemetrexed | 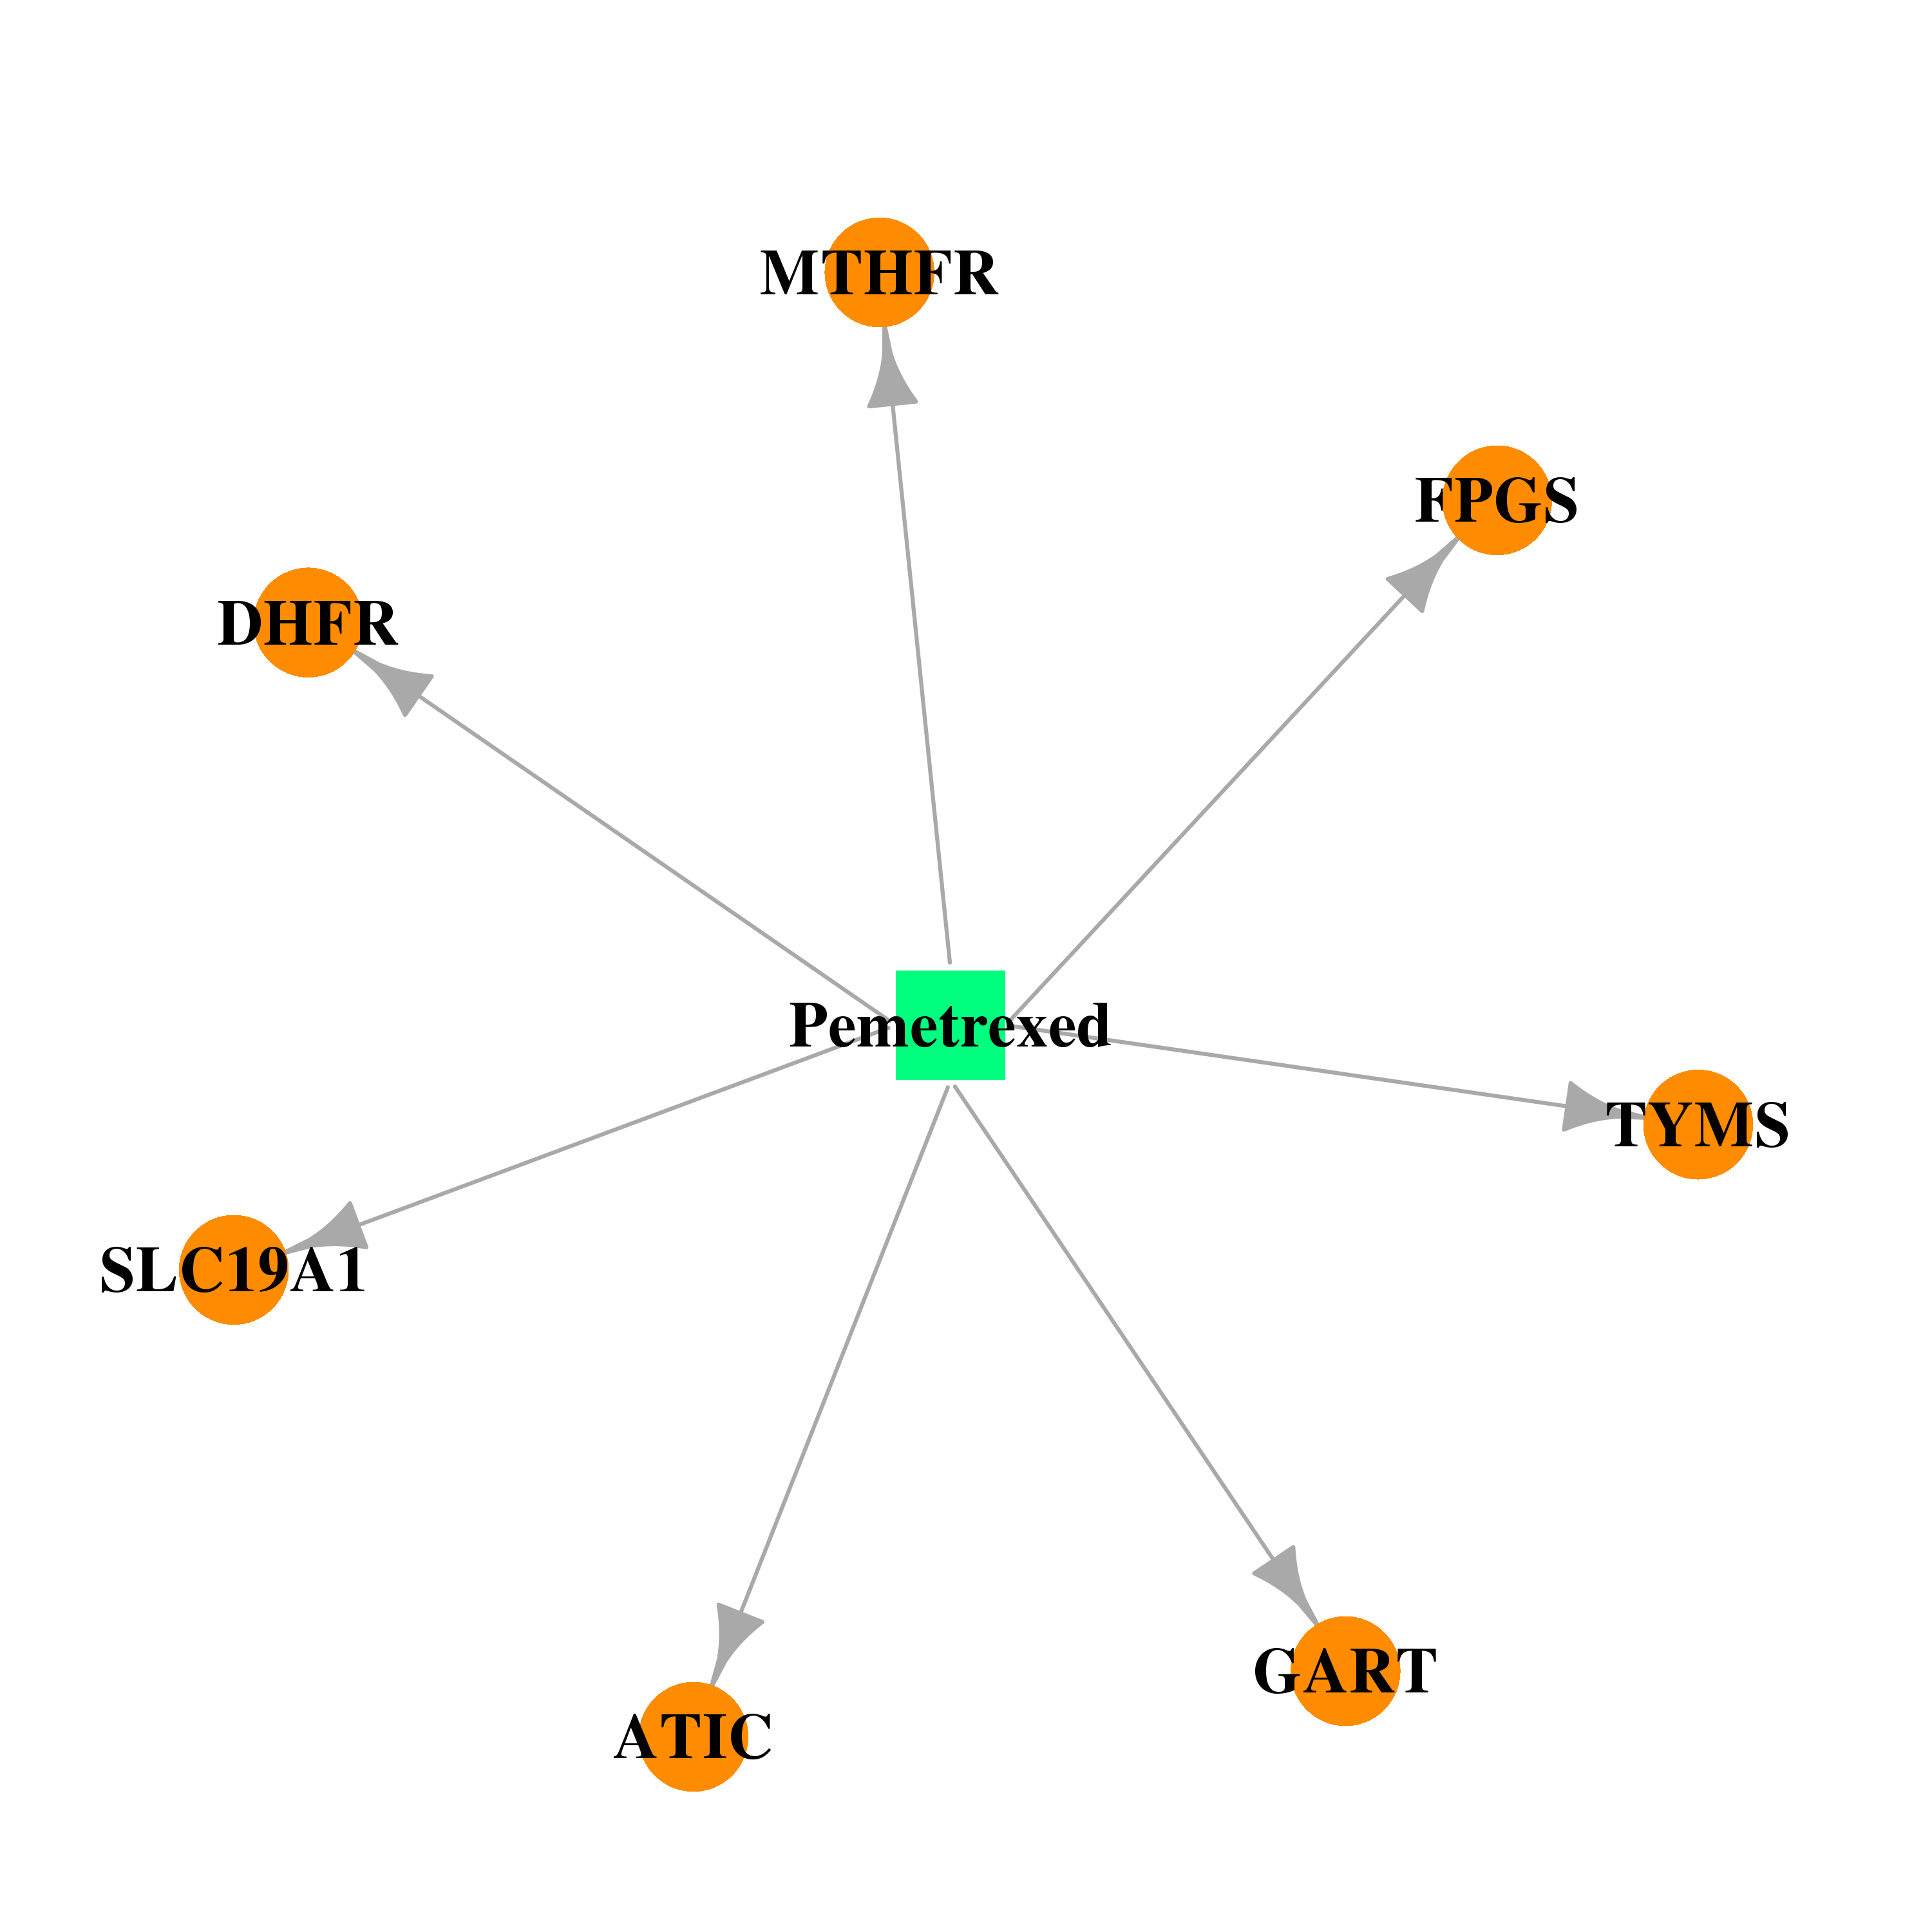 | 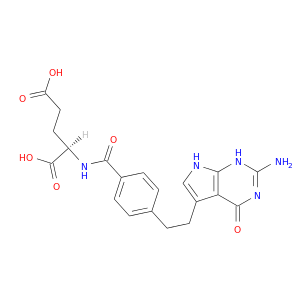 |
| Top |
| Cross referenced IDs for FPGS |
| * We obtained these cross-references from Uniprot database. It covers 150 different DBs, 18 categories. http://www.uniprot.org/help/cross_references_section |
: Open all cross reference information
|
Copyright © 2016-Present - The Univsersity of Texas Health Science Center at Houston @ |