|
||||||||||||||||||||||||||||||||||||||||||||||||||||||||||||||||||||||||||||||||||||||||||||||||||||||||||||||||||||||||||||||||||||||||||||||||||||||||||||||||||||||||||||||||||||||||||||||||||||||||||||||||||||||||||||||||||||||||||||||||||||||||||||||||||||||||||||||||||||||||||||||||||||||||||||||||||||||||||
| |
| Phenotypic Information (metabolism pathway, cancer, disease, phenome) |
| |
| |
| Gene-Gene Network Information: Co-Expression Network, Interacting Genes & KEGG |
| |
|


| Gene Summary for PLD3 |
| Top |
| Phenotypic Information for PLD3(metabolism pathway, cancer, disease, phenome) |
| Cancer | CGAP: PLD3 |
| Familial Cancer Database: PLD3 | |
| * This gene is included in those cancer gene databases. |
|
|
|
|
|
|
| ||||||||||||||||||||||||||||||||||||||||||||||||||||||||||||||||||||||||||||||||||||||||||||||||||||||||||||||||||||||||||||||||||||||||||||||||||||||||||||||||||||||||||||||||||||||||||||||||||||||||||||||||||||||||||||||||||||||||||||||||||||||||||||||||||||||||||||||||||||||||||||||||||||||||||||||||||||
Oncogene 1 | Significant driver gene in | |||||||||||||||||||||||||||||||||||||||||||||||||||||||||||||||||||||||||||||||||||||||||||||||||||||||||||||||||||||||||||||||||||||||||||||||||||||||||||||||||||||||||||||||||||||||||||||||||||||||||||||||||||||||||||||||||||||||||||||||||||||||||||||||||||||||||||||||||||||||||||||||||||||||||||||||||||||||||
| cf) number; DB name 1 Oncogene; http://nar.oxfordjournals.org/content/35/suppl_1/D721.long, 2 Tumor Suppressor gene; https://bioinfo.uth.edu/TSGene/, 3 Cancer Gene Census; http://www.nature.com/nrc/journal/v4/n3/abs/nrc1299.html, 4 CancerGenes; http://nar.oxfordjournals.org/content/35/suppl_1/D721.long, 5 Network of Cancer Gene; http://ncg.kcl.ac.uk/index.php, 1Therapeutic Vulnerabilities in Cancer; http://cbio.mskcc.org/cancergenomics/statius/ |
| REACTOME_PHOSPHOLIPID_METABOLISM REACTOME_METABOLISM_OF_LIPIDS_AND_LIPOPROTEINS | |
| OMIM | |
| Orphanet | |
| Disease | KEGG Disease: PLD3 |
| MedGen: PLD3 (Human Medical Genetics with Condition) | |
| ClinVar: PLD3 | |
| Phenotype | MGI: PLD3 (International Mouse Phenotyping Consortium) |
| PhenomicDB: PLD3 | |
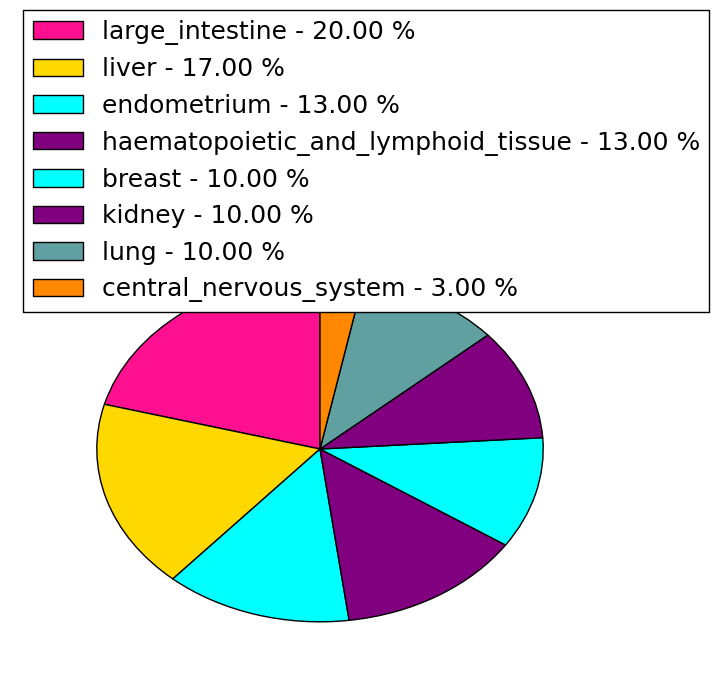
| Mutations for PLD3 |
| * Under tables are showing count per each tissue to give us broad intuition about tissue specific mutation patterns.You can go to the detailed page for each mutation database's web site. |
| - Statistics for Tissue and Mutation type | Top |
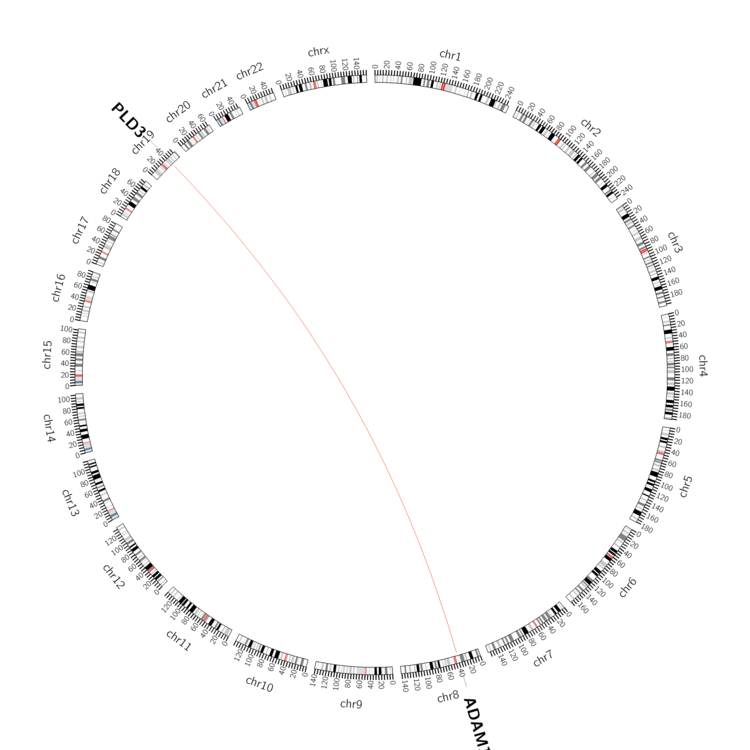 |
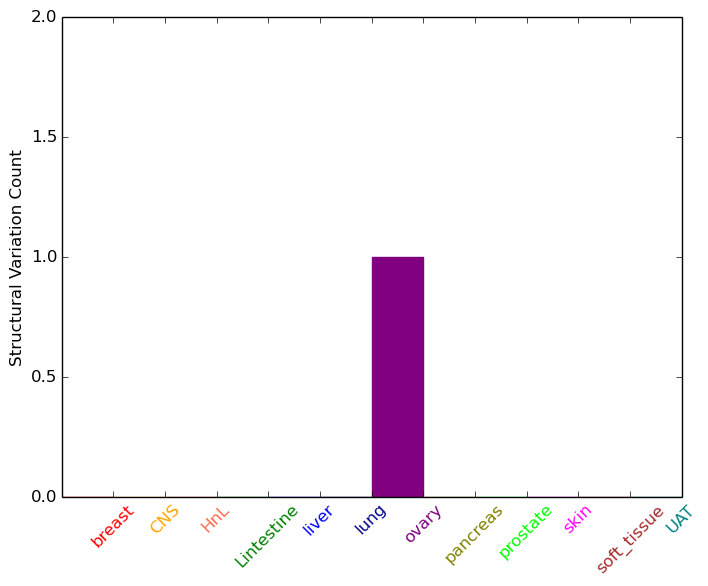
| - For Inter-chromosomal Variations |
| * Inter-chromosomal variantions includes 'interchromosomal amplicon to amplicon', 'interchromosomal amplicon to non-amplified dna', 'interchromosomal insertion', 'Interchromosomal unknown type'. |
 |
| - For Intra-chromosomal Variations |
| There's no intra-chromosomal structural variation. |
| Sample | Symbol_a | Chr_a | Start_a | End_a | Symbol_b | Chr_b | Start_b | End_b |
| cf) Tissue number; Tissue name (1;Breast, 2;Central_nervous_system, 3;Haematopoietic_and_lymphoid_tissue, 4;Large_intestine, 5;Liver, 6;Lung, 7;Ovary, 8;Pancreas, 9;Prostate, 10;Skin, 11;Soft_tissue, 12;Upper_aerodigestive_tract) |
| * From mRNA Sanger sequences, Chitars2.0 arranged chimeric transcripts. This table shows PLD3 related fusion information. |
| ID | Head Gene | Tail Gene | Accession | Gene_a | qStart_a | qEnd_a | Chromosome_a | tStart_a | tEnd_a | Gene_a | qStart_a | qEnd_a | Chromosome_a | tStart_a | tEnd_a |
| BE699806 | PLD3 | 11 | 206 | 19 | 40880387 | 40882570 | CPNE5 | 203 | 344 | 6 | 36790178 | 36790319 | |
| BJ997169 | PLD3 | 1 | 230 | 19 | 40871755 | 40872571 | LOC100507412 | 227 | 417 | ? | 109584 | 109774 | |
| AL041531 | PLD3 | 16 | 87 | 19 | 40880484 | 40882543 | PLD3 | 84 | 562 | 19 | 40882531 | 40884120 | |
| CA310232 | PLD3 | 16 | 193 | 19 | 40884213 | 40884390 | PLD3 | 187 | 736 | 19 | 40871778 | 40873781 | |
| BE295537 | PLD3 | 1 | 396 | 19 | 40884052 | 40884397 | CAPZA1 | 397 | 422 | 1 | 113207780 | 113207809 | |
| BE938399 | GREB1L | 32 | 215 | 18 | 18983889 | 19019598 | PLD3 | 206 | 312 | 19 | 40880478 | 40882572 | |
| Top |
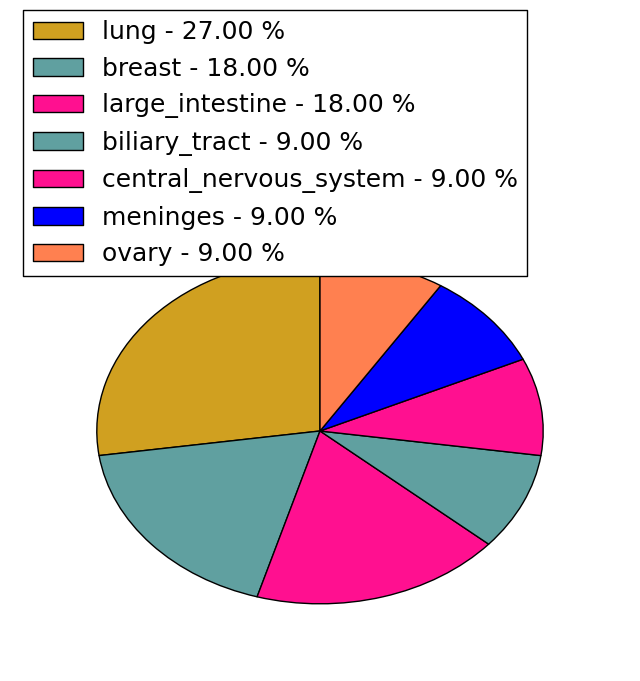
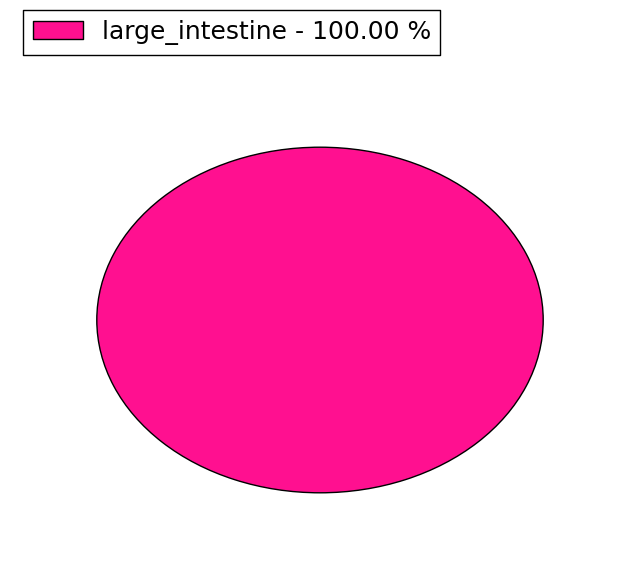
| Mutation type/ Tissue ID | brca | cns | cerv | endome | haematopo | kidn | Lintest | liver | lung | ns | ovary | pancre | prost | skin | stoma | thyro | urina | |||
| Total # sample | 3 | 2 | ||||||||||||||||||
| GAIN (# sample) | 3 | 2 | ||||||||||||||||||
| LOSS (# sample) |
| cf) Tissue ID; Tissue type (1; Breast, 2; Central_nervous_system, 3; Cervix, 4; Endometrium, 5; Haematopoietic_and_lymphoid_tissue, 6; Kidney, 7; Large_intestine, 8; Liver, 9; Lung, 10; NS, 11; Ovary, 12; Pancreas, 13; Prostate, 14; Skin, 15; Stomach, 16; Thyroid, 17; Urinary_tract) |
| Top |
|
 |
| Top |
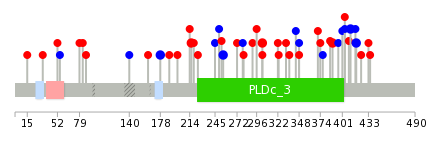
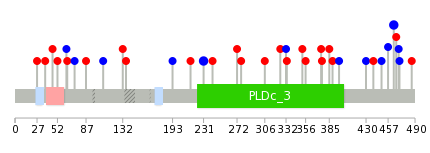
| Stat. for Non-Synonymous SNVs (# total SNVs=29) | (# total SNVs=11) |
 |  |
(# total SNVs=0) | (# total SNVs=1) |
 |
| Top |
| * When you move the cursor on each content, you can see more deailed mutation information on the Tooltip. Those are primary_site,primary_histology,mutation(aa),pubmedID. |
| GRCh37 position | Mutation(aa) | Unique sampleID count |
| chr19:40882562-40882562 | p.R303C | 2 |
| chr19:40884020-40884020 | p.P418P | 2 |
| chr19:40877594-40877594 | p.G178G | 2 |
| chr19:40883932-40883932 | p.A389V | 2 |
| chr19:40877707-40877707 | p.Y216C | 2 |
| chr19:40883999-40883999 | p.F411F | 2 |
| chr19:40876045-40876045 | p.Q140Q | 1 |
| chr19:40883787-40883787 | p.Y374S | 1 |
| chr19:40877731-40877731 | p.T224I | 1 |
| chr19:40882563-40882563 | p.R303H | 1 |
| Top |
|
 |
| Point Mutation/ Tissue ID | 1 | 2 | 3 | 4 | 5 | 6 | 7 | 8 | 9 | 10 | 11 | 12 | 13 | 14 | 15 | 16 | 17 | 18 | 19 | 20 |
| # sample | 2 | 4 | 7 | 1 | 5 | 2 | 1 | 5 | 4 | 3 | ||||||||||
| # mutation | 2 | 4 | 7 | 1 | 5 | 2 | 1 | 5 | 4 | 4 | ||||||||||
| nonsynonymous SNV | 2 | 2 | 6 | 4 | 1 | 4 | 4 | |||||||||||||
| synonymous SNV | 2 | 1 | 1 | 1 | 1 | 1 | 5 |
| cf) Tissue ID; Tissue type (1; BLCA[Bladder Urothelial Carcinoma], 2; BRCA[Breast invasive carcinoma], 3; CESC[Cervical squamous cell carcinoma and endocervical adenocarcinoma], 4; COAD[Colon adenocarcinoma], 5; GBM[Glioblastoma multiforme], 6; Glioma Low Grade, 7; HNSC[Head and Neck squamous cell carcinoma], 8; KICH[Kidney Chromophobe], 9; KIRC[Kidney renal clear cell carcinoma], 10; KIRP[Kidney renal papillary cell carcinoma], 11; LAML[Acute Myeloid Leukemia], 12; LUAD[Lung adenocarcinoma], 13; LUSC[Lung squamous cell carcinoma], 14; OV[Ovarian serous cystadenocarcinoma ], 15; PAAD[Pancreatic adenocarcinoma], 16; PRAD[Prostate adenocarcinoma], 17; SKCM[Skin Cutaneous Melanoma], 18:STAD[Stomach adenocarcinoma], 19:THCA[Thyroid carcinoma], 20:UCEC[Uterine Corpus Endometrial Carcinoma]) |
| Top |
| * We represented just top 10 SNVs. When you move the cursor on each content, you can see more deailed mutation information on the Tooltip. Those are primary_site, primary_histology, mutation(aa), pubmedID. |
| Genomic Position | Mutation(aa) | Unique sampleID count |
| chr19:40883999 | p.G231G,PLD3 | 2 |
| chr19:40877594 | p.F464F,PLD3 | 2 |
| chr19:40883954 | p.T439M,PLD3 | 1 |
| chr19:40873752 | p.R242Q,PLD3 | 1 |
| chr19:40880506 | p.T449T,PLD3 | 1 |
| chr19:40883978 | p.R272H,PLD3 | 1 |
| chr19:40873764 | p.R457R,PLD3 | 1 |
| chr19:40882551 | p.E27V,PLD3 | 1 |
| chr19:40872569 | p.T277I,PLD3 | 1 |
| chr19:40876045 | p.R37H,PLD3 | 1 |
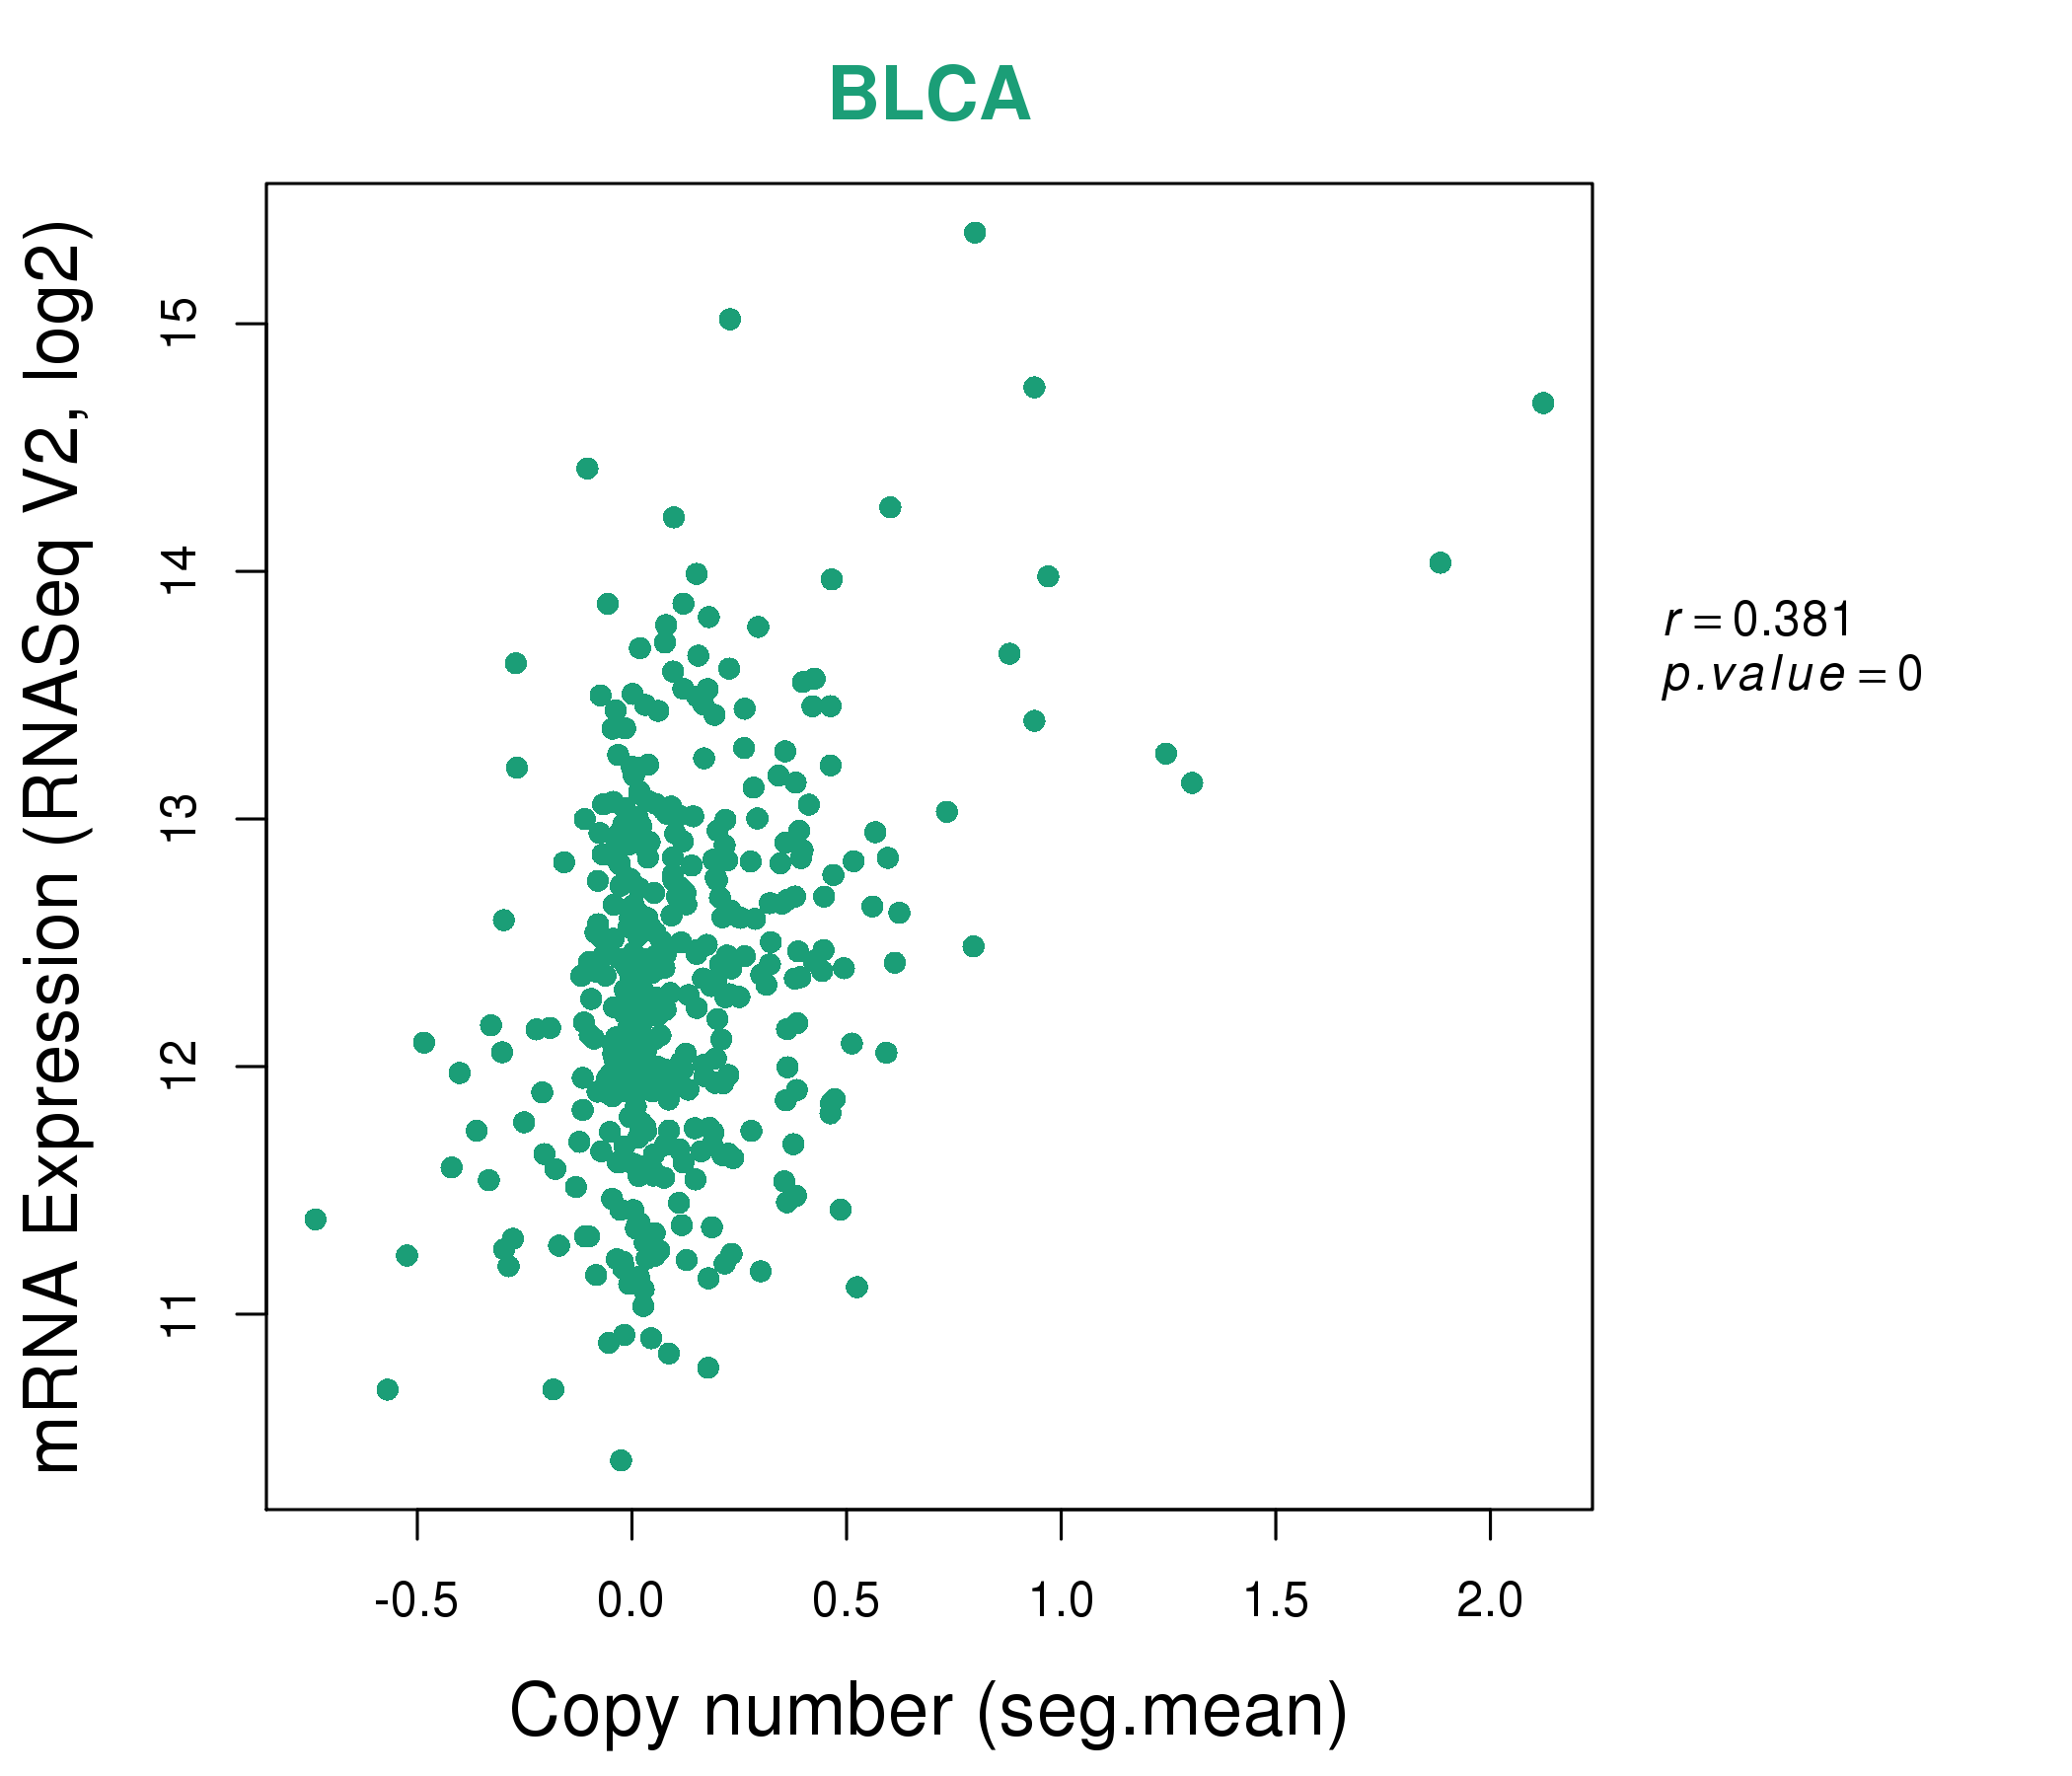
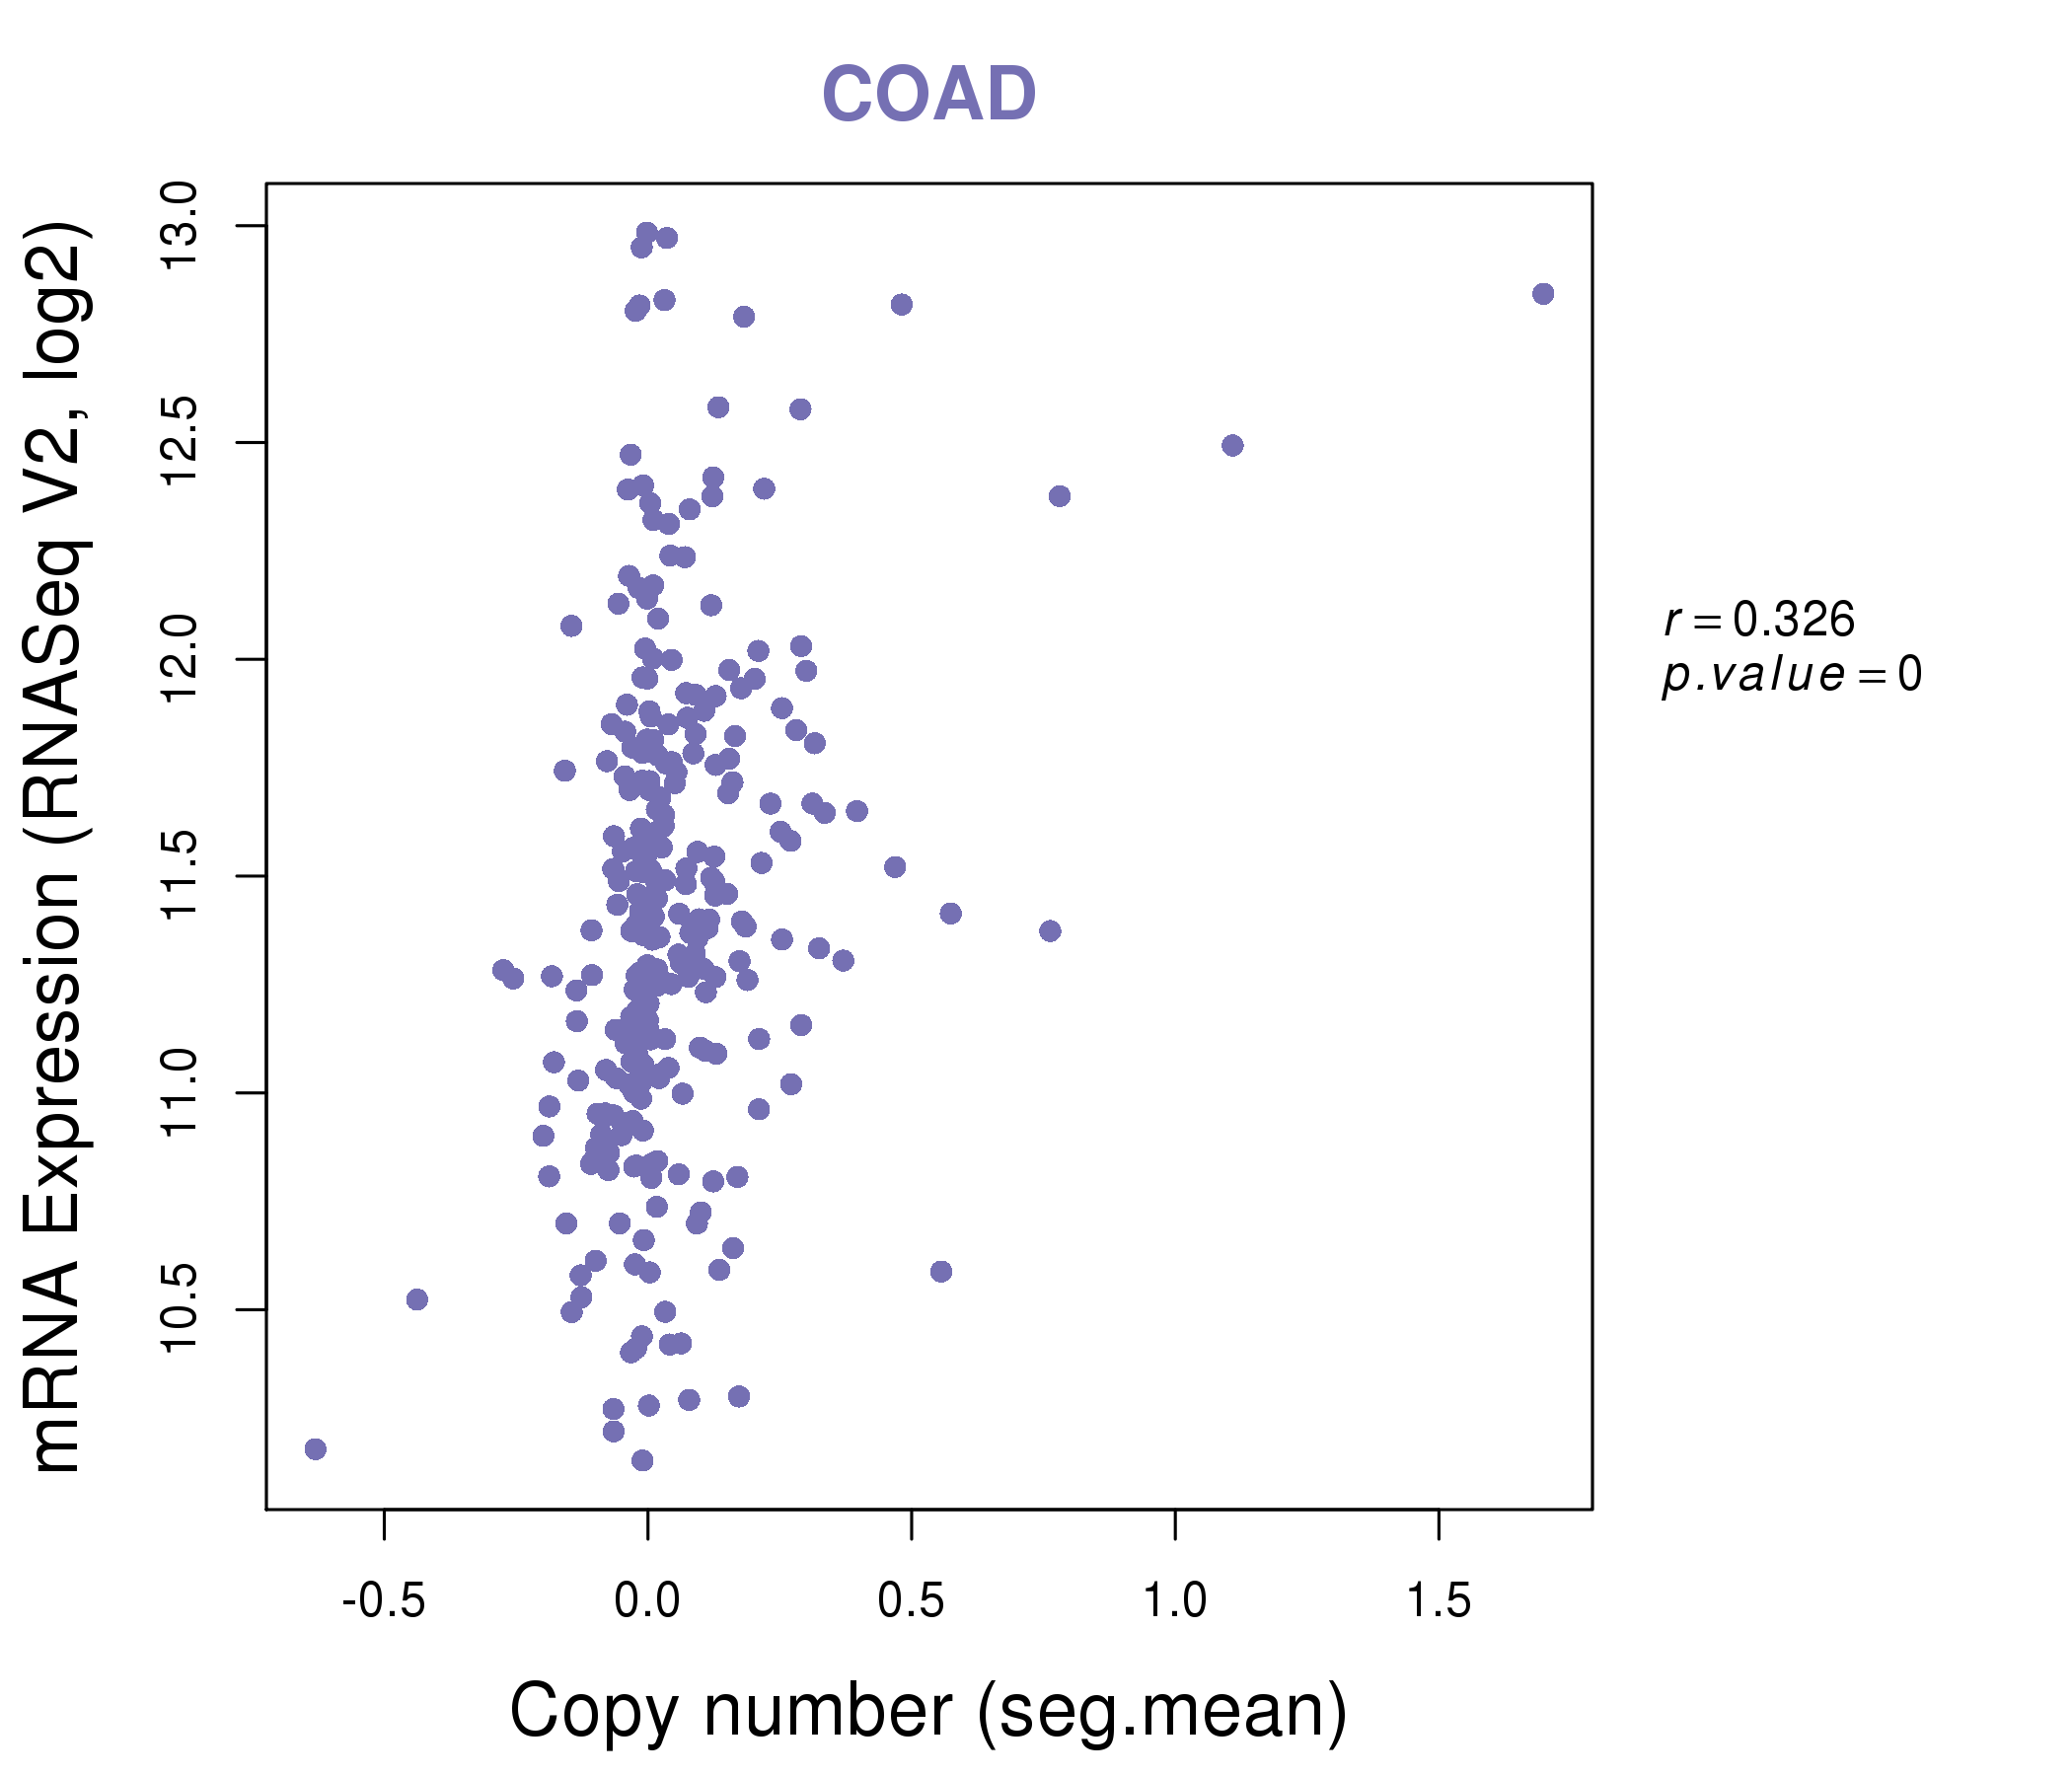
| * Copy number data were extracted from TCGA using R package TCGA-Assembler. The URLs of all public data files on TCGA DCC data server were gathered on Jan-05-2015. Function ProcessCNAData in TCGA-Assembler package was used to obtain gene-level copy number value which is calculated as the average copy number of the genomic region of a gene. |
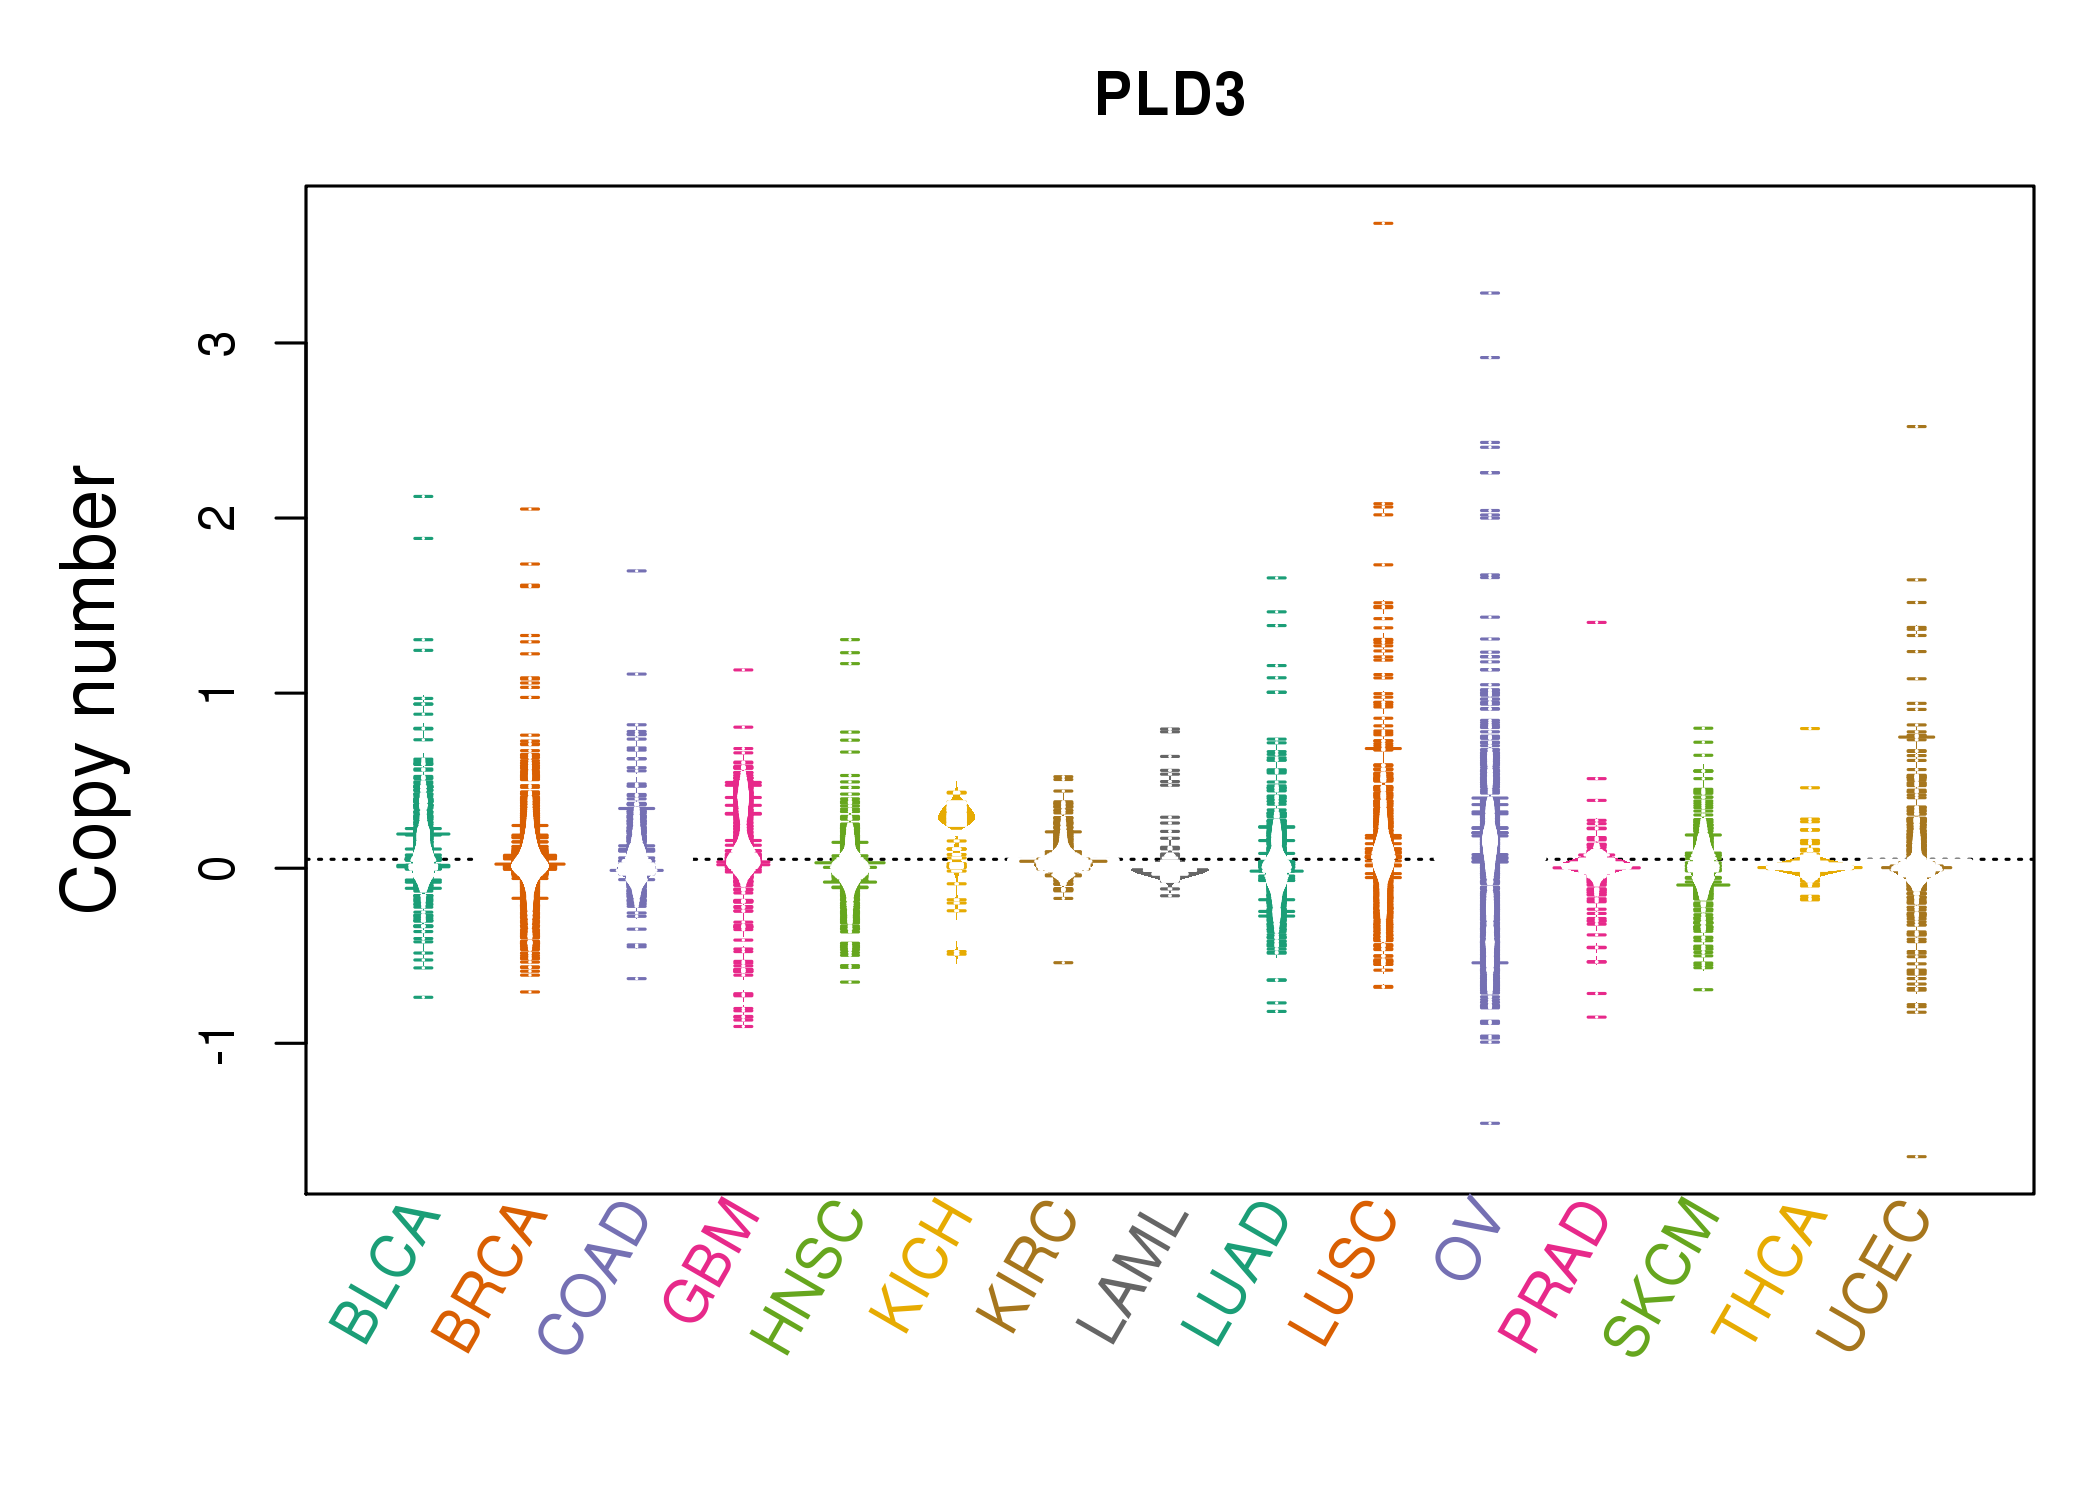 |
| cf) Tissue ID[Tissue type]: BLCA[Bladder Urothelial Carcinoma], BRCA[Breast invasive carcinoma], CESC[Cervical squamous cell carcinoma and endocervical adenocarcinoma], COAD[Colon adenocarcinoma], GBM[Glioblastoma multiforme], Glioma Low Grade, HNSC[Head and Neck squamous cell carcinoma], KICH[Kidney Chromophobe], KIRC[Kidney renal clear cell carcinoma], KIRP[Kidney renal papillary cell carcinoma], LAML[Acute Myeloid Leukemia], LUAD[Lung adenocarcinoma], LUSC[Lung squamous cell carcinoma], OV[Ovarian serous cystadenocarcinoma ], PAAD[Pancreatic adenocarcinoma], PRAD[Prostate adenocarcinoma], SKCM[Skin Cutaneous Melanoma], STAD[Stomach adenocarcinoma], THCA[Thyroid carcinoma], UCEC[Uterine Corpus Endometrial Carcinoma] |
| Top |
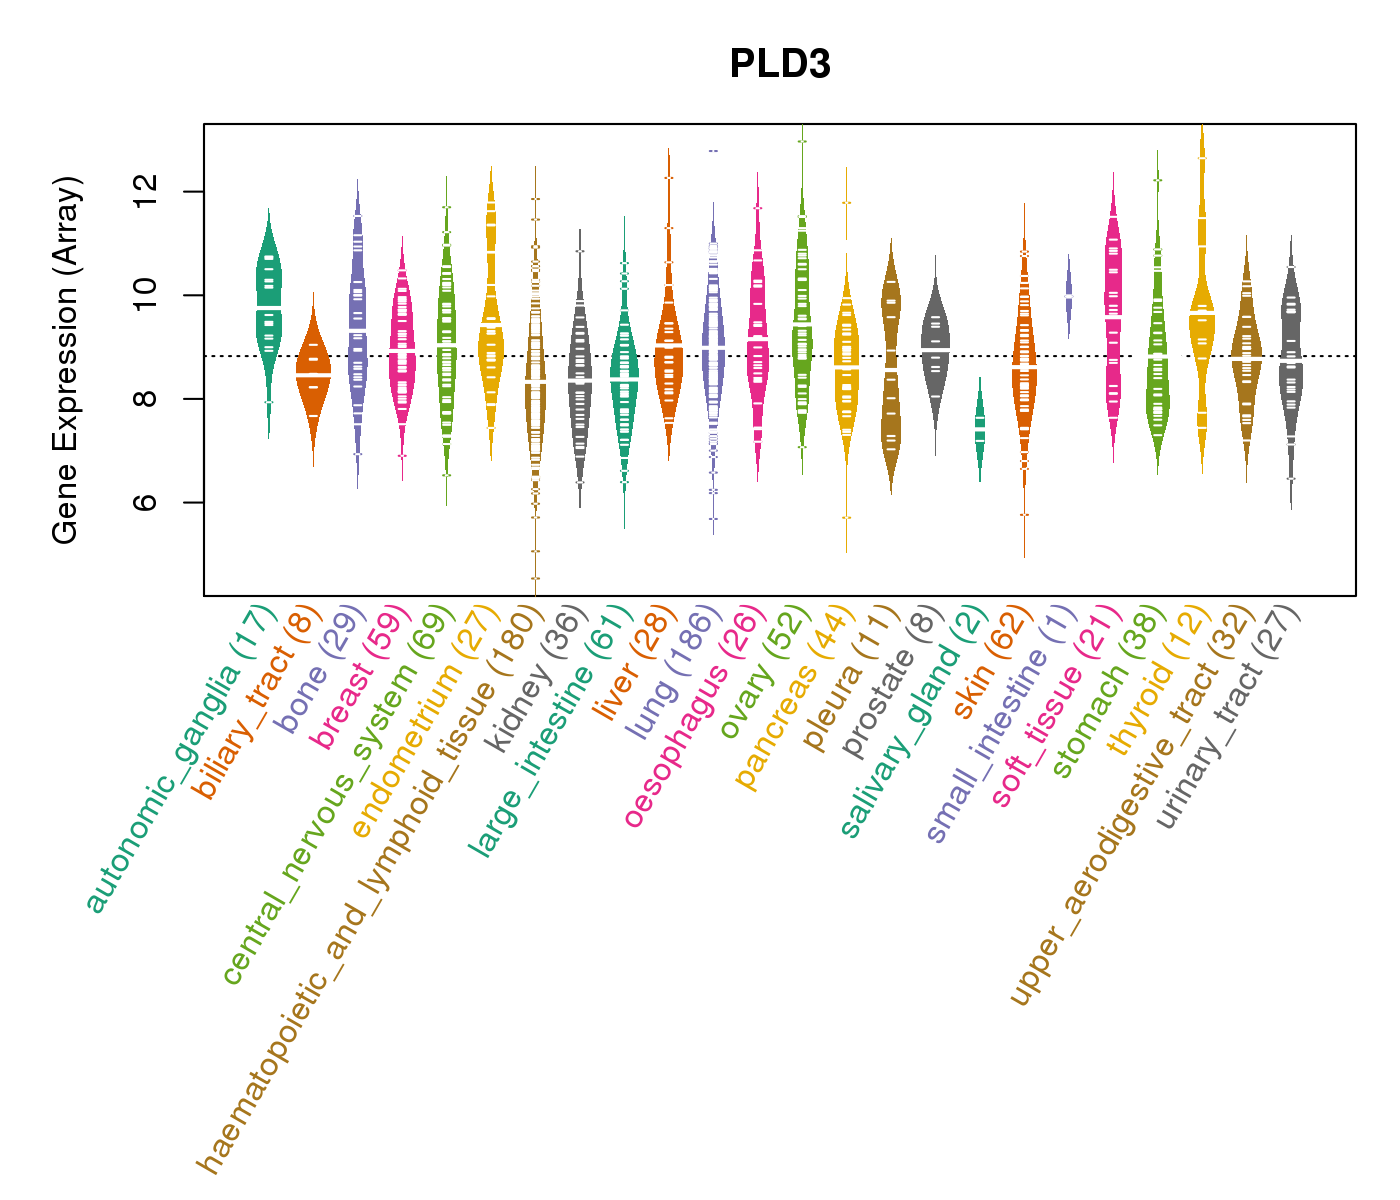
| Gene Expression for PLD3 |
| * CCLE gene expression data were extracted from CCLE_Expression_Entrez_2012-10-18.res: Gene-centric RMA-normalized mRNA expression data. |
 |
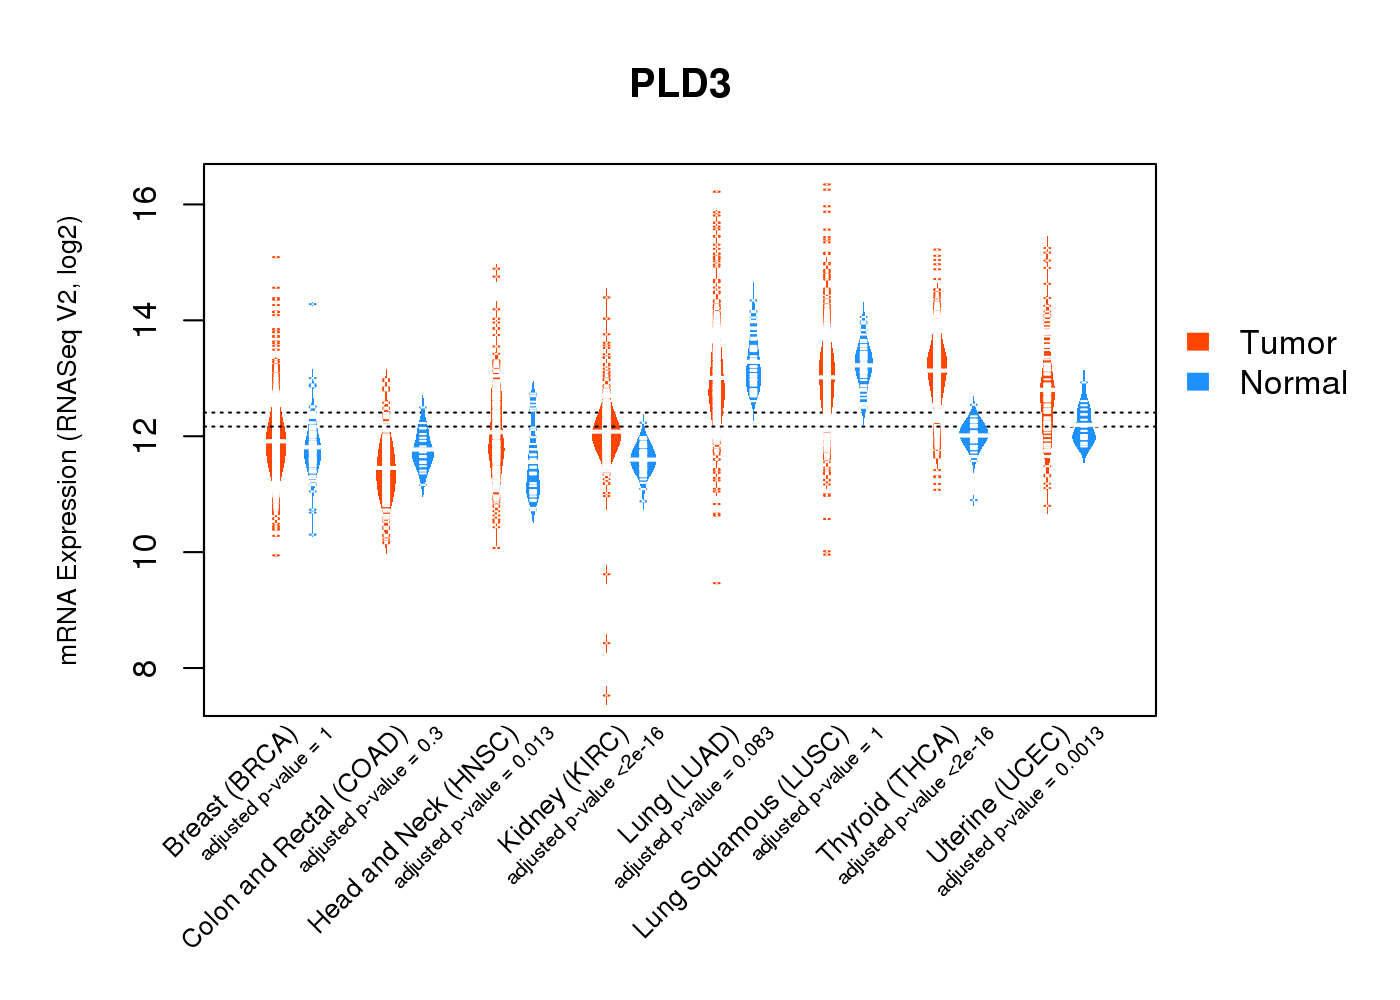
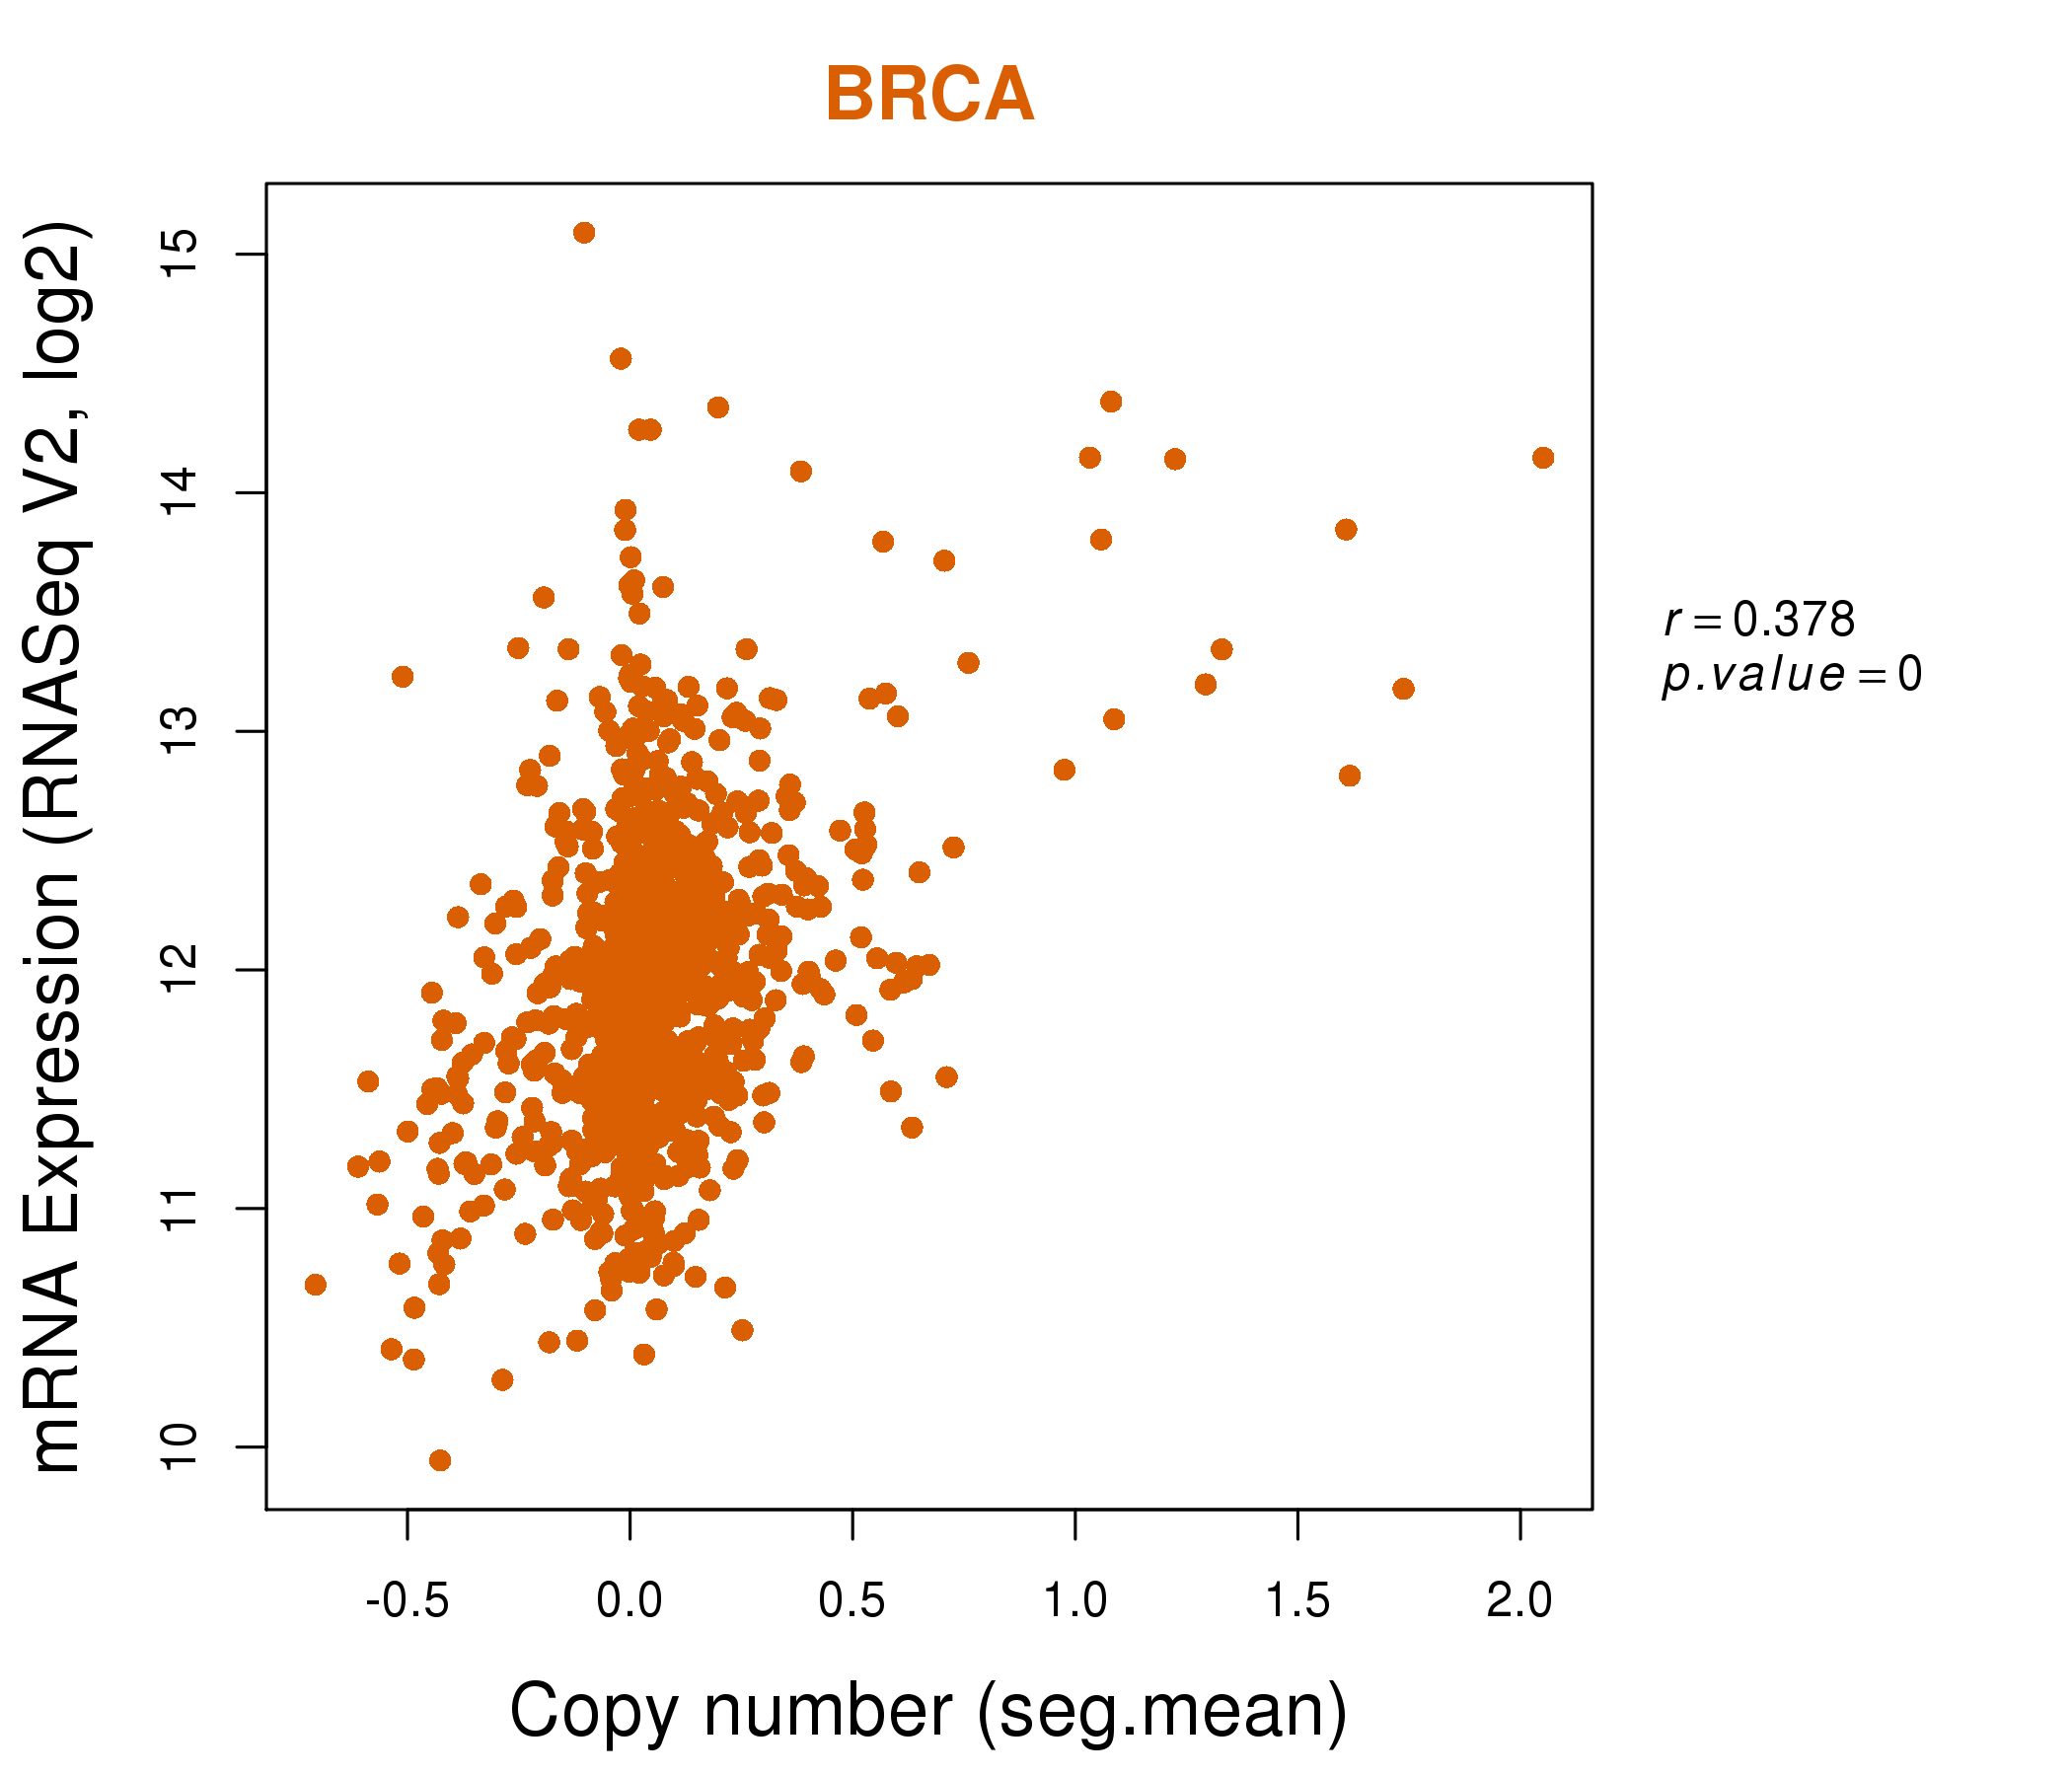
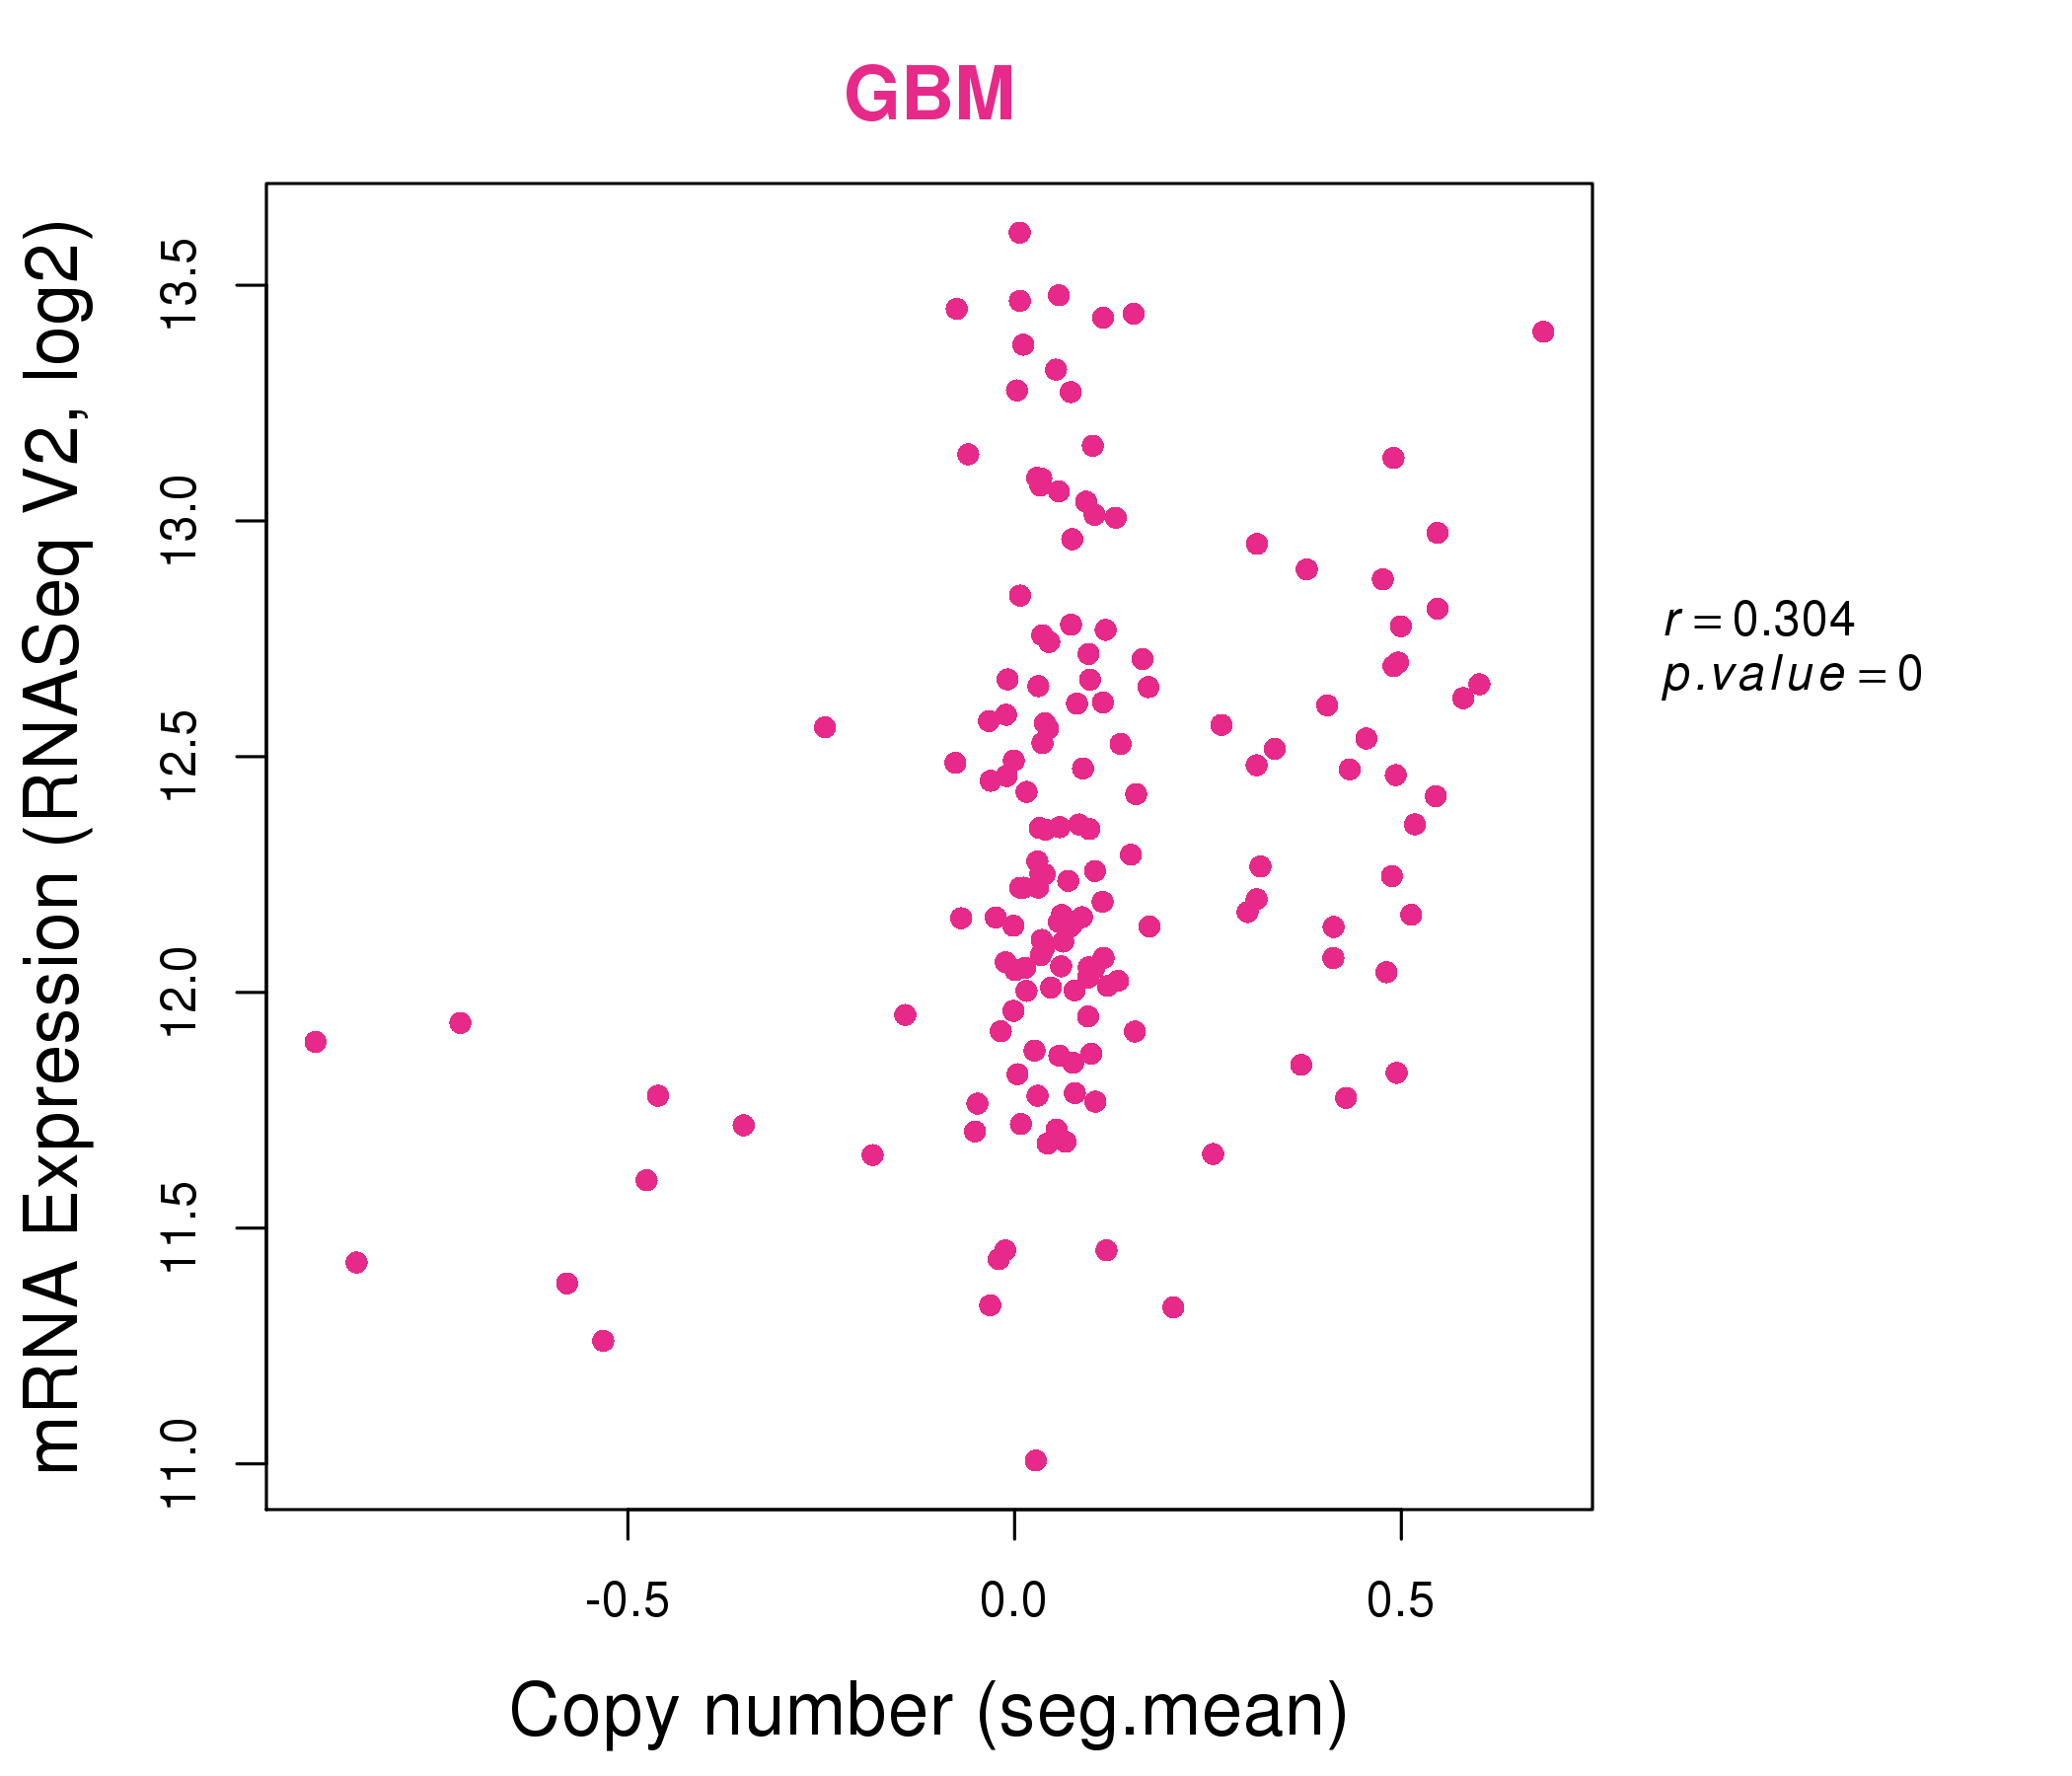
| * Normalized gene expression data of RNASeqV2 was extracted from TCGA using R package TCGA-Assembler. The URLs of all public data files on TCGA DCC data server were gathered at Jan-05-2015. Only eight cancer types have enough normal control samples for differential expression analysis. (t test, adjusted p<0.05 (using Benjamini-Hochberg FDR)) |
 |
| Top |
| * This plots show the correlation between CNV and gene expression. |
: Open all plots for all cancer types
 |
|
 |
|
| Top |
| Gene-Gene Network Information |
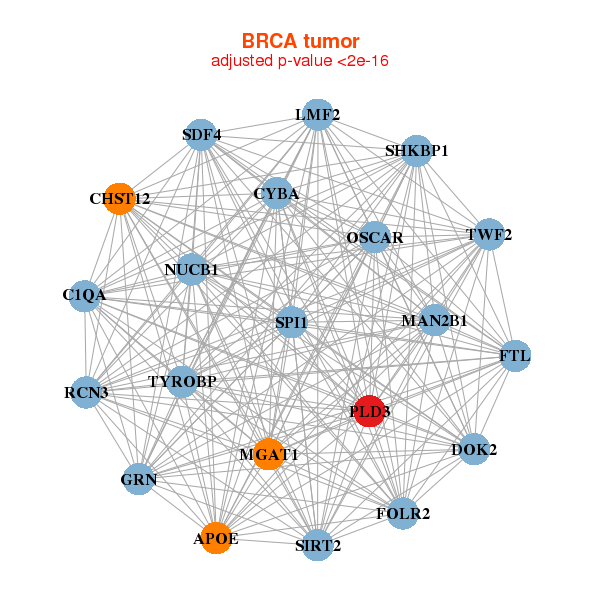
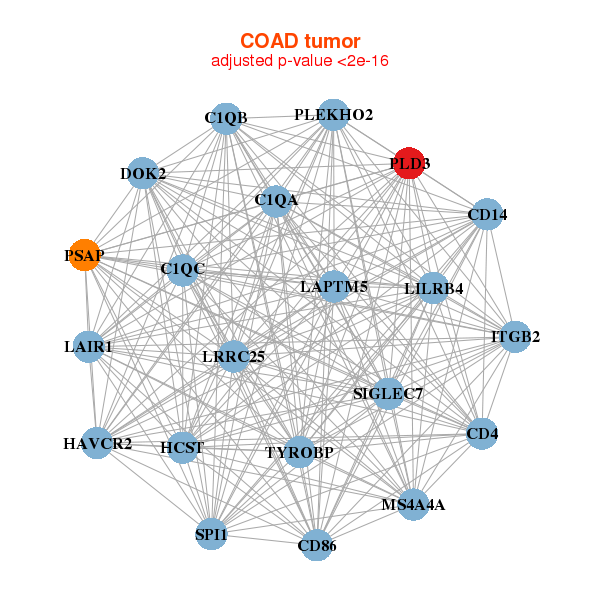
| * Co-Expression network figures were drawn using R package igraph. Only the top 20 genes with the highest correlations were shown. Red circle: input gene, orange circle: cell metabolism gene, sky circle: other gene |
: Open all plots for all cancer types
 |
|
| APOE,C1QA,CHST12,CYBA,DOK2,FOLR2,FTL, GRN,LMF2,MAN2B1,MGAT1,NUCB1,OSCAR,PLD3, RCN3,SDF4,SHKBP1,SIRT2,SPI1,TWF2,TYROBP | ACP5,ARPC1B,ARRB2,CATSPER1,CD300C,DOK2,FCGRT, GRN,HCST,HK3,IFI30,ITGB2,LSP1,MAN2B1, PILRA,PLA2G15,PLD3,SLC15A3,SPI1,TCIRG1,TYROBP |
 |
|
| C1QA,C1QB,C1QC,CD14,CD4,CD86,DOK2, HAVCR2,HCST,ITGB2,LAIR1,LAPTM5,LILRB4,LRRC25, MS4A4A,PLD3,PLEKHO2,PSAP,SIGLEC7,SPI1,TYROBP | AKR1B1,M1AP,CSF1R,DNASE2,DPP7,EVA1B,GBGT1, GGTA1P,GPR137B,HOMER3,HSD17B14,MAFB,MXD4,OSCAR, PCIF1,PLD3,RASGRP4,RENBP,RNF130,TMEM86A,TSPAN4 |
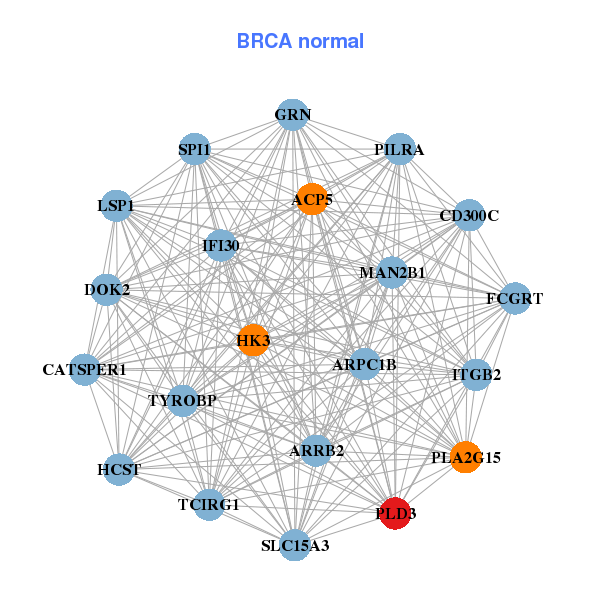

| * Co-Expression network figures were drawn using R package igraph. Only the top 20 genes with the highest correlations were shown. Red circle: input gene, orange circle: cell metabolism gene, sky circle: other gene |
: Open all plots for all cancer types
| Top |
: Open all interacting genes' information including KEGG pathway for all interacting genes from DAVID
| Top |
| Pharmacological Information for PLD3 |
| There's no related Drug. |
| Top |
| Cross referenced IDs for PLD3 |
| * We obtained these cross-references from Uniprot database. It covers 150 different DBs, 18 categories. http://www.uniprot.org/help/cross_references_section |
: Open all cross reference information
|
Copyright © 2016-Present - The Univsersity of Texas Health Science Center at Houston @ |