|
||||||||||||||||||||
| |
| Phenotypic Information (metabolism pathway, cancer, disease, phenome) |
| |
| |
| Gene-Gene Network Information: Co-Expression Network, Interacting Genes & KEGG |
| |
|


| Gene Summary for PLA2G15 |
| Top |
| Phenotypic Information for PLA2G15(metabolism pathway, cancer, disease, phenome) |
| Cancer | CGAP: PLA2G15 |
| Familial Cancer Database: PLA2G15 | |
| * This gene is included in those cancer gene databases. |
|
|
|
|
|
| . | ||||||||||||||
Oncogene 1 | Significant driver gene in | |||||||||||||||||||
| cf) number; DB name 1 Oncogene; http://nar.oxfordjournals.org/content/35/suppl_1/D721.long, 2 Tumor Suppressor gene; https://bioinfo.uth.edu/TSGene/, 3 Cancer Gene Census; http://www.nature.com/nrc/journal/v4/n3/abs/nrc1299.html, 4 CancerGenes; http://nar.oxfordjournals.org/content/35/suppl_1/D721.long, 5 Network of Cancer Gene; http://ncg.kcl.ac.uk/index.php, 1Therapeutic Vulnerabilities in Cancer; http://cbio.mskcc.org/cancergenomics/statius/ |
| KEGG_GLYCEROPHOSPHOLIPID_METABOLISM | |
| Mutations for PLA2G15 |
| * Under tables are showing count per each tissue to give us broad intuition about tissue specific mutation patterns.You can go to the detailed page for each mutation database's web site. |
| There's no structural variation information in COSMIC data for this gene. |
| * From mRNA Sanger sequences, Chitars2.0 arranged chimeric transcripts. This table shows PLA2G15 related fusion information. |
| ID | Head Gene | Tail Gene | Accession | Gene_a | qStart_a | qEnd_a | Chromosome_a | tStart_a | tEnd_a | Gene_a | qStart_a | qEnd_a | Chromosome_a | tStart_a | tEnd_a |
| BQ000365 | PLA2G15 | 19 | 278 | 16 | 68294707 | 68294965 | APBB2 | 274 | 673 | 4 | 41015813 | 41016213 | |
| T11609 | SDF4 | 4 | 84 | 1 | 1159256 | 1159336 | PLA2G15 | 70 | 198 | 16 | 68294264 | 68294391 | |
| CN480826 | PLA2G15 | 17 | 564 | 16 | 68294413 | 68294961 | CD82 | 559 | 676 | 11 | 44638251 | 44638370 | |
| Top |
| There's no copy number variation information in COSMIC data for this gene. |
| Top |
|
 |
| Top |
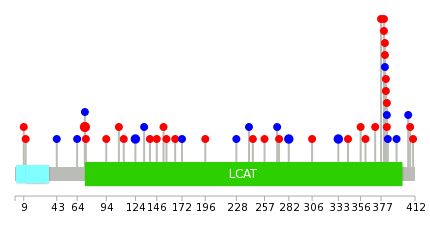
| Stat. for Non-Synonymous SNVs (# total SNVs=27) | (# total SNVs=13) |
 |  |
(# total SNVs=1) | (# total SNVs=2) |
 |  |
| Top |
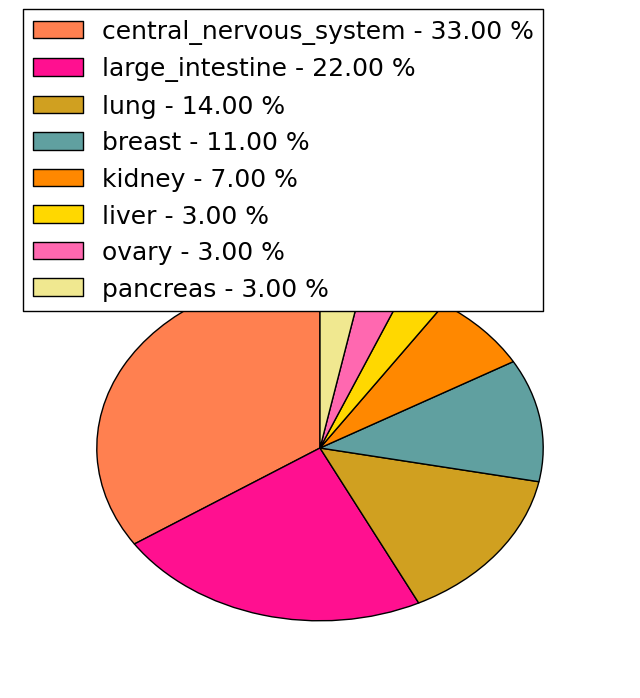
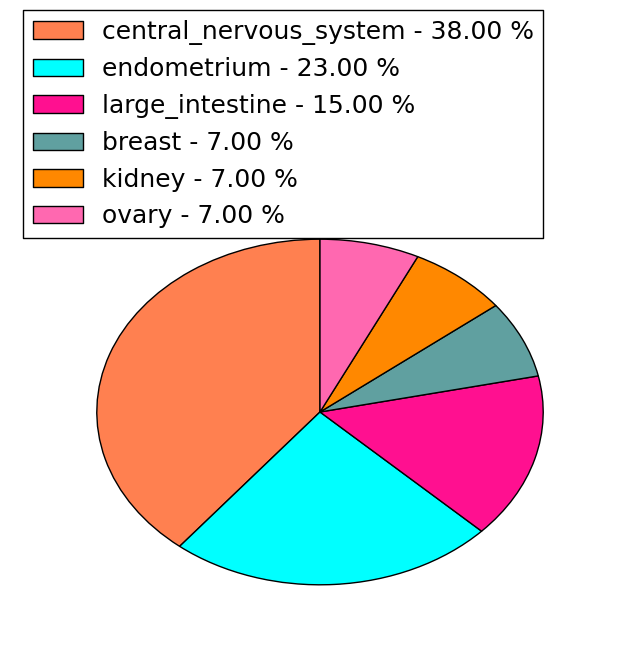
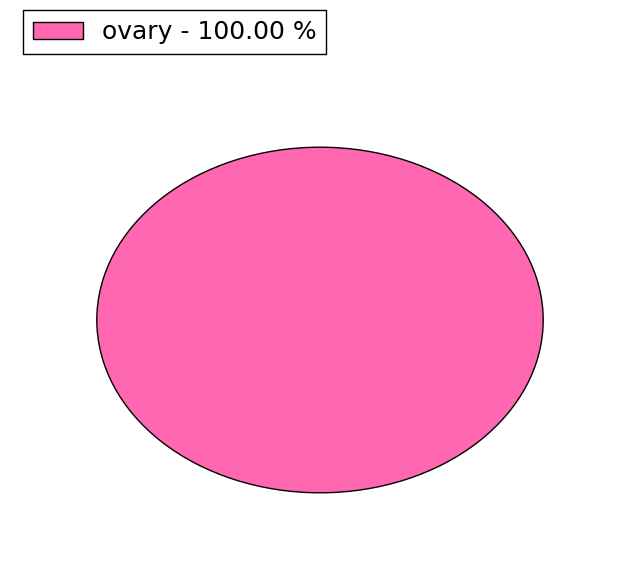
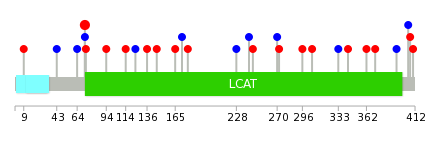
| * When you move the cursor on each content, you can see more deailed mutation information on the Tooltip. Those are primary_site,primary_histology,mutation(aa),pubmedID. |
| GRCh37 position | Mutation(aa) | Unique sampleID count |
| chr16:68283280-68283280 | p.Y72C | 3 |
| chr16:68288909-68288909 | p.L124L | 2 |
| chr16:68293167-68293167 | p.F282F | 2 |
| chr16:68293320-68293320 | p.G333G | 2 |
| chr16:68293463-68293463 | p.Q381R | 1 |
| chr16:68293549-68293549 | p.L410I | 1 |
| chr16:68289850-68289850 | p.A228A | 1 |
| chr16:68279354-68279354 | p.R9G | 1 |
| chr16:68293349-68293349 | p.Y343C | 1 |
| chr16:68293464-68293464 | p.Q381Q | 1 |
| Top |
|
 |
| Point Mutation/ Tissue ID | 1 | 2 | 3 | 4 | 5 | 6 | 7 | 8 | 9 | 10 | 11 | 12 | 13 | 14 | 15 | 16 | 17 | 18 | 19 | 20 |
| # sample | 2 | 7 | 1 | 3 | 2 | 1 | 1 | 2 | 1 | 8 | 2 | |||||||||
| # mutation | 2 | 5 | 1 | 3 | 2 | 1 | 1 | 2 | 1 | 8 | 2 | |||||||||
| nonsynonymous SNV | 1 | 4 | 3 | 1 | 1 | 1 | 1 | 5 | ||||||||||||
| synonymous SNV | 1 | 1 | 1 | 1 | 1 | 1 | 3 | 2 |
| cf) Tissue ID; Tissue type (1; BLCA[Bladder Urothelial Carcinoma], 2; BRCA[Breast invasive carcinoma], 3; CESC[Cervical squamous cell carcinoma and endocervical adenocarcinoma], 4; COAD[Colon adenocarcinoma], 5; GBM[Glioblastoma multiforme], 6; Glioma Low Grade, 7; HNSC[Head and Neck squamous cell carcinoma], 8; KICH[Kidney Chromophobe], 9; KIRC[Kidney renal clear cell carcinoma], 10; KIRP[Kidney renal papillary cell carcinoma], 11; LAML[Acute Myeloid Leukemia], 12; LUAD[Lung adenocarcinoma], 13; LUSC[Lung squamous cell carcinoma], 14; OV[Ovarian serous cystadenocarcinoma ], 15; PAAD[Pancreatic adenocarcinoma], 16; PRAD[Prostate adenocarcinoma], 17; SKCM[Skin Cutaneous Melanoma], 18:STAD[Stomach adenocarcinoma], 19:THCA[Thyroid carcinoma], 20:UCEC[Uterine Corpus Endometrial Carcinoma]) |
| Top |
| * We represented just top 10 SNVs. When you move the cursor on each content, you can see more deailed mutation information on the Tooltip. Those are primary_site, primary_histology, mutation(aa), pubmedID. |
| Genomic Position | Mutation(aa) | Unique sampleID count |
| chr16:68283280 | p.Y72C | 3 |
| chr16:68289217 | p.S136F | 1 |
| chr16:68293320 | p.I393I | 1 |
| chr16:68279354 | p.V146M | 1 |
| chr16:68289275 | p.L405L | 1 |
| chr16:68293349 | p.R165Q | 1 |
| chr16:68283194 | p.R407C | 1 |
| chr16:68289682 | p.P172P | 1 |
| chr16:68293405 | p.L410I | 1 |
| chr16:68283257 | p.R178C | 1 |
| * Copy number data were extracted from TCGA using R package TCGA-Assembler. The URLs of all public data files on TCGA DCC data server were gathered on Jan-05-2015. Function ProcessCNAData in TCGA-Assembler package was used to obtain gene-level copy number value which is calculated as the average copy number of the genomic region of a gene. |
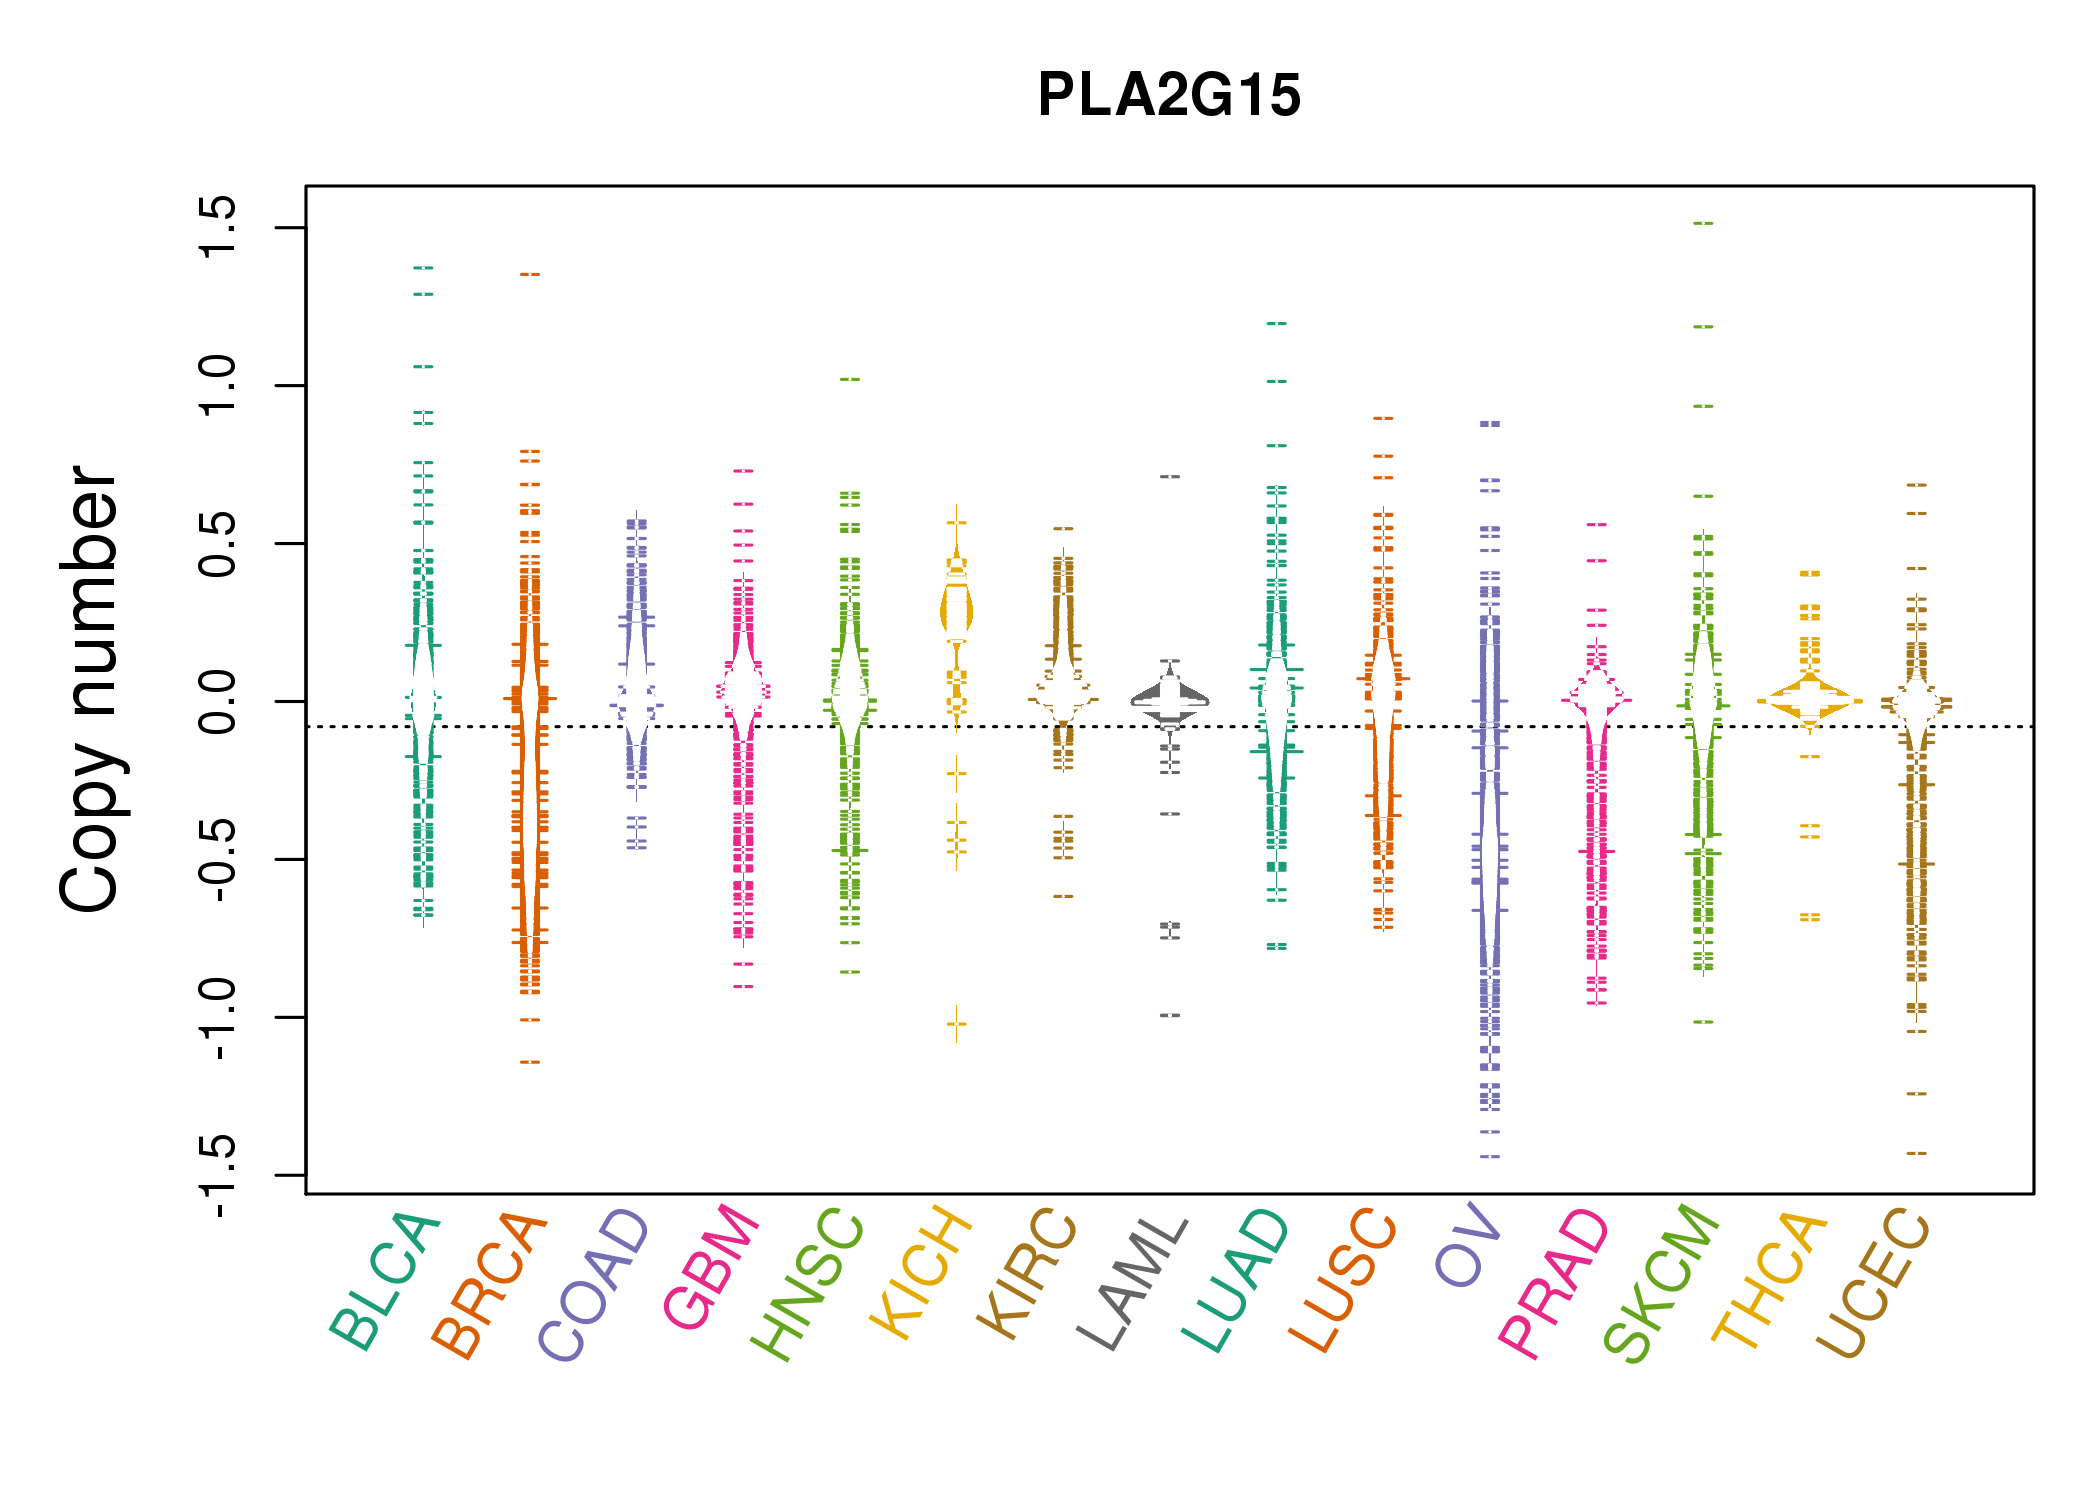 |
| cf) Tissue ID[Tissue type]: BLCA[Bladder Urothelial Carcinoma], BRCA[Breast invasive carcinoma], CESC[Cervical squamous cell carcinoma and endocervical adenocarcinoma], COAD[Colon adenocarcinoma], GBM[Glioblastoma multiforme], Glioma Low Grade, HNSC[Head and Neck squamous cell carcinoma], KICH[Kidney Chromophobe], KIRC[Kidney renal clear cell carcinoma], KIRP[Kidney renal papillary cell carcinoma], LAML[Acute Myeloid Leukemia], LUAD[Lung adenocarcinoma], LUSC[Lung squamous cell carcinoma], OV[Ovarian serous cystadenocarcinoma ], PAAD[Pancreatic adenocarcinoma], PRAD[Prostate adenocarcinoma], SKCM[Skin Cutaneous Melanoma], STAD[Stomach adenocarcinoma], THCA[Thyroid carcinoma], UCEC[Uterine Corpus Endometrial Carcinoma] |
| Top |
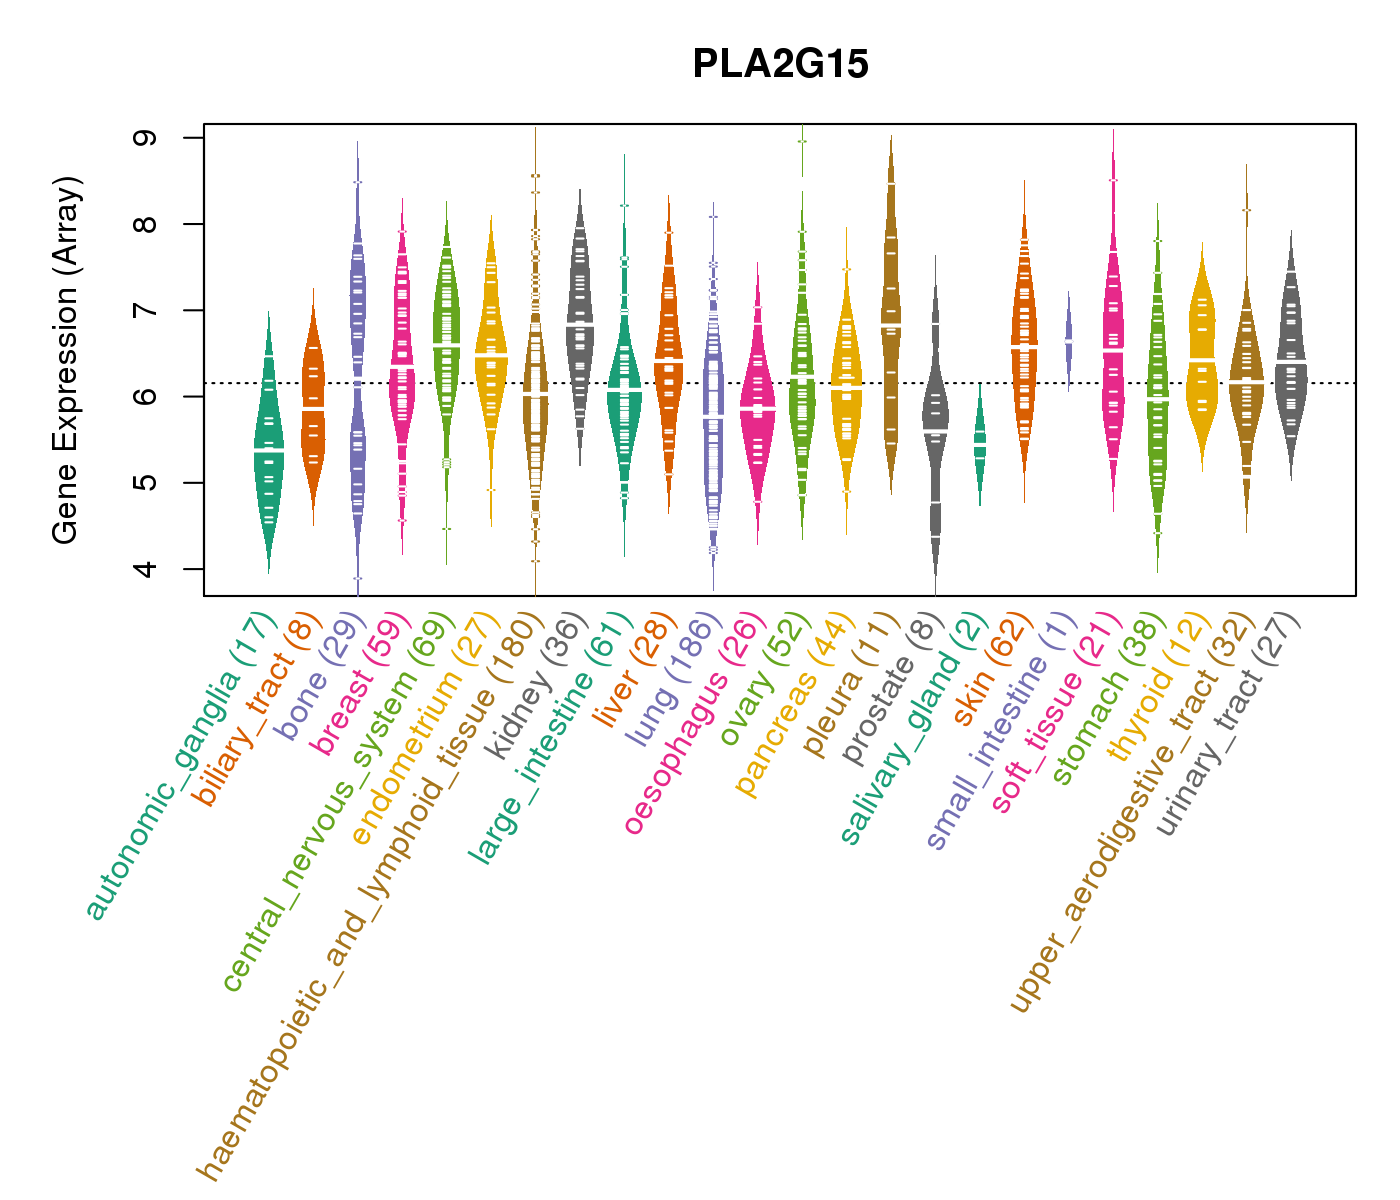
| Gene Expression for PLA2G15 |
| * CCLE gene expression data were extracted from CCLE_Expression_Entrez_2012-10-18.res: Gene-centric RMA-normalized mRNA expression data. |
 |
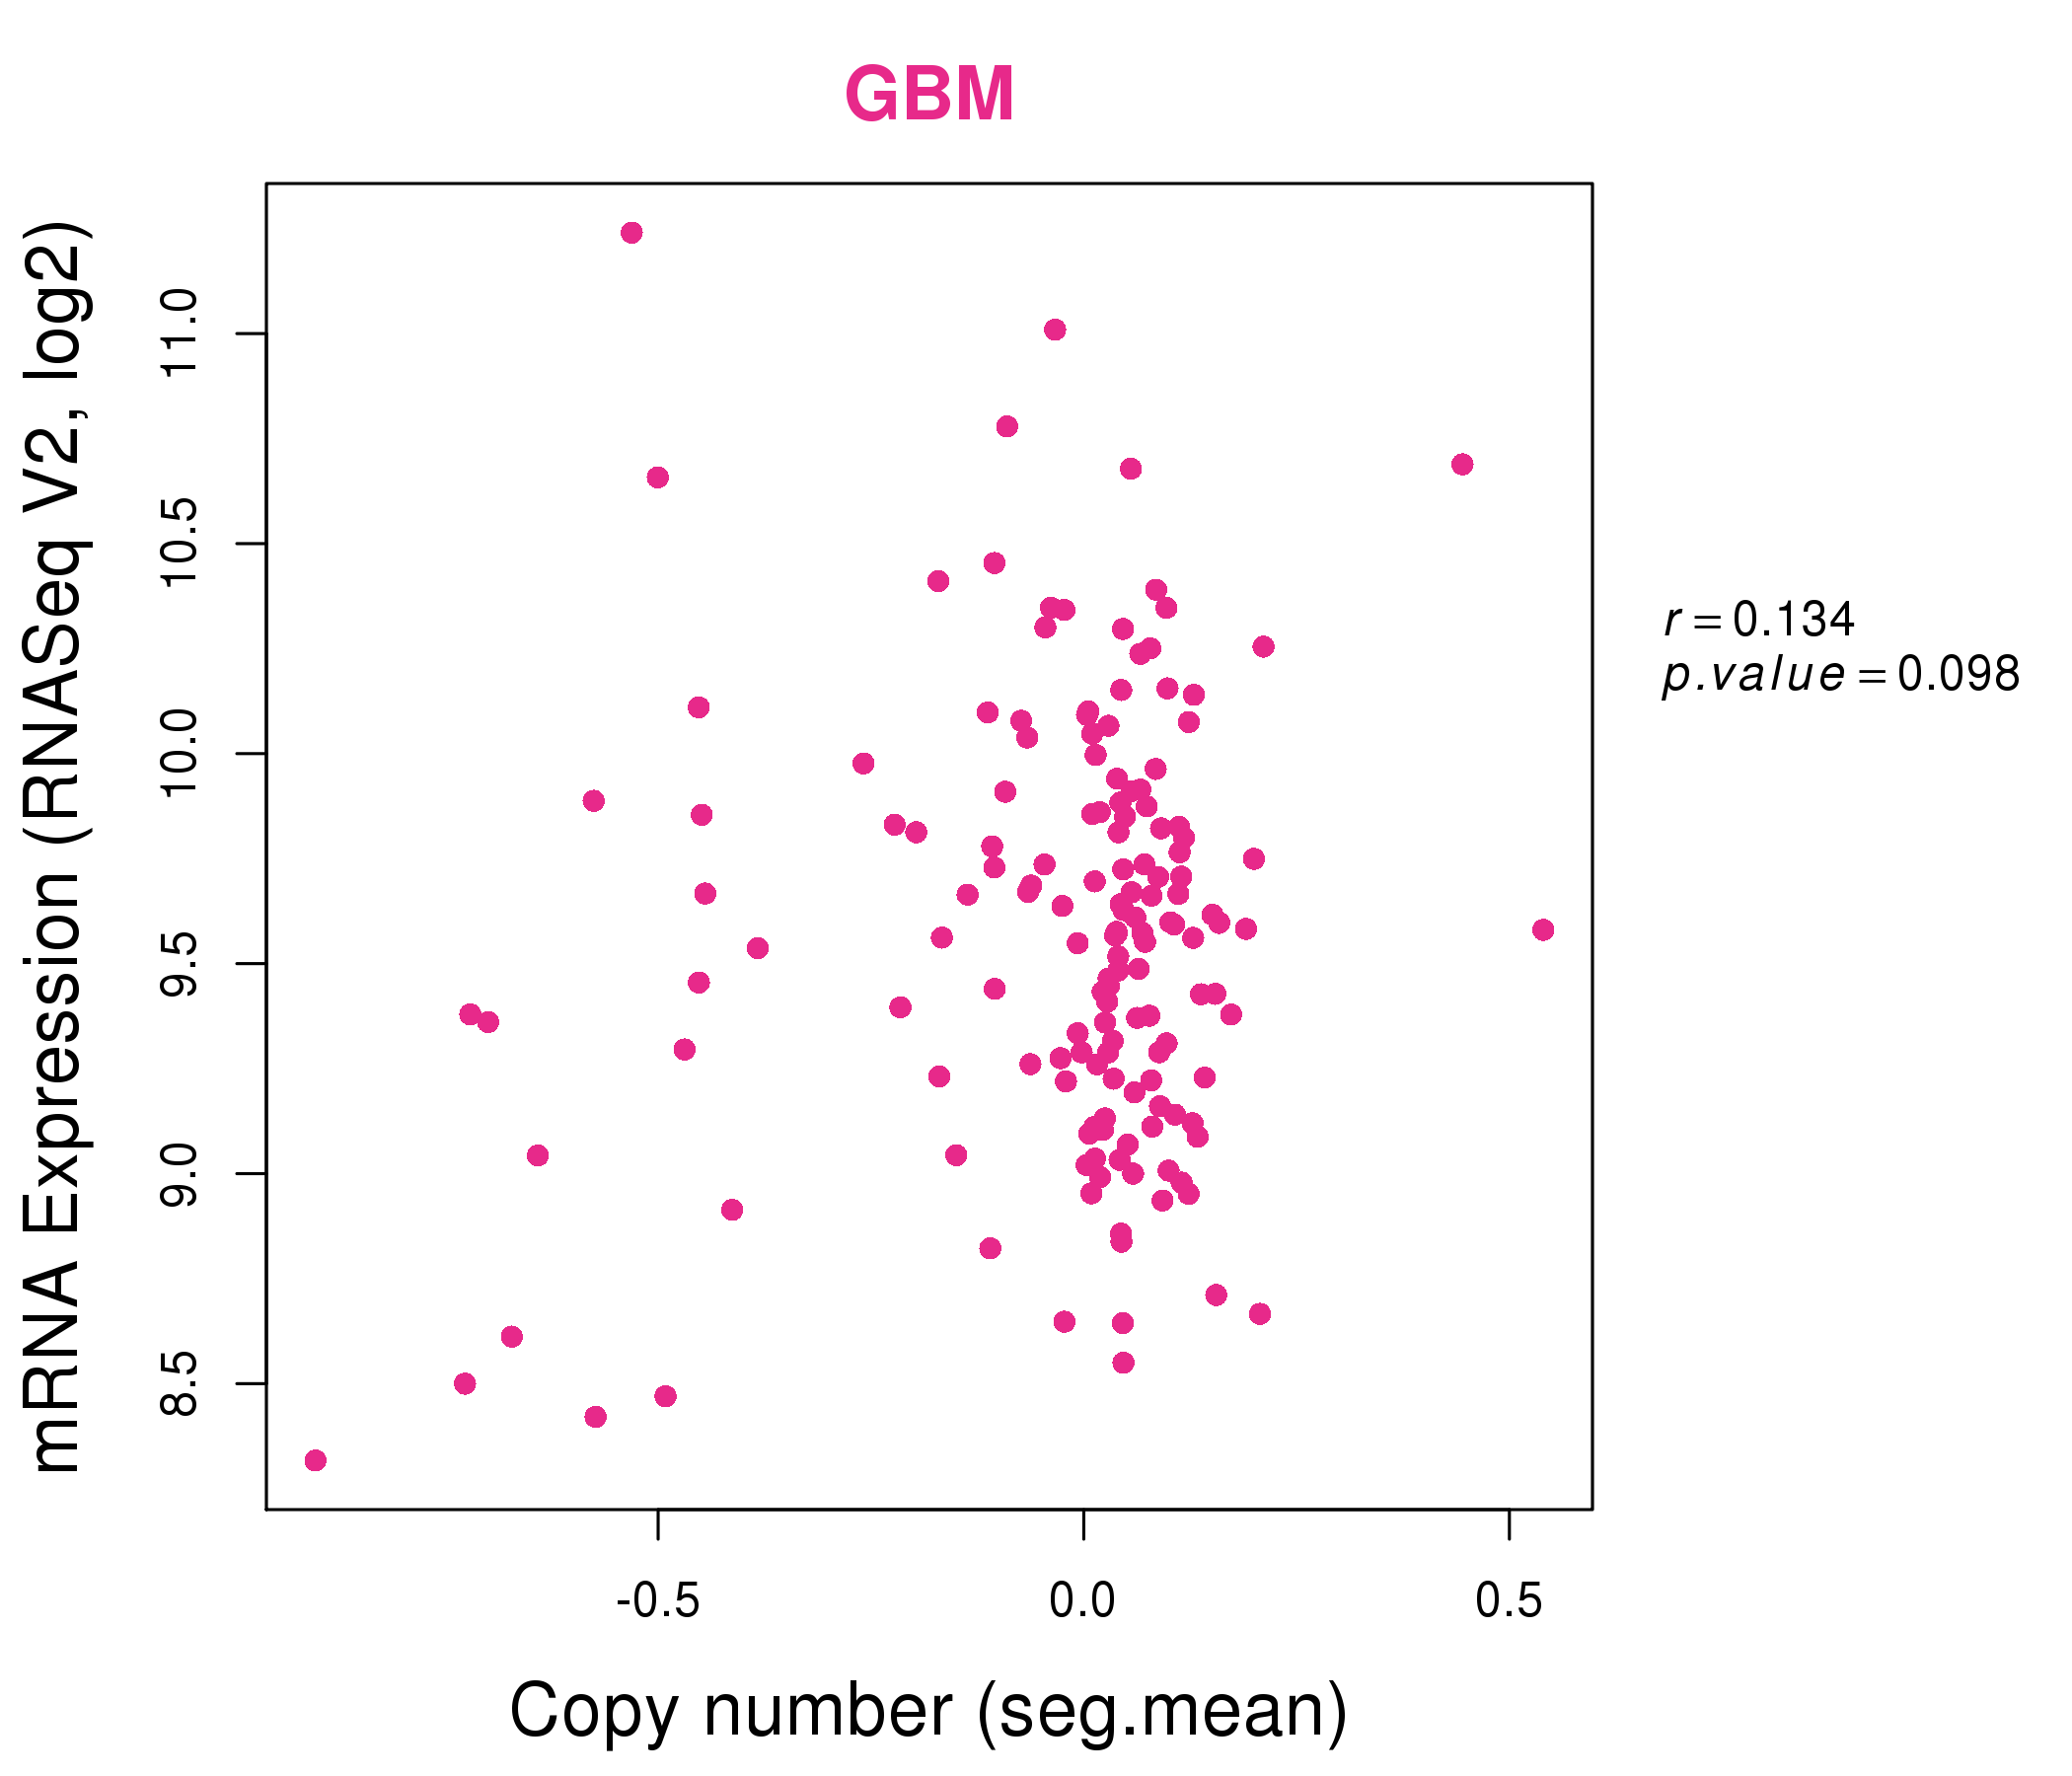
| * Normalized gene expression data of RNASeqV2 was extracted from TCGA using R package TCGA-Assembler. The URLs of all public data files on TCGA DCC data server were gathered at Jan-05-2015. Only eight cancer types have enough normal control samples for differential expression analysis. (t test, adjusted p<0.05 (using Benjamini-Hochberg FDR)) |
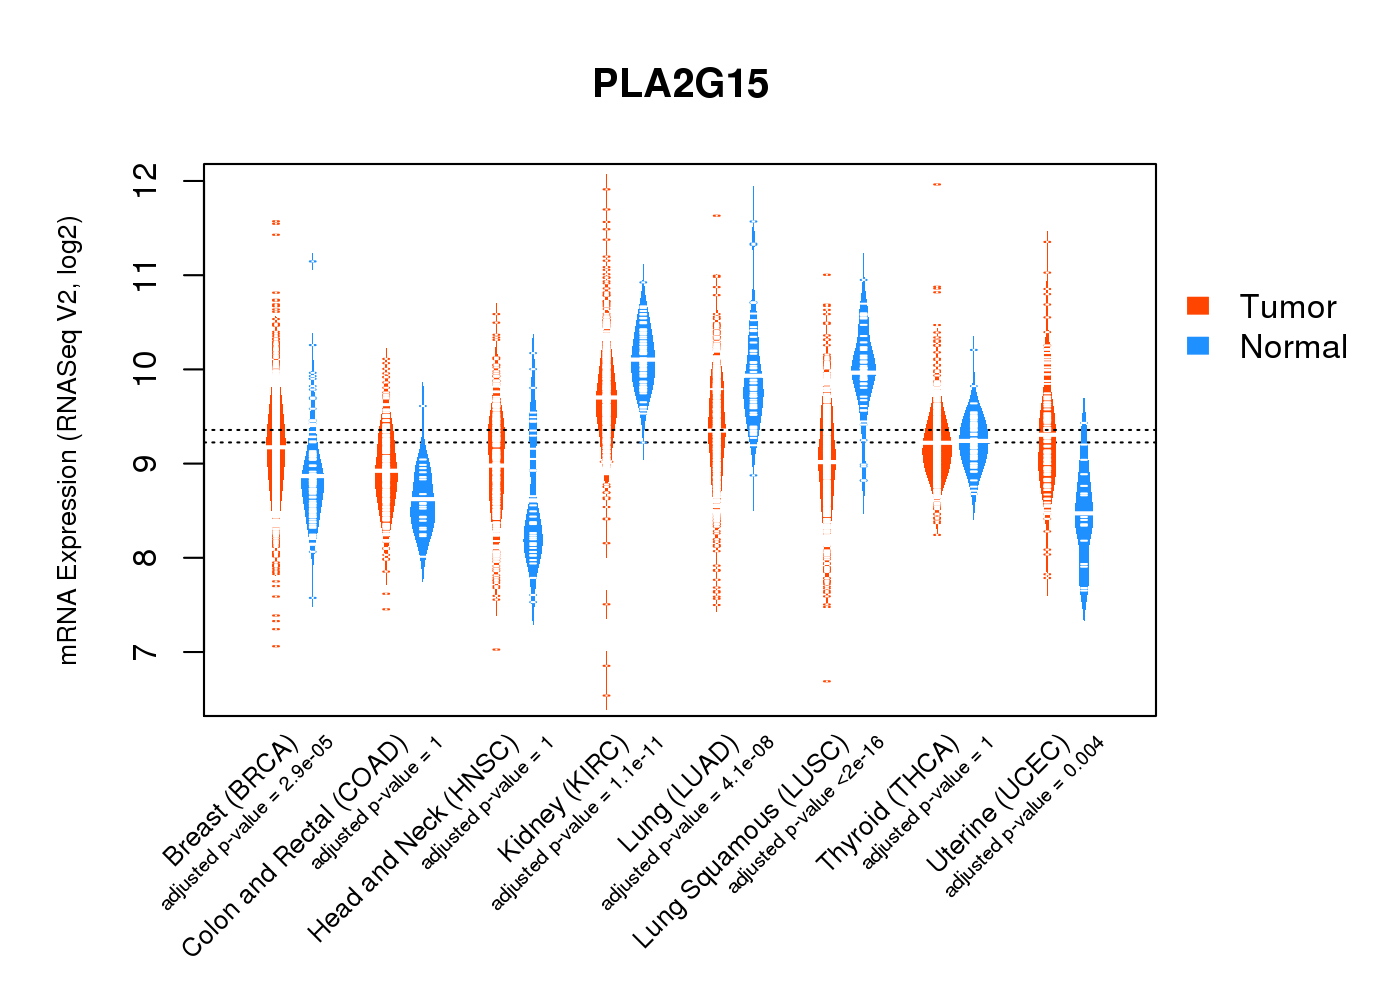 |
| Top |
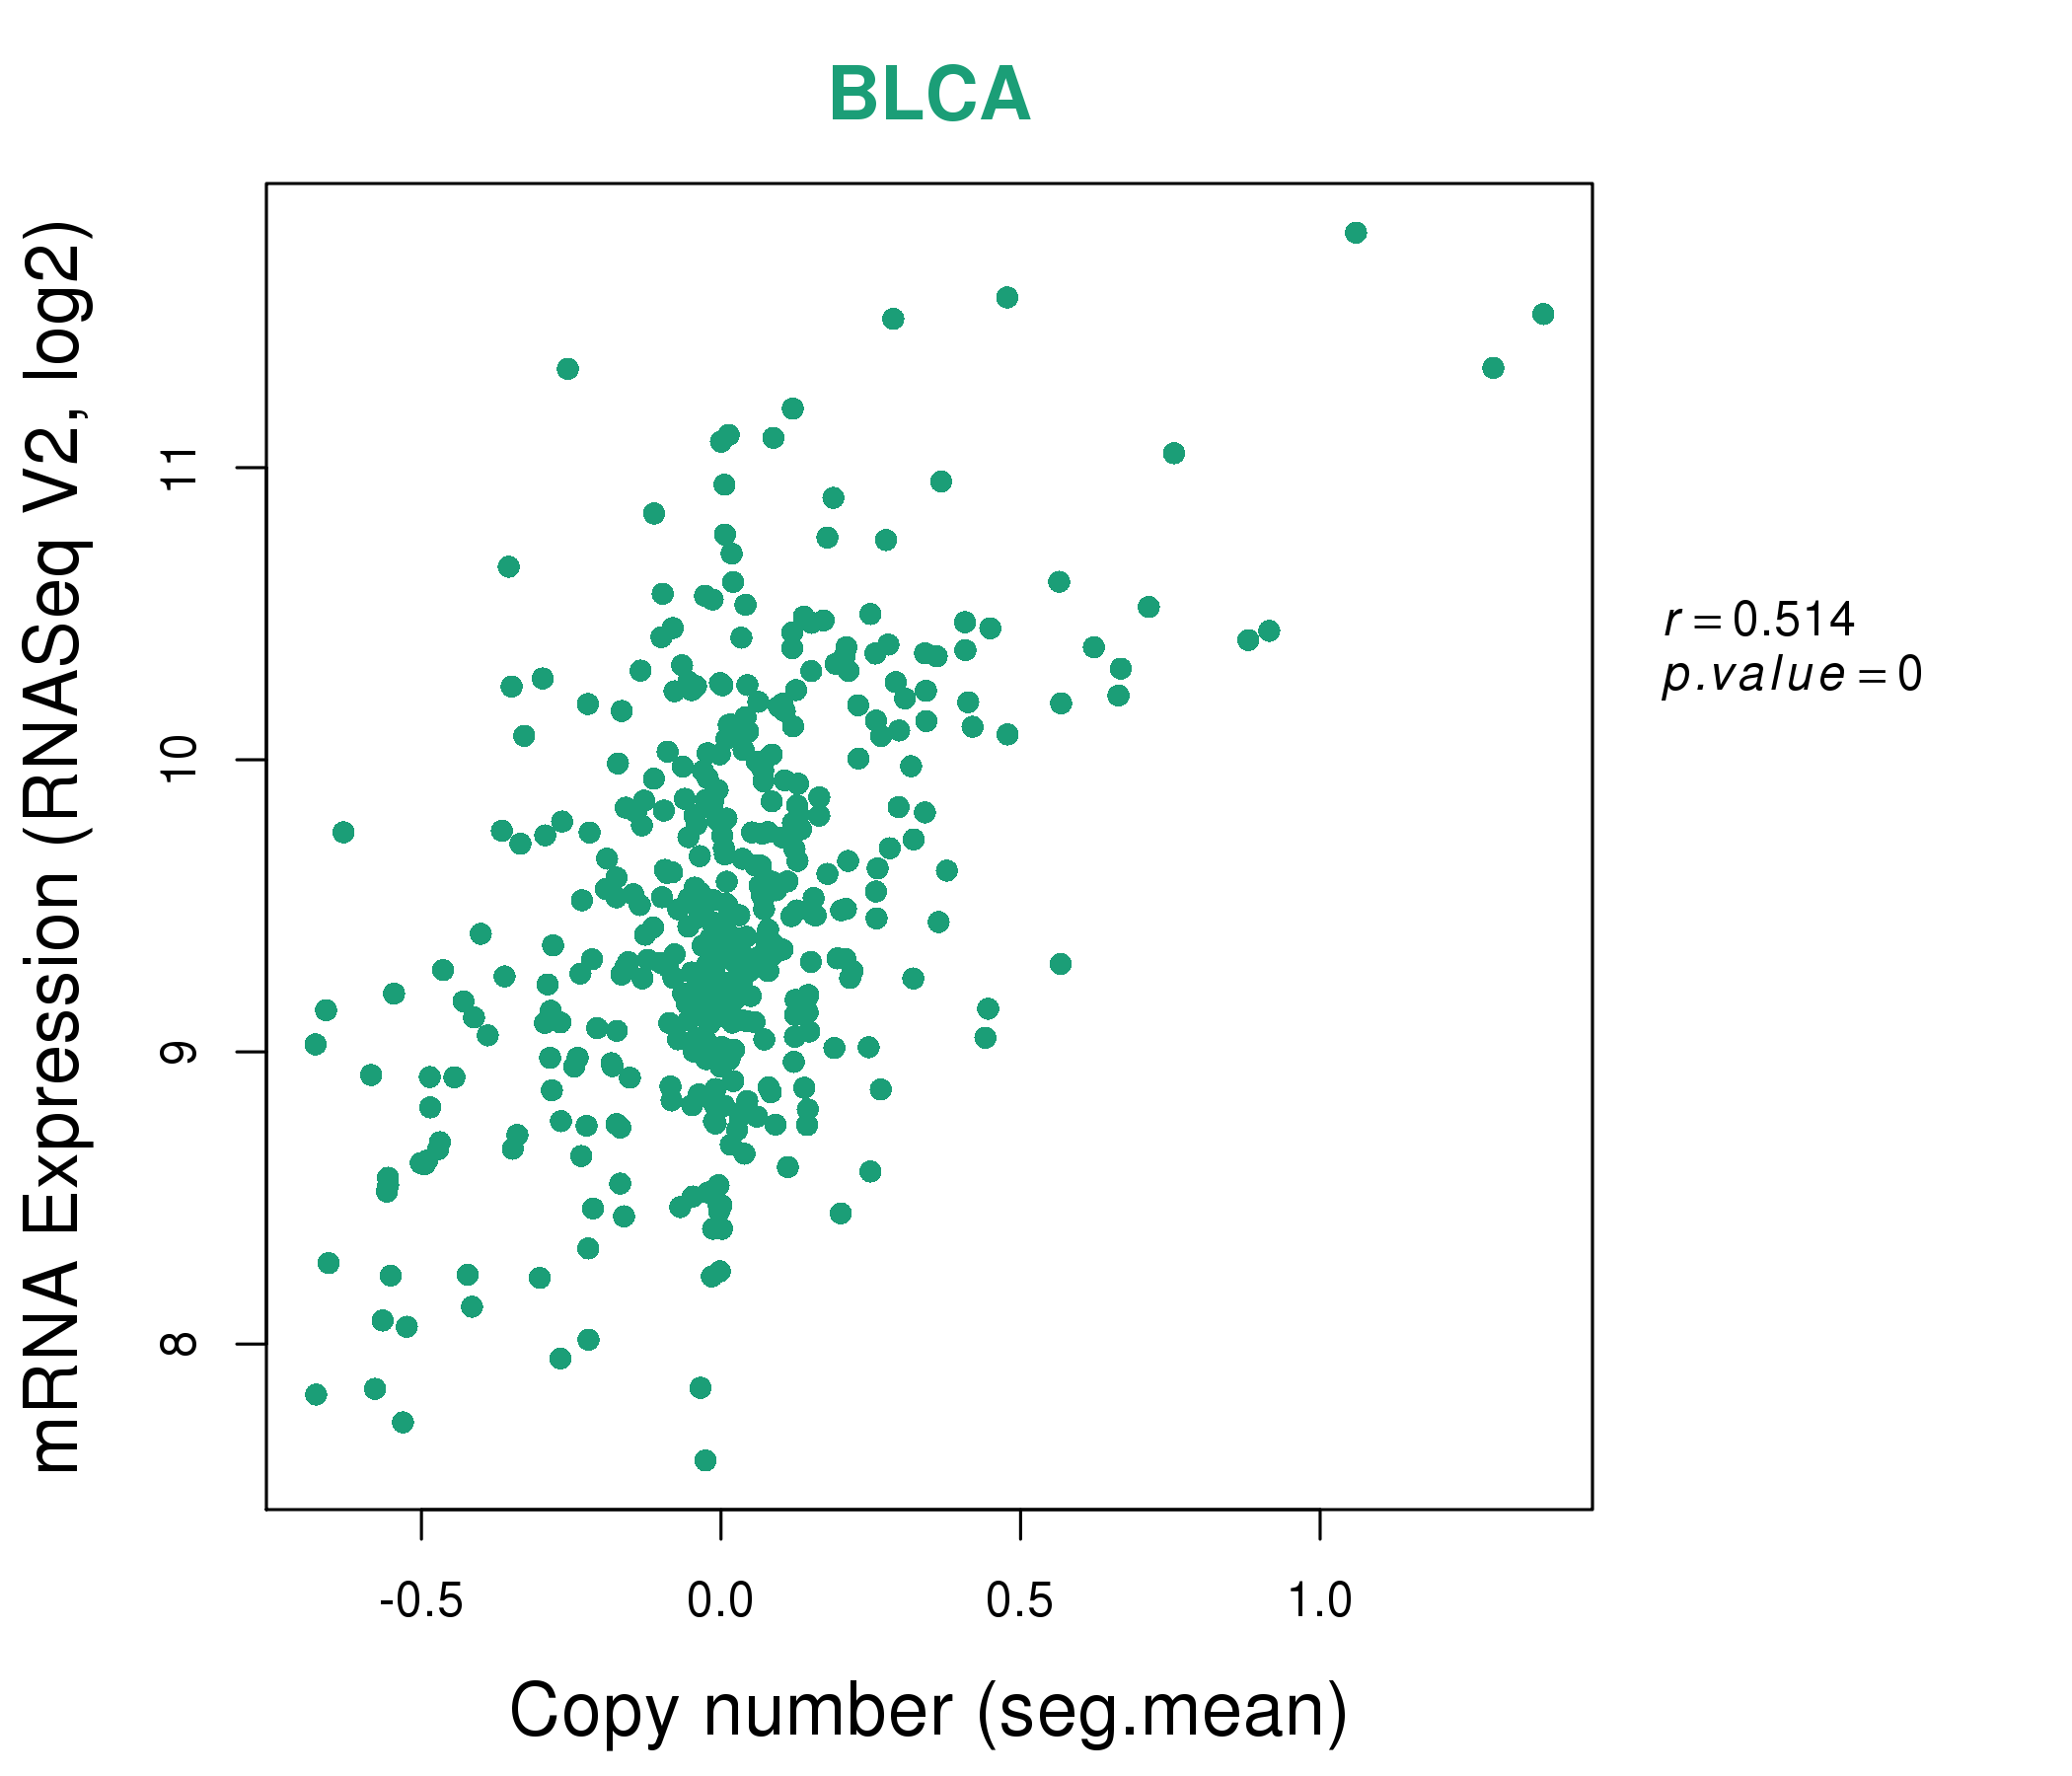
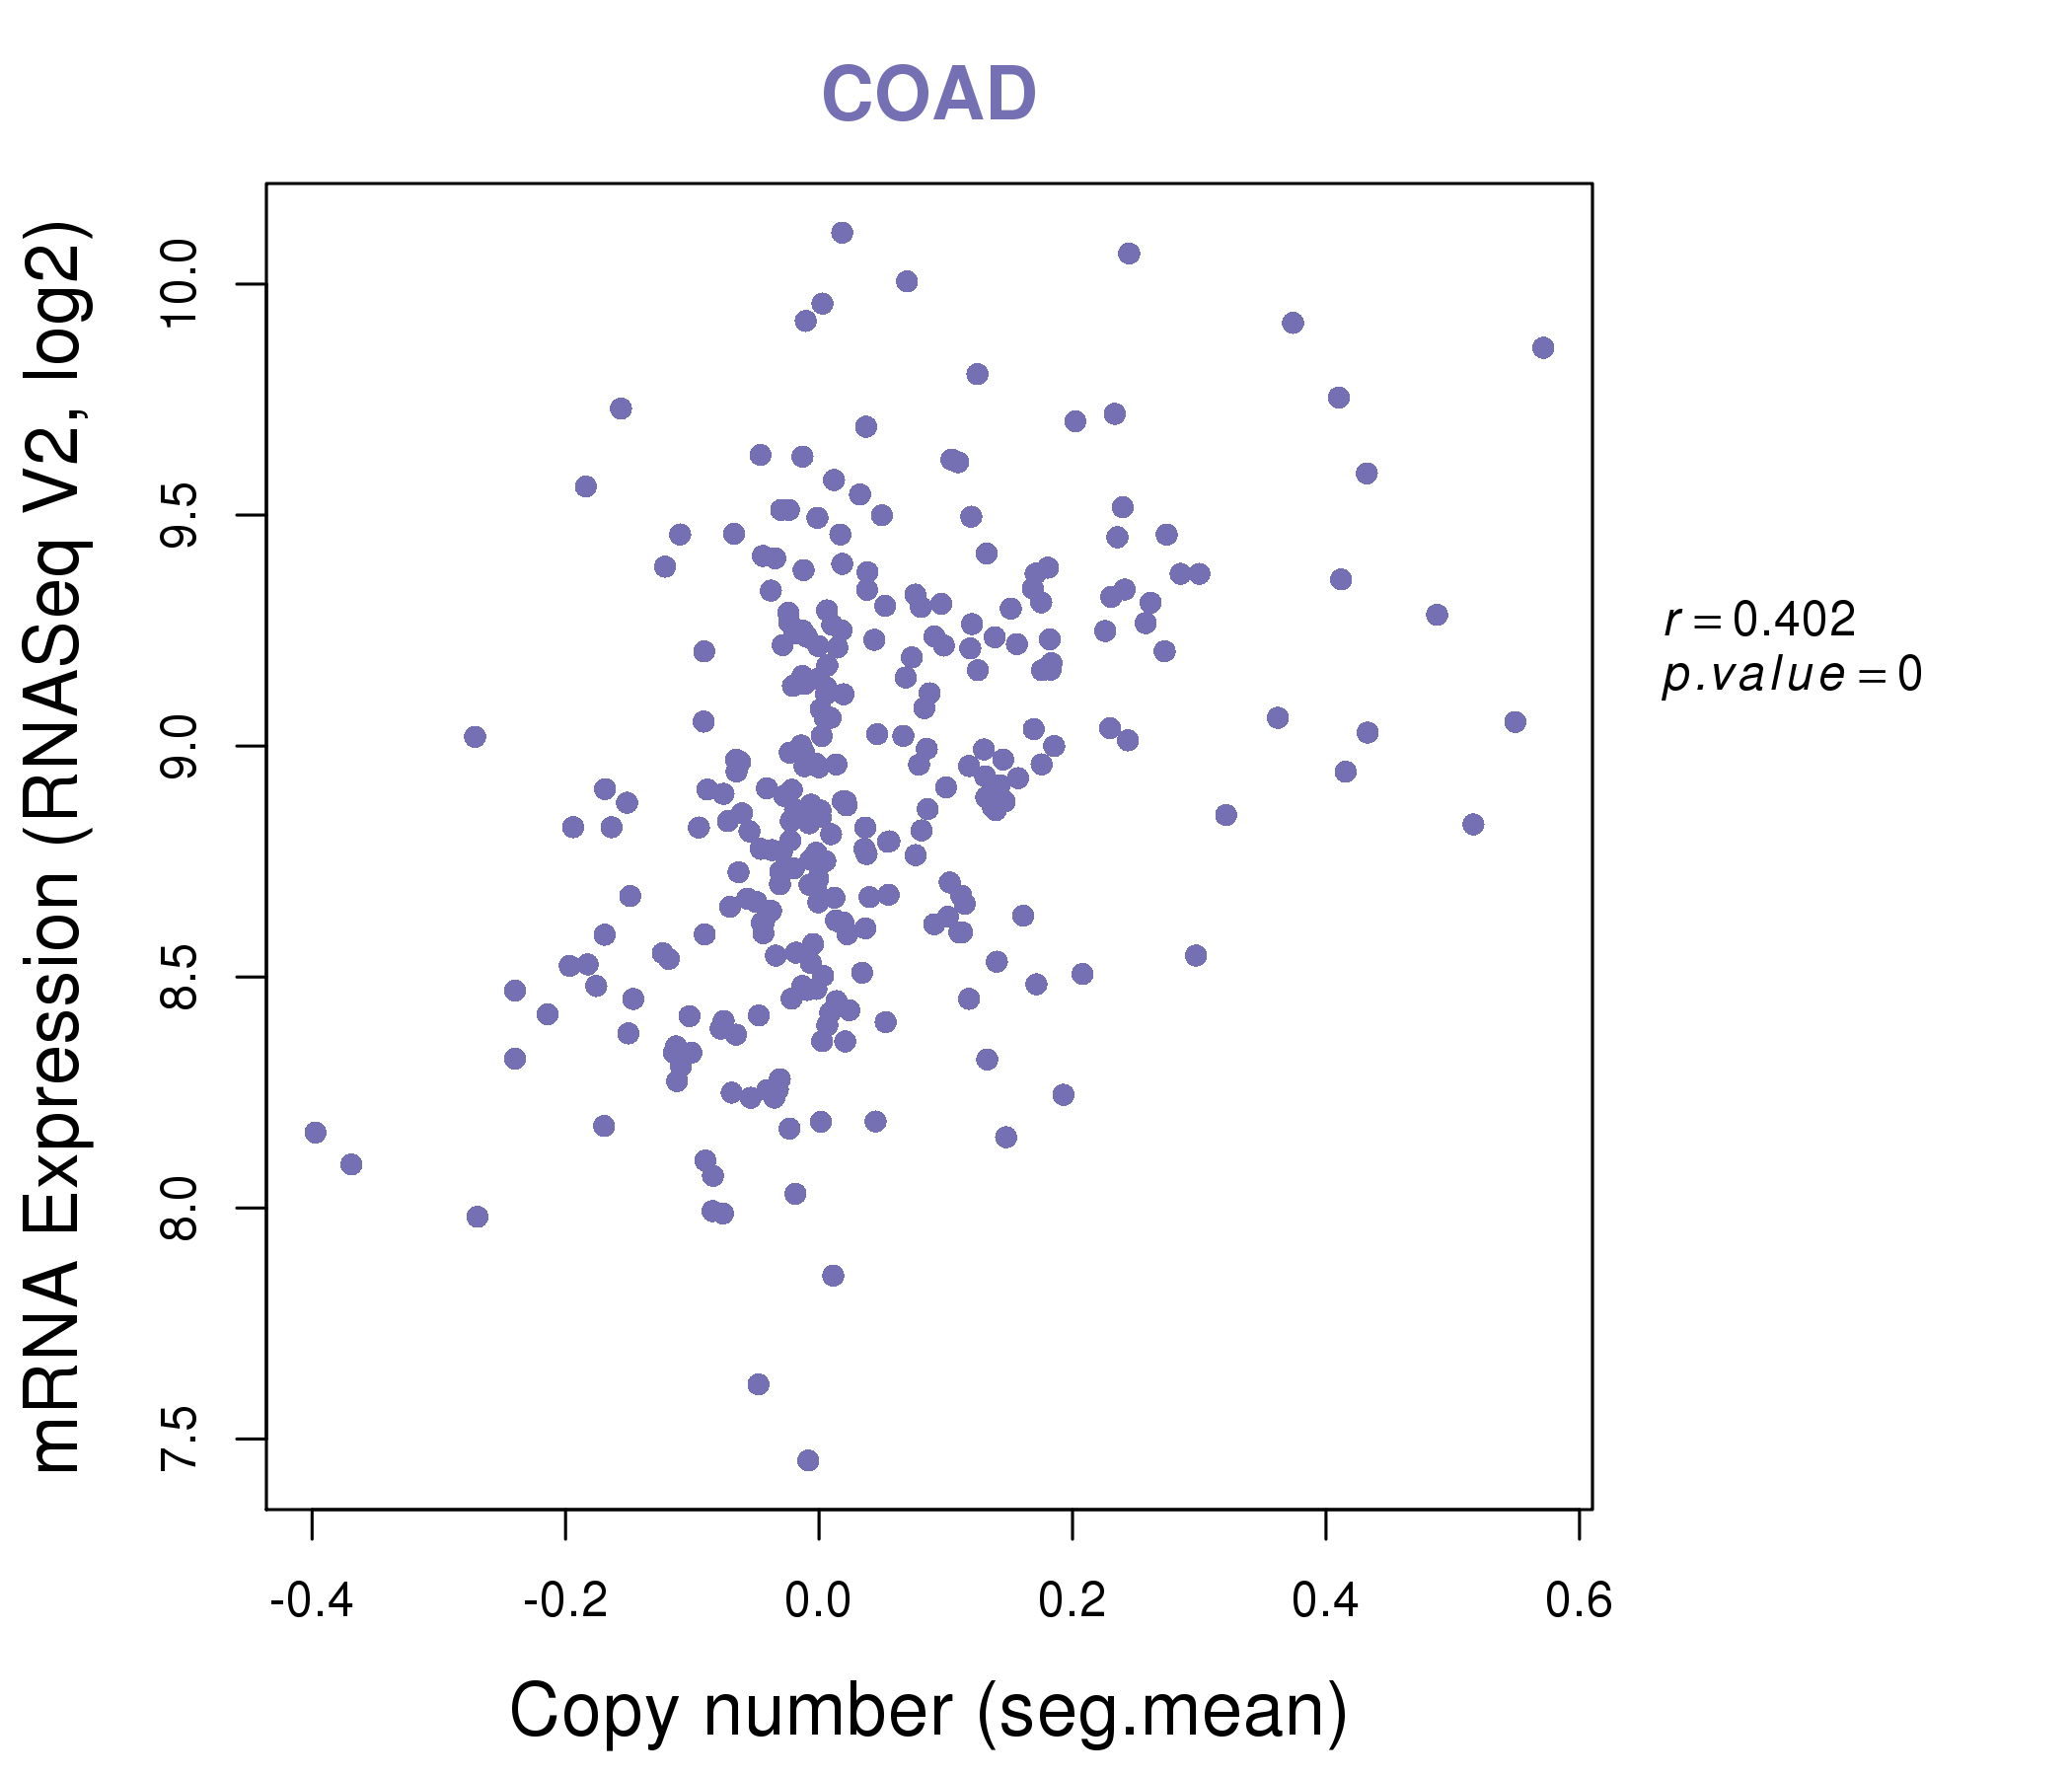
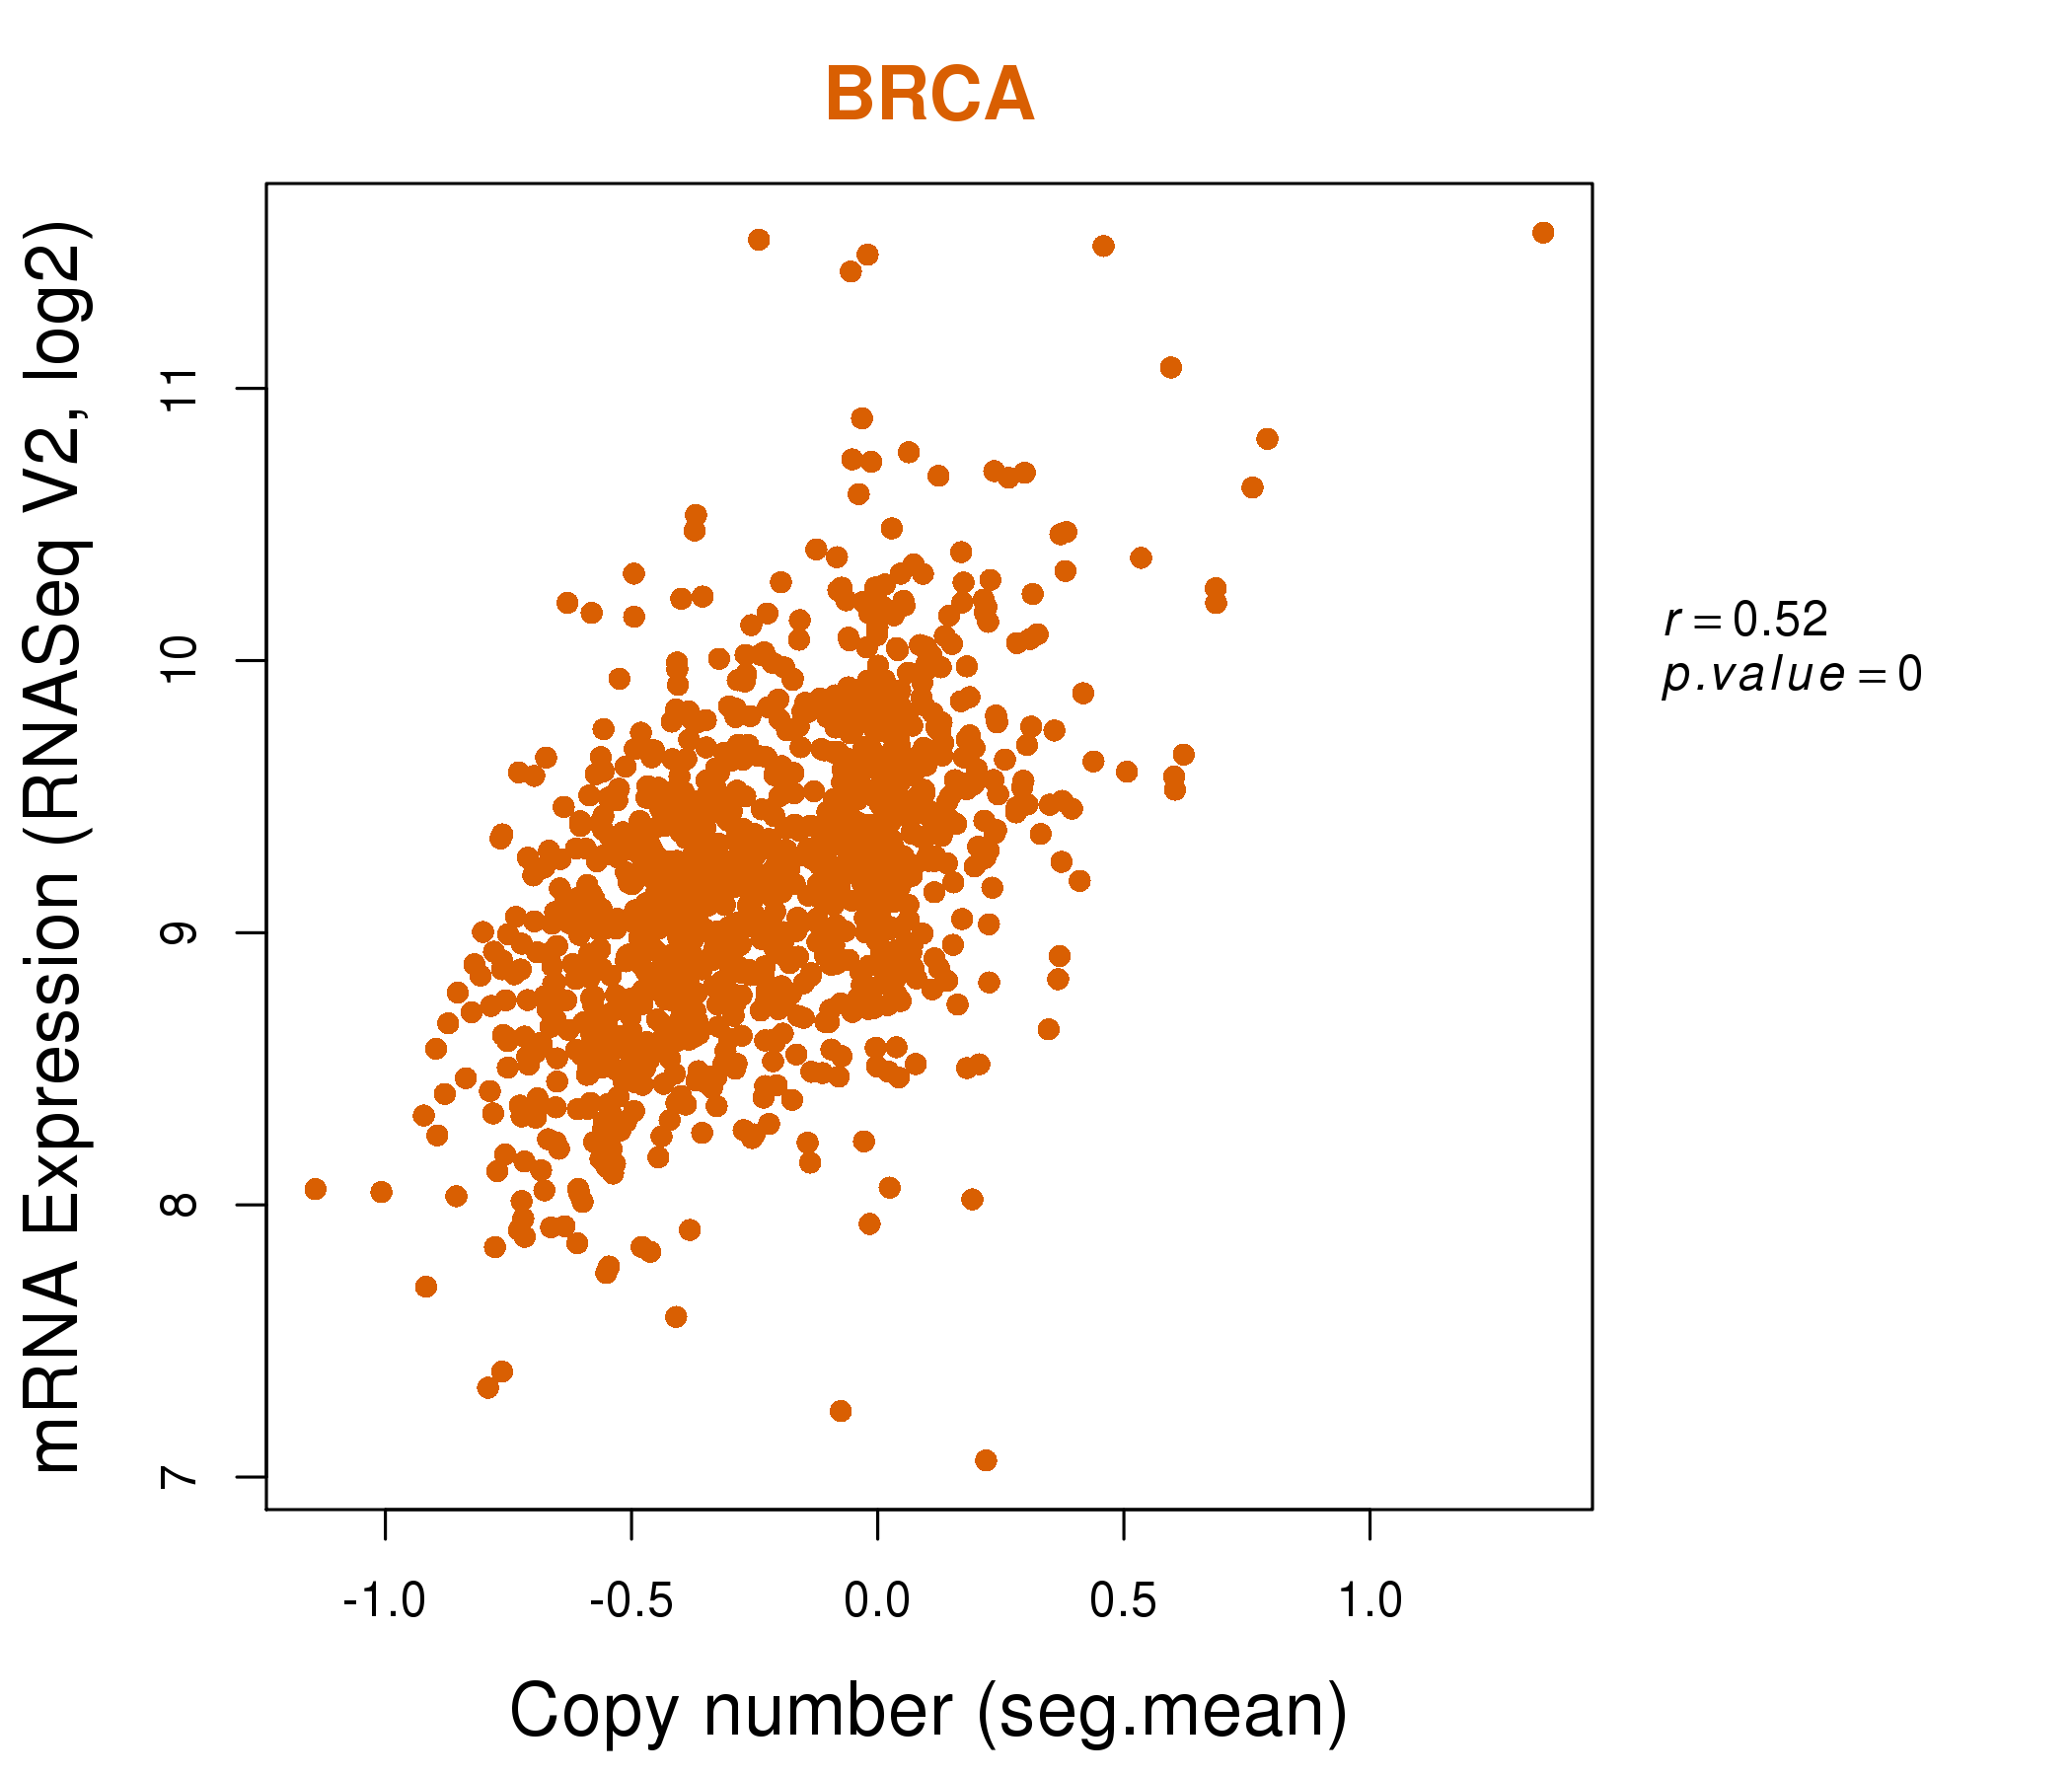
| * This plots show the correlation between CNV and gene expression. |
: Open all plots for all cancer types
 |
|
 |
|
| Top |
| Gene-Gene Network Information |
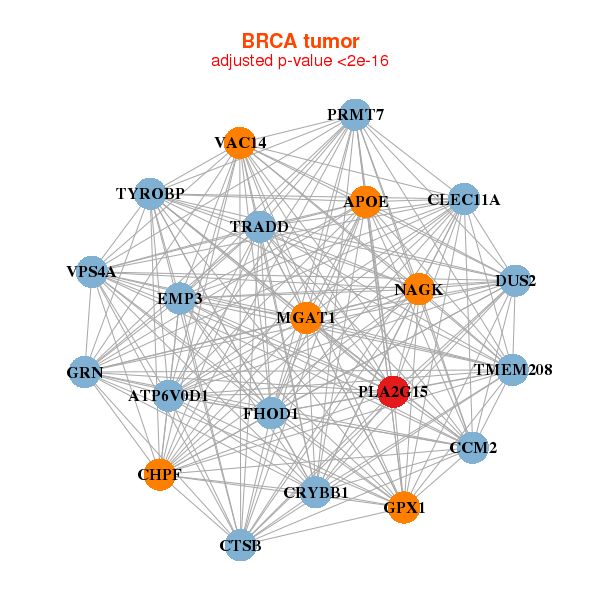
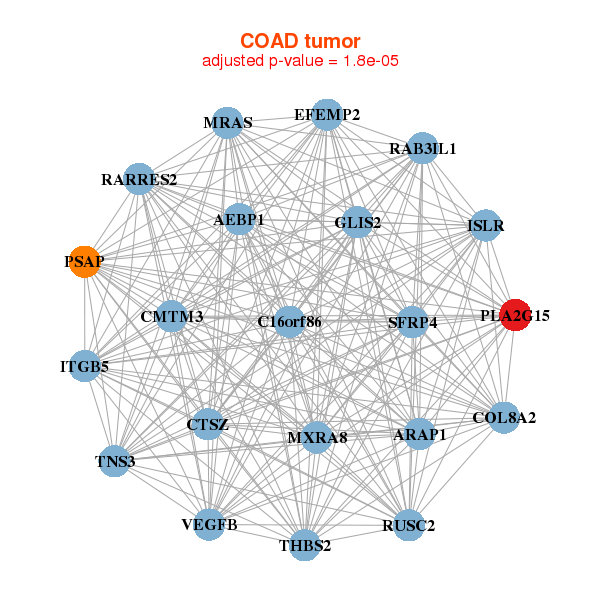
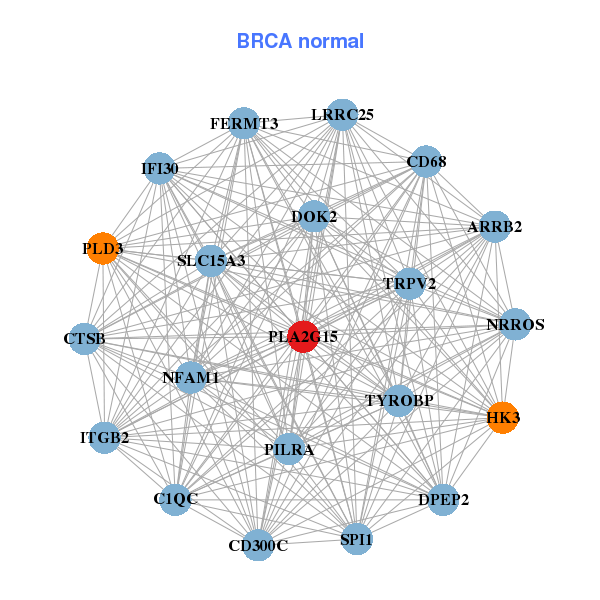
| * Co-Expression network figures were drawn using R package igraph. Only the top 20 genes with the highest correlations were shown. Red circle: input gene, orange circle: cell metabolism gene, sky circle: other gene |
: Open all plots for all cancer types
 |
| ||||
| APOE,ATP6V0D1,CCM2,CHPF,CLEC11A,CRYBB1,CTSB, DUS2,EMP3,FHOD1,GPX1,GRN,MGAT1,NAGK, PLA2G15,PRMT7,TMEM208,TRADD,TYROBP,VAC14,VPS4A | ARRB2,C1QC,CD300C,CD68,CTSB,DOK2,DPEP2, FERMT3,HK3,IFI30,ITGB2,LRRC25,NRROS,NFAM1, PILRA,PLA2G15,PLD3,SLC15A3,SPI1,TRPV2,TYROBP | ||||
 |
| ||||
| AEBP1,ARAP1,C16orf86,CMTM3,COL8A2,CTSZ,EFEMP2, GLIS2,ISLR,ITGB5,MRAS,MXRA8,PLA2G15,PSAP, RAB3IL1,RARRES2,RUSC2,SFRP4,THBS2,TNS3,VEGFB | C1QA,C2,M1AP,C3AR1,CD4,CMKLR1,CSF1R, CYTH4,DISC1,GGTA1P,GIMAP1,LAIR1,NRROS,MAFB, NFAM1,NPL,PLA2G15,RASGRP4,SIGLEC1,TMEM86A,TRIM50 |
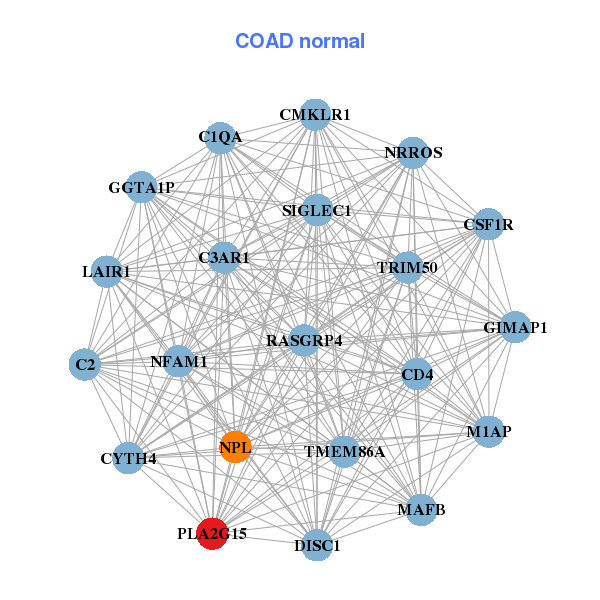
| * Co-Expression network figures were drawn using R package igraph. Only the top 20 genes with the highest correlations were shown. Red circle: input gene, orange circle: cell metabolism gene, sky circle: other gene |
: Open all plots for all cancer types
| Top |
: Open all interacting genes' information including KEGG pathway for all interacting genes from DAVID
| Top |
| Pharmacological Information for PLA2G15 |
| DB Category | DB Name | DB's ID and Url link |
| * Gene Centered Interaction Network. |
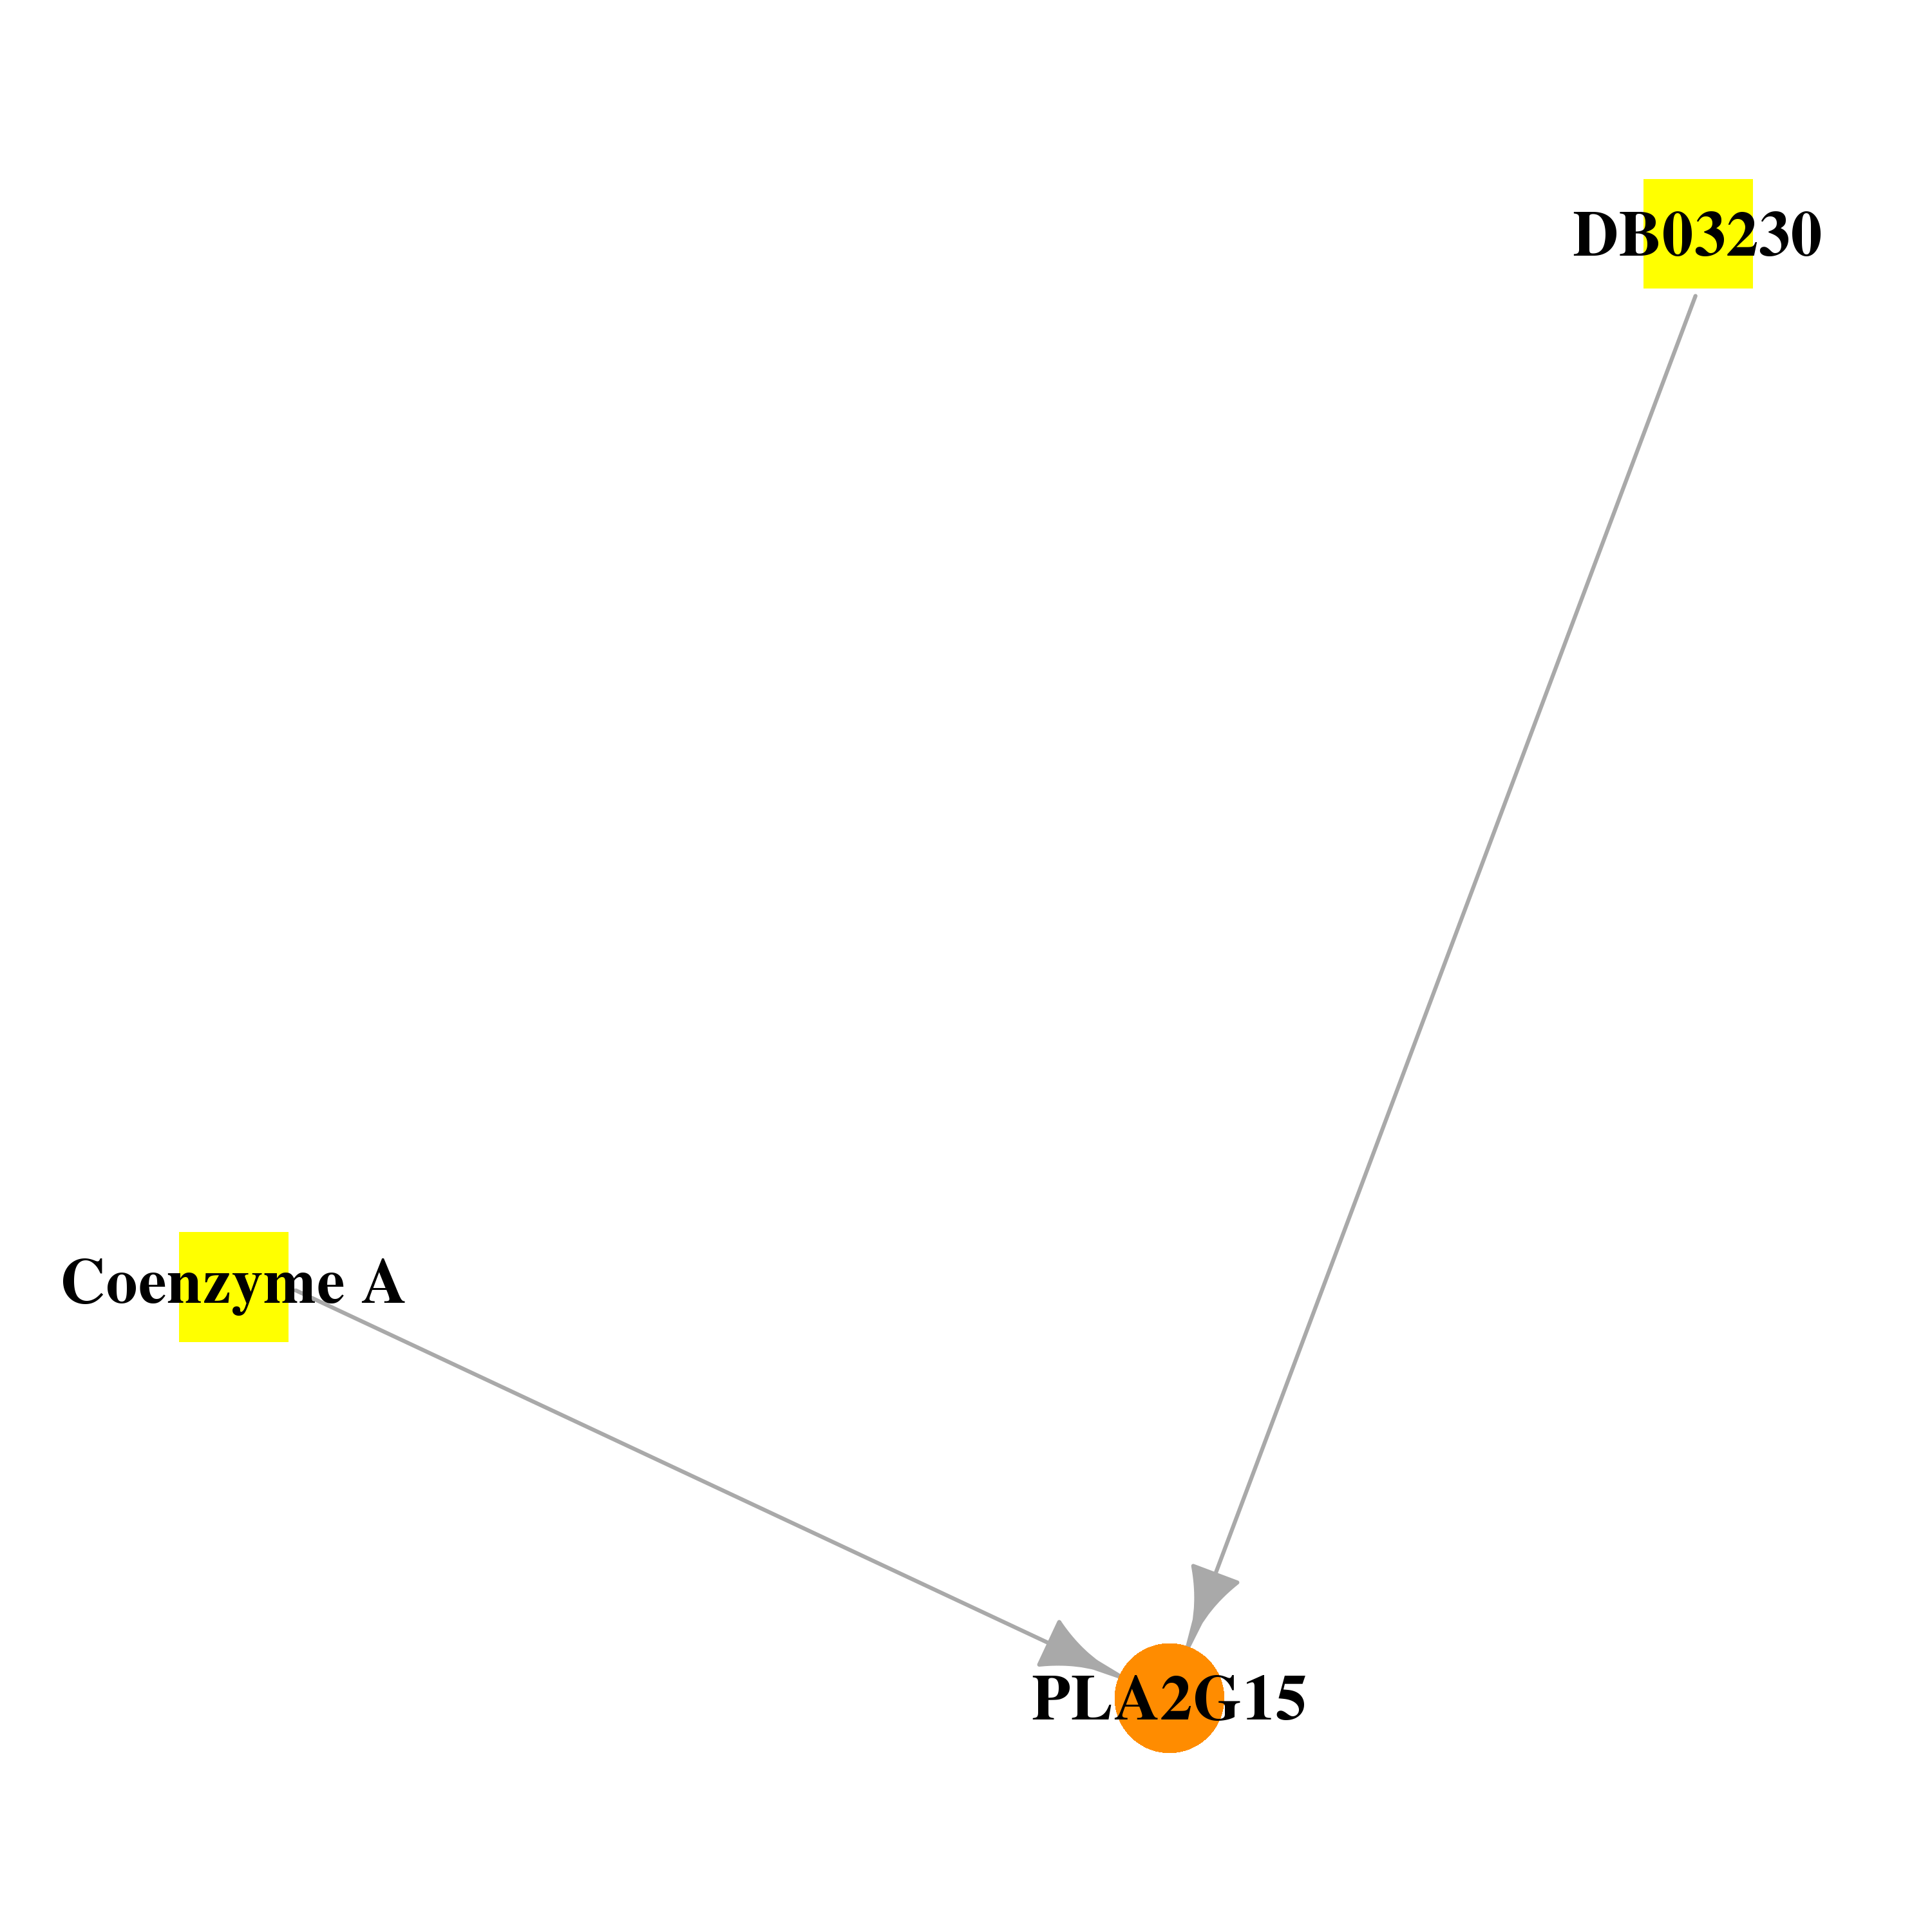 |
| * Drug Centered Interaction Network. |
| DrugBank ID | Target Name | Drug Groups | Generic Name | Drug Centered Network | Drug Structure |
| DB01992 | phospholipase A2, group XV | experimental | Coenzyme A | 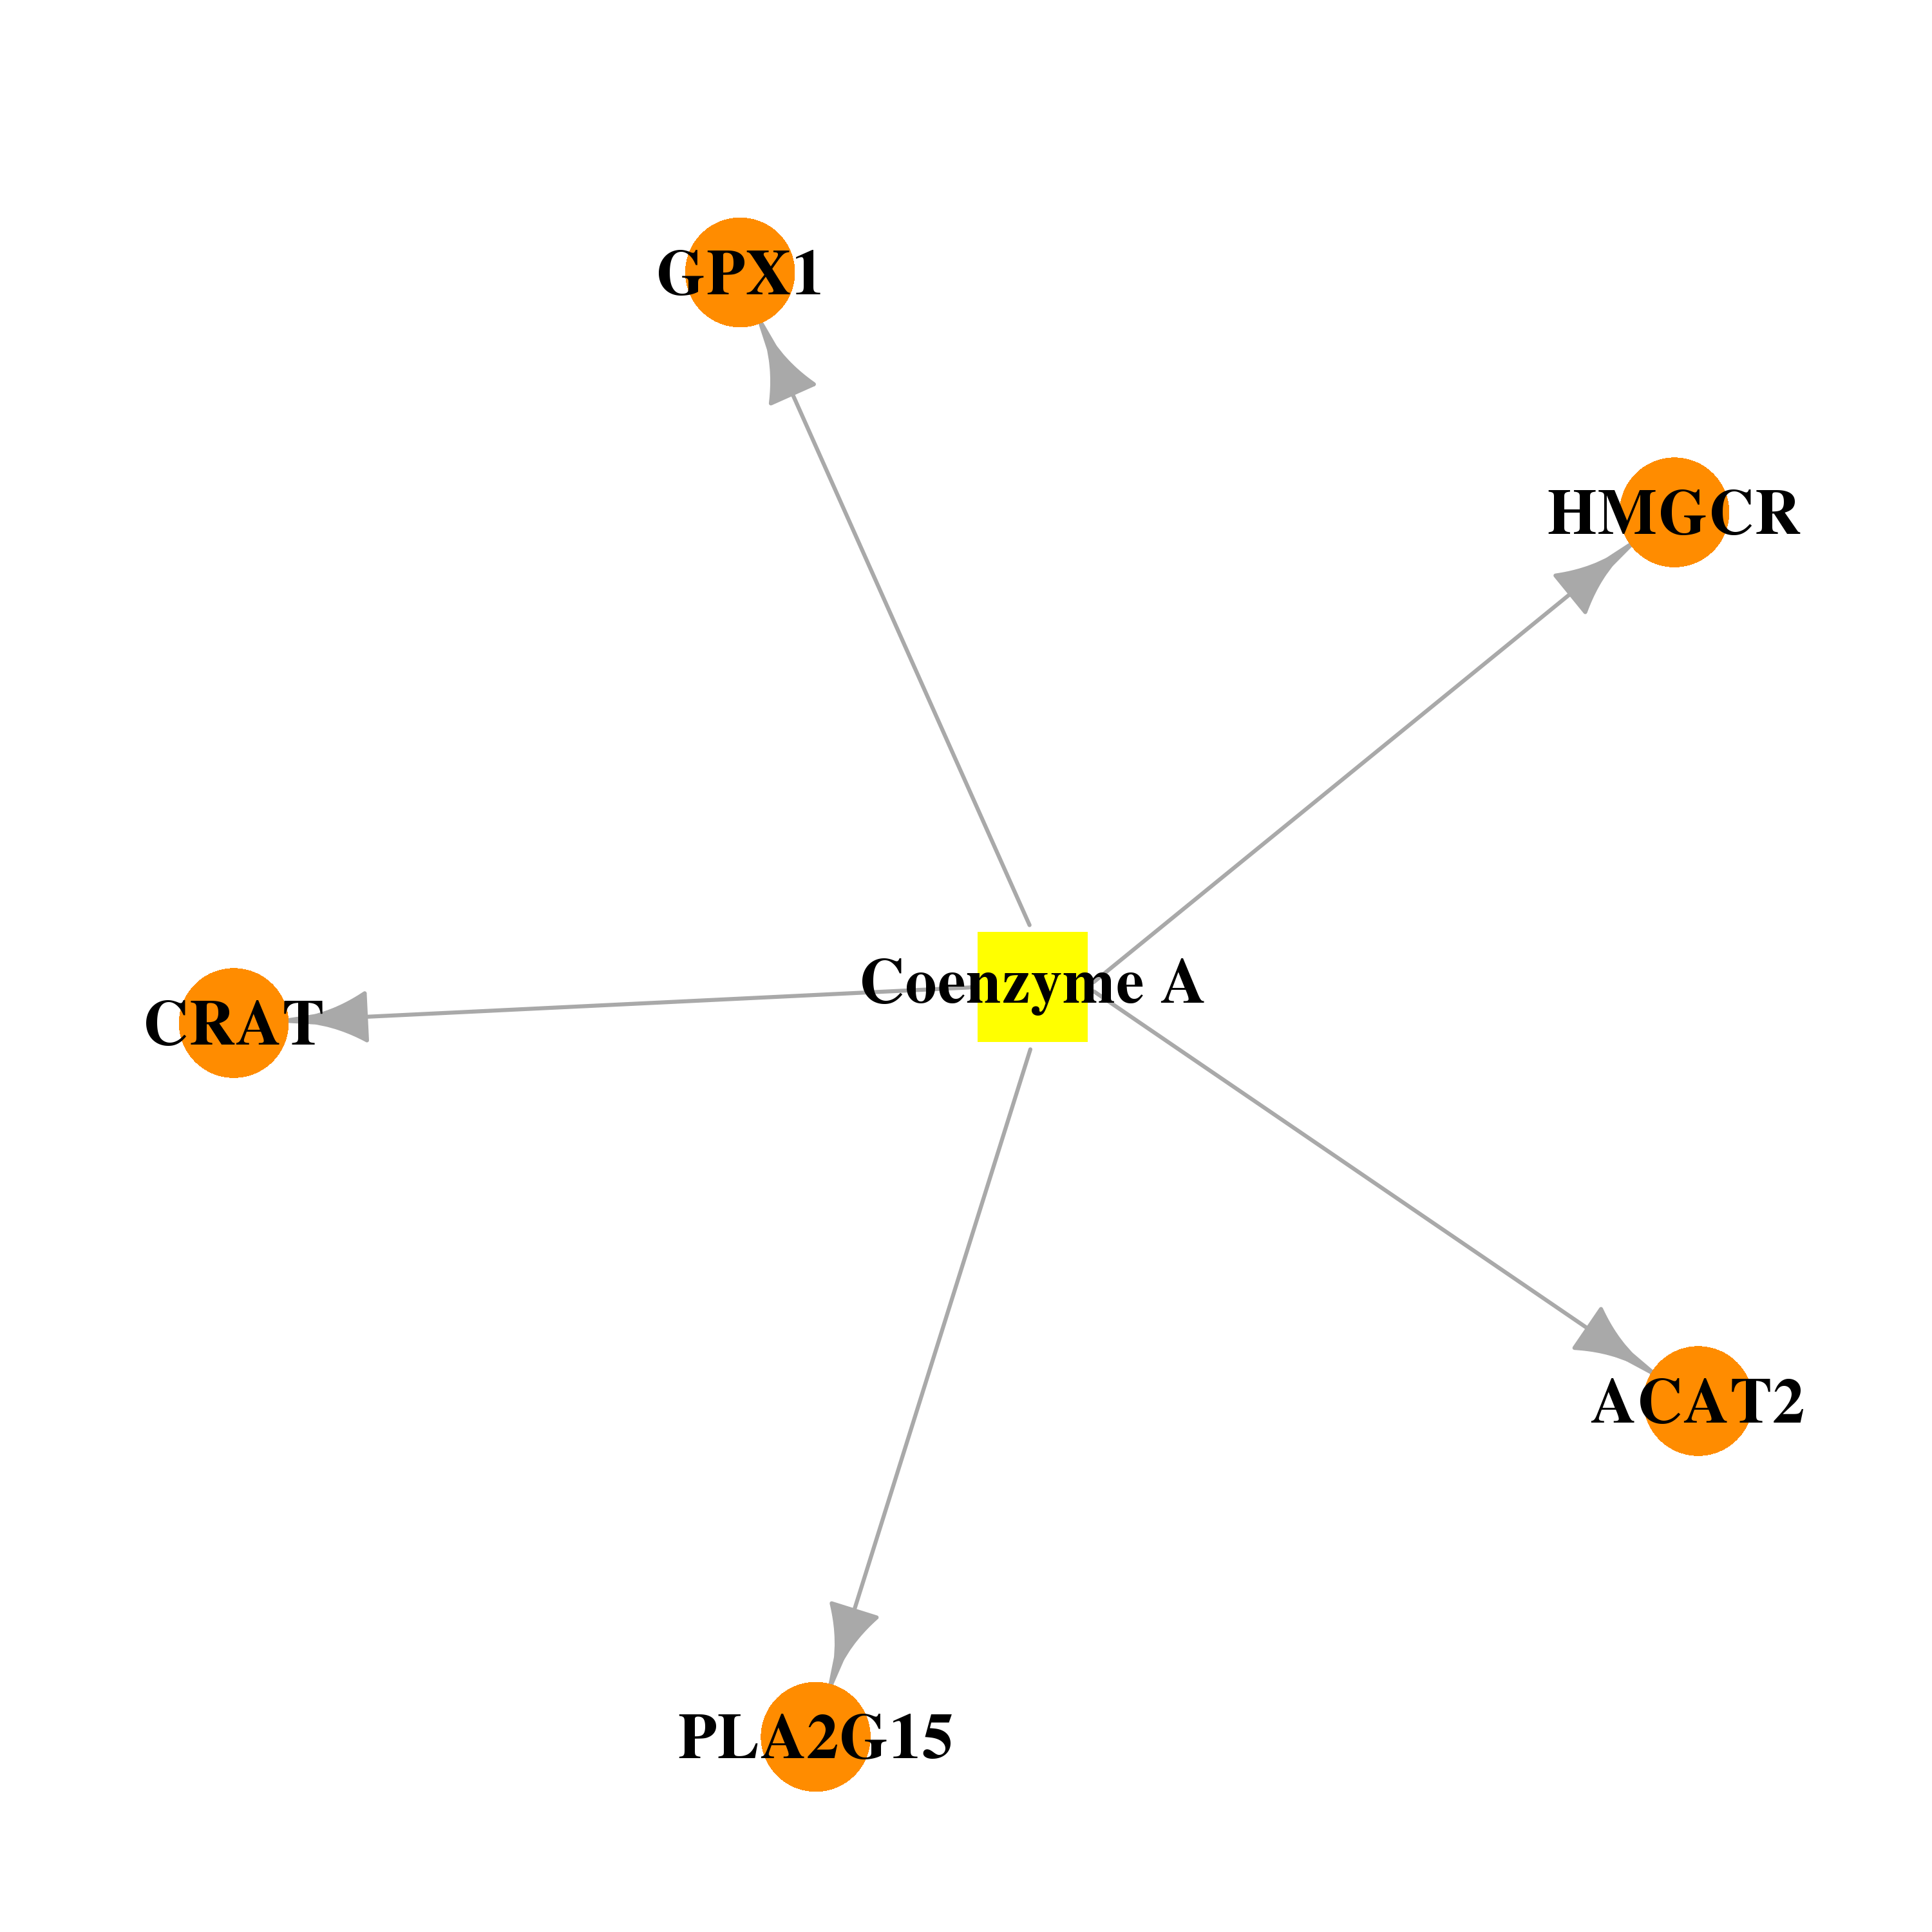 | 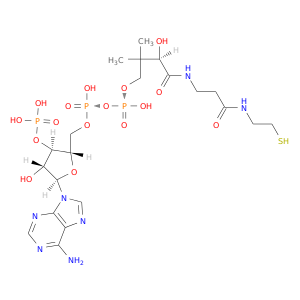 |
| DB03230 | phospholipase A2, group XV | experimental | Adenosine-5'-Propylphosphate |  |  |
| Top |
| Cross referenced IDs for PLA2G15 |
| * We obtained these cross-references from Uniprot database. It covers 150 different DBs, 18 categories. http://www.uniprot.org/help/cross_references_section |
: Open all cross reference information
|
Copyright © 2016-Present - The Univsersity of Texas Health Science Center at Houston @ |