|
|||||||||||||||||||||||||||||||||||||||||||||||||||||||||||||||||||||||||||||||||||||||||||||||||||||||||||||||||||||||||||||||||||||||||||||||||||||||||||||||||||||||||||||||||||||||||||||||||||||||||||||||||||||||||||||||||||||||||||||||||||||||||||||||||||||||||||||||||||||||||||||||||||||||||||||||||||||||||||||||||||||||||||||
| |
| Phenotypic Information (metabolism pathway, cancer, disease, phenome) |
| |
| |
| Gene-Gene Network Information: Co-Expression Network, Interacting Genes & KEGG |
| |
|


| Gene Summary for PISD |
| Basic gene info. | Gene symbol | PISD |
| Gene name | phosphatidylserine decarboxylase | |
| Synonyms | DJ858B16|PSD|PSDC|PSSC|dJ858B16.2 | |
| Cytomap | UCSC genome browser: 22q12.2 | |
| Genomic location | chr22 :32014476-32026810 | |
| Type of gene | protein-coding | |
| RefGenes | NM_014338.3, | |
| Ensembl id | ENSG00000241878 | |
| Description | phosphatidylserine decarboxylase proenzyme | |
| Modification date | 20141207 | |
| dbXrefs | MIM : 612770 | |
| HGNC : HGNC | ||
| Ensembl : ENSG00000241878 | ||
| HPRD : 17854 | ||
| Vega : OTTHUMG00000030252 | ||
| Protein | UniProt: go to UniProt's Cross Reference DB Table | |
| Expression | CleanEX: HS_PISD | |
| BioGPS: 23761 | ||
| Gene Expression Atlas: ENSG00000241878 | ||
| The Human Protein Atlas: ENSG00000241878 | ||
| Pathway | NCI Pathway Interaction Database: PISD | |
| KEGG: PISD | ||
| REACTOME: PISD | ||
| ConsensusPathDB | ||
| Pathway Commons: PISD | ||
| Metabolism | MetaCyc: PISD | |
| HUMANCyc: PISD | ||
| Regulation | Ensembl's Regulation: ENSG00000241878 | |
| miRBase: chr22 :32,014,476-32,026,810 | ||
| TargetScan: NM_014338 | ||
| cisRED: ENSG00000241878 | ||
| Context | iHOP: PISD | |
| cancer metabolism search in PubMed: PISD | ||
| UCL Cancer Institute: PISD | ||
| Assigned class in ccmGDB | C | |
| Top |
| Phenotypic Information for PISD(metabolism pathway, cancer, disease, phenome) |
| Cancer | CGAP: PISD |
| Familial Cancer Database: PISD | |
| * This gene is included in those cancer gene databases. |
|
|
|
|
|
| . | |||||||||||||||||||||||||||||||||||||||||||||||||||||||||||||||||||||||||||||||||||||||||||||||||||||||||||||||||||||||||||||||||||||||||||||||||||||||||||||||||||||||||||||||||||||||||||||||||||||||||||||||||||||||||||||||||||||||||||||||||||||||||||||||||||||||||||||||||||||||||||||||||||||||||||||||||||||||||||||||||||||||
Oncogene 1 | Significant driver gene in | ||||||||||||||||||||||||||||||||||||||||||||||||||||||||||||||||||||||||||||||||||||||||||||||||||||||||||||||||||||||||||||||||||||||||||||||||||||||||||||||||||||||||||||||||||||||||||||||||||||||||||||||||||||||||||||||||||||||||||||||||||||||||||||||||||||||||||||||||||||||||||||||||||||||||||||||||||||||||||||||||||||||||||||
| cf) number; DB name 1 Oncogene; http://nar.oxfordjournals.org/content/35/suppl_1/D721.long, 2 Tumor Suppressor gene; https://bioinfo.uth.edu/TSGene/, 3 Cancer Gene Census; http://www.nature.com/nrc/journal/v4/n3/abs/nrc1299.html, 4 CancerGenes; http://nar.oxfordjournals.org/content/35/suppl_1/D721.long, 5 Network of Cancer Gene; http://ncg.kcl.ac.uk/index.php, 1Therapeutic Vulnerabilities in Cancer; http://cbio.mskcc.org/cancergenomics/statius/ |
| KEGG_GLYCEROPHOSPHOLIPID_METABOLISM | |
| OMIM | |
| Orphanet | |
| Disease | KEGG Disease: PISD |
| MedGen: PISD (Human Medical Genetics with Condition) | |
| ClinVar: PISD | |
| Phenotype | MGI: PISD (International Mouse Phenotyping Consortium) |
| PhenomicDB: PISD | |
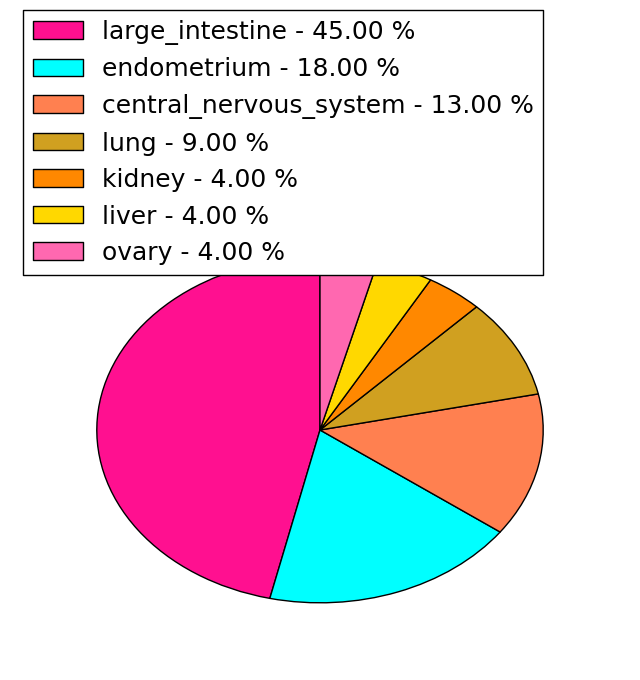
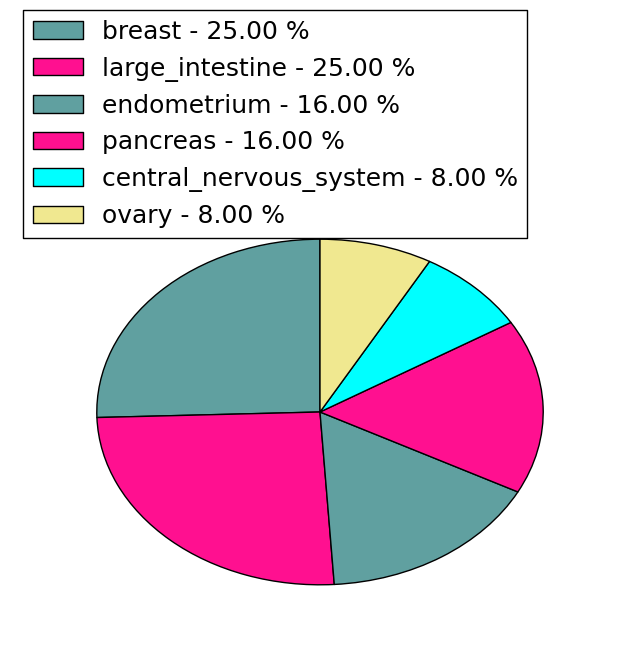
| Mutations for PISD |
| * Under tables are showing count per each tissue to give us broad intuition about tissue specific mutation patterns.You can go to the detailed page for each mutation database's web site. |
| - Statistics for Tissue and Mutation type | Top |
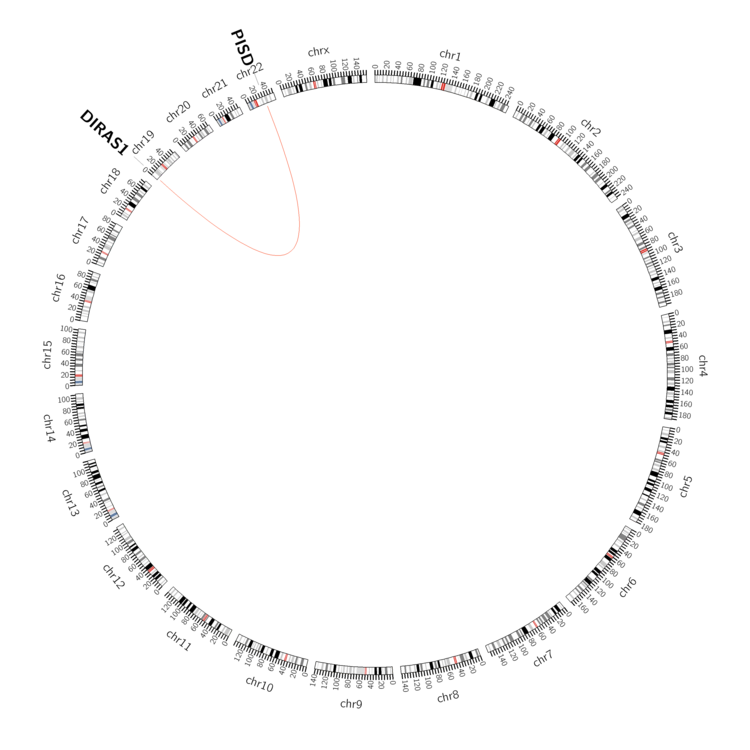 |
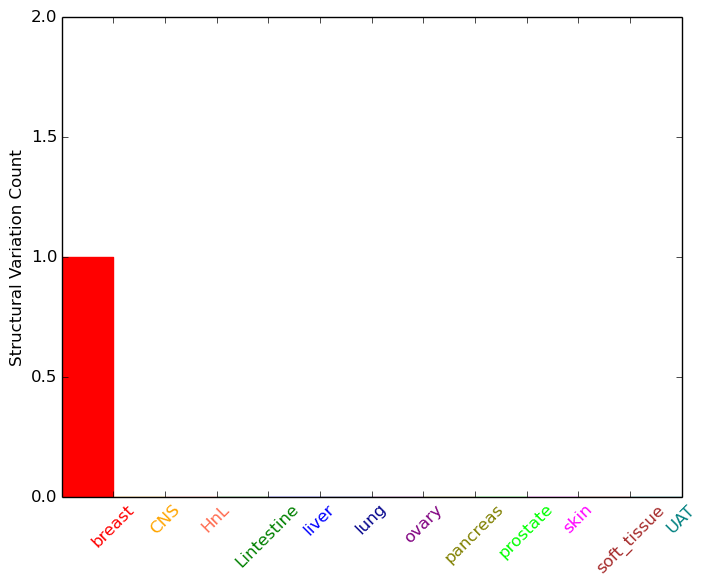
| - For Inter-chromosomal Variations |
| * Inter-chromosomal variantions includes 'interchromosomal amplicon to amplicon', 'interchromosomal amplicon to non-amplified dna', 'interchromosomal insertion', 'Interchromosomal unknown type'. |
 |
| - For Intra-chromosomal Variations |
| There's no intra-chromosomal structural variation. |
| Sample | Symbol_a | Chr_a | Start_a | End_a | Symbol_b | Chr_b | Start_b | End_b |
| cf) Tissue number; Tissue name (1;Breast, 2;Central_nervous_system, 3;Haematopoietic_and_lymphoid_tissue, 4;Large_intestine, 5;Liver, 6;Lung, 7;Ovary, 8;Pancreas, 9;Prostate, 10;Skin, 11;Soft_tissue, 12;Upper_aerodigestive_tract) |
| * From mRNA Sanger sequences, Chitars2.0 arranged chimeric transcripts. This table shows PISD related fusion information. |
| ID | Head Gene | Tail Gene | Accession | Gene_a | qStart_a | qEnd_a | Chromosome_a | tStart_a | tEnd_a | Gene_a | qStart_a | qEnd_a | Chromosome_a | tStart_a | tEnd_a |
| BF996842 | RORB | 9 | 358 | 9 | 77209554 | 77209904 | PISD | 350 | 519 | 22 | 32014731 | 32014900 | |
| BP321628 | PISD | 1 | 511 | 22 | 32014953 | 32015463 | PISD | 504 | 582 | 22 | 32017645 | 32017723 | |
| BQ375244 | PISD | 1 | 176 | 22 | 32015263 | 32015438 | PISD | 174 | 278 | 22 | 32015445 | 32015549 | |
| Top |
| Mutation type/ Tissue ID | brca | cns | cerv | endome | haematopo | kidn | Lintest | liver | lung | ns | ovary | pancre | prost | skin | stoma | thyro | urina | |||
| Total # sample | 1 | 1 | ||||||||||||||||||
| GAIN (# sample) | 1 | 1 | ||||||||||||||||||
| LOSS (# sample) |
| cf) Tissue ID; Tissue type (1; Breast, 2; Central_nervous_system, 3; Cervix, 4; Endometrium, 5; Haematopoietic_and_lymphoid_tissue, 6; Kidney, 7; Large_intestine, 8; Liver, 9; Lung, 10; NS, 11; Ovary, 12; Pancreas, 13; Prostate, 14; Skin, 15; Stomach, 16; Thyroid, 17; Urinary_tract) |
| Top |
|
 |
| Top |
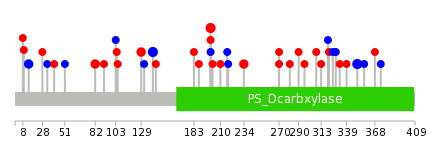
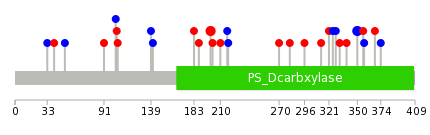
| Stat. for Non-Synonymous SNVs (# total SNVs=22) | (# total SNVs=12) |
 |  |
(# total SNVs=0) | (# total SNVs=0) |
| Top |
| * When you move the cursor on each content, you can see more deailed mutation information on the Tooltip. Those are primary_site,primary_histology,mutation(aa),pubmedID. |
| GRCh37 position | Mutation(aa) | Unique sampleID count |
| chr22:32017125-32017125 | p.A200V | 3 |
| chr22:32015676-32015676 | p.F350F | 3 |
| chr22:32017668-32017668 | p.P141P | 3 |
| chr22:32021760-32021760 | p.R14R | 2 |
| chr22:32017705-32017705 | p.R129H | 2 |
| chr22:32017847-32017847 | p.T82A | 2 |
| chr22:32016634-32016634 | p.R270W | 2 |
| chr22:32017023-32017023 | p.S234Y | 2 |
| chr22:32017695-32017695 | p.S132S | 1 |
| chr22:32015751-32015751 | p.N325N | 1 |
| Top |
|
 |
| Point Mutation/ Tissue ID | 1 | 2 | 3 | 4 | 5 | 6 | 7 | 8 | 9 | 10 | 11 | 12 | 13 | 14 | 15 | 16 | 17 | 18 | 19 | 20 |
| # sample | 2 | 2 | 8 | 1 | 1 | 1 | 1 | 1 | 1 | 10 | 6 | |||||||||
| # mutation | 2 | 2 | 6 | 1 | 1 | 1 | 1 | 1 | 1 | 9 | 6 | |||||||||
| nonsynonymous SNV | 1 | 4 | 1 | 1 | 1 | 1 | 5 | 4 | ||||||||||||
| synonymous SNV | 1 | 2 | 2 | 1 | 1 | 4 | 2 |
| cf) Tissue ID; Tissue type (1; BLCA[Bladder Urothelial Carcinoma], 2; BRCA[Breast invasive carcinoma], 3; CESC[Cervical squamous cell carcinoma and endocervical adenocarcinoma], 4; COAD[Colon adenocarcinoma], 5; GBM[Glioblastoma multiforme], 6; Glioma Low Grade, 7; HNSC[Head and Neck squamous cell carcinoma], 8; KICH[Kidney Chromophobe], 9; KIRC[Kidney renal clear cell carcinoma], 10; KIRP[Kidney renal papillary cell carcinoma], 11; LAML[Acute Myeloid Leukemia], 12; LUAD[Lung adenocarcinoma], 13; LUSC[Lung squamous cell carcinoma], 14; OV[Ovarian serous cystadenocarcinoma ], 15; PAAD[Pancreatic adenocarcinoma], 16; PRAD[Prostate adenocarcinoma], 17; SKCM[Skin Cutaneous Melanoma], 18:STAD[Stomach adenocarcinoma], 19:THCA[Thyroid carcinoma], 20:UCEC[Uterine Corpus Endometrial Carcinoma]) |
| Top |
| * We represented just top 10 SNVs. When you move the cursor on each content, you can see more deailed mutation information on the Tooltip. Those are primary_site, primary_histology, mutation(aa), pubmedID. |
| Genomic Position | Mutation(aa) | Unique sampleID count |
| chr22:32017125 | p.A200V | 3 |
| chr22:32015676 | p.F350F | 3 |
| chr22:32019770 | p.P104H | 1 |
| chr22:32015742 | p.N325N | 1 |
| chr22:32019790 | p.R103R | 1 |
| chr22:32015751 | p.V321M | 1 |
| chr22:32017352 | p.R91C | 1 |
| chr22:32015765 | p.G313S | 1 |
| chr22:32017367 | p.L51L | 1 |
| chr22:32015789 | p.R296H | 1 |
| * Copy number data were extracted from TCGA using R package TCGA-Assembler. The URLs of all public data files on TCGA DCC data server were gathered on Jan-05-2015. Function ProcessCNAData in TCGA-Assembler package was used to obtain gene-level copy number value which is calculated as the average copy number of the genomic region of a gene. |
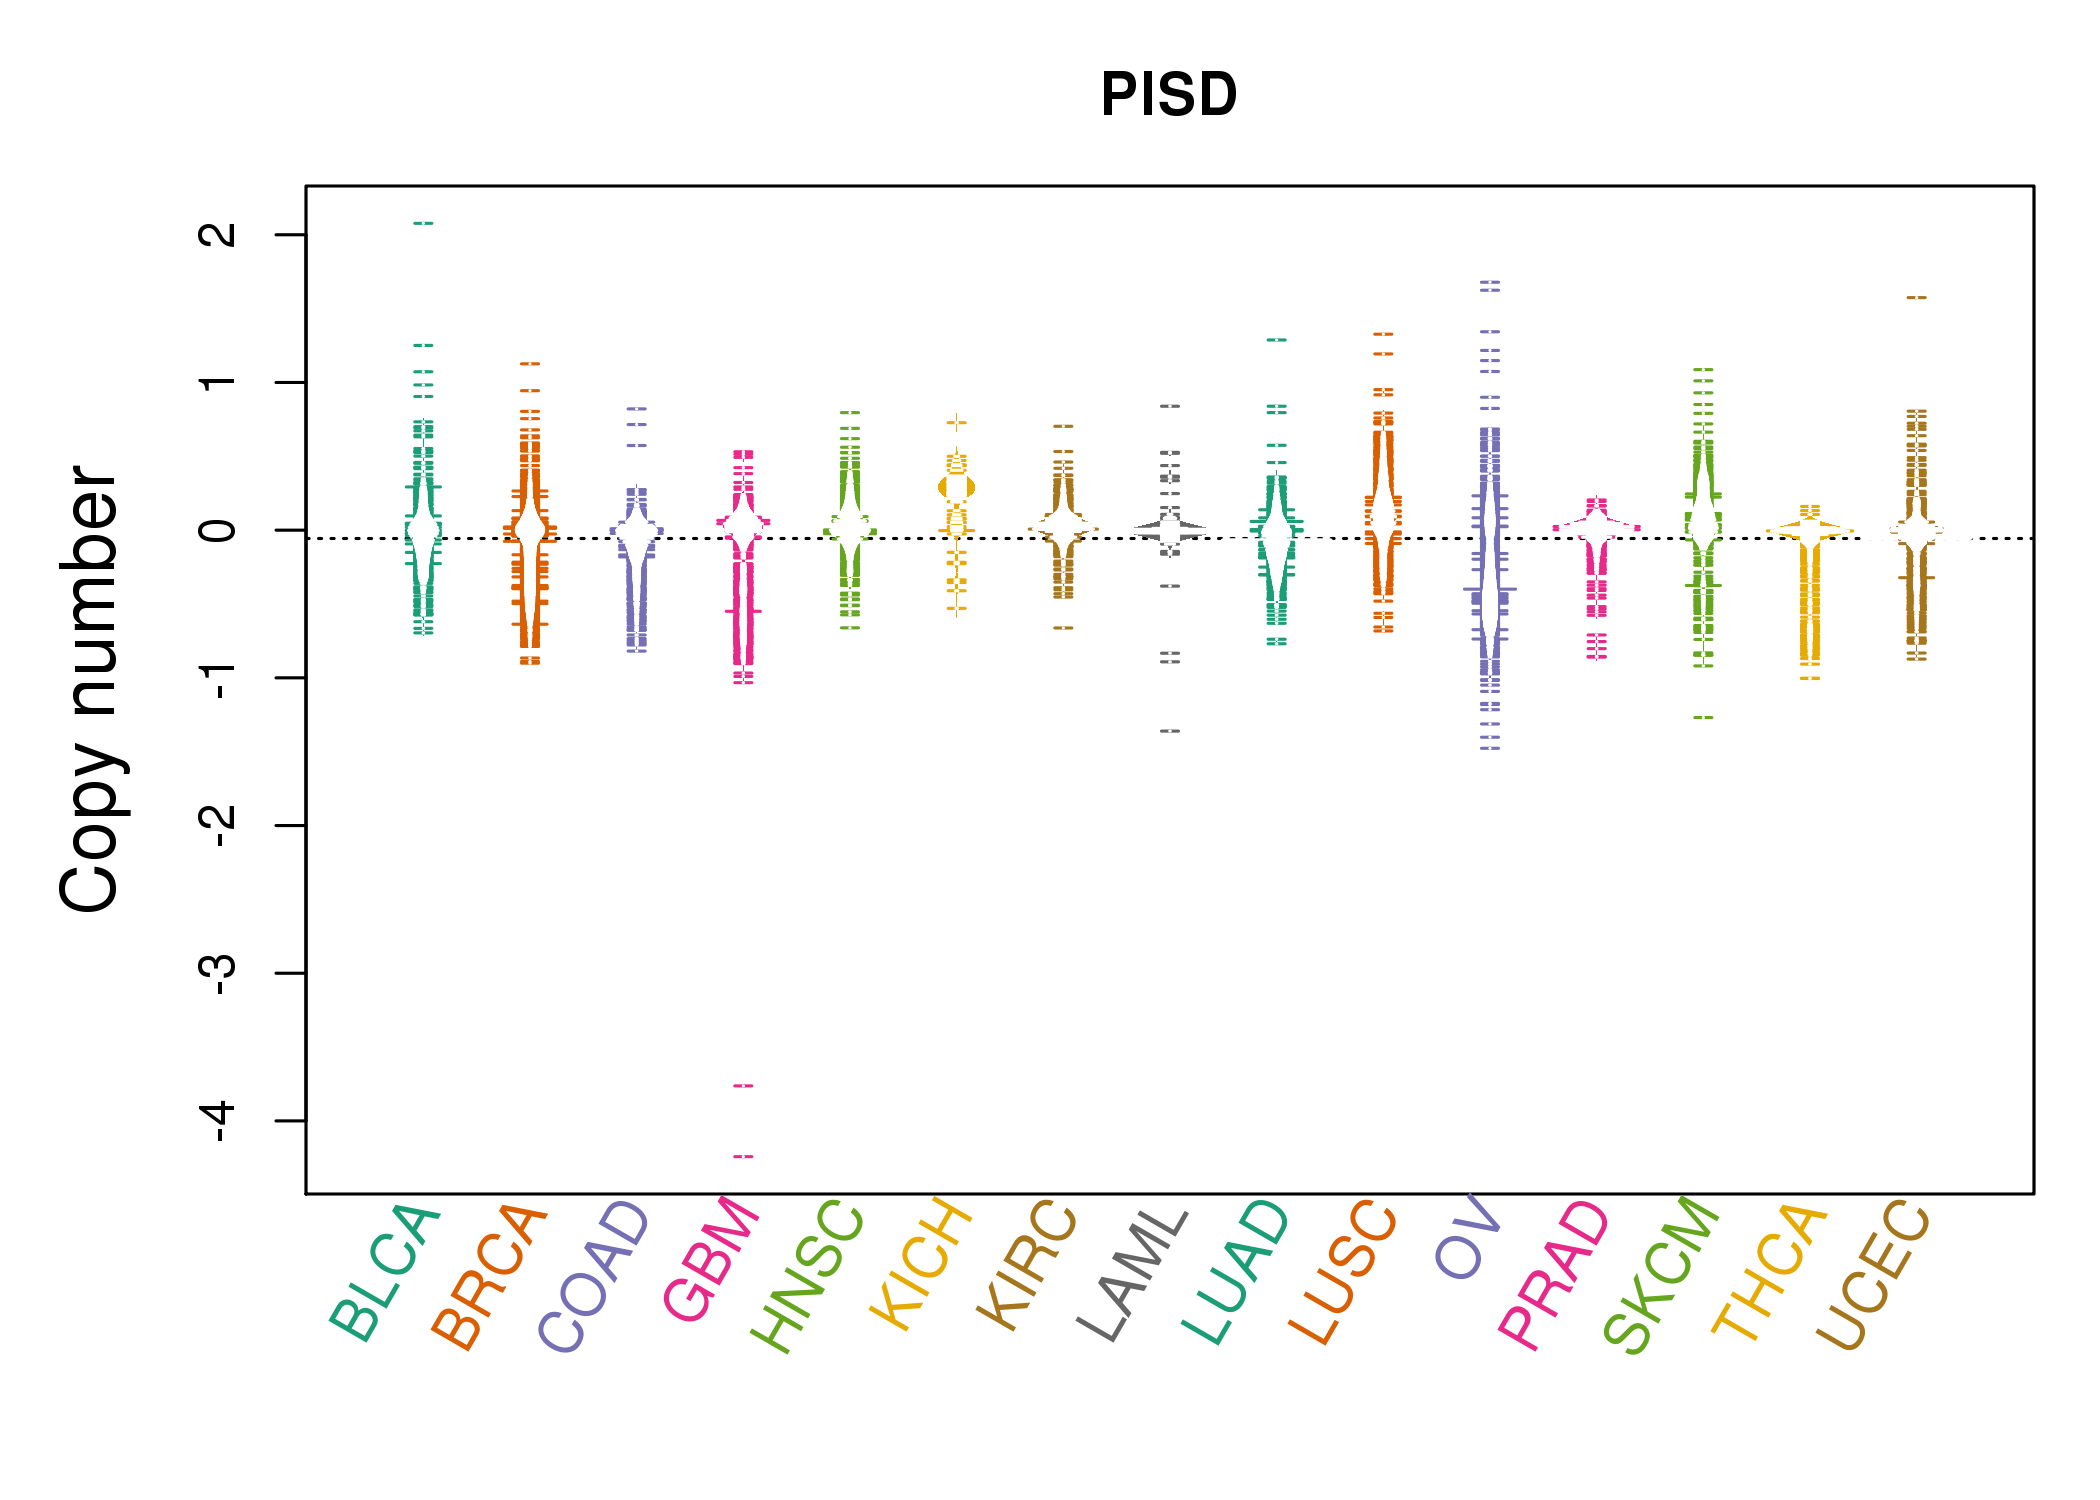 |
| cf) Tissue ID[Tissue type]: BLCA[Bladder Urothelial Carcinoma], BRCA[Breast invasive carcinoma], CESC[Cervical squamous cell carcinoma and endocervical adenocarcinoma], COAD[Colon adenocarcinoma], GBM[Glioblastoma multiforme], Glioma Low Grade, HNSC[Head and Neck squamous cell carcinoma], KICH[Kidney Chromophobe], KIRC[Kidney renal clear cell carcinoma], KIRP[Kidney renal papillary cell carcinoma], LAML[Acute Myeloid Leukemia], LUAD[Lung adenocarcinoma], LUSC[Lung squamous cell carcinoma], OV[Ovarian serous cystadenocarcinoma ], PAAD[Pancreatic adenocarcinoma], PRAD[Prostate adenocarcinoma], SKCM[Skin Cutaneous Melanoma], STAD[Stomach adenocarcinoma], THCA[Thyroid carcinoma], UCEC[Uterine Corpus Endometrial Carcinoma] |
| Top |
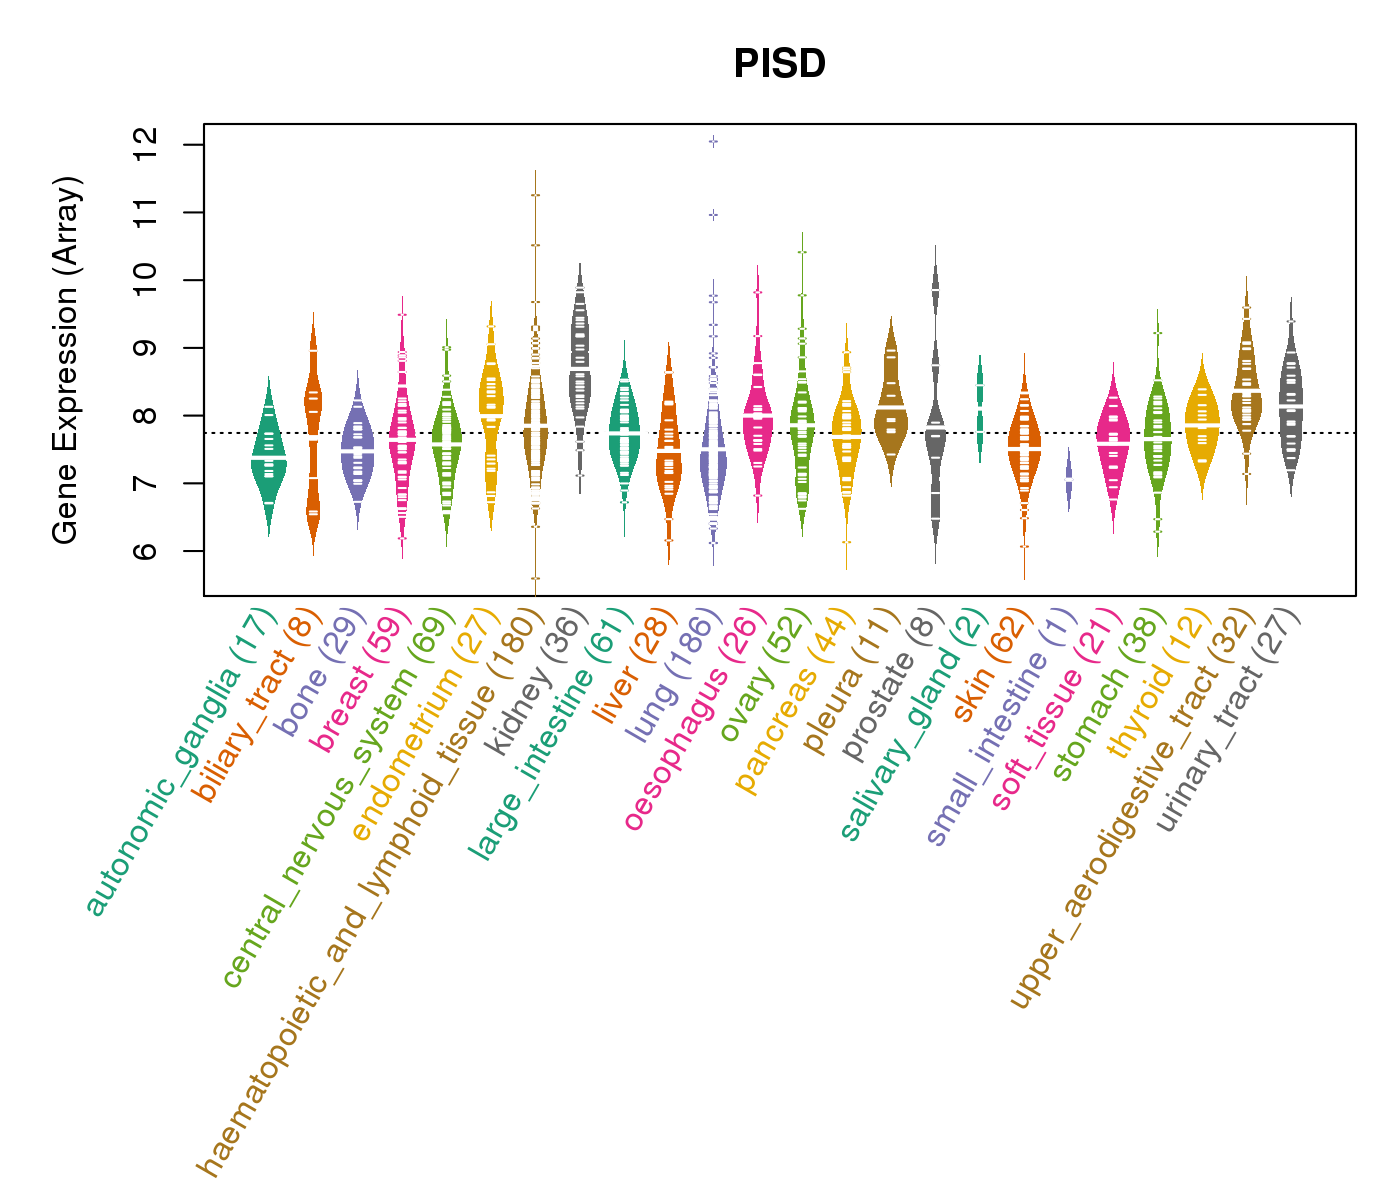
| Gene Expression for PISD |
| * CCLE gene expression data were extracted from CCLE_Expression_Entrez_2012-10-18.res: Gene-centric RMA-normalized mRNA expression data. |
 |
| * Normalized gene expression data of RNASeqV2 was extracted from TCGA using R package TCGA-Assembler. The URLs of all public data files on TCGA DCC data server were gathered at Jan-05-2015. Only eight cancer types have enough normal control samples for differential expression analysis. (t test, adjusted p<0.05 (using Benjamini-Hochberg FDR)) |
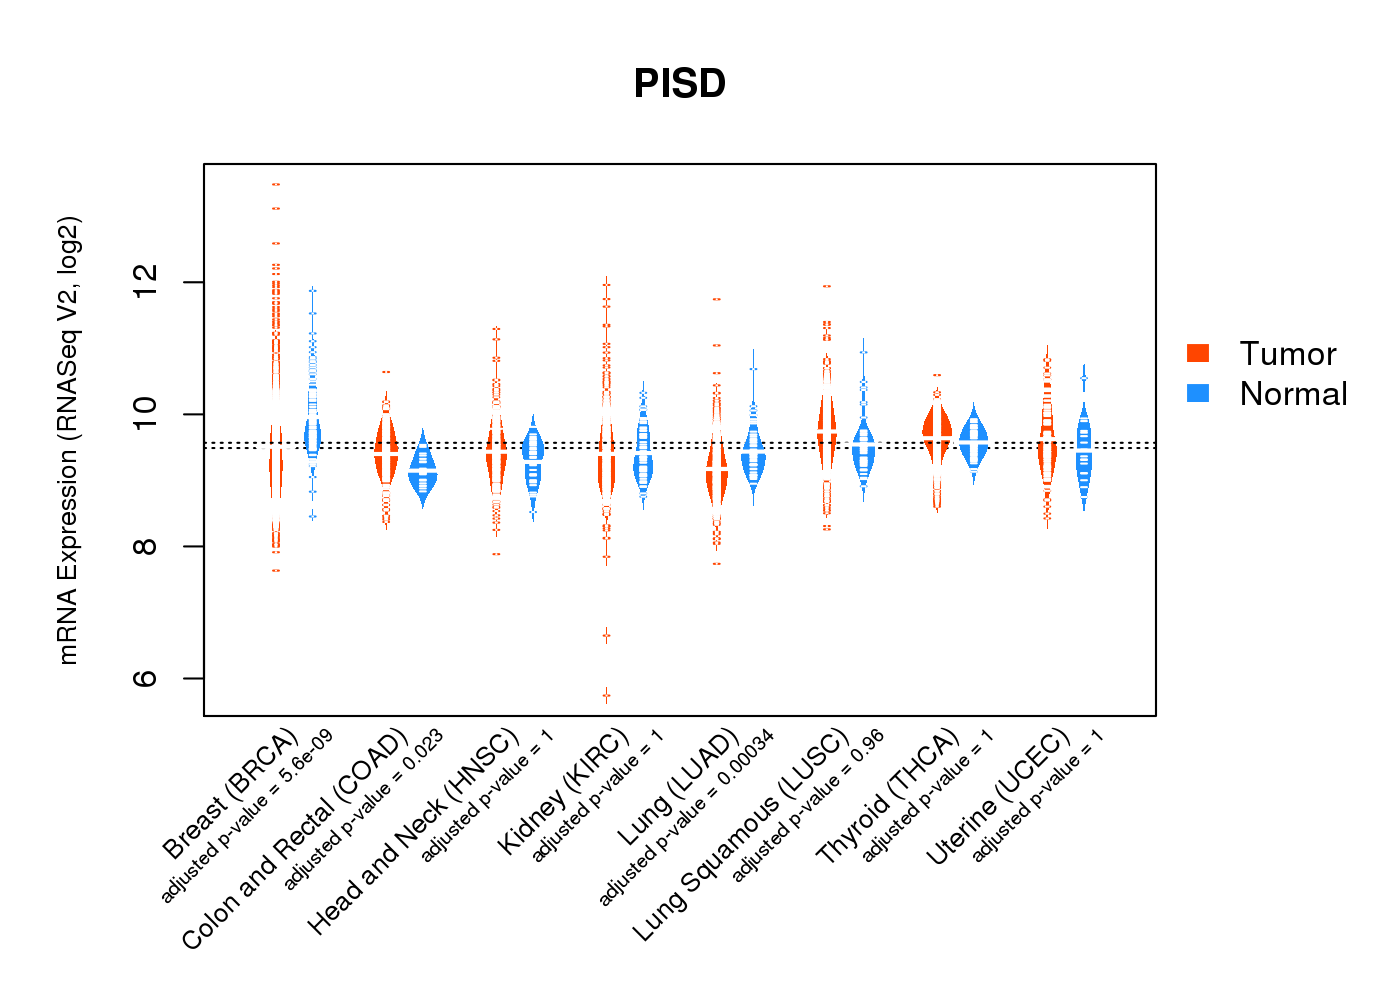 |
| Top |
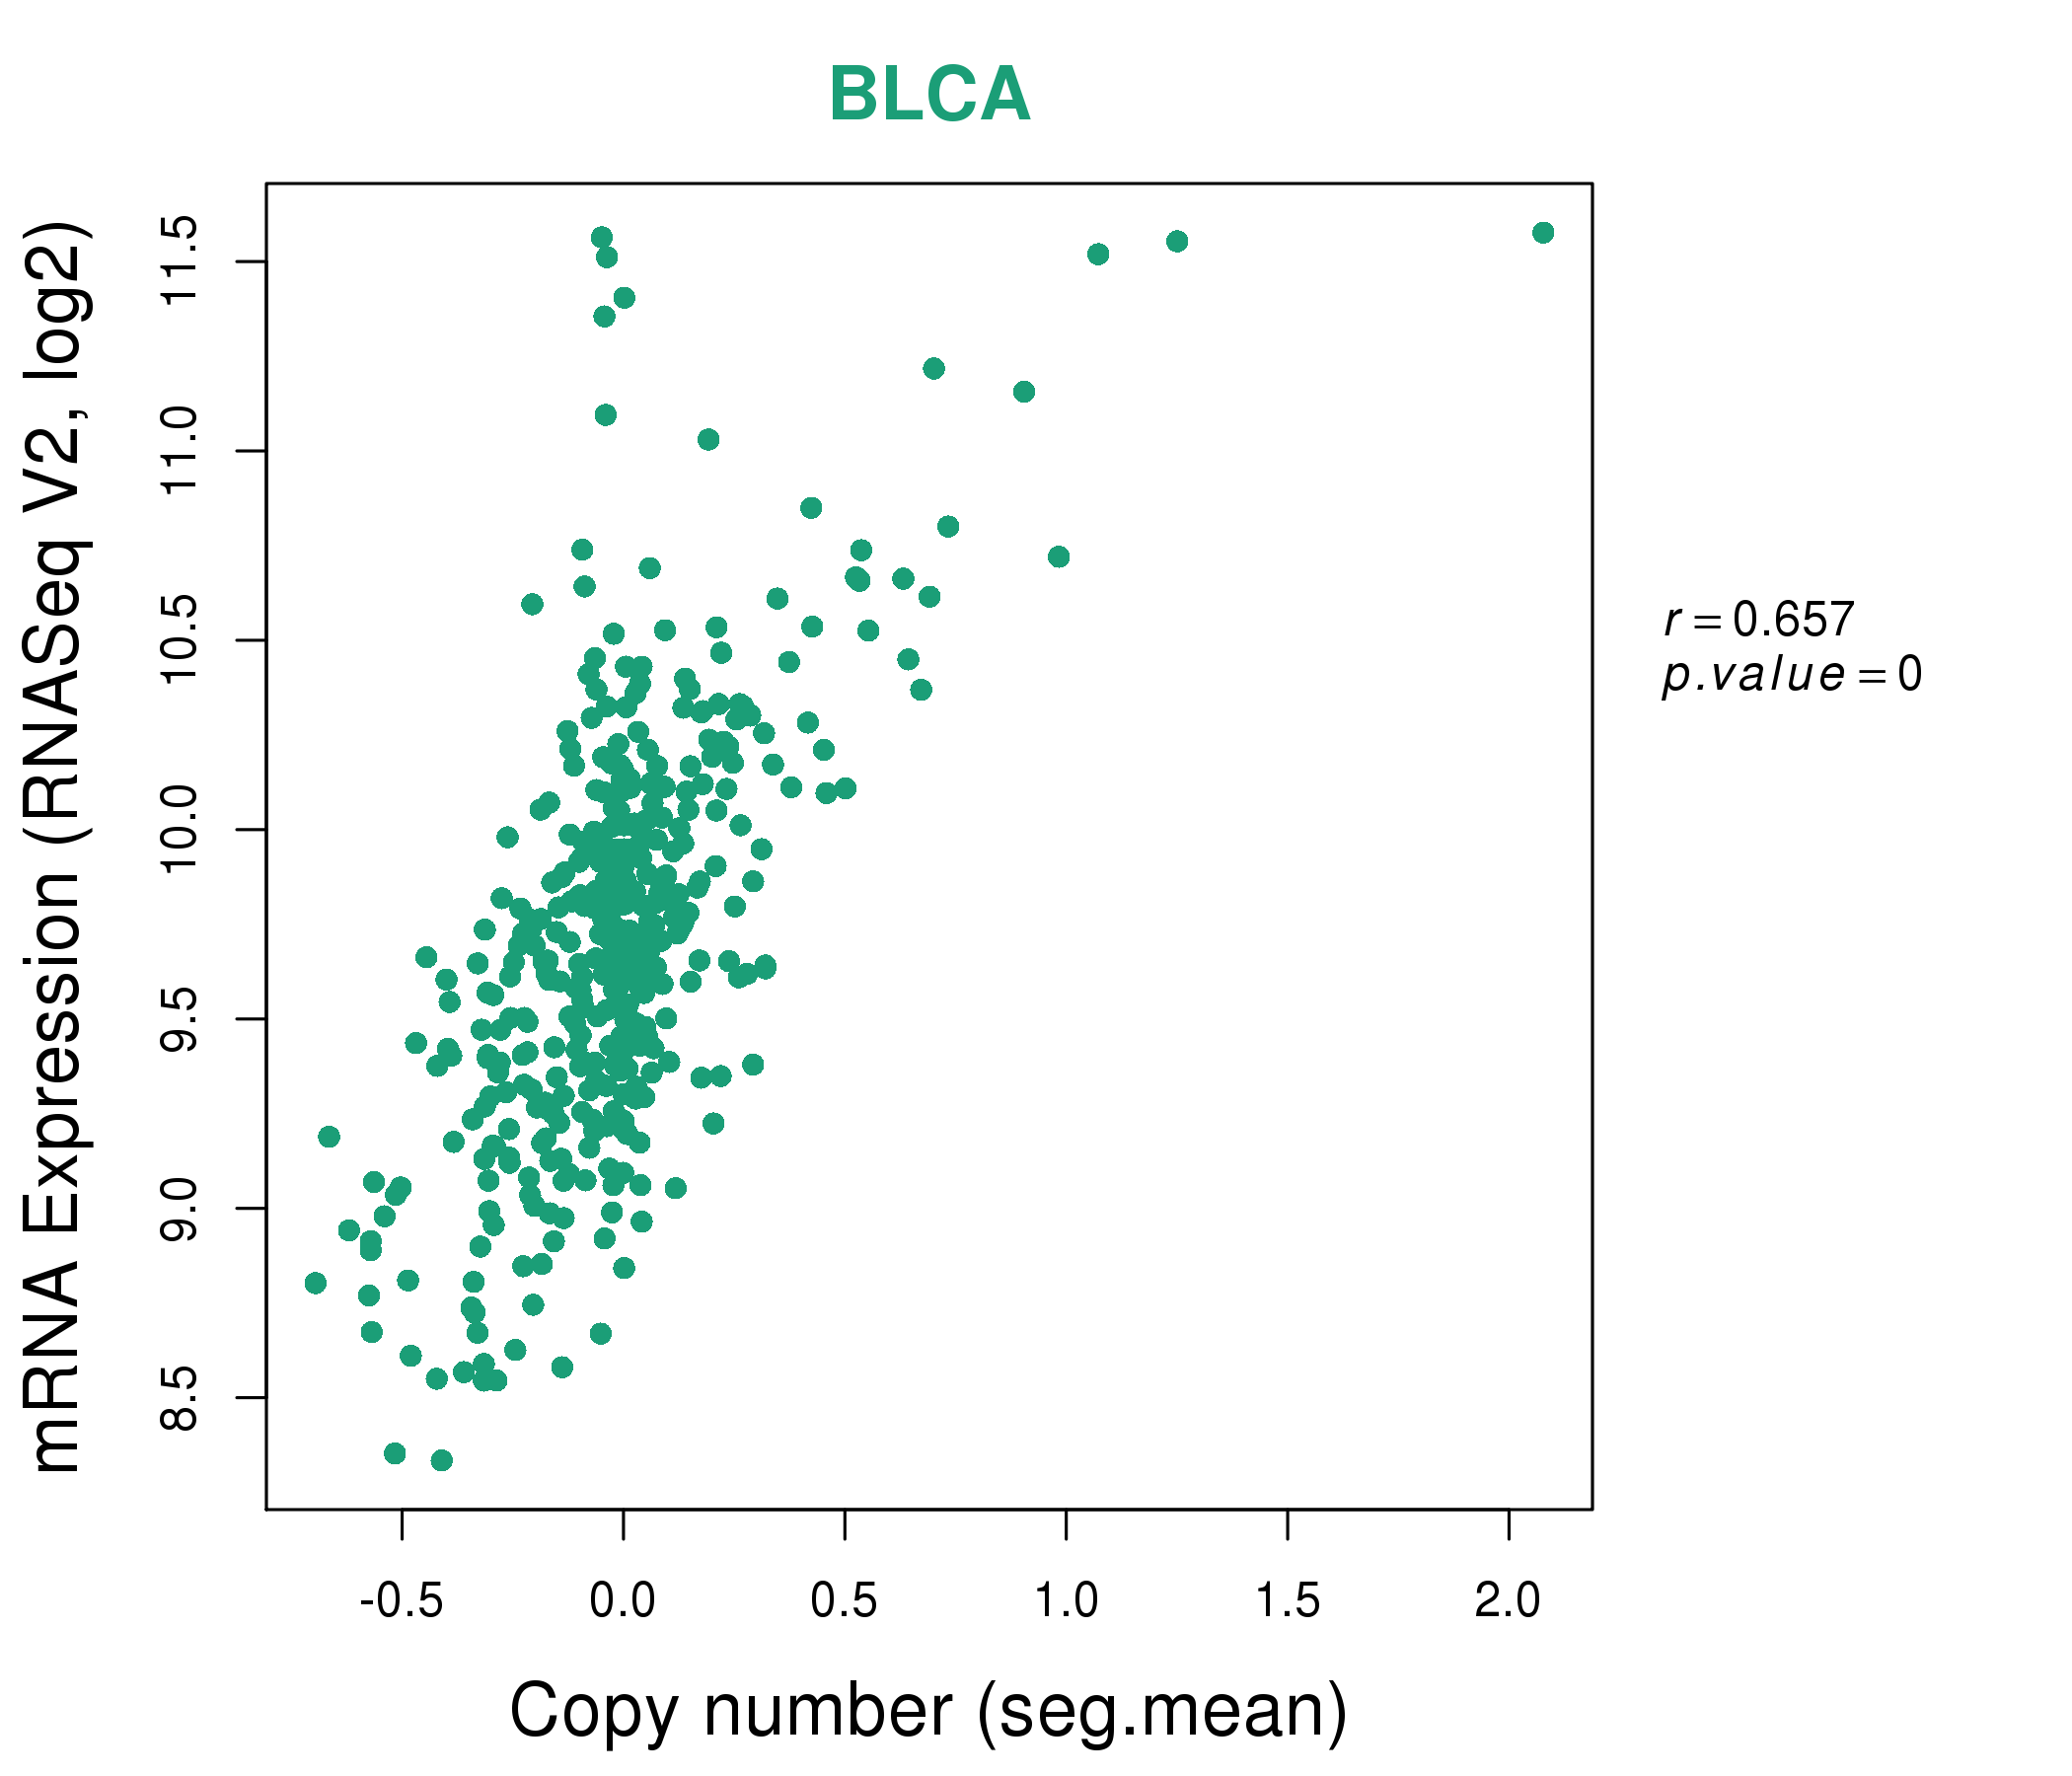
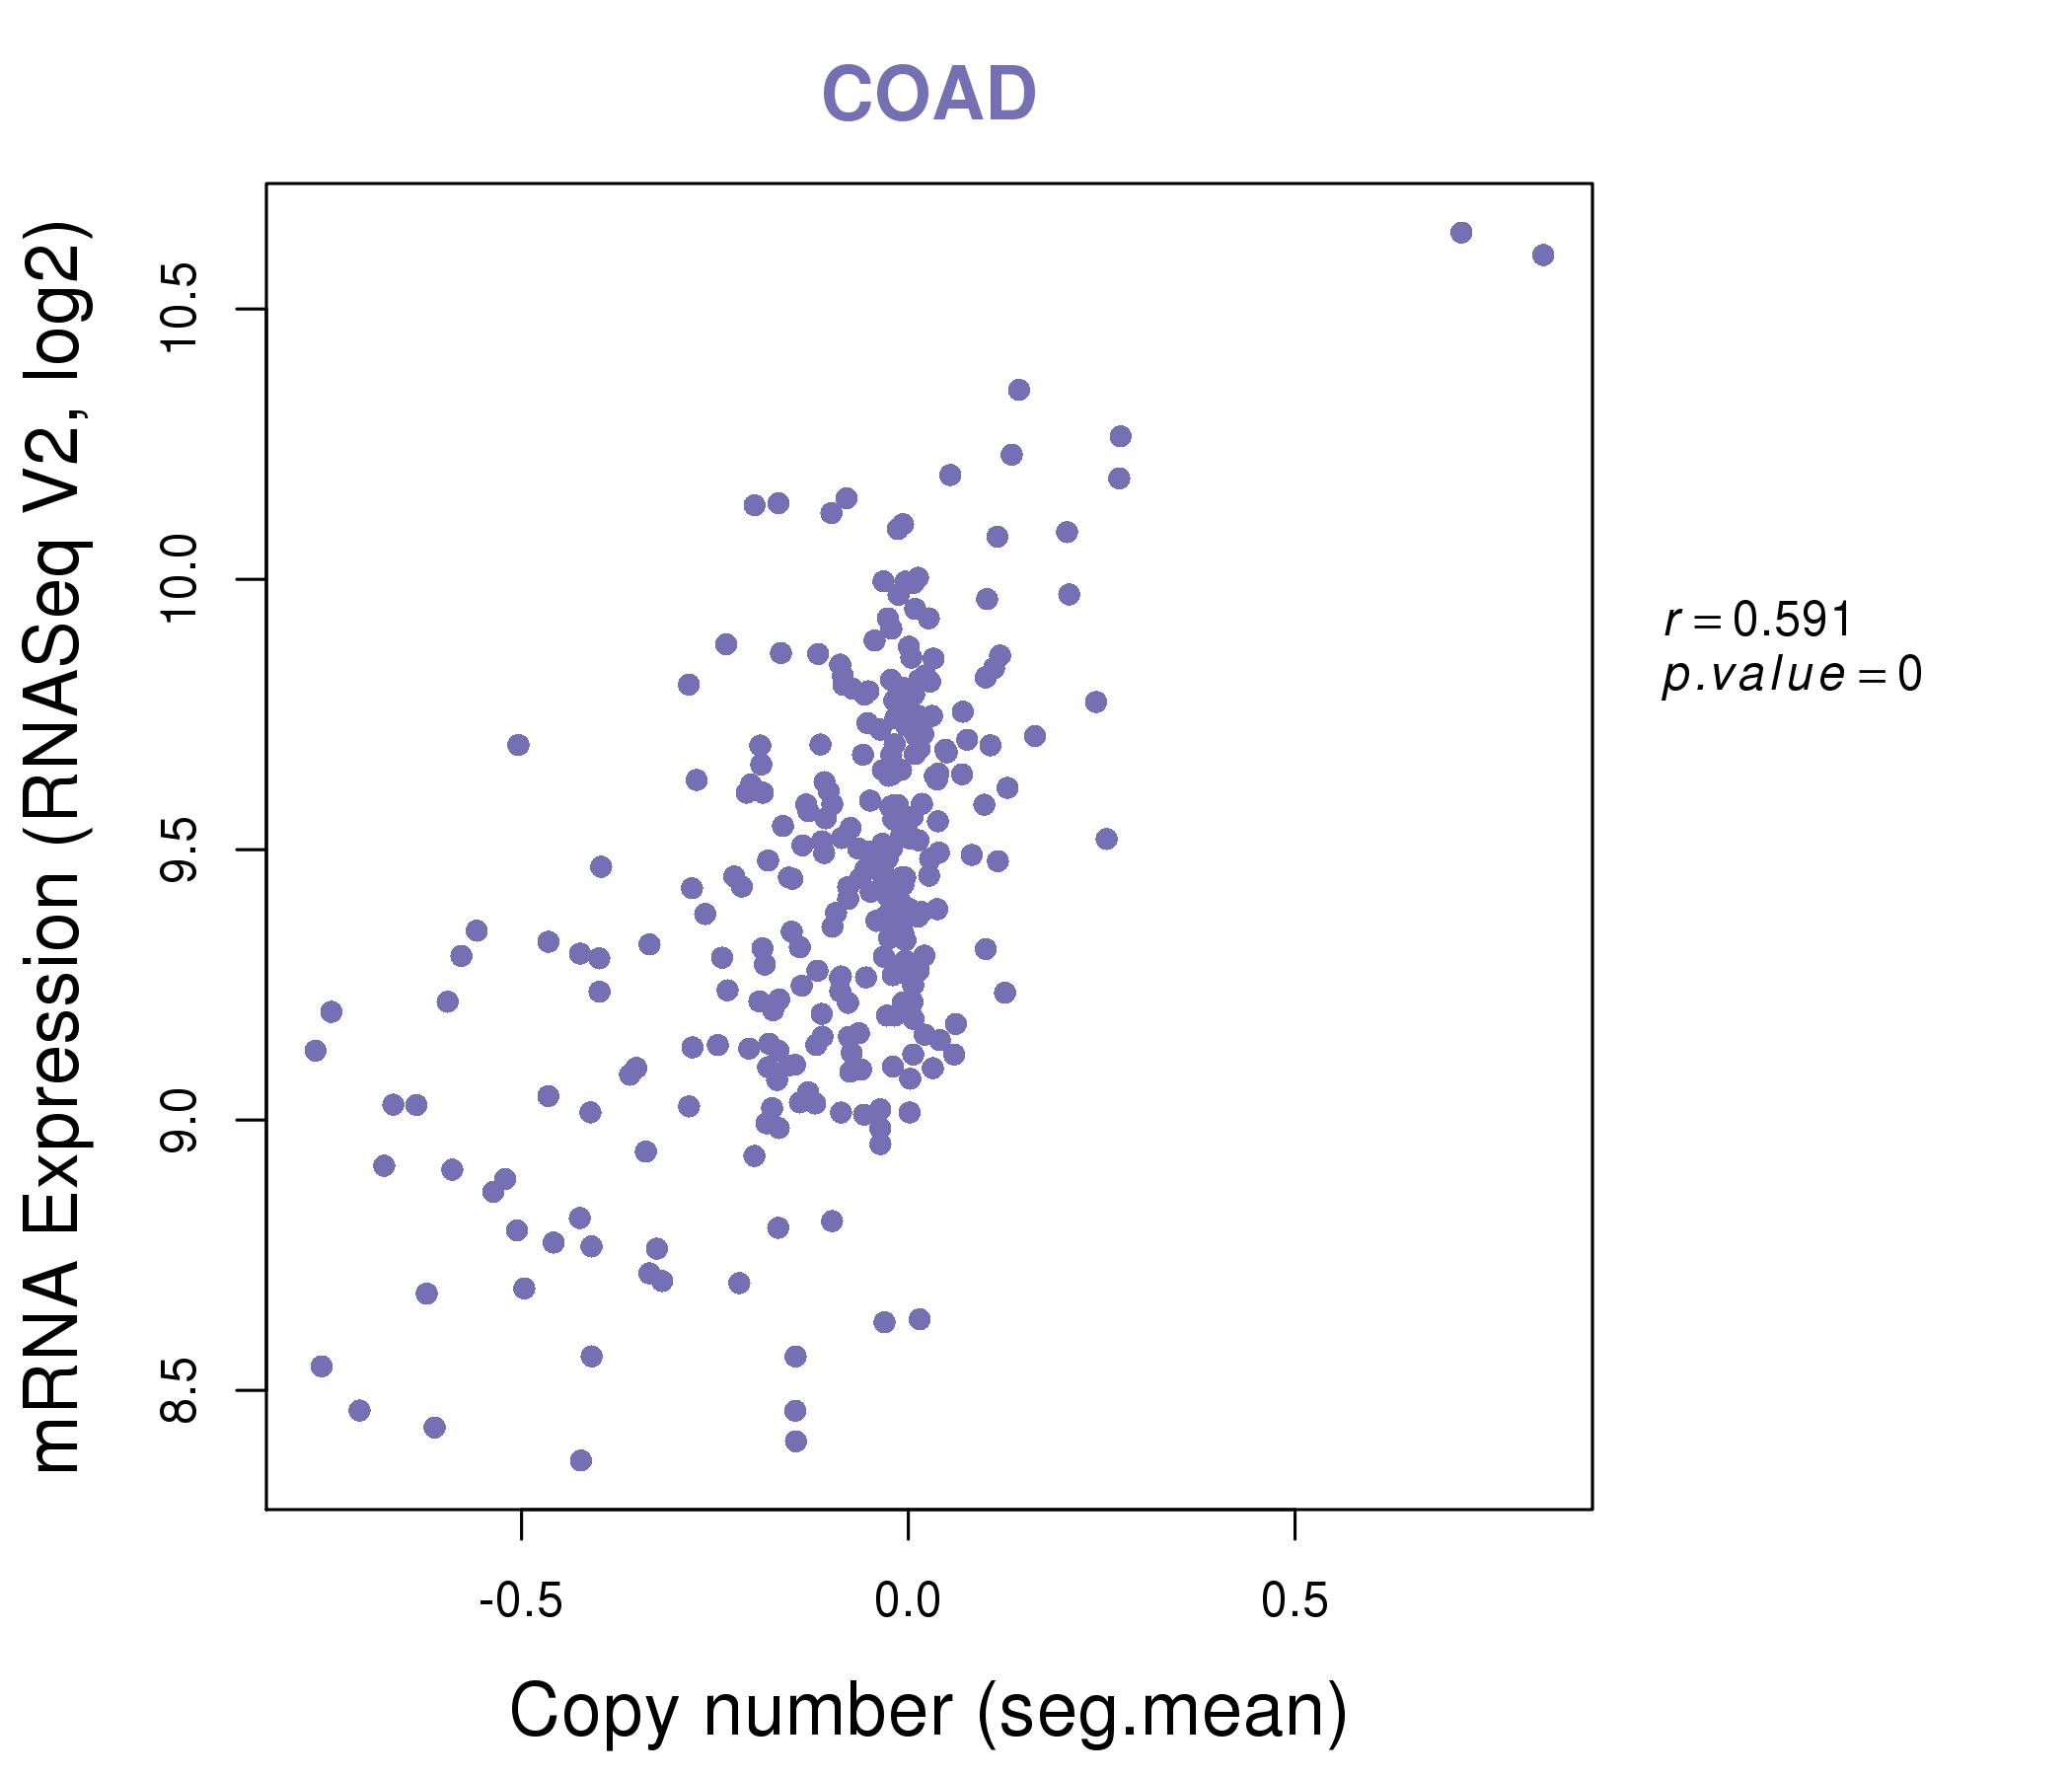
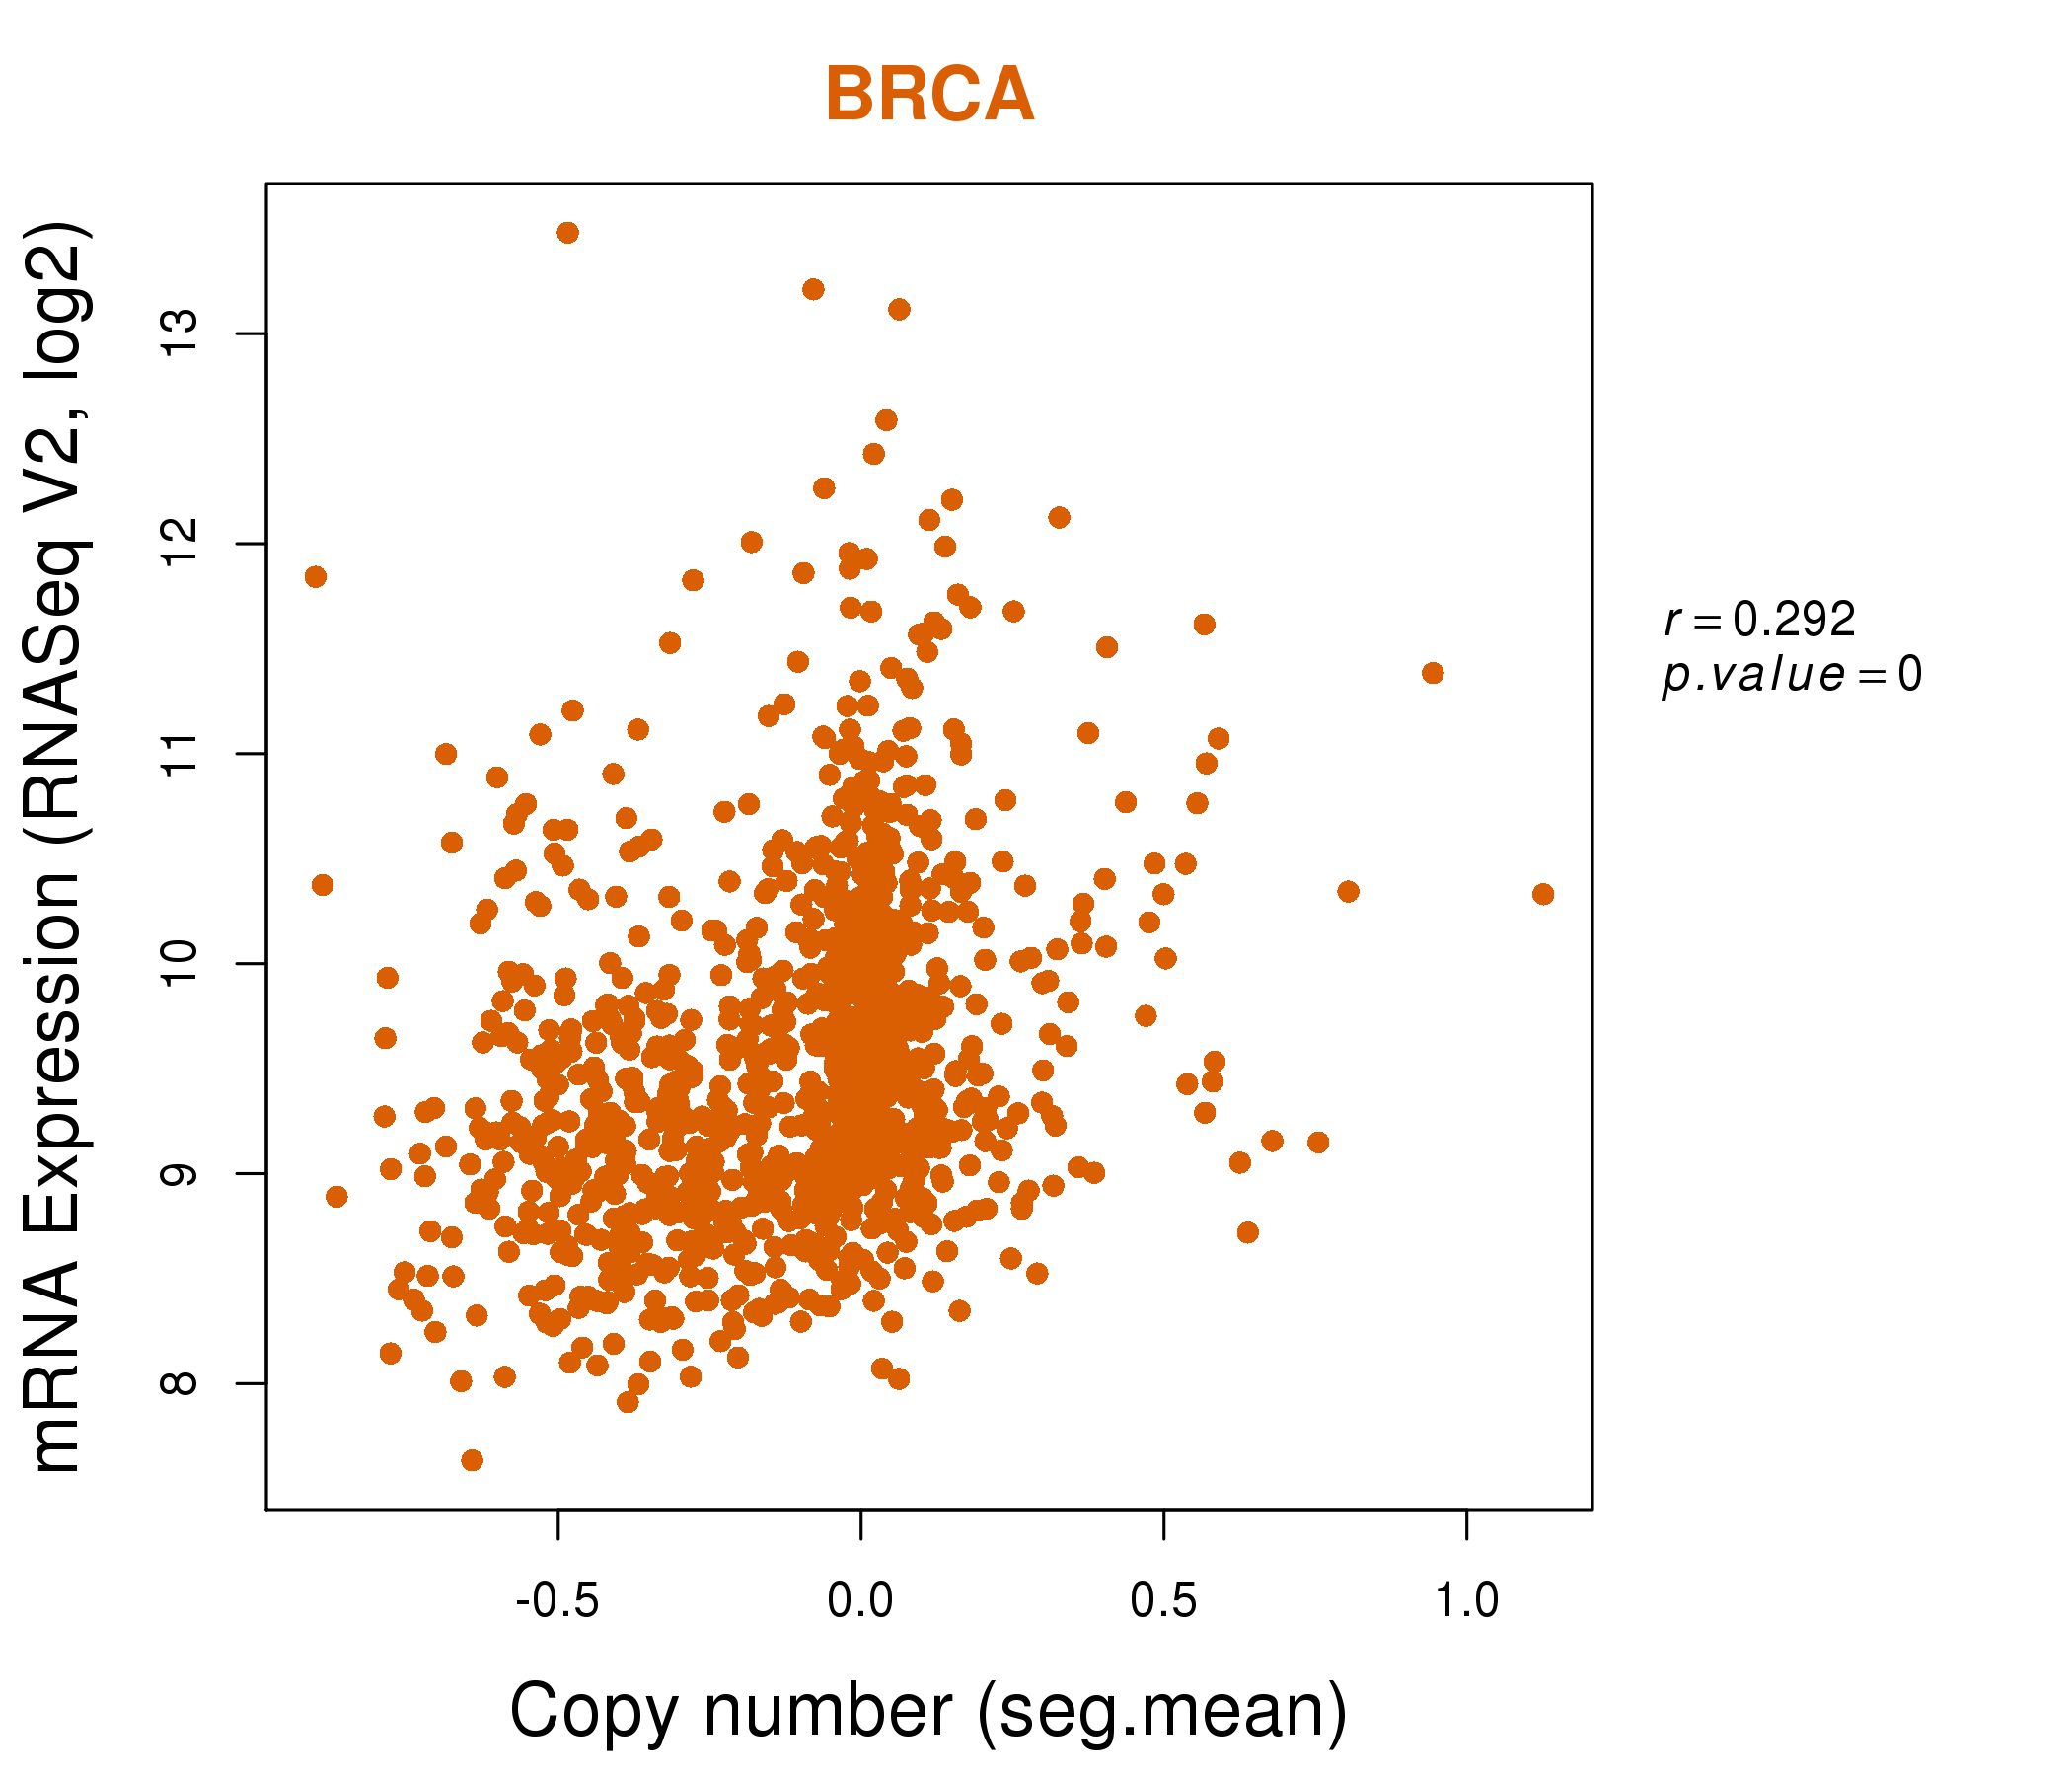
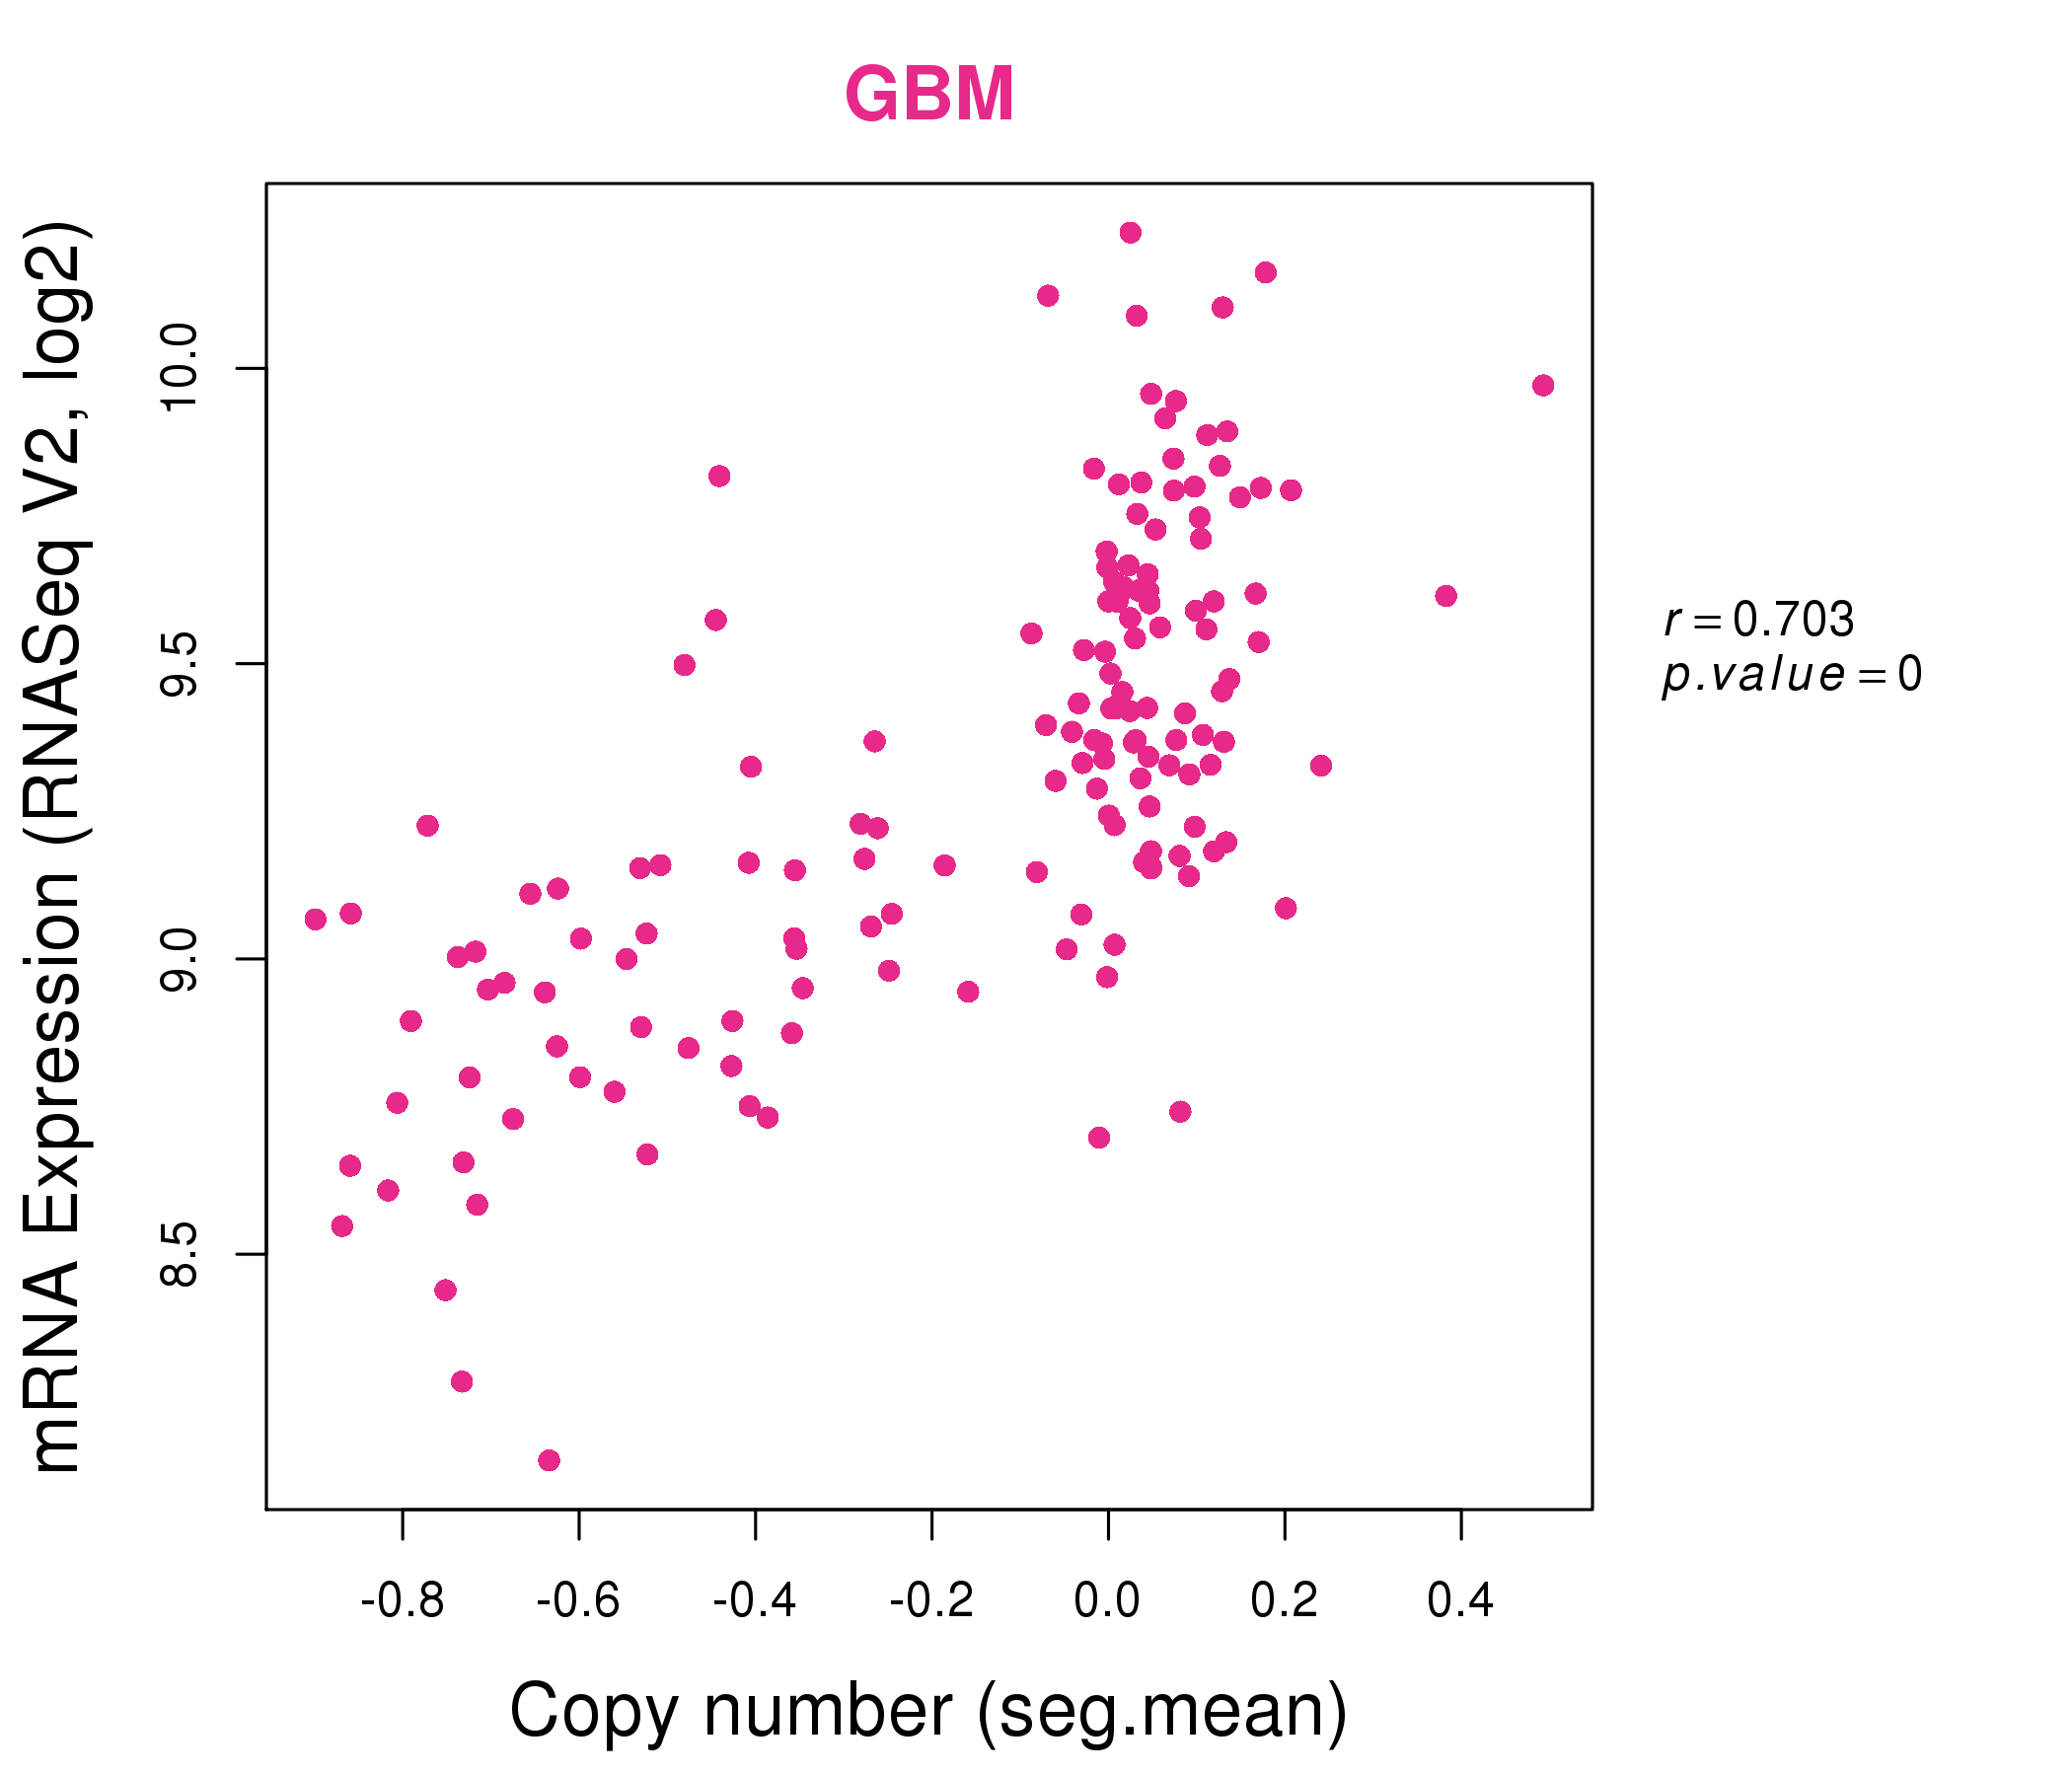
| * This plots show the correlation between CNV and gene expression. |
: Open all plots for all cancer types
 |
|
 |
|
| Top |
| Gene-Gene Network Information |
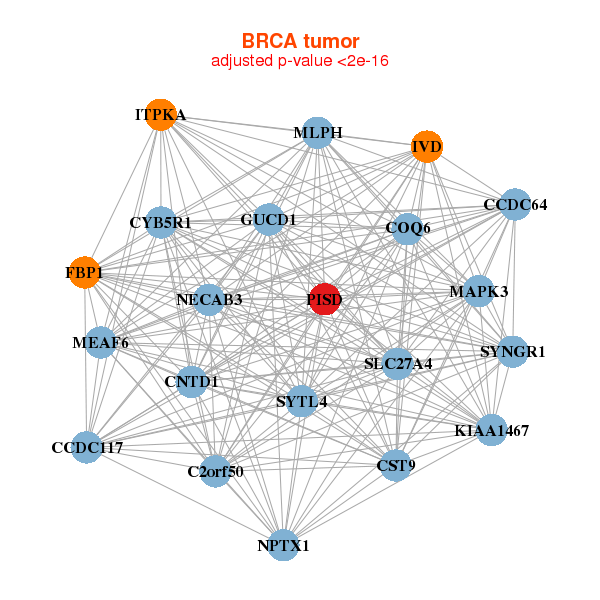
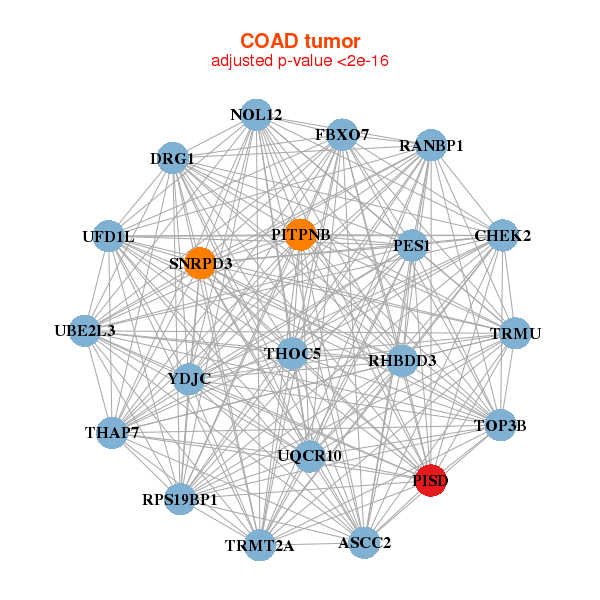
| * Co-Expression network figures were drawn using R package igraph. Only the top 20 genes with the highest correlations were shown. Red circle: input gene, orange circle: cell metabolism gene, sky circle: other gene |
: Open all plots for all cancer types
 |
| ||||
| GUCD1,C2orf50,CCDC117,CCDC64,CNTD1,COQ6,CST9, CYB5R1,FBP1,ITPKA,IVD,KIAA1467,MAPK3,MEAF6, MLPH,NECAB3,NPTX1,PISD,SLC27A4,SYNGR1,SYTL4 | AIFM2,ALDH4A1,BCAP31,BHMT2,NPR3,CES1,CES1P1, DHDDS,ELMOD3,EPB41L1,FADS3,GCOM1,HSPA12A,ITPK1, KANK4,LEP,MYO1C,PISD,PYGL,SNN,TNIP1 | ||||
 |
| ||||
| ASCC2,CHEK2,DRG1,FBXO7,NOL12,PES1,PISD, PITPNB,RANBP1,RHBDD3,RPS19BP1,SNRPD3,THAP7,THOC5, TOP3B,TRMT2A,TRMU,UBE2L3,UFD1L,UQCR10,YDJC | AFMID,BNIP1,C12orf66,COA1,TRMT13,CPSF4,CTNNBIP1, HSCB,KCTD6,GPALPP1,ICE2,NSUN4,NUPL2,PCID2, PDCD2,PISD,PRMT6,RPAIN,TBP,TMEM218,ZNF273 |
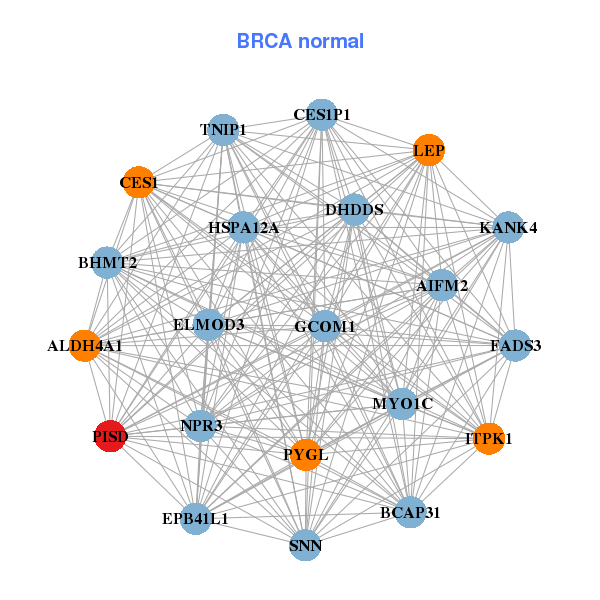
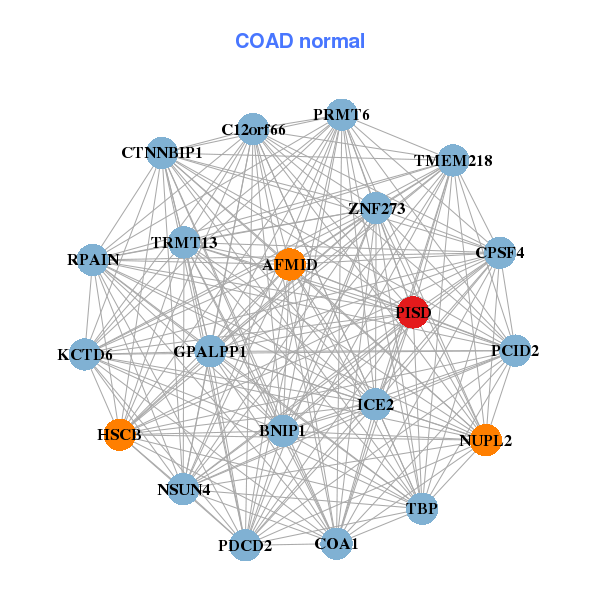
| * Co-Expression network figures were drawn using R package igraph. Only the top 20 genes with the highest correlations were shown. Red circle: input gene, orange circle: cell metabolism gene, sky circle: other gene |
: Open all plots for all cancer types
| Top |
: Open all interacting genes' information including KEGG pathway for all interacting genes from DAVID
| Top |
| Pharmacological Information for PISD |
| DB Category | DB Name | DB's ID and Url link |
| * Gene Centered Interaction Network. |
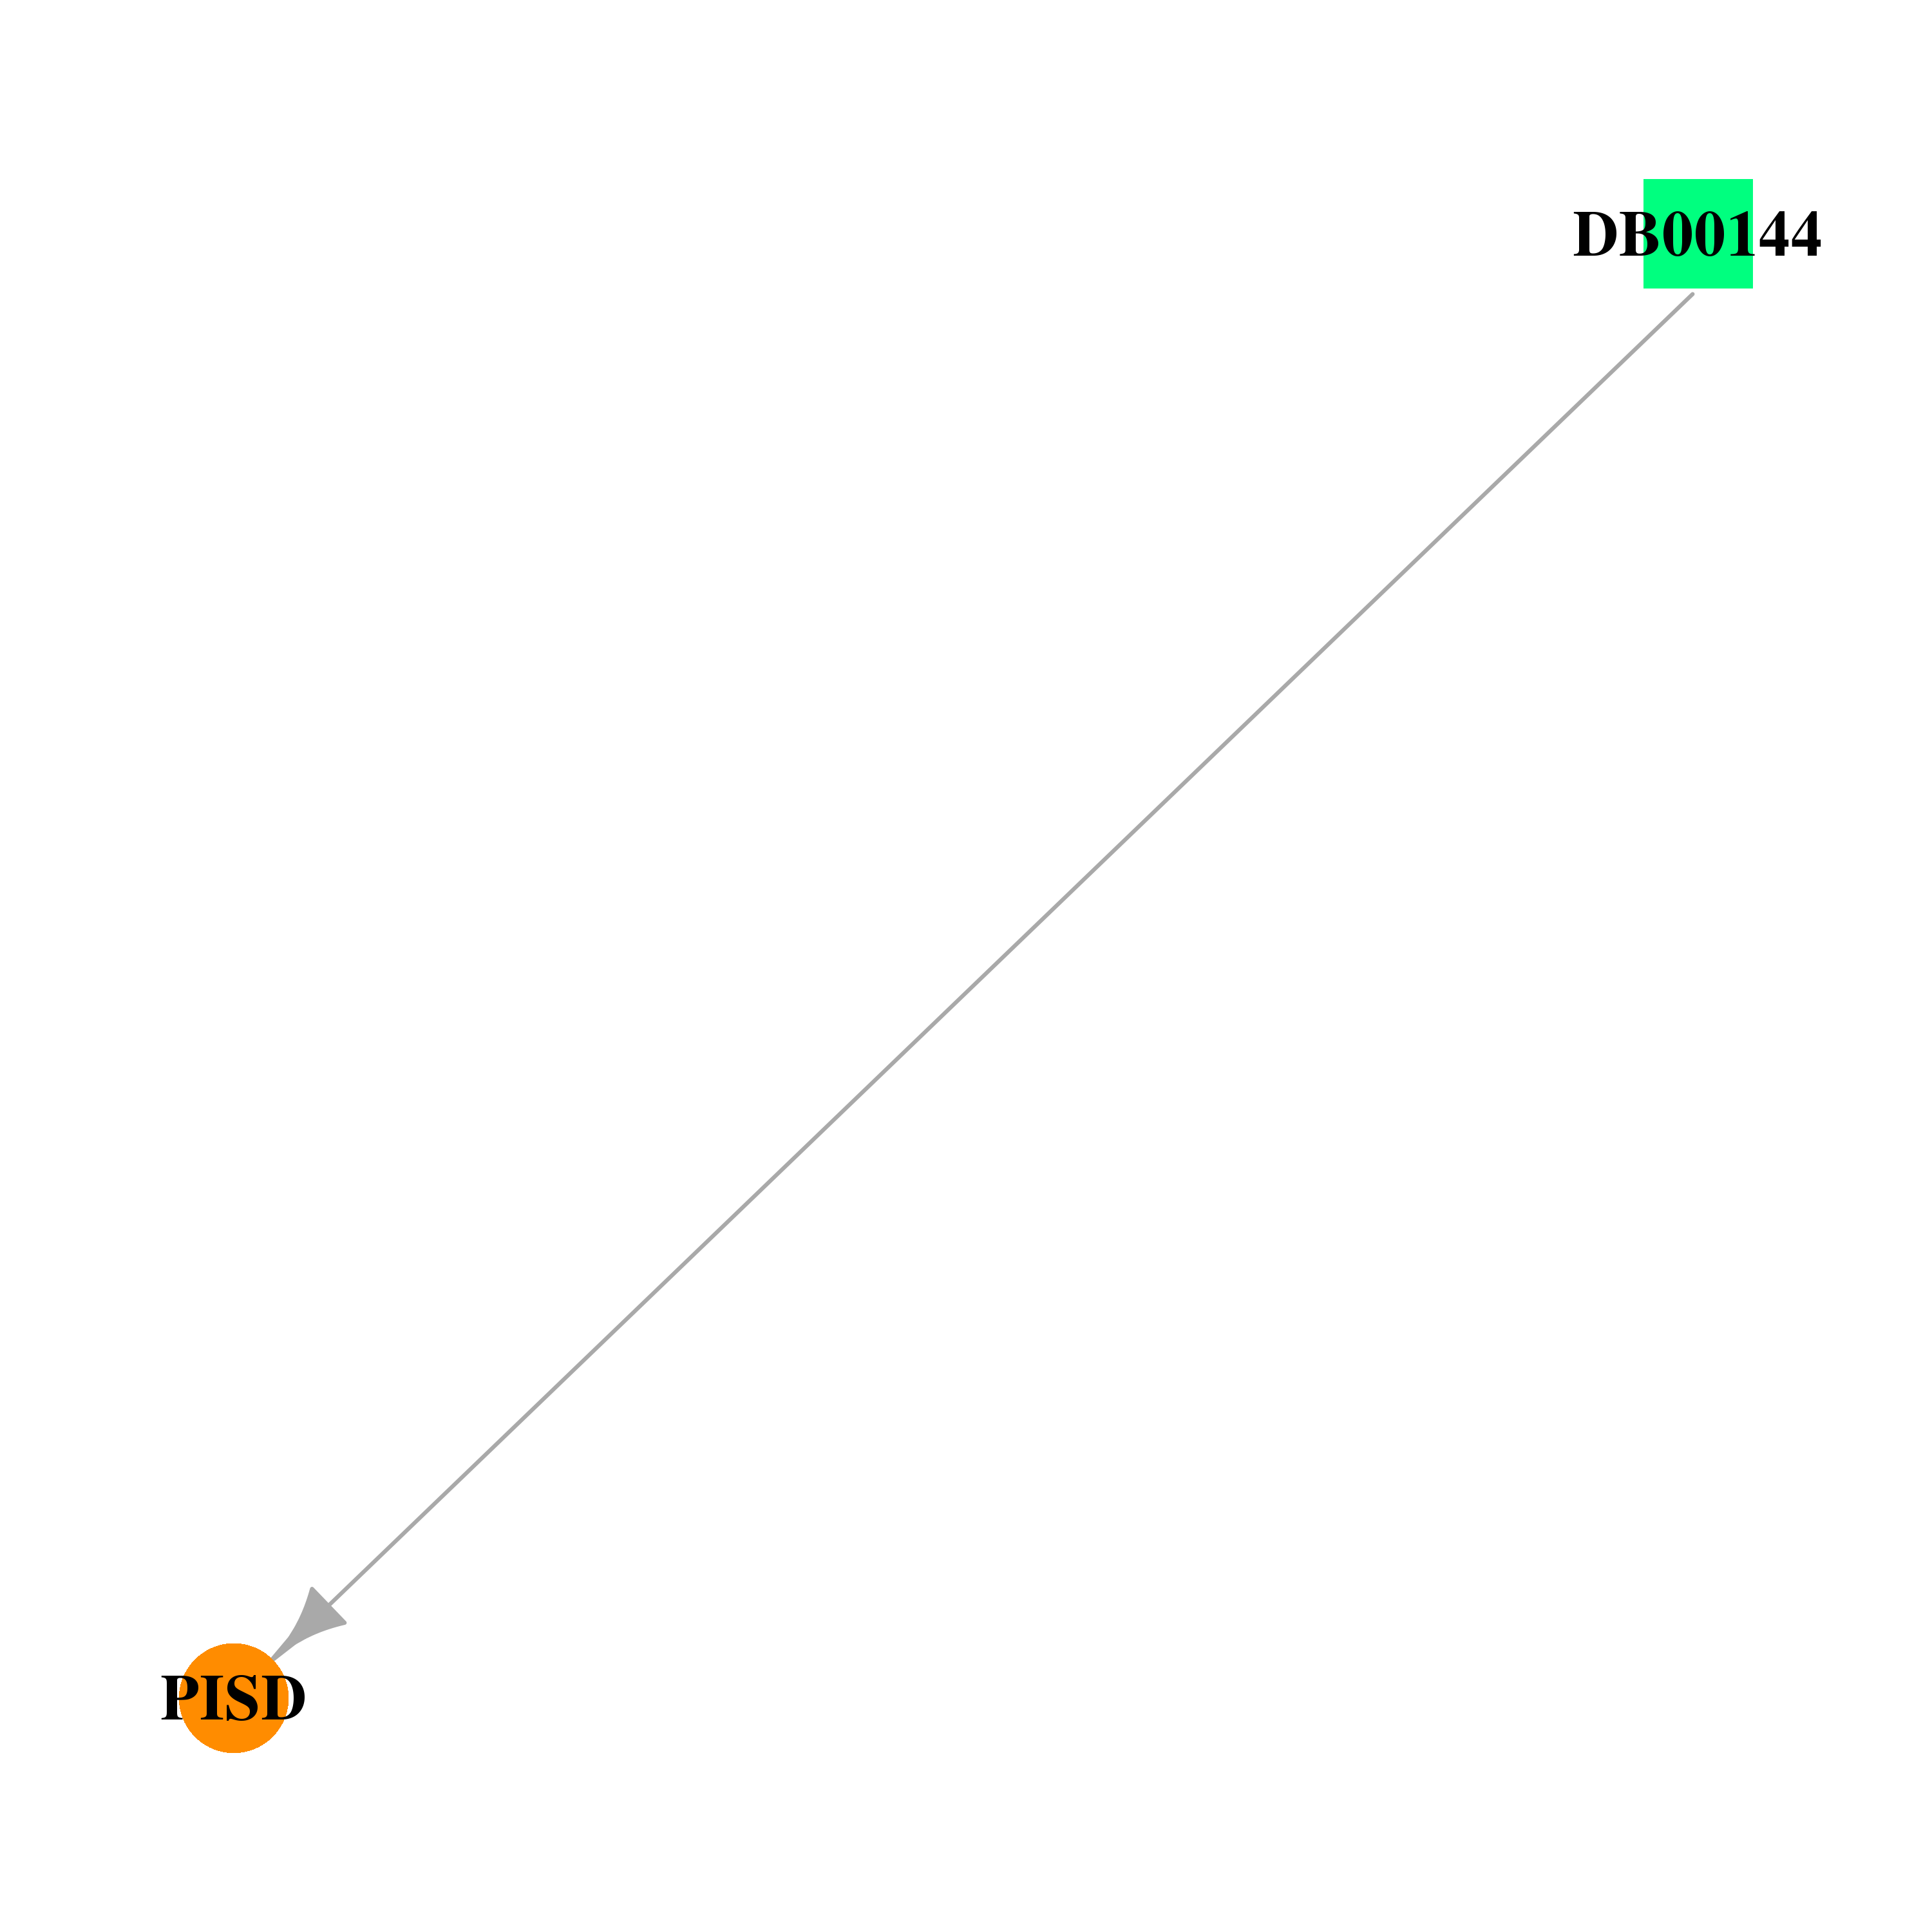 |
| * Drug Centered Interaction Network. |
| DrugBank ID | Target Name | Drug Groups | Generic Name | Drug Centered Network | Drug Structure |
| DB00144 | phosphatidylserine decarboxylase | approved; nutraceutical | Phosphatidylserine |  |  |
| Top |
| Cross referenced IDs for PISD |
| * We obtained these cross-references from Uniprot database. It covers 150 different DBs, 18 categories. http://www.uniprot.org/help/cross_references_section |
: Open all cross reference information
|
Copyright © 2016-Present - The Univsersity of Texas Health Science Center at Houston @ |