|
||||||||||||||||||||
| |
| Phenotypic Information (metabolism pathway, cancer, disease, phenome) |
| |
| |
| Gene-Gene Network Information: Co-Expression Network, Interacting Genes & KEGG |
| |
|


| Gene Summary for NAT6 |
| Top |
| Phenotypic Information for NAT6(metabolism pathway, cancer, disease, phenome) |
| Cancer | CGAP: NAT6 |
| Familial Cancer Database: NAT6 | |
| * This gene is included in those cancer gene databases. |
|
|
|
|
|
| . | ||||||||||||||
Oncogene 1 | Significant driver gene in | |||||||||||||||||||
| cf) number; DB name 1 Oncogene; http://nar.oxfordjournals.org/content/35/suppl_1/D721.long, 2 Tumor Suppressor gene; https://bioinfo.uth.edu/TSGene/, 3 Cancer Gene Census; http://www.nature.com/nrc/journal/v4/n3/abs/nrc1299.html, 4 CancerGenes; http://nar.oxfordjournals.org/content/35/suppl_1/D721.long, 5 Network of Cancer Gene; http://ncg.kcl.ac.uk/index.php, 1Therapeutic Vulnerabilities in Cancer; http://cbio.mskcc.org/cancergenomics/statius/ |
| KEGG_TYROSINE_METABOLISM KEGG_PHENYLALANINE_METABOLISM | |
| OMIM | 607073; gene. |
| Orphanet | |
| Disease | KEGG Disease: NAT6 |
| MedGen: NAT6 (Human Medical Genetics with Condition) | |
| ClinVar: NAT6 | |
| Phenotype | MGI: NAT6 (International Mouse Phenotyping Consortium) |
| PhenomicDB: NAT6 | |
| Mutations for NAT6 |
| * Under tables are showing count per each tissue to give us broad intuition about tissue specific mutation patterns.You can go to the detailed page for each mutation database's web site. |
| There's no structural variation information in COSMIC data for this gene. |
| * From mRNA Sanger sequences, Chitars2.0 arranged chimeric transcripts. This table shows NAT6 related fusion information. |
| ID | Head Gene | Tail Gene | Accession | Gene_a | qStart_a | qEnd_a | Chromosome_a | tStart_a | tEnd_a | Gene_a | qStart_a | qEnd_a | Chromosome_a | tStart_a | tEnd_a |
| Top |
| There's no copy number variation information in COSMIC data for this gene. |
| Top |
|
 |
| Top |
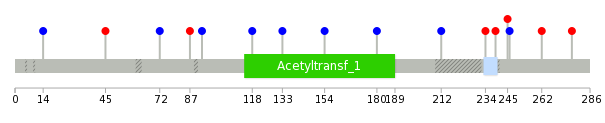
| Stat. for Non-Synonymous SNVs (# total SNVs=7) | (# total SNVs=7) |
 |  |
(# total SNVs=0) | (# total SNVs=0) |
| Top |
| * When you move the cursor on each content, you can see more deailed mutation information on the Tooltip. Those are primary_site,primary_histology,mutation(aa),pubmedID. |
| GRCh37 position | Mutation(aa) | Unique sampleID count |
| chr3:50334355-50334355 | p.V202V | 2 |
| chr3:50334066-50334066 | p.R299C | 2 |
| chr3:50334626-50334626 | p.R112H | 2 |
| chr3:50334162-50334162 | p.P267S | 2 |
| chr3:50334179-50334179 | p.P261H | 1 |
| chr3:50334963-50334963 | p.? | 1 |
| chr3:50334195-50334195 | p.R256G | 1 |
| chr3:50334259-50334259 | p.F234F | 1 |
| chr3:50334433-50334433 | p.R176R | 1 |
| chr3:50334462-50334462 | p.R167W | 1 |
| Top |
|
 |
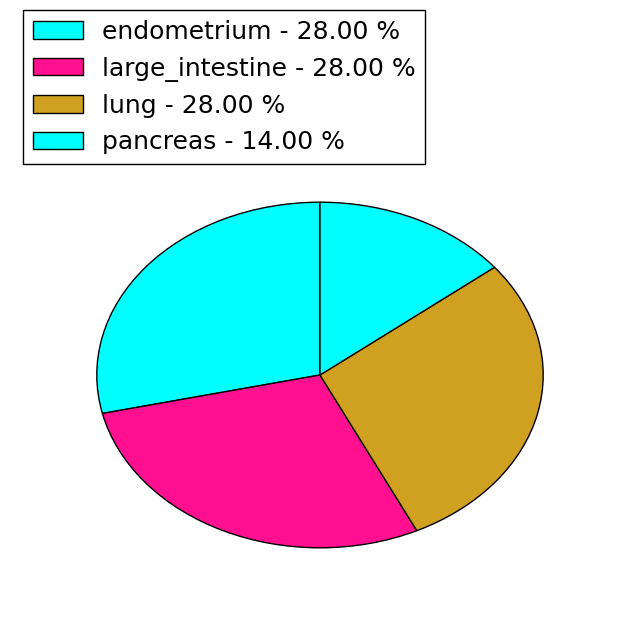
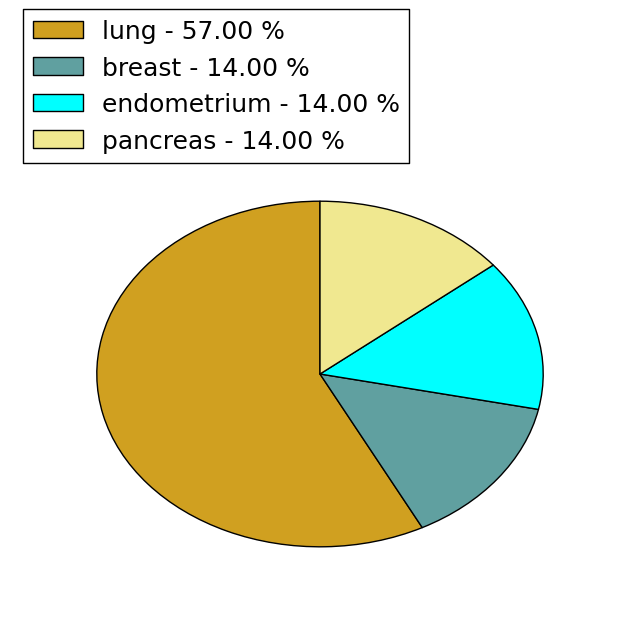
| Point Mutation/ Tissue ID | 1 | 2 | 3 | 4 | 5 | 6 | 7 | 8 | 9 | 10 | 11 | 12 | 13 | 14 | 15 | 16 | 17 | 18 | 19 | 20 |
| # sample | 1 | 2 | 1 | 3 | 4 | 2 | 2 | |||||||||||||
| # mutation | 1 | 2 | 1 | 3 | 5 | 2 | 2 | |||||||||||||
| nonsynonymous SNV | 2 | 1 | 1 | 2 | 1 | |||||||||||||||
| synonymous SNV | 1 | 1 | 2 | 4 | 1 |
| cf) Tissue ID; Tissue type (1; BLCA[Bladder Urothelial Carcinoma], 2; BRCA[Breast invasive carcinoma], 3; CESC[Cervical squamous cell carcinoma and endocervical adenocarcinoma], 4; COAD[Colon adenocarcinoma], 5; GBM[Glioblastoma multiforme], 6; Glioma Low Grade, 7; HNSC[Head and Neck squamous cell carcinoma], 8; KICH[Kidney Chromophobe], 9; KIRC[Kidney renal clear cell carcinoma], 10; KIRP[Kidney renal papillary cell carcinoma], 11; LAML[Acute Myeloid Leukemia], 12; LUAD[Lung adenocarcinoma], 13; LUSC[Lung squamous cell carcinoma], 14; OV[Ovarian serous cystadenocarcinoma ], 15; PAAD[Pancreatic adenocarcinoma], 16; PRAD[Prostate adenocarcinoma], 17; SKCM[Skin Cutaneous Melanoma], 18:STAD[Stomach adenocarcinoma], 19:THCA[Thyroid carcinoma], 20:UCEC[Uterine Corpus Endometrial Carcinoma]) |
| Top |
| * We represented just top 10 SNVs. When you move the cursor on each content, you can see more deailed mutation information on the Tooltip. Those are primary_site, primary_histology, mutation(aa), pubmedID. |
| Genomic Position | Mutation(aa) | Unique sampleID count |
| chr3:50334179 | p.P133P,NAT6 | 1 |
| chr3:50334919 | p.P118P,NAT6 | 1 |
| chr3:50334195 | p.S93S,NAT6 | 1 |
| chr3:50334259 | p.R87H,NAT6 | 1 |
| chr3:50334355 | p.L72L,NAT6 | 1 |
| chr3:50334433 | p.P45L,NAT6 | 1 |
| chr3:50334496 | p.T14T | 1 |
| chr3:50334541 | p.R277C,NAT6 | 1 |
| chr3:50334066 | p.P262H,NAT6 | 1 |
| chr3:50334616 | p.P246P,NAT6 | 1 |
| * Copy number data were extracted from TCGA using R package TCGA-Assembler. The URLs of all public data files on TCGA DCC data server were gathered on Jan-05-2015. Function ProcessCNAData in TCGA-Assembler package was used to obtain gene-level copy number value which is calculated as the average copy number of the genomic region of a gene. |
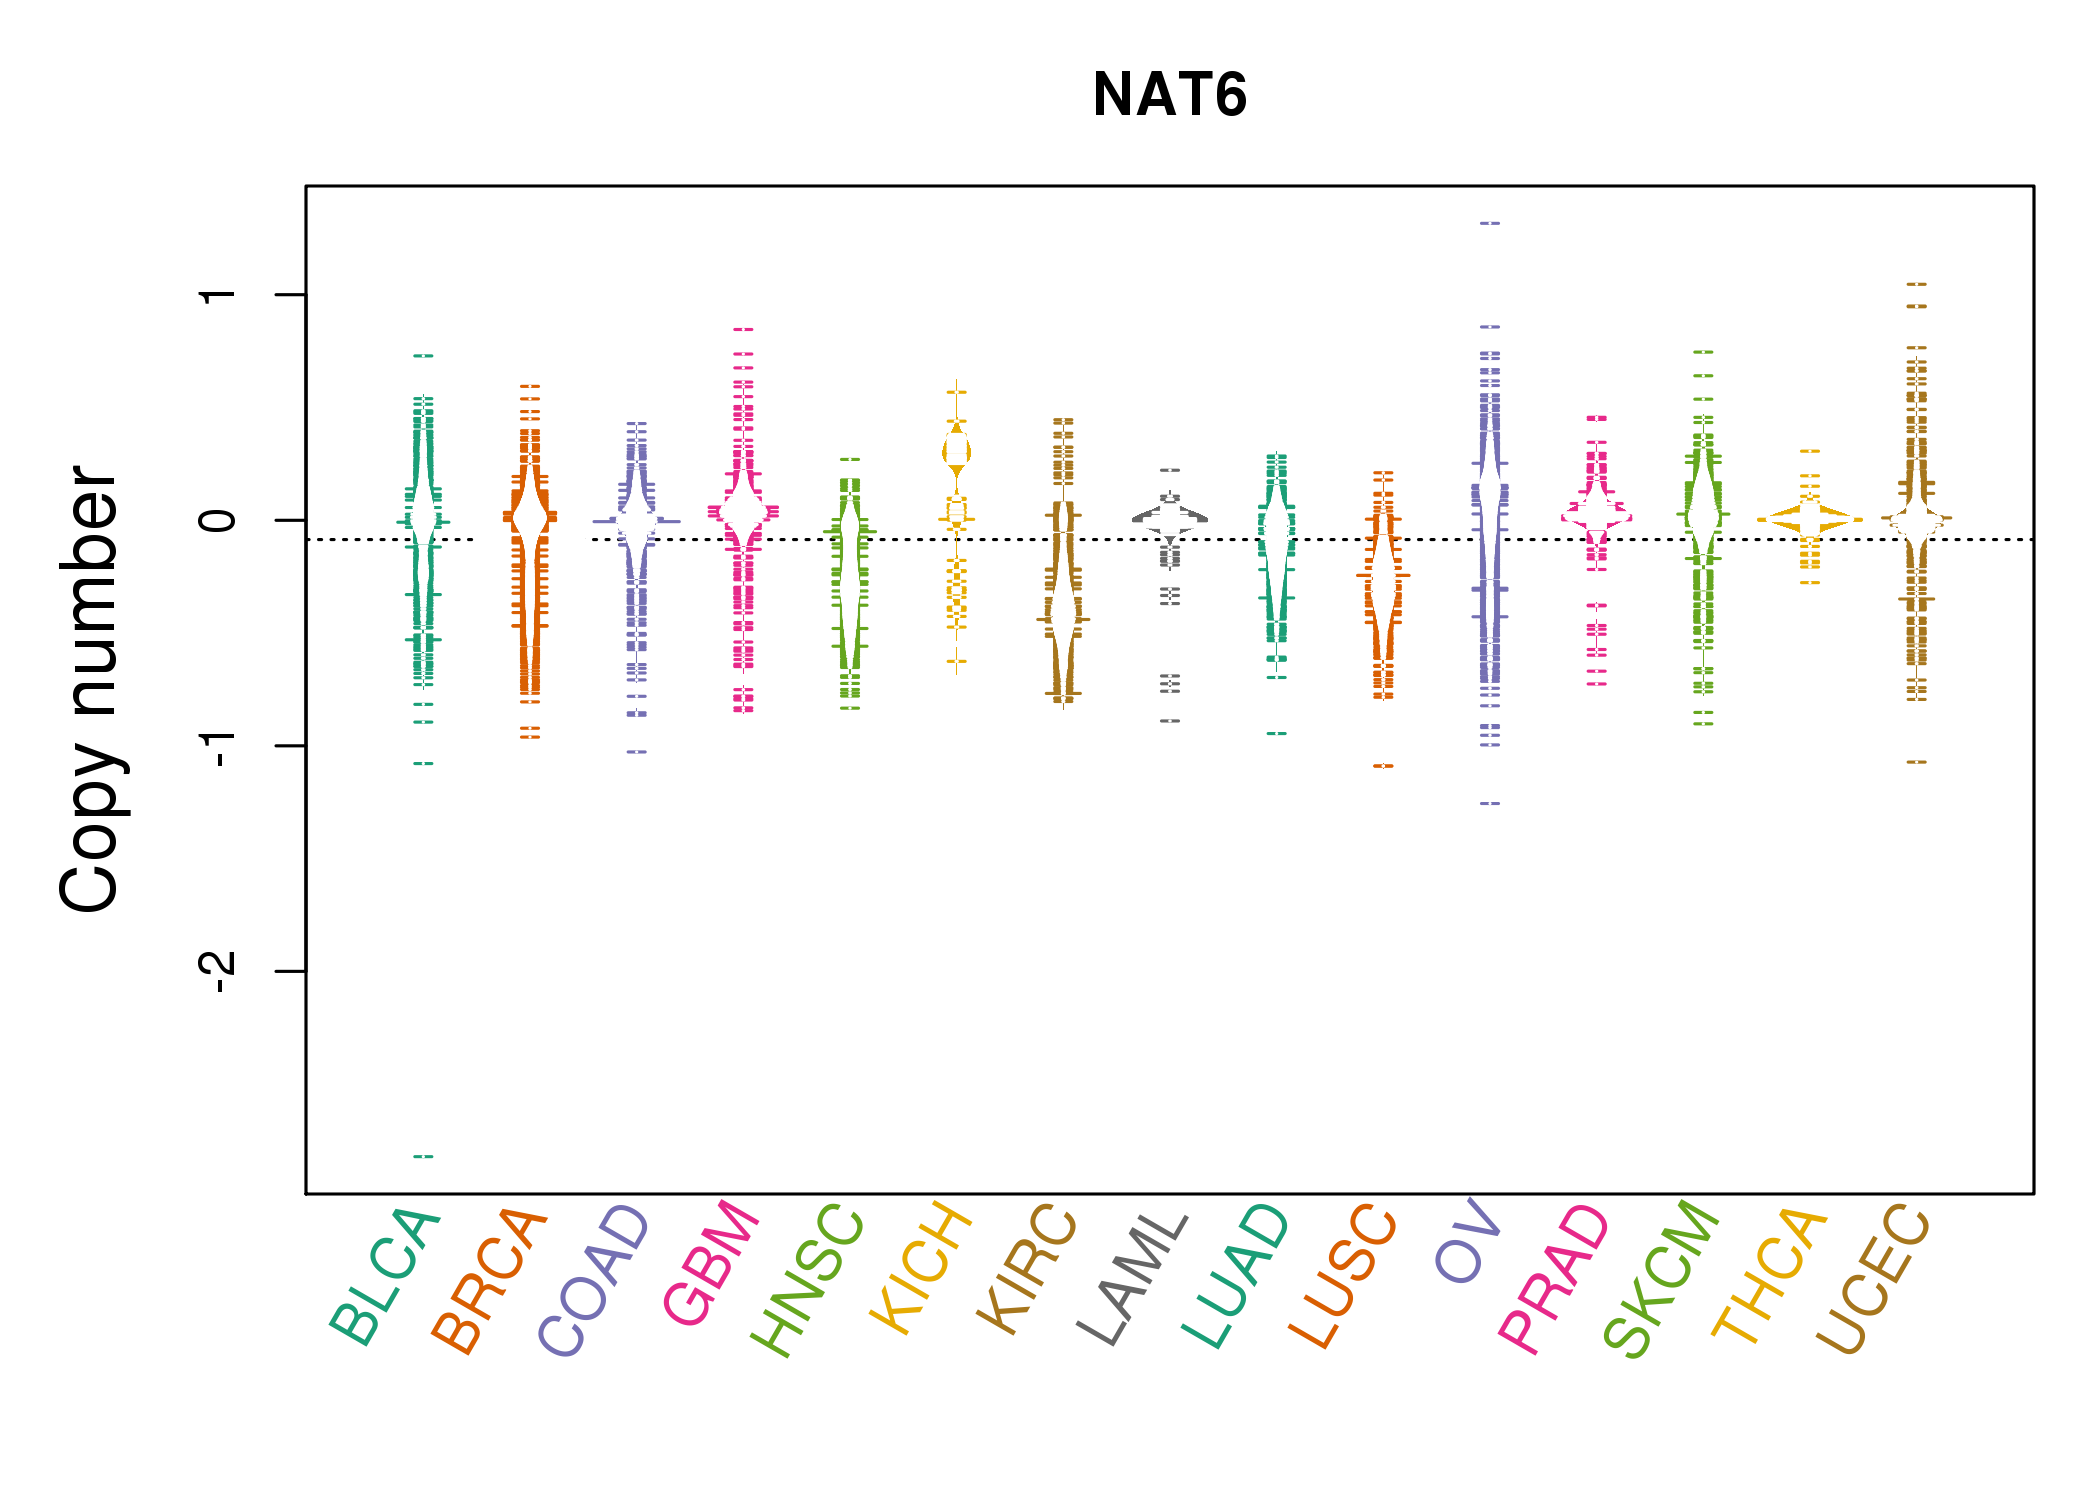 |
| cf) Tissue ID[Tissue type]: BLCA[Bladder Urothelial Carcinoma], BRCA[Breast invasive carcinoma], CESC[Cervical squamous cell carcinoma and endocervical adenocarcinoma], COAD[Colon adenocarcinoma], GBM[Glioblastoma multiforme], Glioma Low Grade, HNSC[Head and Neck squamous cell carcinoma], KICH[Kidney Chromophobe], KIRC[Kidney renal clear cell carcinoma], KIRP[Kidney renal papillary cell carcinoma], LAML[Acute Myeloid Leukemia], LUAD[Lung adenocarcinoma], LUSC[Lung squamous cell carcinoma], OV[Ovarian serous cystadenocarcinoma ], PAAD[Pancreatic adenocarcinoma], PRAD[Prostate adenocarcinoma], SKCM[Skin Cutaneous Melanoma], STAD[Stomach adenocarcinoma], THCA[Thyroid carcinoma], UCEC[Uterine Corpus Endometrial Carcinoma] |
| Top |
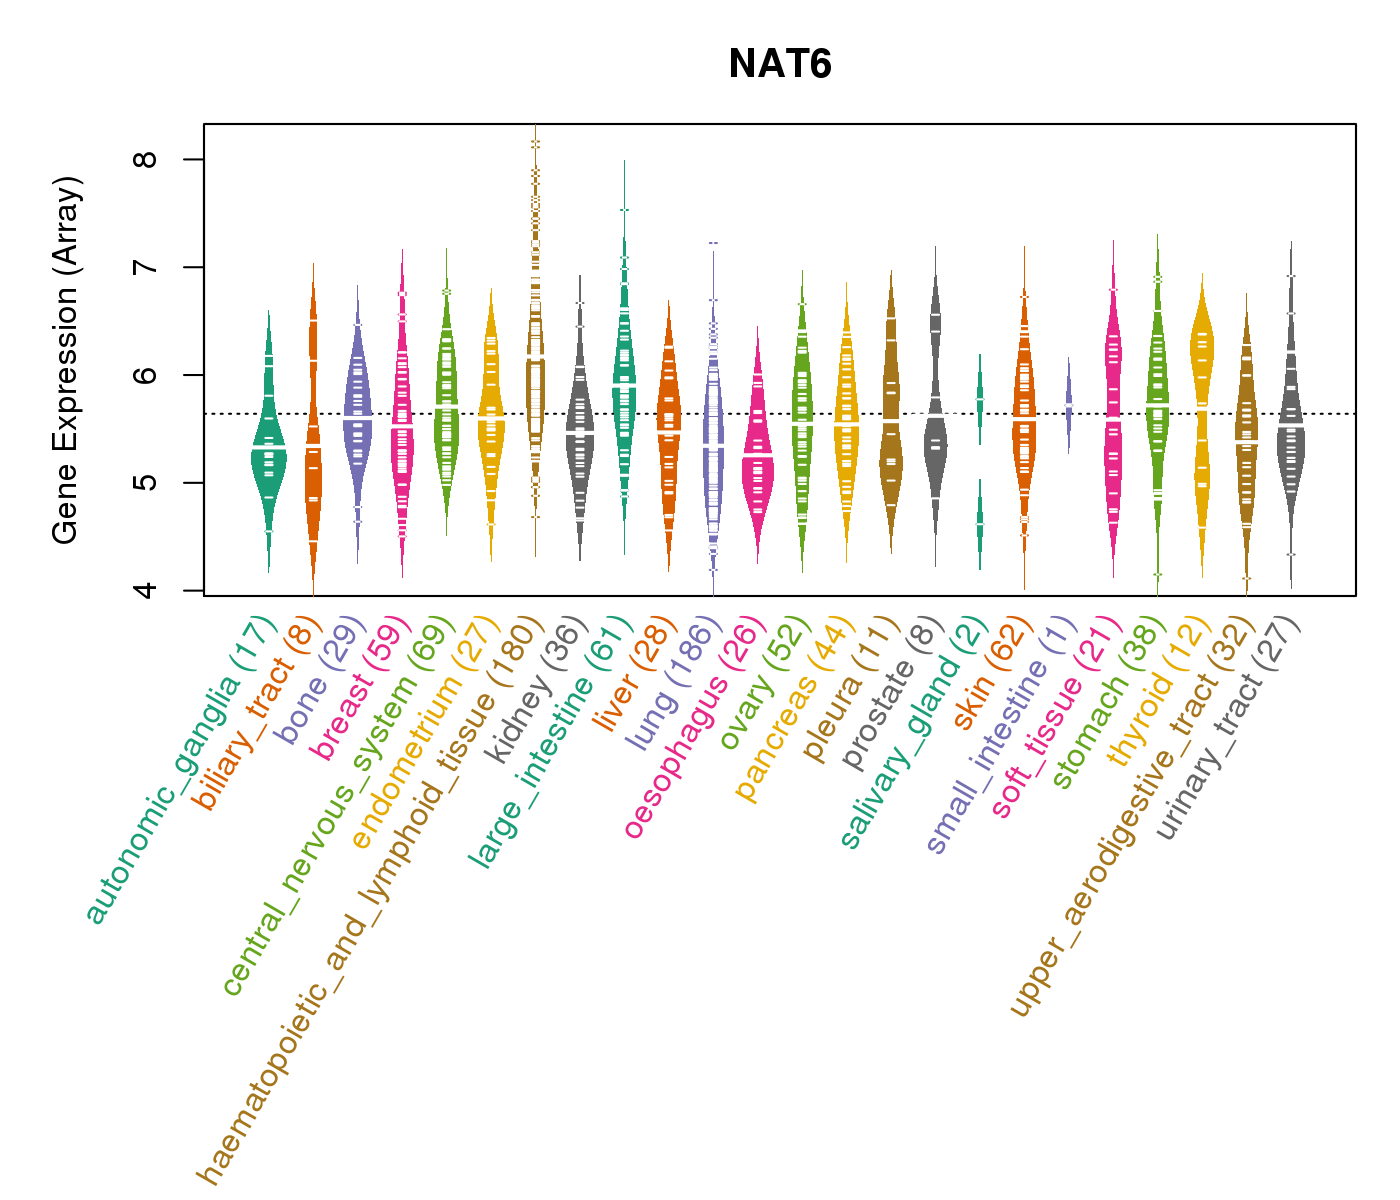
| Gene Expression for NAT6 |
| * CCLE gene expression data were extracted from CCLE_Expression_Entrez_2012-10-18.res: Gene-centric RMA-normalized mRNA expression data. |
 |
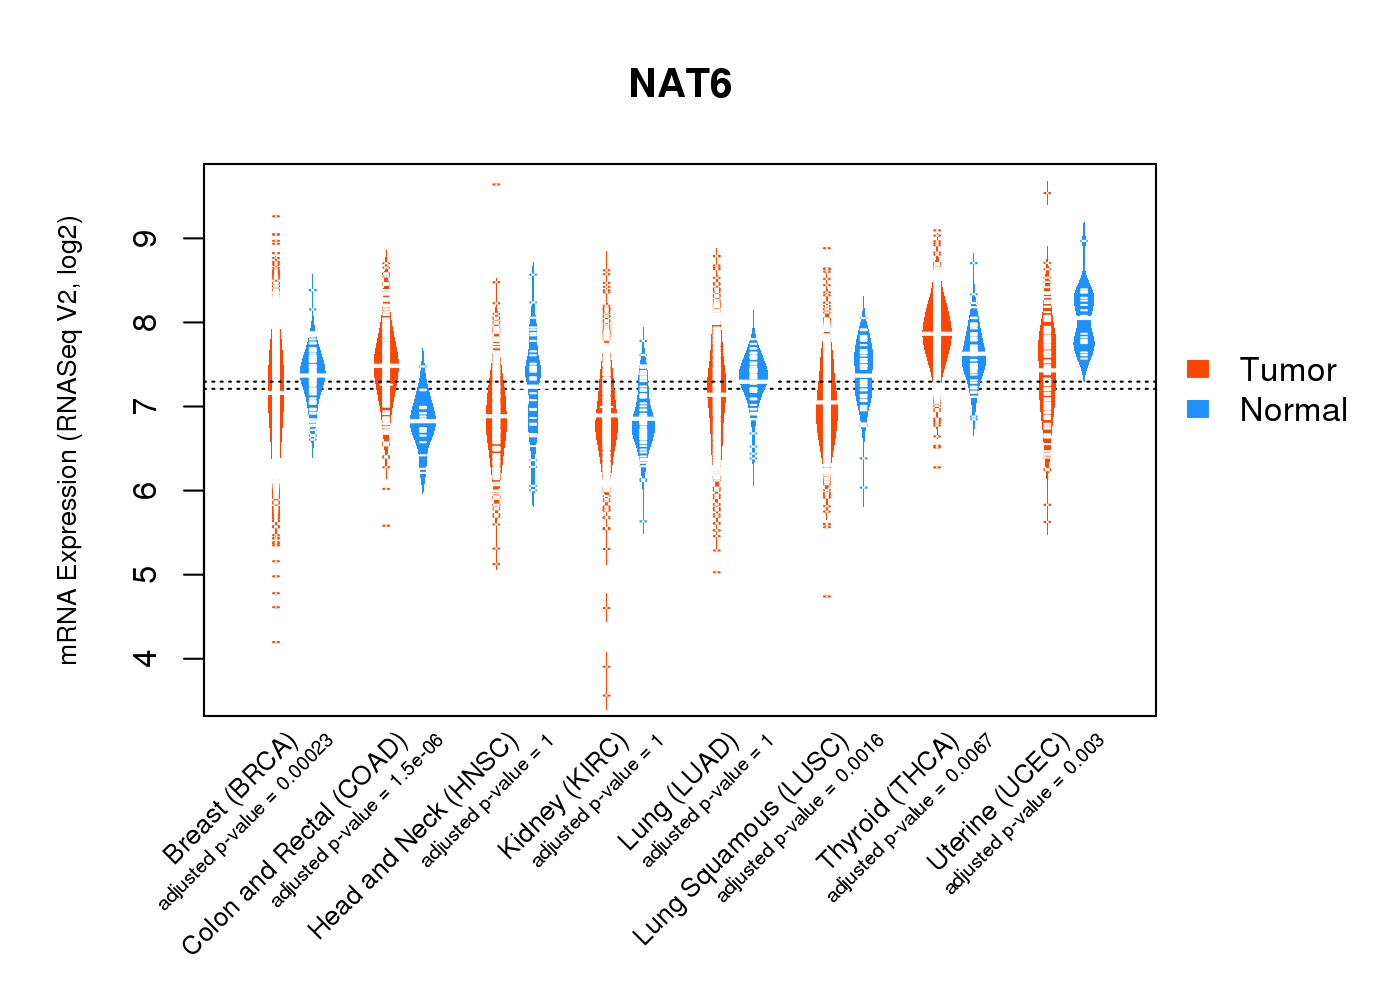
| * Normalized gene expression data of RNASeqV2 was extracted from TCGA using R package TCGA-Assembler. The URLs of all public data files on TCGA DCC data server were gathered at Jan-05-2015. Only eight cancer types have enough normal control samples for differential expression analysis. (t test, adjusted p<0.05 (using Benjamini-Hochberg FDR)) |
 |
| Top |
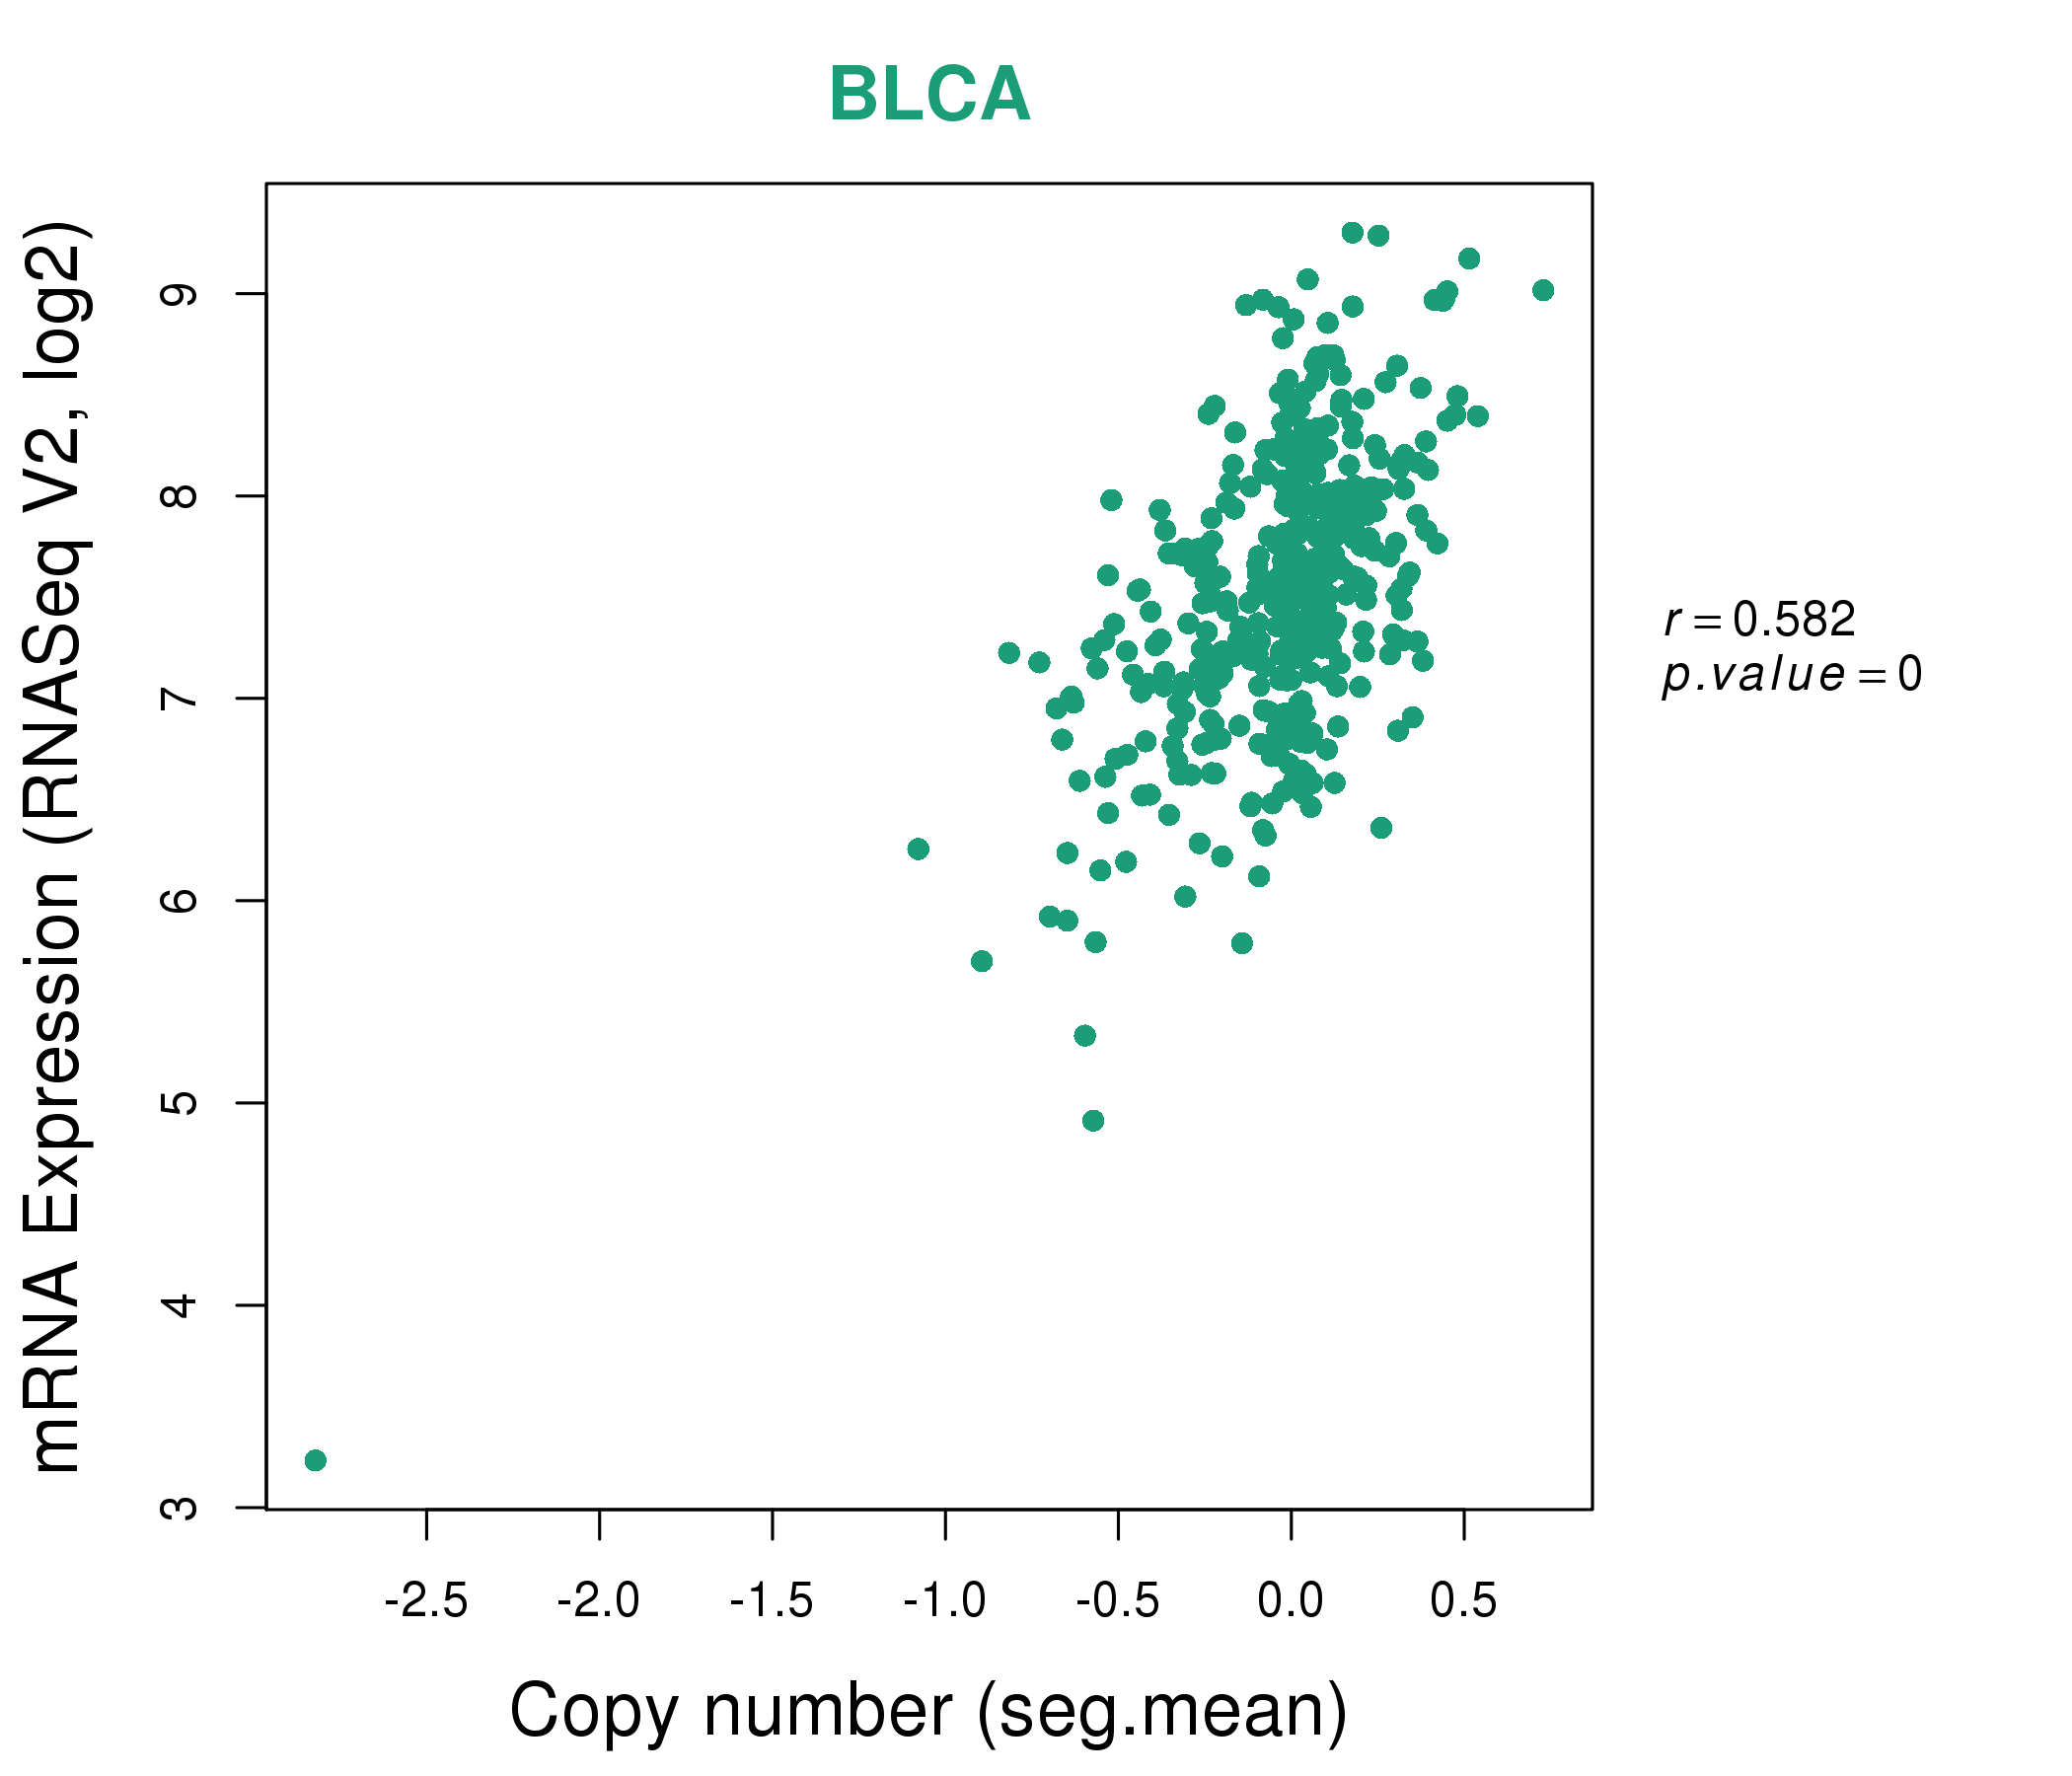
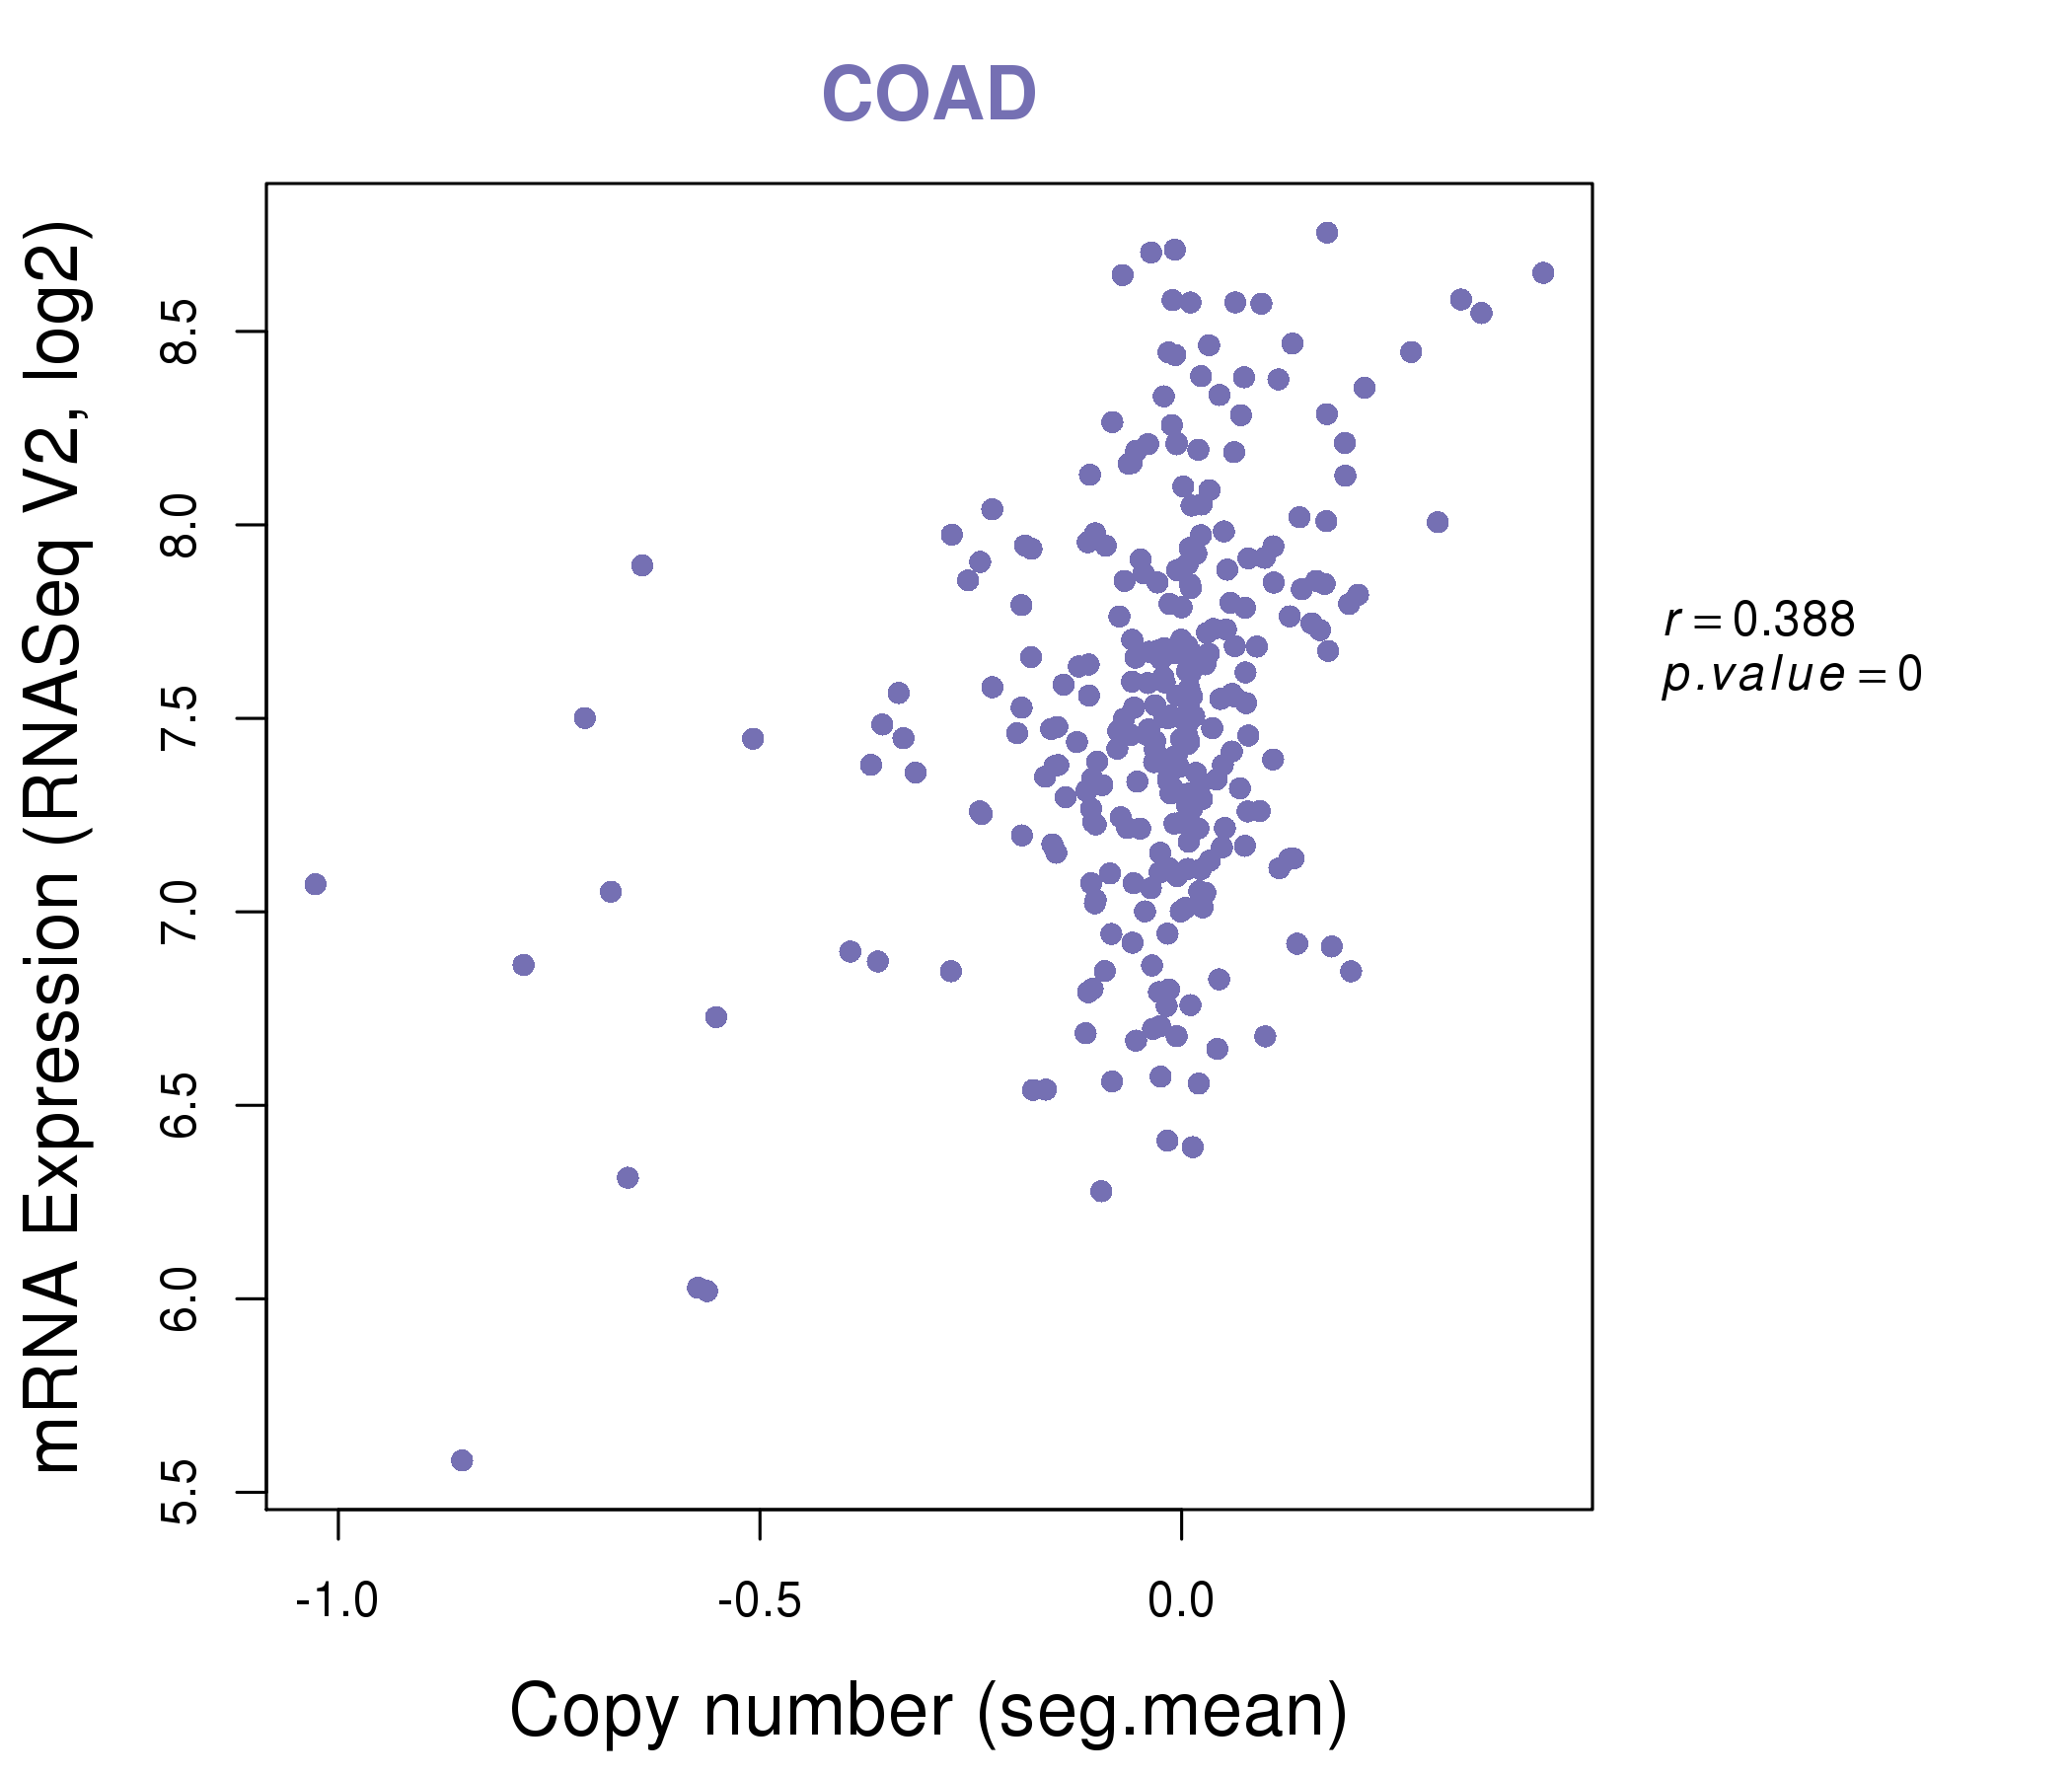
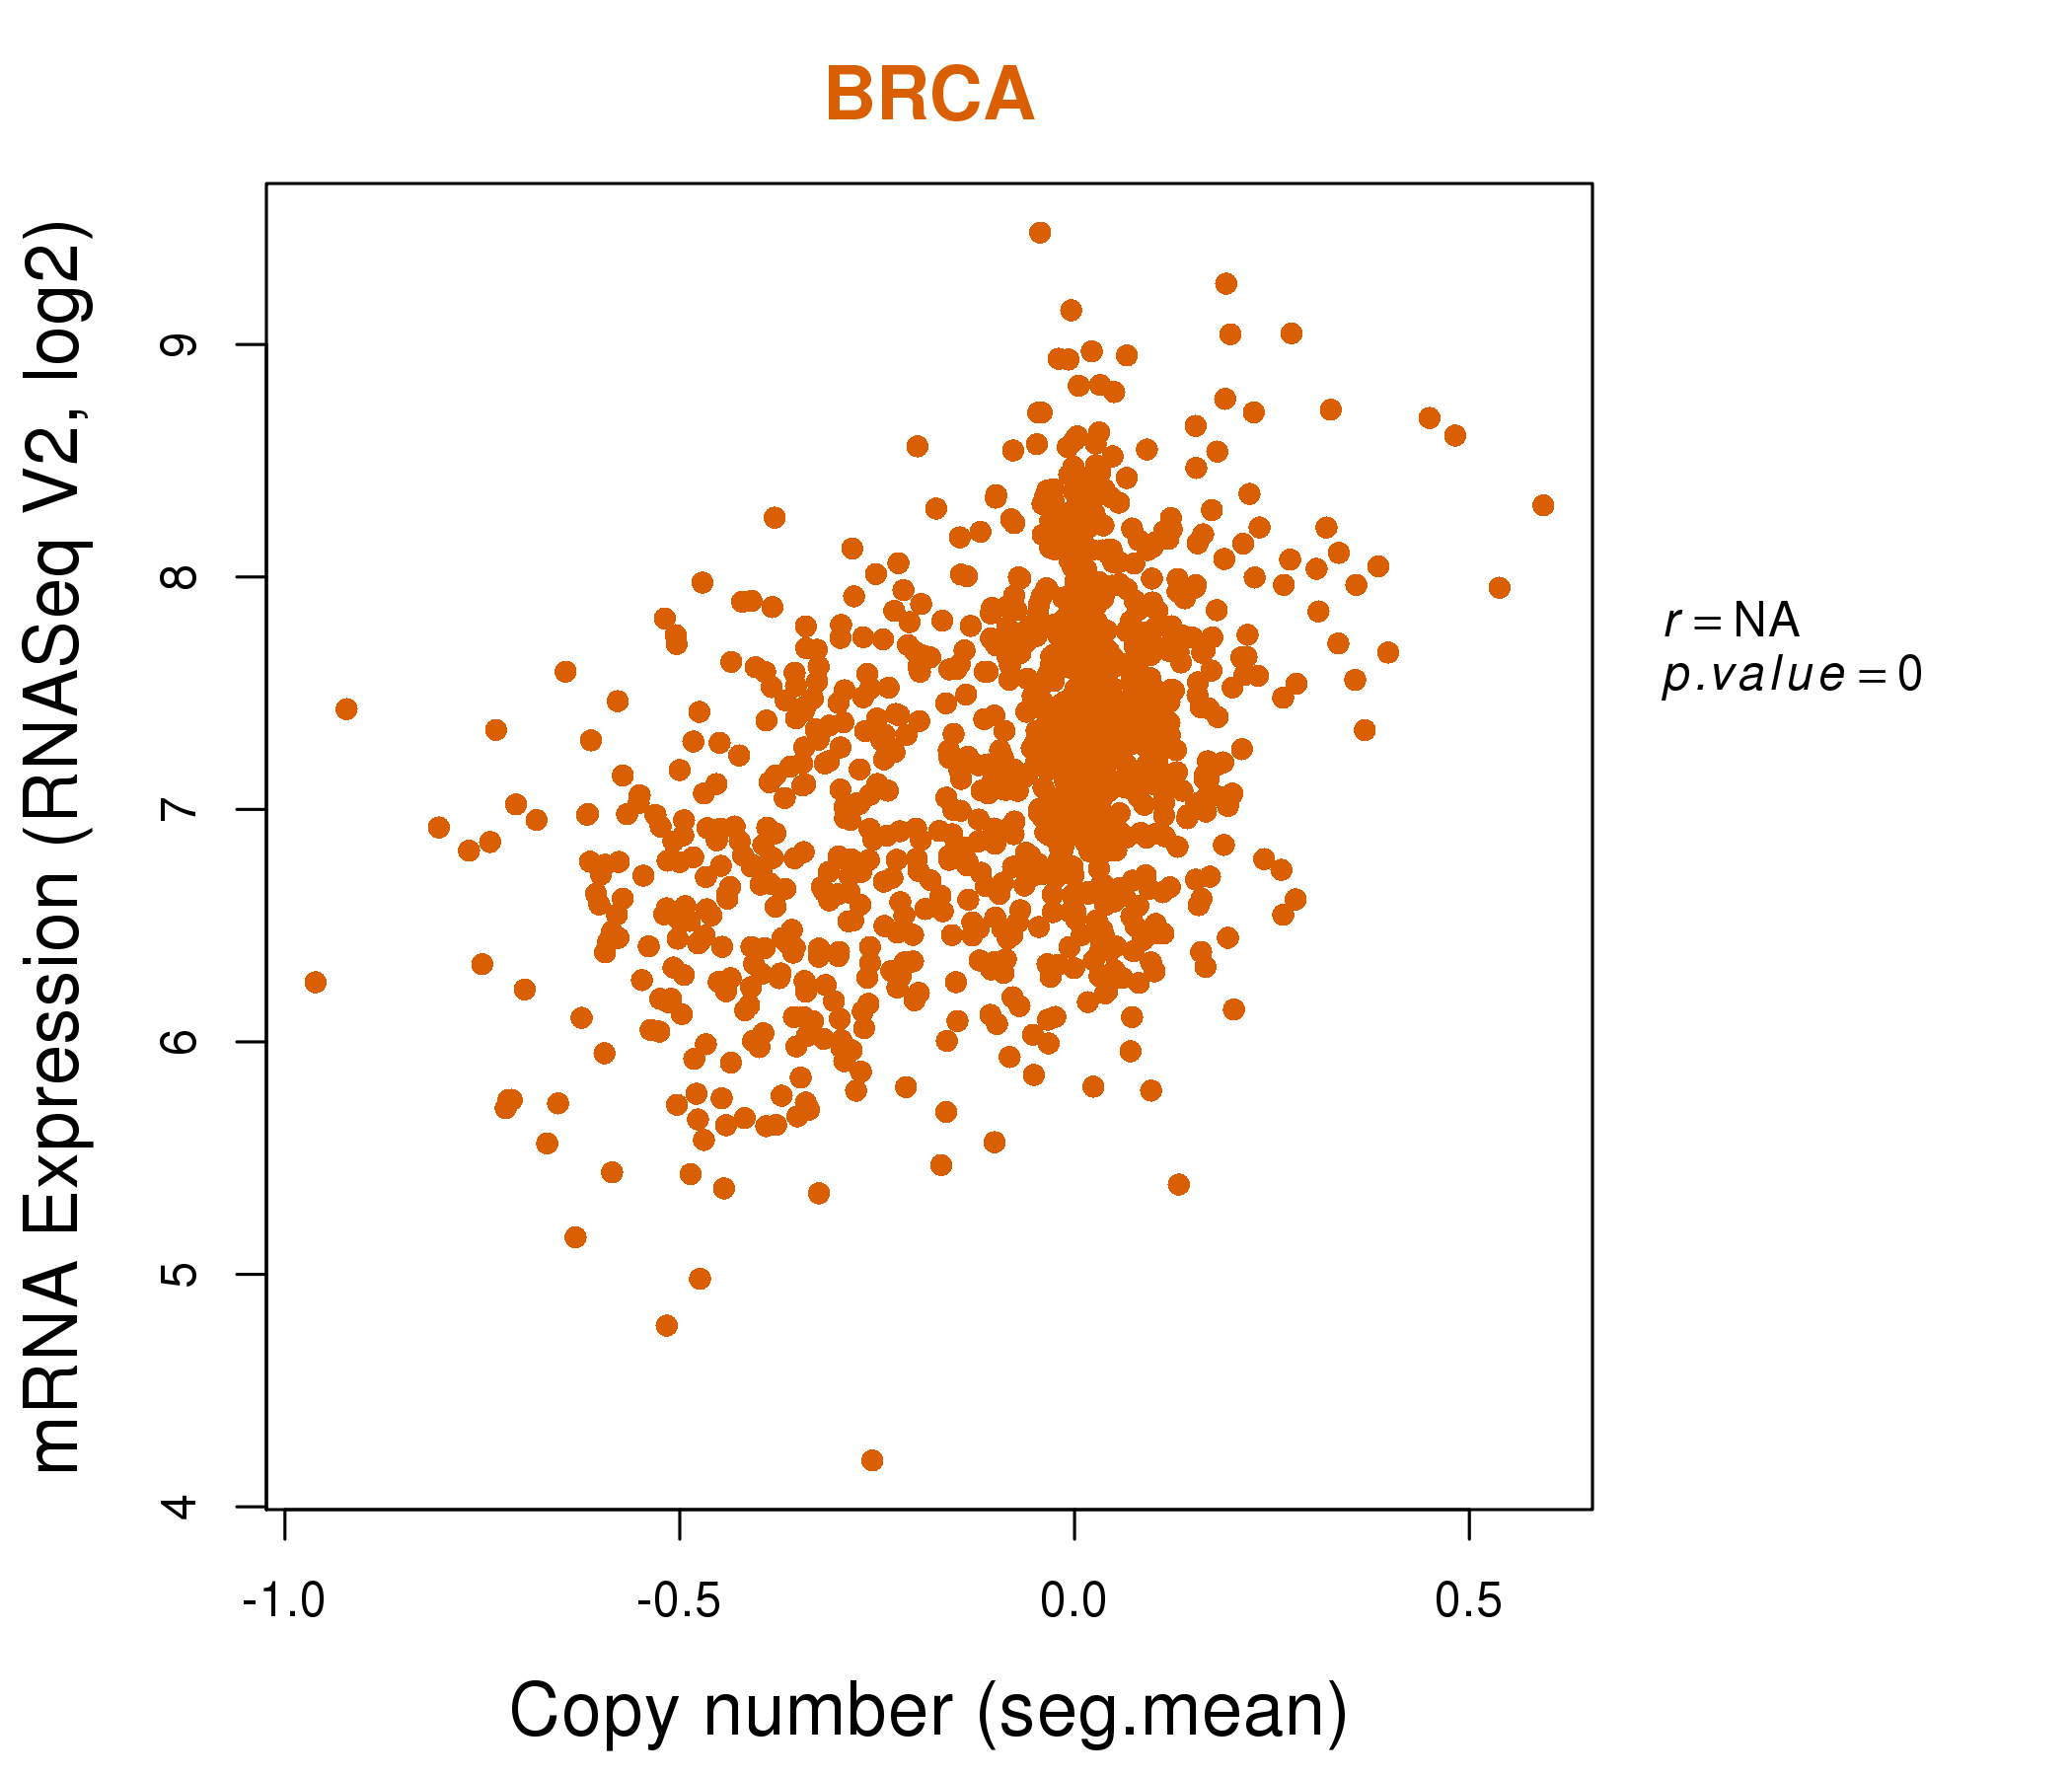
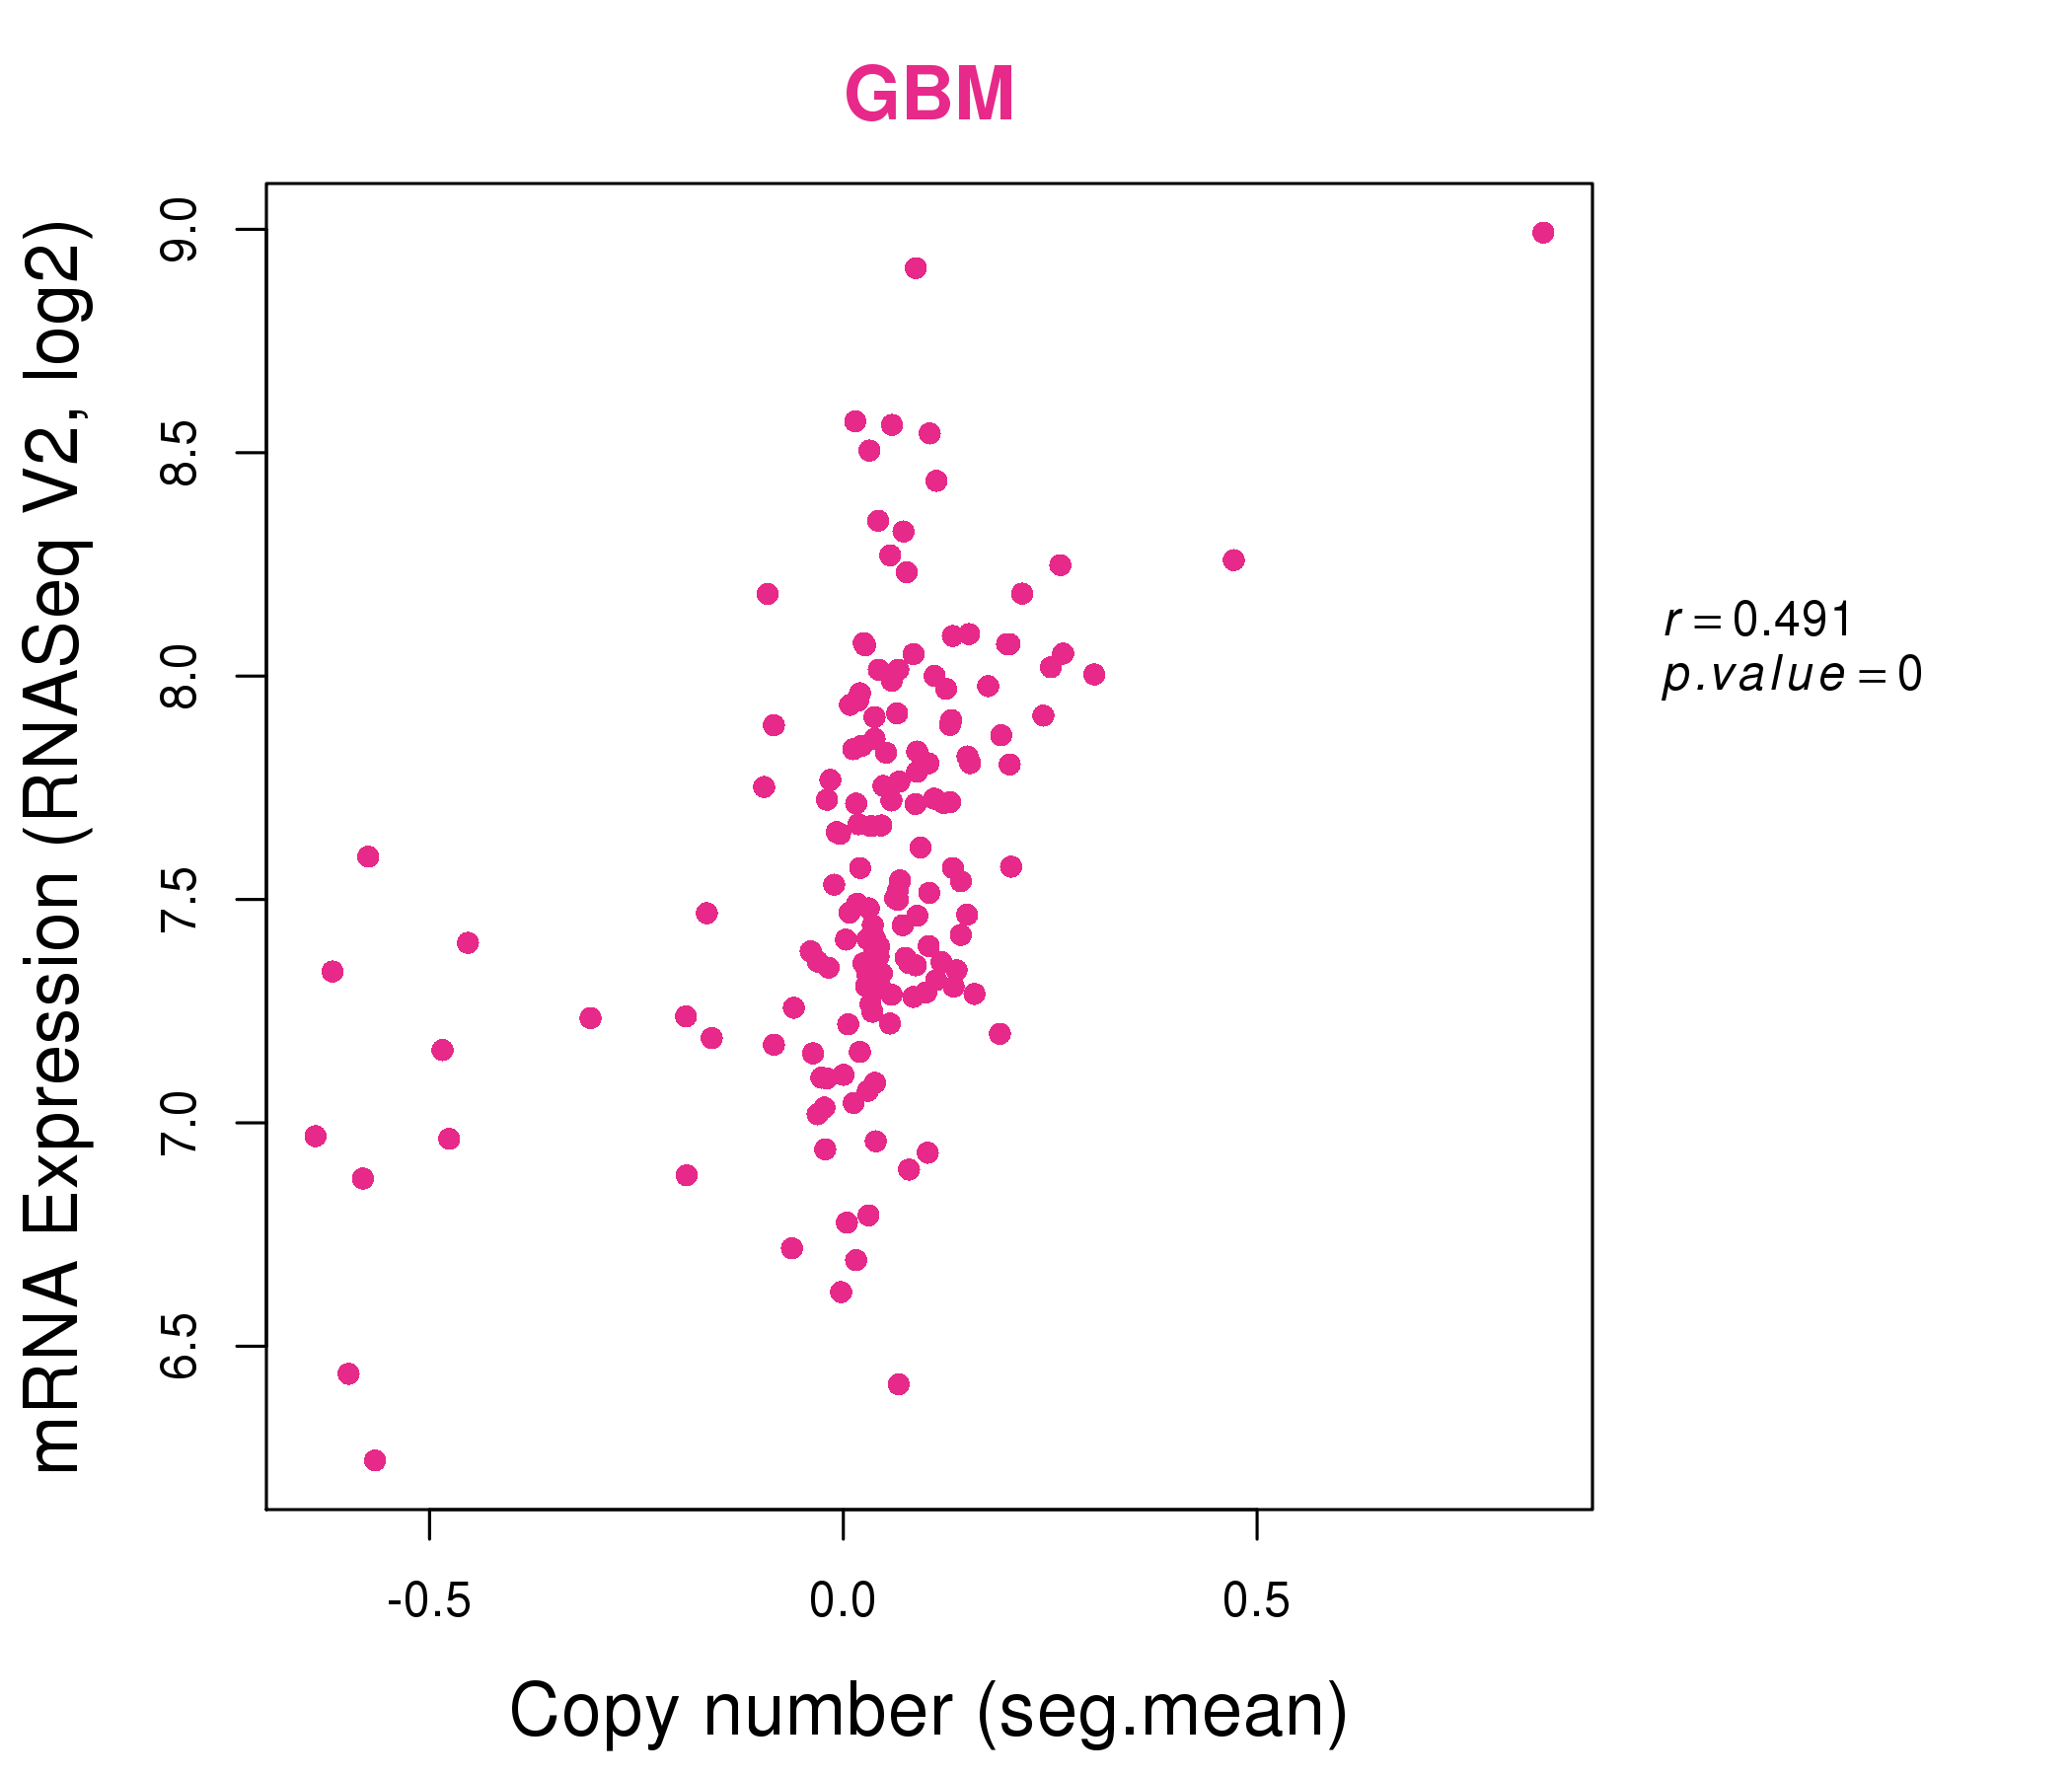
| * This plots show the correlation between CNV and gene expression. |
: Open all plots for all cancer types
 |
|
 |
|
| Top |
| Gene-Gene Network Information |
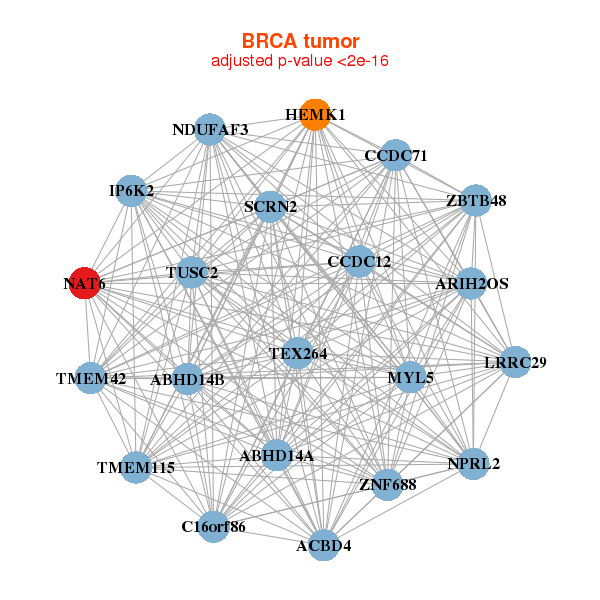
| * Co-Expression network figures were drawn using R package igraph. Only the top 20 genes with the highest correlations were shown. Red circle: input gene, orange circle: cell metabolism gene, sky circle: other gene |
: Open all plots for all cancer types
 |
|
| ABHD14A,ABHD14B,ACBD4,C16orf86,ARIH2OS,CCDC12,CCDC71, HEMK1,IP6K2,LRRC29,MYL5,NAT6,NDUFAF3,NPRL2, SCRN2,TEX264,TMEM115,TMEM42,TUSC2,ZBTB48,ZNF688 | ACD,CDPF1,DNAJC4,FAM98C,FBRSL1,INO80E,MRPS2, NAT6,PCIF1,PTOV1,RABGGTA,RNF126,SF3A2,SLC35C2, SNRPA,THAP7,TMEM134,TMEM222,WBP1,ZFPL1,ZNF414 |
 |
|
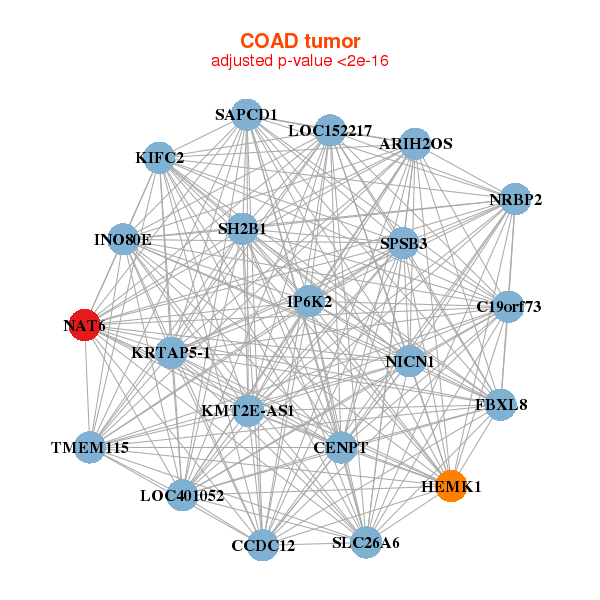
| C19orf73,ARIH2OS,SAPCD1,CCDC12,CENPT,FBXL8,HEMK1, INO80E,IP6K2,KIFC2,KRTAP5-1,KMT2E-AS1,LOC152217,LOC401052, NAT6,NICN1,NRBP2,SH2B1,SLC26A6,SPSB3,TMEM115 | ANKS3,ASMTL,CCBL1,DCUN1D2,HP1BP3,KANK3,KRT222, MEGF6,NAT6,PCBP4,POLI,RGL2,RNF215,SCAND2P, SGSM2,SHF,TJAP1,TMEM150A,UPF3A,ZNF251,KRBOX4 |
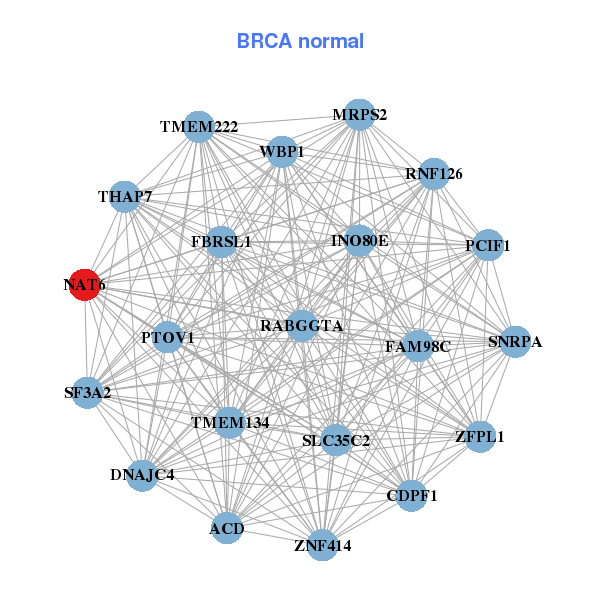
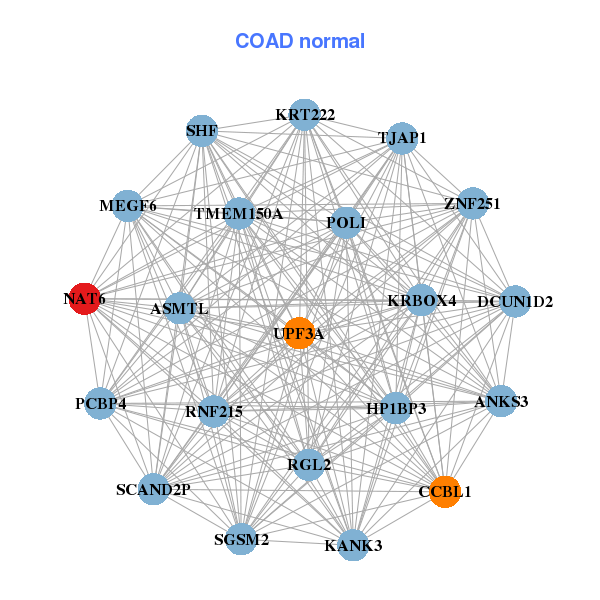
| * Co-Expression network figures were drawn using R package igraph. Only the top 20 genes with the highest correlations were shown. Red circle: input gene, orange circle: cell metabolism gene, sky circle: other gene |
: Open all plots for all cancer types
| Top |
: Open all interacting genes' information including KEGG pathway for all interacting genes from DAVID
| Top |
| Pharmacological Information for NAT6 |
| There's no related Drug. |
| Top |
| Cross referenced IDs for NAT6 |
| * We obtained these cross-references from Uniprot database. It covers 150 different DBs, 18 categories. http://www.uniprot.org/help/cross_references_section |
: Open all cross reference information
|
Copyright © 2016-Present - The Univsersity of Texas Health Science Center at Houston @ |