|
||||||||||||||||||||
| |
| Phenotypic Information (metabolism pathway, cancer, disease, phenome) |
| |
| |
| Gene-Gene Network Information: Co-Expression Network, Interacting Genes & KEGG |
| |
|


| Gene Summary for ALOX15B |
| Basic gene info. | Gene symbol | ALOX15B |
| Gene name | arachidonate 15-lipoxygenase, type B | |
| Synonyms | 15-LOX-2 | |
| Cytomap | UCSC genome browser: 17p13.1 | |
| Genomic location | chr17 :7942357-7952451 | |
| Type of gene | protein-coding | |
| RefGenes | NM_001039130.1, NM_001039131.1,NM_001141.2, | |
| Ensembl id | ENSG00000179593 | |
| Description | 15-LOX-B15S-lipoxygenasearachidonate 15-lipoxygenase 2arachidonate 15-lipoxygenase Barachidonate 15-lipoxygenase type IIarachidonate 15-lipoxygenase, second typearachidonate omega(6) lipoxygenaselinoleate 13-lipoxygenase 15-LOb | |
| Modification date | 20141207 | |
| dbXrefs | MIM : 603697 | |
| HGNC : HGNC | ||
| Ensembl : ENSG00000179593 | ||
| HPRD : 04739 | ||
| Vega : OTTHUMG00000108181 | ||
| Protein | UniProt: O15296 go to UniProt's Cross Reference DB Table | |
| Expression | CleanEX: HS_ALOX15B | |
| BioGPS: 247 | ||
| Gene Expression Atlas: ENSG00000179593 | ||
| The Human Protein Atlas: ENSG00000179593 | ||
| Pathway | NCI Pathway Interaction Database: ALOX15B | |
| KEGG: ALOX15B | ||
| REACTOME: ALOX15B | ||
| ConsensusPathDB | ||
| Pathway Commons: ALOX15B | ||
| Metabolism | MetaCyc: ALOX15B | |
| HUMANCyc: ALOX15B | ||
| Regulation | Ensembl's Regulation: ENSG00000179593 | |
| miRBase: chr17 :7,942,357-7,952,451 | ||
| TargetScan: NM_001039130 | ||
| cisRED: ENSG00000179593 | ||
| Context | iHOP: ALOX15B | |
| cancer metabolism search in PubMed: ALOX15B | ||
| UCL Cancer Institute: ALOX15B | ||
| Assigned class in ccmGDB | A - This gene has a literature evidence and it belongs to cancer gene. | |
| References showing role of ALOX15B in cancer cell metabolism | 1. Suraneni MV, Moore JR, Zhang D, Badeaux M, Macaluso MD, et al. (2014) Tumor-suppressive functions of 15-Lipoxygenase-2 and RB1CC1 in prostate cancer. Cell Cycle 13: 1798-1810. doi: 10.4161/cc.28757. pmid: 4111726. go to article | |
| Top |
| Phenotypic Information for ALOX15B(metabolism pathway, cancer, disease, phenome) |
| Cancer | CGAP: ALOX15B |
| Familial Cancer Database: ALOX15B | |
| * This gene is included in those cancer gene databases. |
|
|
|
|
|
|
| ||||||||||||||
Oncogene 1 | Significant driver gene in | |||||||||||||||||||
| cf) number; DB name 1 Oncogene; http://nar.oxfordjournals.org/content/35/suppl_1/D721.long, 2 Tumor Suppressor gene; https://bioinfo.uth.edu/TSGene/, 3 Cancer Gene Census; http://www.nature.com/nrc/journal/v4/n3/abs/nrc1299.html, 4 CancerGenes; http://nar.oxfordjournals.org/content/35/suppl_1/D721.long, 5 Network of Cancer Gene; http://ncg.kcl.ac.uk/index.php, 1Therapeutic Vulnerabilities in Cancer; http://cbio.mskcc.org/cancergenomics/statius/ |
| KEGG_ARACHIDONIC_ACID_METABOLISM | |
| OMIM | 603697; gene. |
| Orphanet | |
| Disease | KEGG Disease: ALOX15B |
| MedGen: ALOX15B (Human Medical Genetics with Condition) | |
| ClinVar: ALOX15B | |
| Phenotype | MGI: ALOX15B (International Mouse Phenotyping Consortium) |
| PhenomicDB: ALOX15B | |
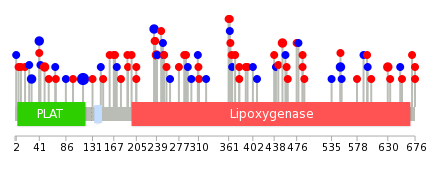
| Mutations for ALOX15B |
| * Under tables are showing count per each tissue to give us broad intuition about tissue specific mutation patterns.You can go to the detailed page for each mutation database's web site. |
| There's no structural variation information in COSMIC data for this gene. |
| * From mRNA Sanger sequences, Chitars2.0 arranged chimeric transcripts. This table shows ALOX15B related fusion information. |
| ID | Head Gene | Tail Gene | Accession | Gene_a | qStart_a | qEnd_a | Chromosome_a | tStart_a | tEnd_a | Gene_a | qStart_a | qEnd_a | Chromosome_a | tStart_a | tEnd_a |
| BF737723 | ALOX15B | 8 | 119 | 17 | 7951927 | 7952039 | CAPNS1 | 114 | 355 | 19 | 36640996 | 36641237 | |
| Top |
| There's no copy number variation information in COSMIC data for this gene. |
| Top |
|
 |
| Top |
| Stat. for Non-Synonymous SNVs (# total SNVs=41) | (# total SNVs=23) |
 |  |
(# total SNVs=1) | (# total SNVs=0) |
 |
| Top |
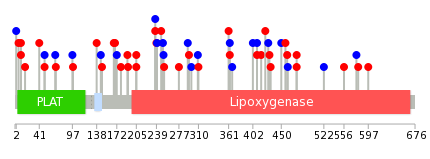
| * When you move the cursor on each content, you can see more deailed mutation information on the Tooltip. Those are primary_site,primary_histology,mutation(aa),pubmedID. |
| GRCh37 position | Mutation(aa) | Unique sampleID count |
| chr17:7942901-7942901 | p.T115T | 8 |
| chr17:7948185-7948185 | p.A239T | 2 |
| chr17:7950292-7950292 | p.S452F | 2 |
| chr17:7950952-7950952 | p.S550S | 2 |
| chr17:7942557-7942557 | p.G28G | 2 |
| chr17:7948939-7948939 | p.L379V | 2 |
| chr17:7942596-7942596 | p.L41L | 2 |
| chr17:7942706-7942706 | p.E50D | 2 |
| chr17:7951740-7951740 | p.E630K | 2 |
| chr17:7948175-7948175 | p.D235D | 2 |
| Top |
|
 |
| Point Mutation/ Tissue ID | 1 | 2 | 3 | 4 | 5 | 6 | 7 | 8 | 9 | 10 | 11 | 12 | 13 | 14 | 15 | 16 | 17 | 18 | 19 | 20 |
| # sample | 3 | 1 | 12 | 3 | 1 | 3 | 3 | 2 | 4 | 1 | 12 | 3 | 10 | |||||||
| # mutation | 3 | 1 | 11 | 3 | 1 | 3 | 3 | 2 | 4 | 1 | 12 | 3 | 11 | |||||||
| nonsynonymous SNV | 2 | 1 | 8 | 1 | 1 | 3 | 3 | 1 | 2 | 7 | 3 | 6 | ||||||||
| synonymous SNV | 1 | 5 | 2 | 1 | 2 | 1 | 5 | 5 |
| cf) Tissue ID; Tissue type (1; BLCA[Bladder Urothelial Carcinoma], 2; BRCA[Breast invasive carcinoma], 3; CESC[Cervical squamous cell carcinoma and endocervical adenocarcinoma], 4; COAD[Colon adenocarcinoma], 5; GBM[Glioblastoma multiforme], 6; Glioma Low Grade, 7; HNSC[Head and Neck squamous cell carcinoma], 8; KICH[Kidney Chromophobe], 9; KIRC[Kidney renal clear cell carcinoma], 10; KIRP[Kidney renal papillary cell carcinoma], 11; LAML[Acute Myeloid Leukemia], 12; LUAD[Lung adenocarcinoma], 13; LUSC[Lung squamous cell carcinoma], 14; OV[Ovarian serous cystadenocarcinoma ], 15; PAAD[Pancreatic adenocarcinoma], 16; PRAD[Prostate adenocarcinoma], 17; SKCM[Skin Cutaneous Melanoma], 18:STAD[Stomach adenocarcinoma], 19:THCA[Thyroid carcinoma], 20:UCEC[Uterine Corpus Endometrial Carcinoma]) |
| Top |
| * We represented just top 10 SNVs. When you move the cursor on each content, you can see more deailed mutation information on the Tooltip. Those are primary_site, primary_histology, mutation(aa), pubmedID. |
| Genomic Position | Mutation(aa) | Unique sampleID count |
| chr17:7942501 | p.T10A,ALOX15B | 2 |
| chr17:7942706 | p.F237F,ALOX15B | 2 |
| chr17:7948181 | p.E50E,ALOX15B | 2 |
| chr17:7943291 | p.S190F,ALOX15B | 1 |
| chr17:7950312 | p.S310Y,ALOX15B | 1 |
| chr17:7948190 | p.D476N,ALOX15B | 1 |
| chr17:7951813 | p.V6I,ALOX15B | 1 |
| chr17:7948885 | p.A191V,ALOX15B | 1 |
| chr17:7945736 | p.R361C,ALOX15B | 1 |
| chr17:7950318 | p.R461R,ALOX15B | 1 |
| * Copy number data were extracted from TCGA using R package TCGA-Assembler. The URLs of all public data files on TCGA DCC data server were gathered on Jan-05-2015. Function ProcessCNAData in TCGA-Assembler package was used to obtain gene-level copy number value which is calculated as the average copy number of the genomic region of a gene. |
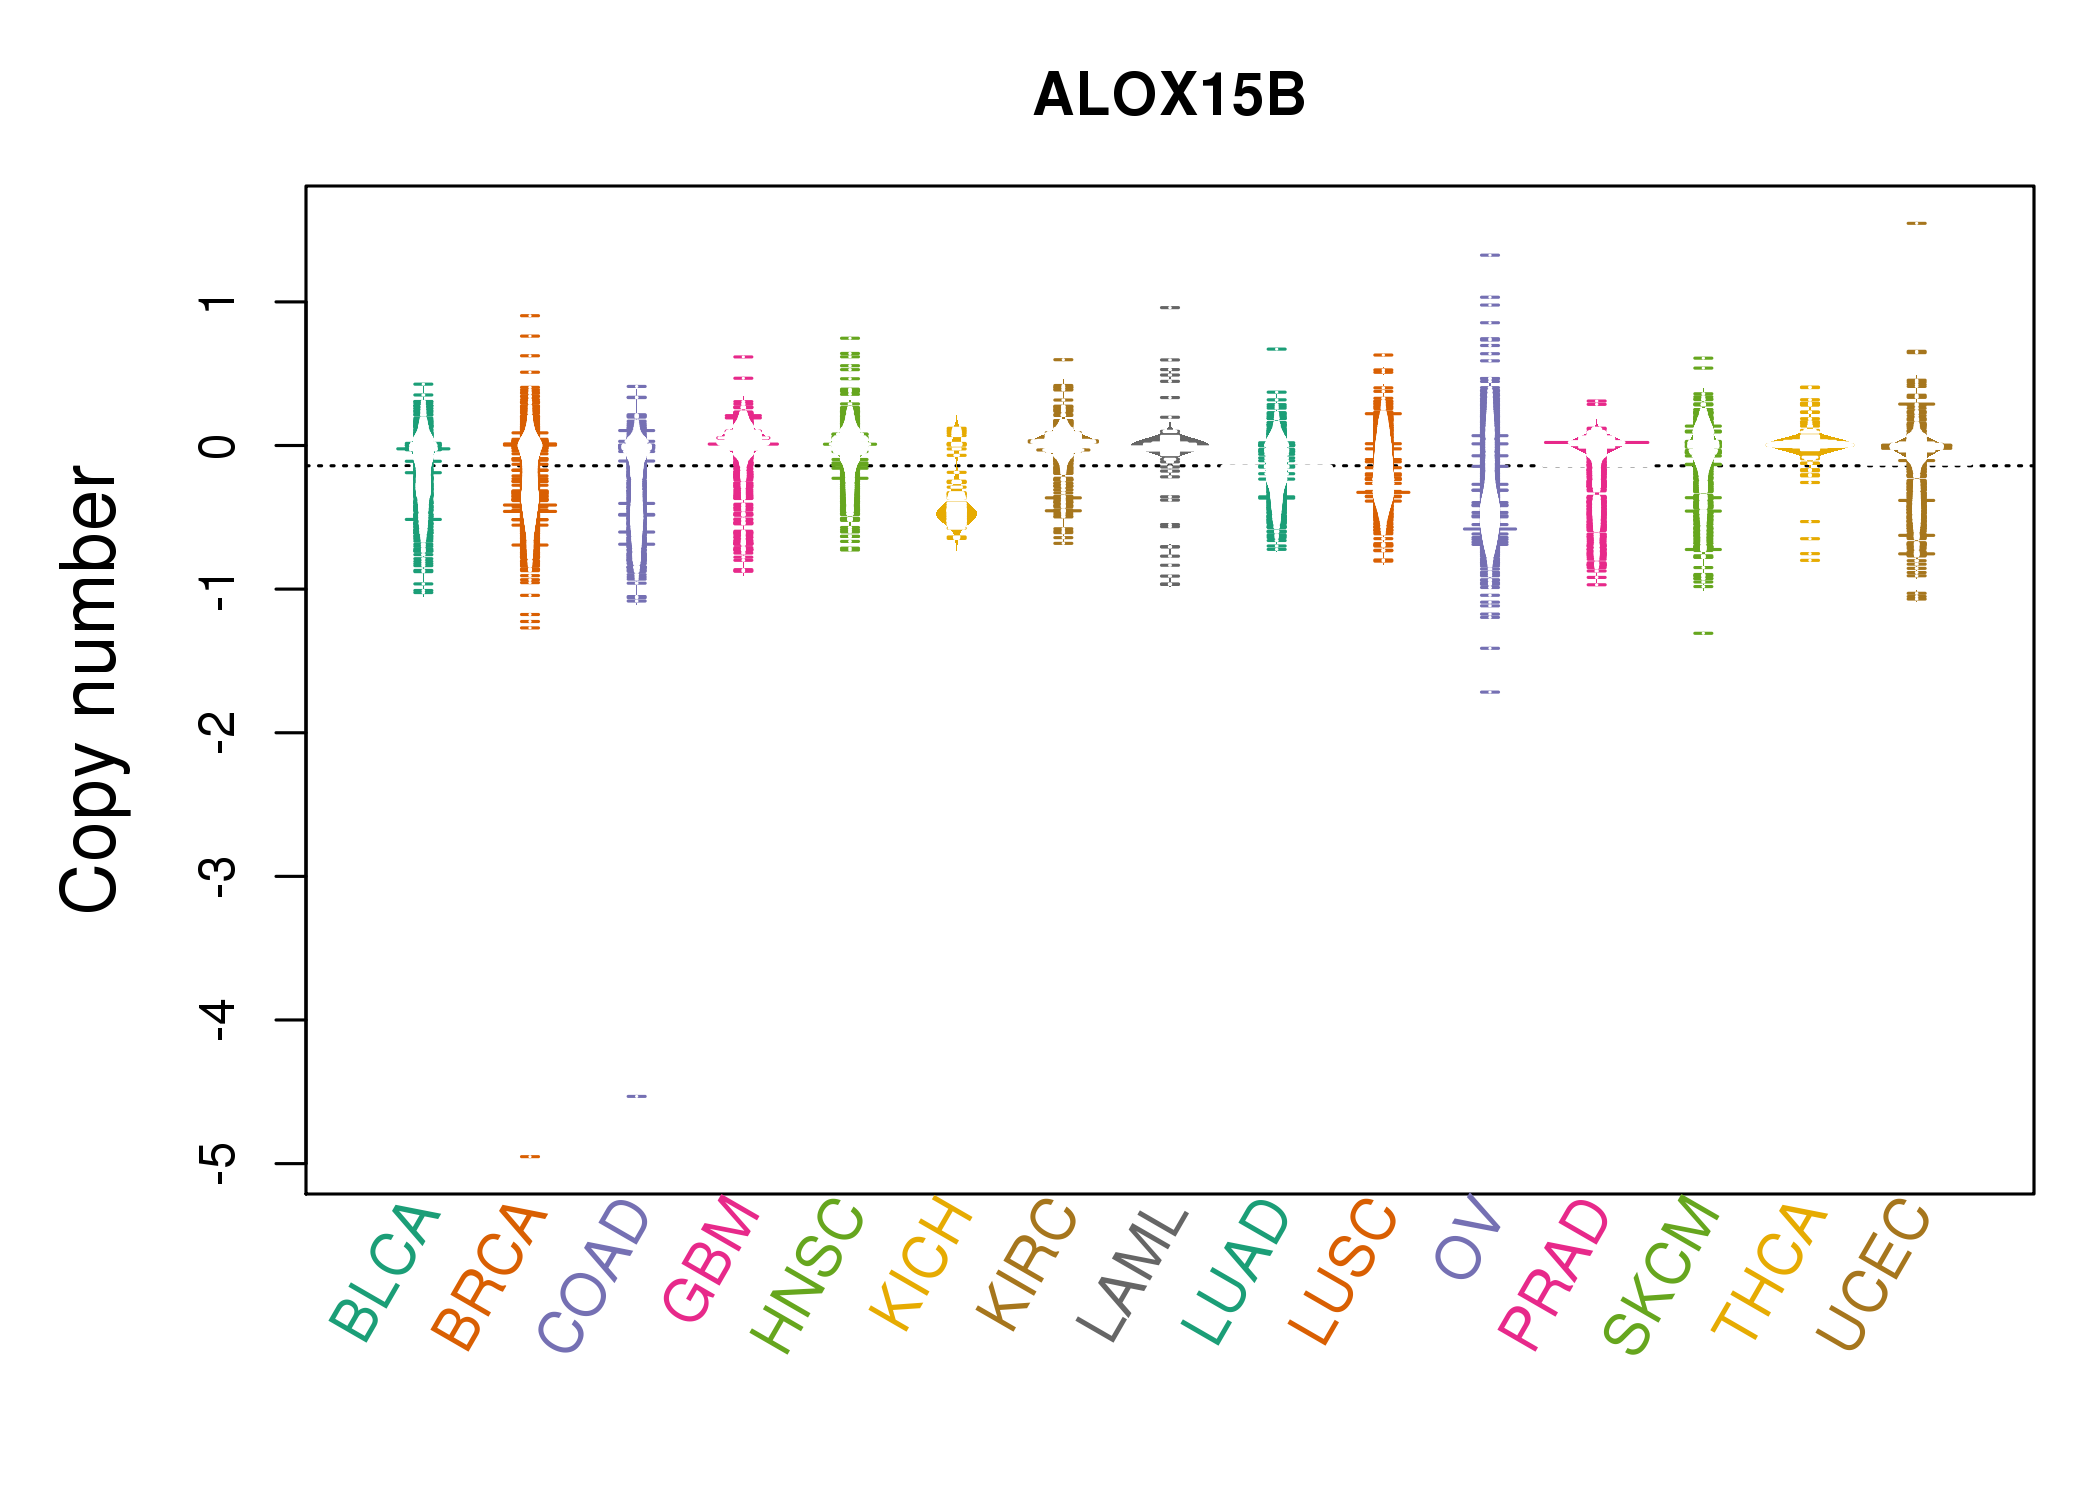 |
| cf) Tissue ID[Tissue type]: BLCA[Bladder Urothelial Carcinoma], BRCA[Breast invasive carcinoma], CESC[Cervical squamous cell carcinoma and endocervical adenocarcinoma], COAD[Colon adenocarcinoma], GBM[Glioblastoma multiforme], Glioma Low Grade, HNSC[Head and Neck squamous cell carcinoma], KICH[Kidney Chromophobe], KIRC[Kidney renal clear cell carcinoma], KIRP[Kidney renal papillary cell carcinoma], LAML[Acute Myeloid Leukemia], LUAD[Lung adenocarcinoma], LUSC[Lung squamous cell carcinoma], OV[Ovarian serous cystadenocarcinoma ], PAAD[Pancreatic adenocarcinoma], PRAD[Prostate adenocarcinoma], SKCM[Skin Cutaneous Melanoma], STAD[Stomach adenocarcinoma], THCA[Thyroid carcinoma], UCEC[Uterine Corpus Endometrial Carcinoma] |
| Top |
| Gene Expression for ALOX15B |
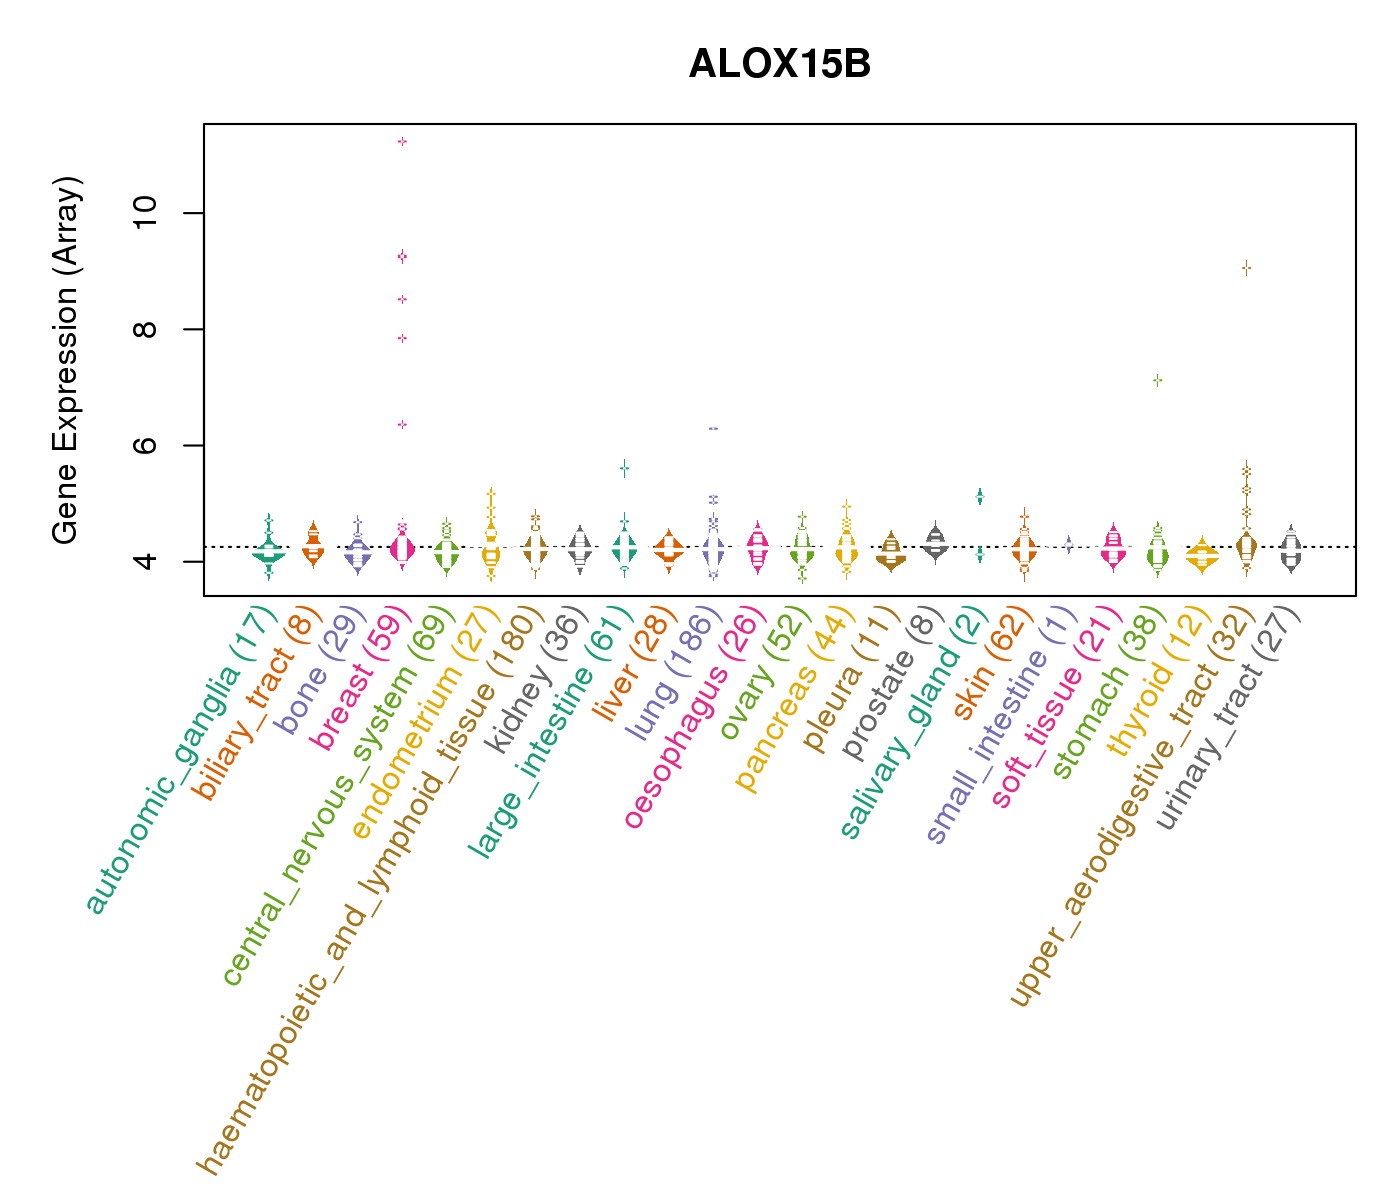
| * CCLE gene expression data were extracted from CCLE_Expression_Entrez_2012-10-18.res: Gene-centric RMA-normalized mRNA expression data. |
 |
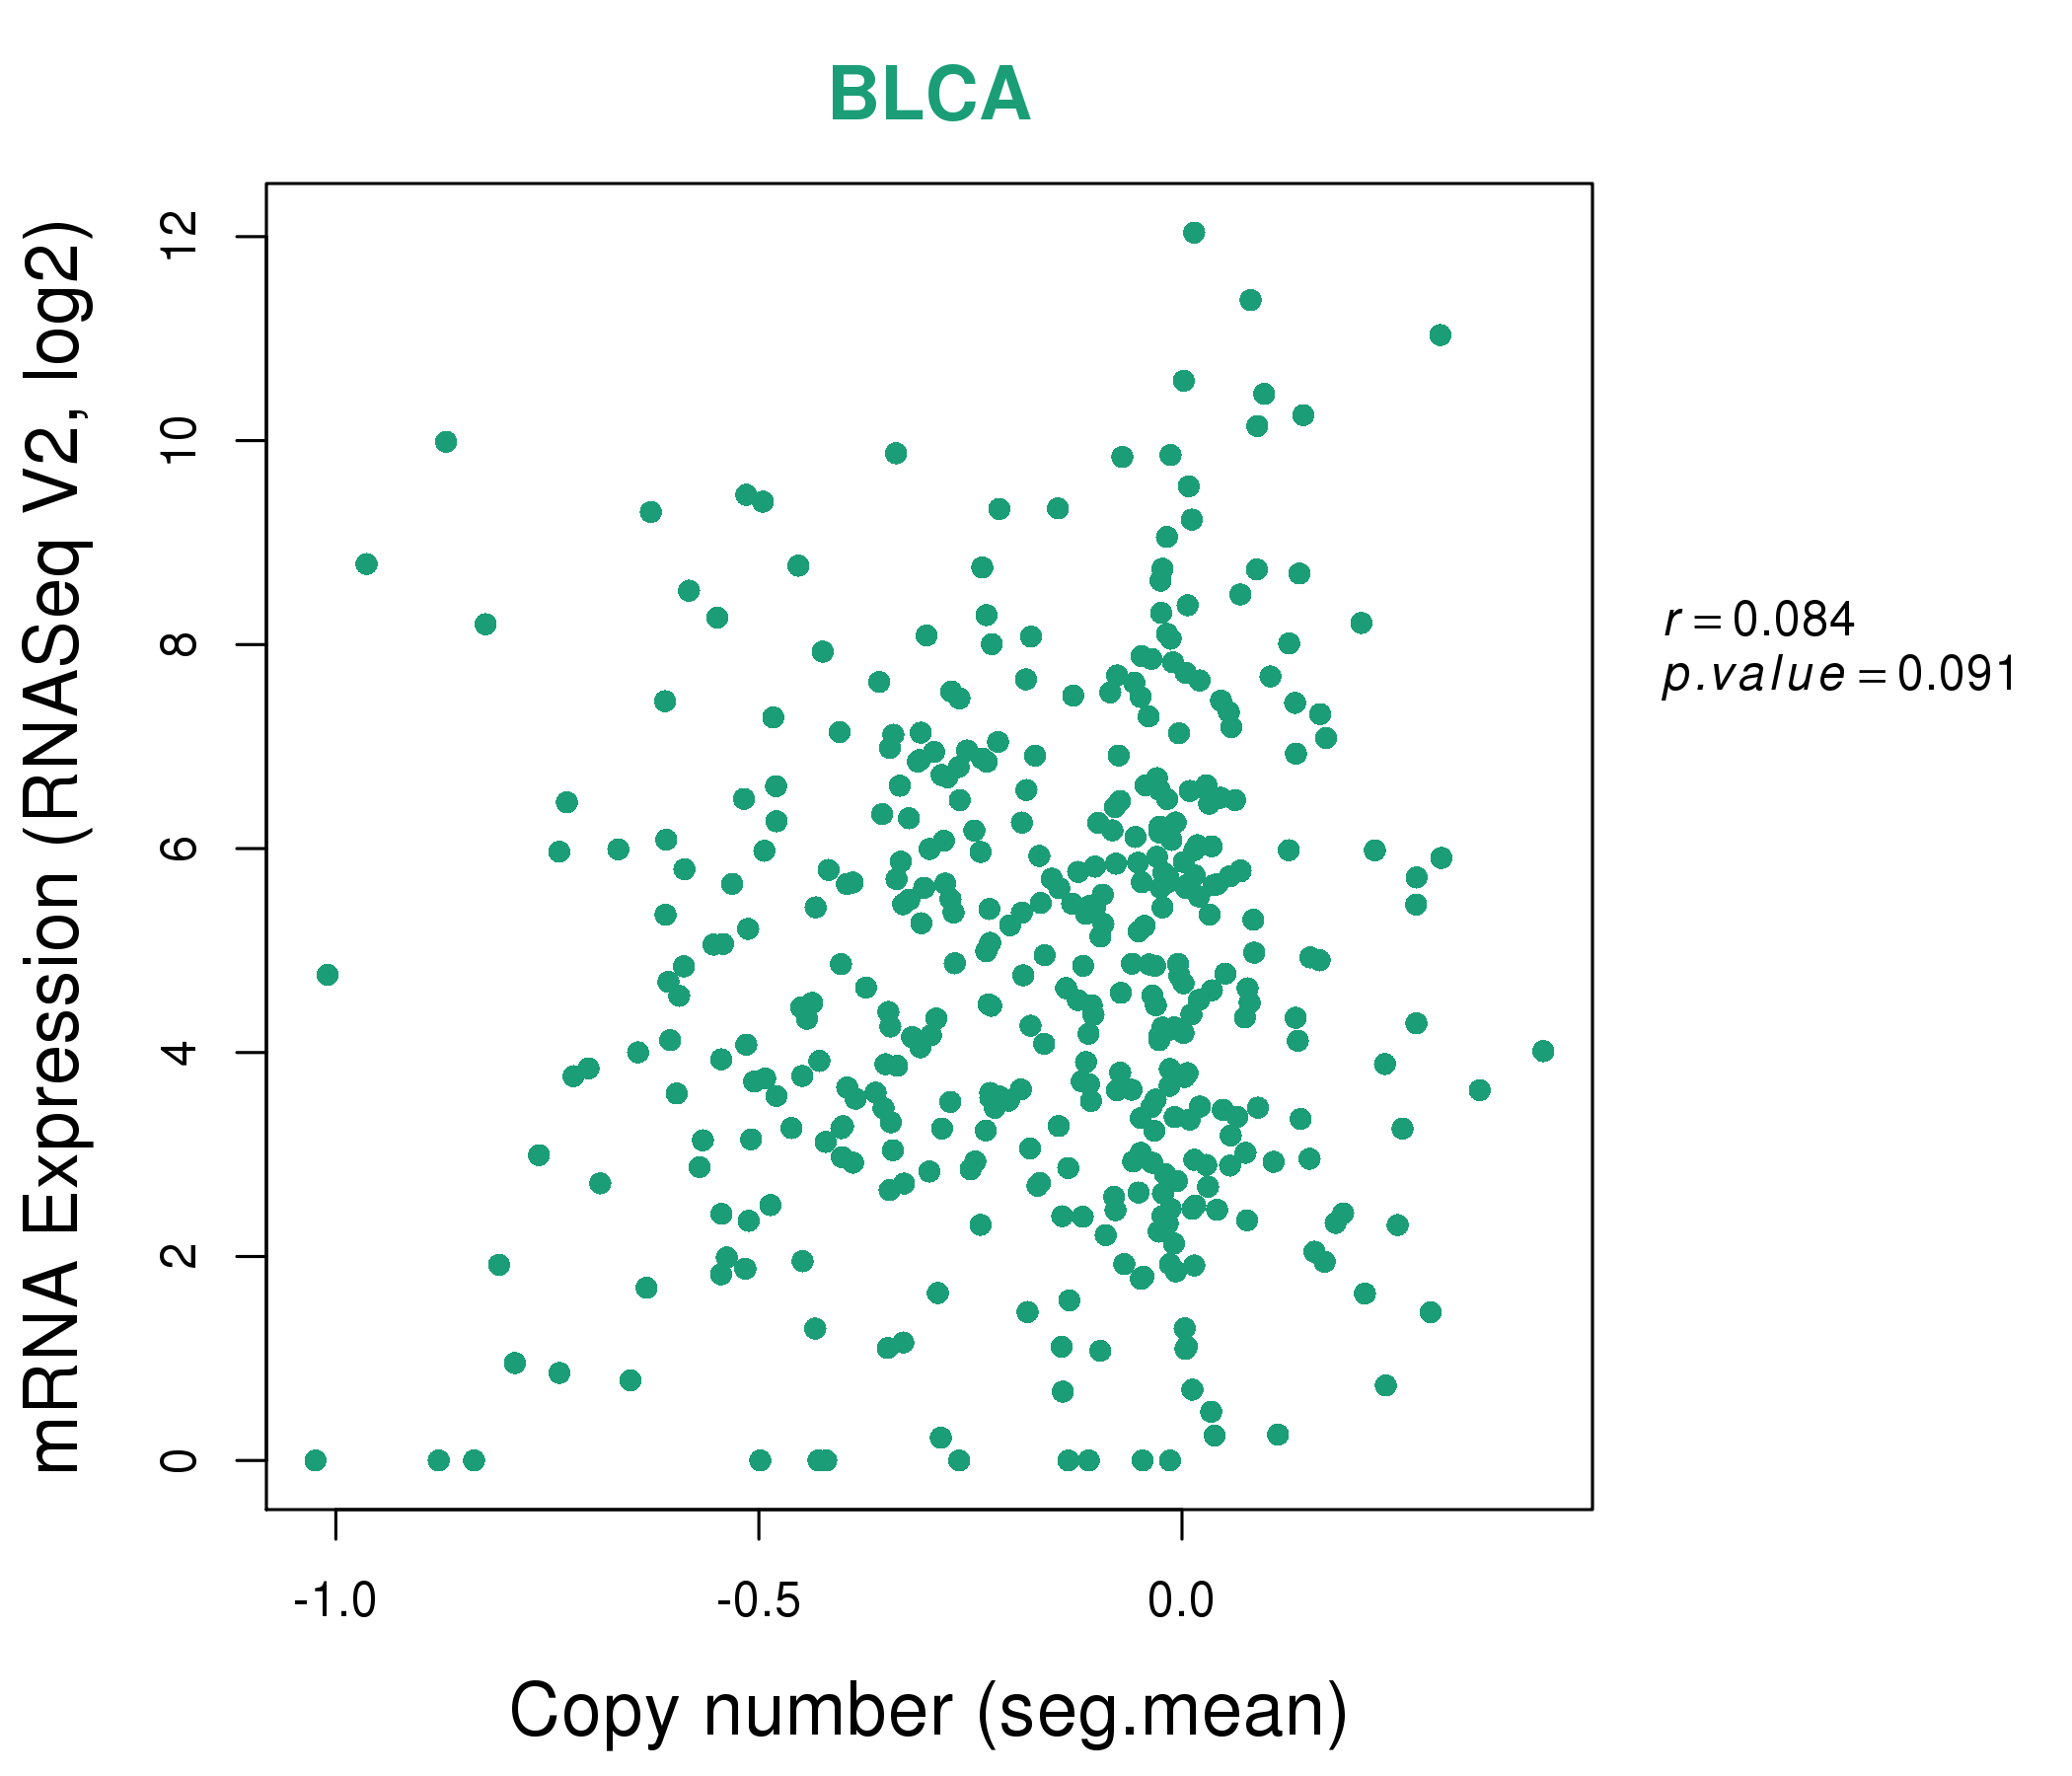
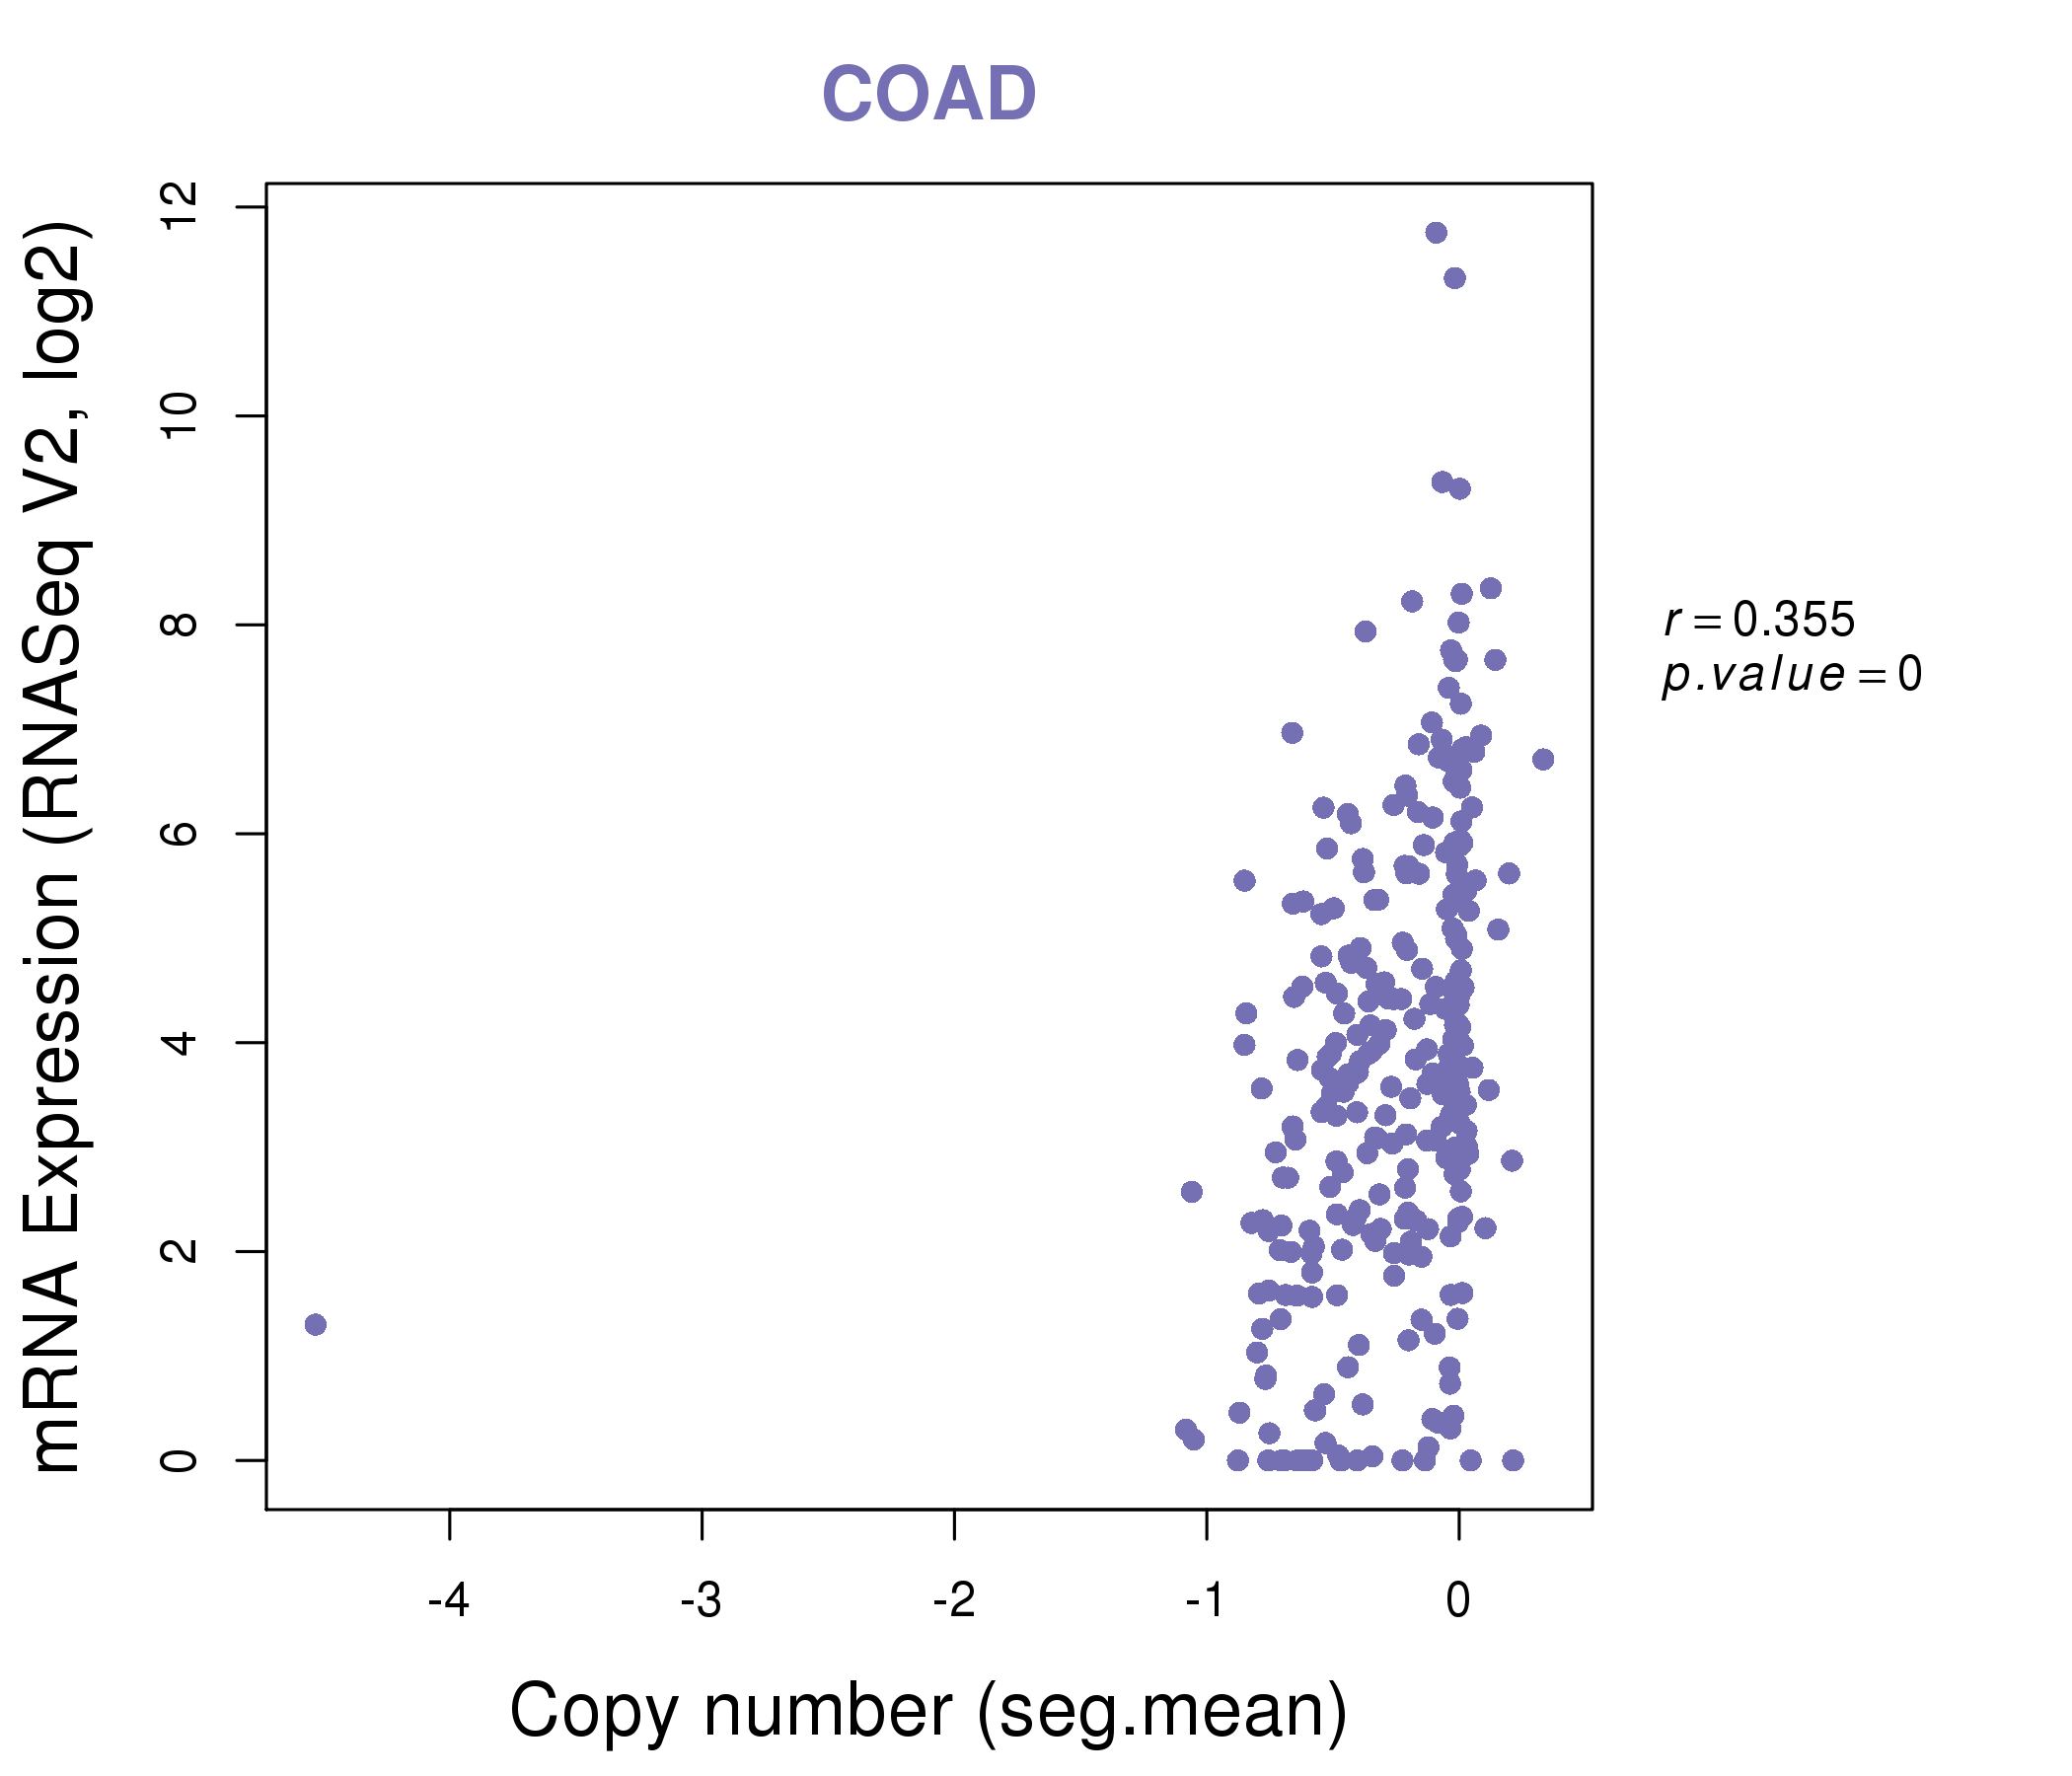
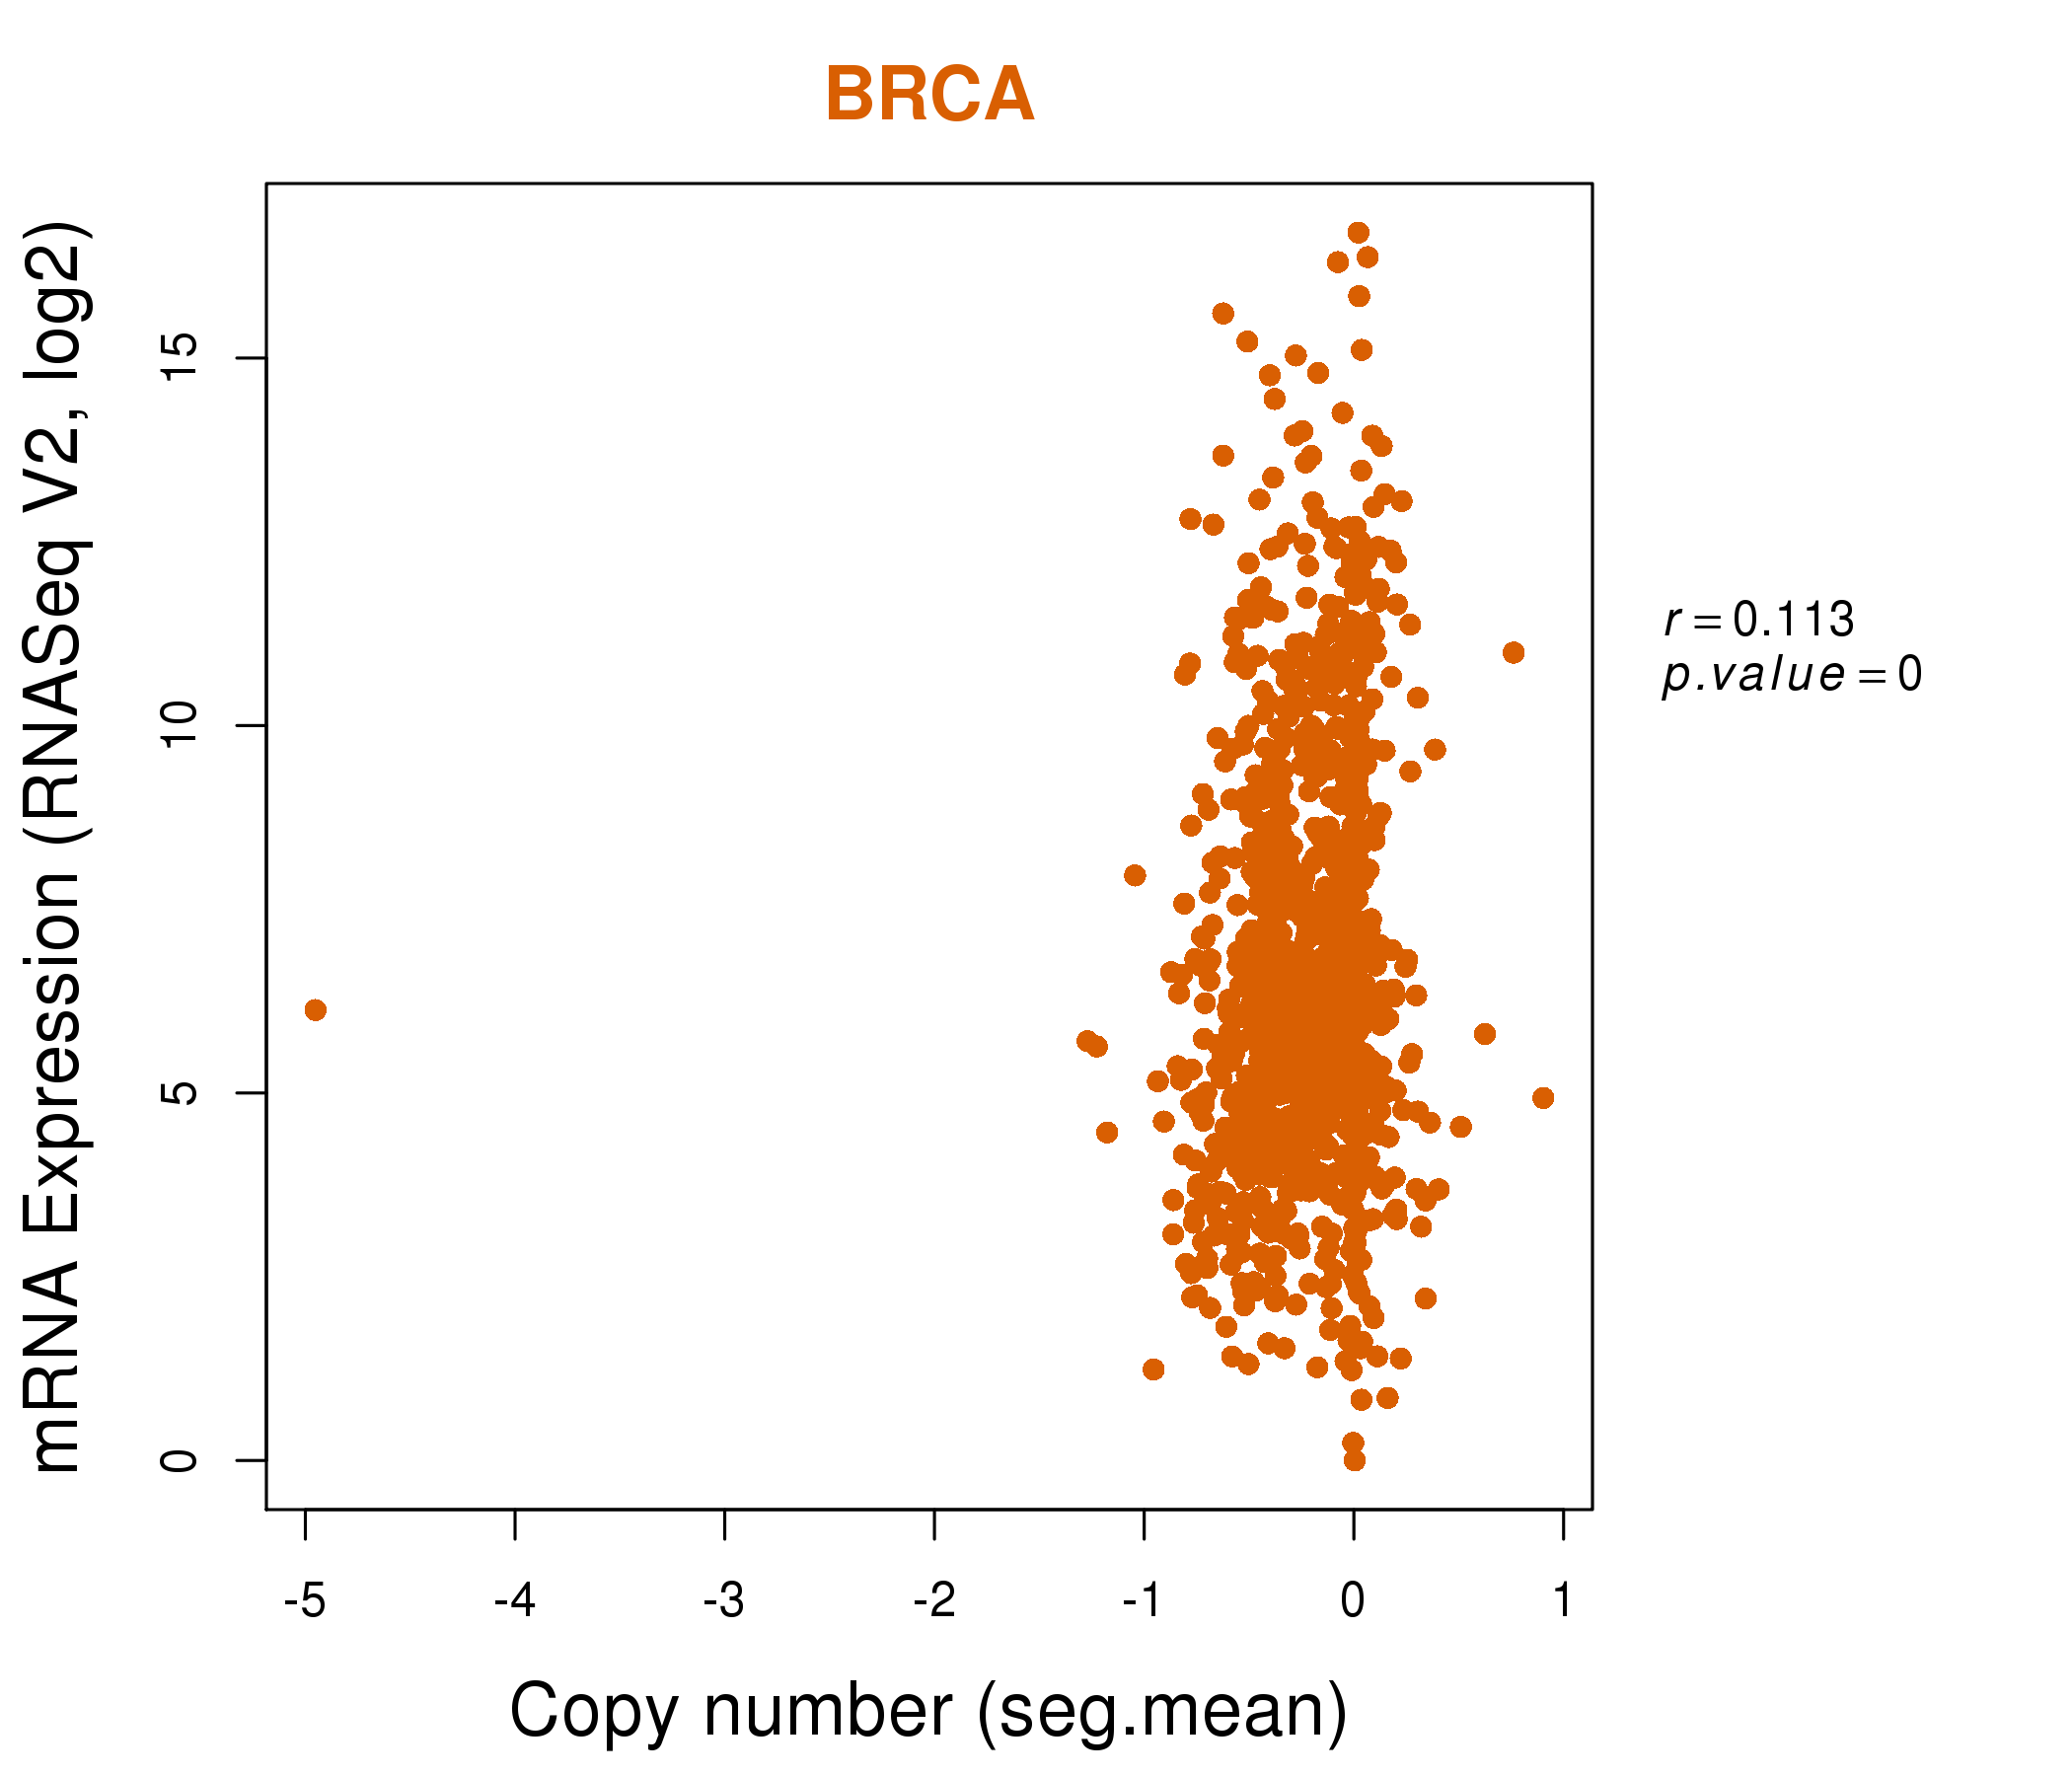
| * Normalized gene expression data of RNASeqV2 was extracted from TCGA using R package TCGA-Assembler. The URLs of all public data files on TCGA DCC data server were gathered at Jan-05-2015. Only eight cancer types have enough normal control samples for differential expression analysis. (t test, adjusted p<0.05 (using Benjamini-Hochberg FDR)) |
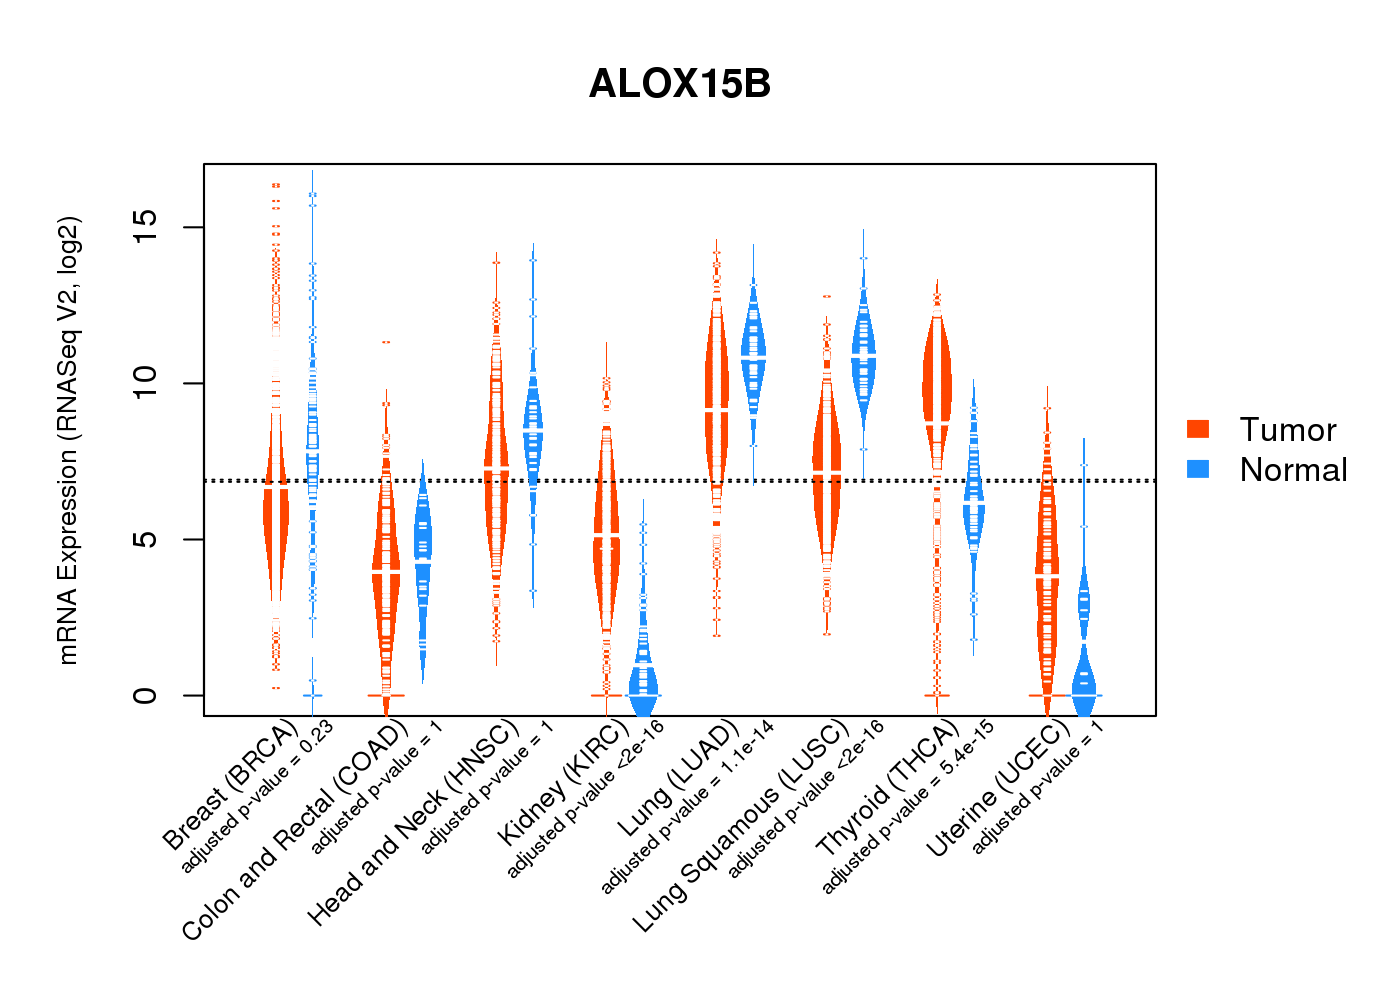 |
| Top |
| * This plots show the correlation between CNV and gene expression. |
: Open all plots for all cancer types
 |
|
 |
|

| Top |
| Gene-Gene Network Information |
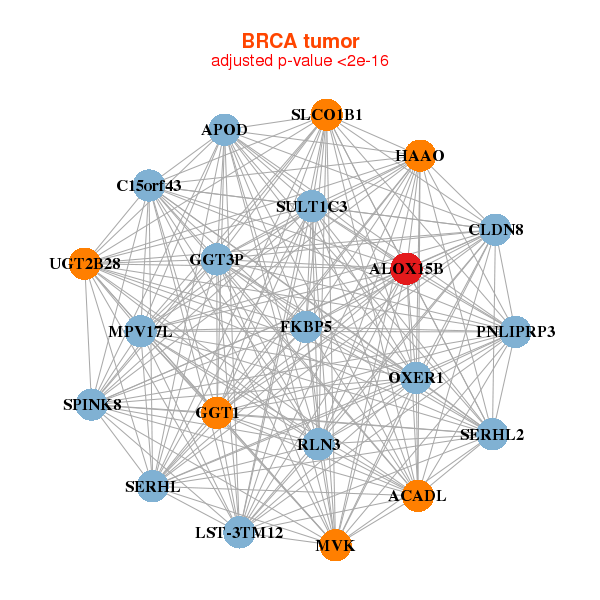
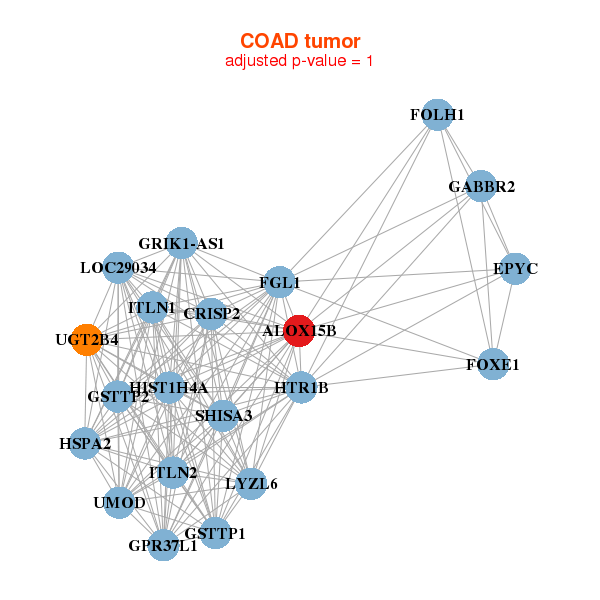
| * Co-Expression network figures were drawn using R package igraph. Only the top 20 genes with the highest correlations were shown. Red circle: input gene, orange circle: cell metabolism gene, sky circle: other gene |
: Open all plots for all cancer types
 |
|
| ACADL,ALOX15B,APOD,C15orf43,CLDN8,FKBP5,GGT1, GGT3P,HAAO,LST-3TM12,MPV17L,MVK,OXER1,PNLIPRP3, RLN3,SERHL2,SERHL,SLCO1B1,SPINK8,SULT1C3,UGT2B28 | ABCC11,ACSL3,ADAM2,ALOX15B,APOD,B3GAT1,C15orf43, DHRS2,DMRTC2,GGT1,HPGD,IDI1,LST-3TM12,MPV17L, PNLIPRP3,SERHL2,SERHL,SRD5A1,TARP,TMPRSS11F,UGT2B10 |
 |
|
| ALOX15B,CRISP2,EPYC,FGL1,FOLH1,FOXE1,GABBR2, GPR37L1,GSTTP1,GSTTP2,HIST1H4A,HSPA2,HTR1B,ITLN1, ITLN2,LOC29034,LYZL6,GRIK1-AS1,SHISA3,UGT2B4,UMOD | ALOX15B,ANTXRL,C15orf43,CA5A,PTGDR2,HIST1H1A,ITGA10, KCNS2,LOC731789,LY6K,MC3R,MERTK,MYH13,OR10J3, OR1L6,PSCA,SDHAP2,SIGLEC8,SNORA71D,SP9,TRPC3 |
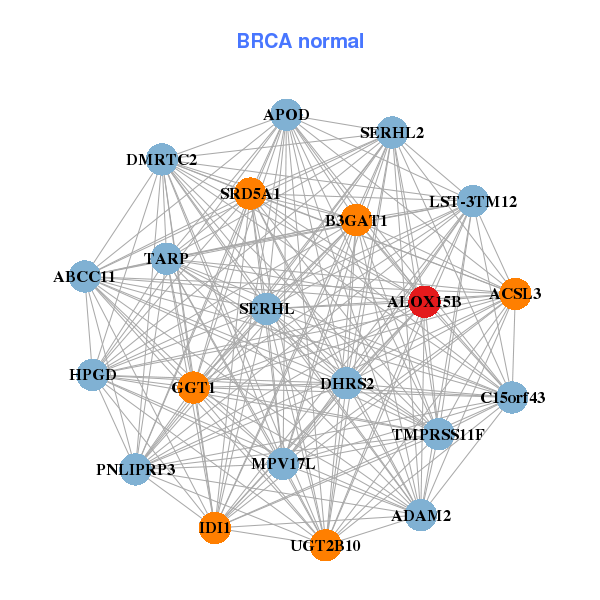
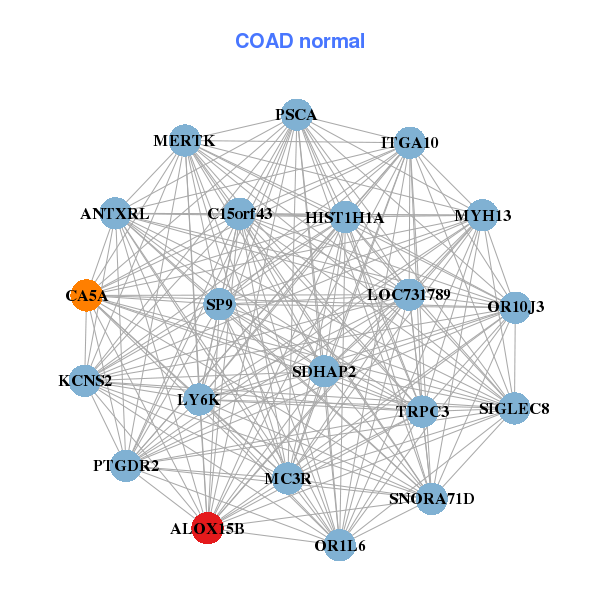
| * Co-Expression network figures were drawn using R package igraph. Only the top 20 genes with the highest correlations were shown. Red circle: input gene, orange circle: cell metabolism gene, sky circle: other gene |
: Open all plots for all cancer types
| Top |
: Open all interacting genes' information including KEGG pathway for all interacting genes from DAVID
| Top |
| Pharmacological Information for ALOX15B |
| There's no related Drug. |
| Top |
| Cross referenced IDs for ALOX15B |
| * We obtained these cross-references from Uniprot database. It covers 150 different DBs, 18 categories. http://www.uniprot.org/help/cross_references_section |
: Open all cross reference information
|
Copyright © 2016-Present - The Univsersity of Texas Health Science Center at Houston @ |