|
|||||||||||||||||||||||||||||||||||||||||||||||||||||||||||||||||||||||||||||||||||||||||||||||||||||||||||||||||||||||||||||||||||||||||||||||||||||||||||||||||||||||||||||||||||||||||||||||||||||||||||||||||||||||||||||||||||||||||||||||||||||||||||||||||||||||||||||||||||||||||||||||||||||||||||||||||||||||||||||||||||||||||||||
| |
| Phenotypic Information (metabolism pathway, cancer, disease, phenome) |
| |
| |
| Gene-Gene Network Information: Co-Expression Network, Interacting Genes & KEGG |
| |
|


| Gene Summary for FTH1 |
| Basic gene info. | Gene symbol | FTH1 |
| Gene name | ferritin, heavy polypeptide 1 | |
| Synonyms | FHC|FTH|FTHL6|HFE5|PIG15|PLIF | |
| Cytomap | UCSC genome browser: 11q13 | |
| Genomic location | chr11 :61731756-61735132 | |
| Type of gene | protein-coding | |
| RefGenes | NM_002032.2, | |
| Ensembl id | ENSG00000167996 | |
| Description | apoferritincell proliferation-inducing gene 15 proteinferritin H subunitferritin heavy chainplacenta immunoregulatory factorproliferation-inducing protein 15 | |
| Modification date | 20141207 | |
| dbXrefs | MIM : 134770 | |
| HGNC : HGNC | ||
| Ensembl : ENSG00000167996 | ||
| HPRD : 00615 | ||
| Vega : OTTHUMG00000166217 | ||
| Protein | UniProt: go to UniProt's Cross Reference DB Table | |
| Expression | CleanEX: HS_FTH1 | |
| BioGPS: 2495 | ||
| Gene Expression Atlas: ENSG00000167996 | ||
| The Human Protein Atlas: ENSG00000167996 | ||
| Pathway | NCI Pathway Interaction Database: FTH1 | |
| KEGG: FTH1 | ||
| REACTOME: FTH1 | ||
| ConsensusPathDB | ||
| Pathway Commons: FTH1 | ||
| Metabolism | MetaCyc: FTH1 | |
| HUMANCyc: FTH1 | ||
| Regulation | Ensembl's Regulation: ENSG00000167996 | |
| miRBase: chr11 :61,731,756-61,735,132 | ||
| TargetScan: NM_002032 | ||
| cisRED: ENSG00000167996 | ||
| Context | iHOP: FTH1 | |
| cancer metabolism search in PubMed: FTH1 | ||
| UCL Cancer Institute: FTH1 | ||
| Assigned class in ccmGDB | C | |
| Top |
| Phenotypic Information for FTH1(metabolism pathway, cancer, disease, phenome) |
| Cancer | CGAP: FTH1 |
| Familial Cancer Database: FTH1 | |
| * This gene is included in those cancer gene databases. |
|
|
|
|
|
|
| |||||||||||||||||||||||||||||||||||||||||||||||||||||||||||||||||||||||||||||||||||||||||||||||||||||||||||||||||||||||||||||||||||||||||||||||||||||||||||||||||||||||||||||||||||||||||||||||||||||||||||||||||||||||||||||||||||||||||||||||||||||||||||||||||||||||||||||||||||||||||||||||||||||||||||||||||||||||||||||||||||||||
Oncogene 1 | Significant driver gene in | ||||||||||||||||||||||||||||||||||||||||||||||||||||||||||||||||||||||||||||||||||||||||||||||||||||||||||||||||||||||||||||||||||||||||||||||||||||||||||||||||||||||||||||||||||||||||||||||||||||||||||||||||||||||||||||||||||||||||||||||||||||||||||||||||||||||||||||||||||||||||||||||||||||||||||||||||||||||||||||||||||||||||||||
| cf) number; DB name 1 Oncogene; http://nar.oxfordjournals.org/content/35/suppl_1/D721.long, 2 Tumor Suppressor gene; https://bioinfo.uth.edu/TSGene/, 3 Cancer Gene Census; http://www.nature.com/nrc/journal/v4/n3/abs/nrc1299.html, 4 CancerGenes; http://nar.oxfordjournals.org/content/35/suppl_1/D721.long, 5 Network of Cancer Gene; http://ncg.kcl.ac.uk/index.php, 1Therapeutic Vulnerabilities in Cancer; http://cbio.mskcc.org/cancergenomics/statius/ |
| KEGG_PORPHYRIN_AND_CHLOROPHYLL_METABOLISM | |
| OMIM | |
| Orphanet | |
| Disease | KEGG Disease: FTH1 |
| MedGen: FTH1 (Human Medical Genetics with Condition) | |
| ClinVar: FTH1 | |
| Phenotype | MGI: FTH1 (International Mouse Phenotyping Consortium) |
| PhenomicDB: FTH1 | |
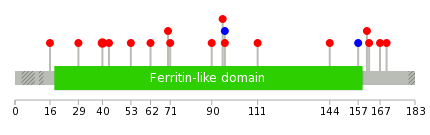
| Mutations for FTH1 |
| * Under tables are showing count per each tissue to give us broad intuition about tissue specific mutation patterns.You can go to the detailed page for each mutation database's web site. |
| There's no structural variation information in COSMIC data for this gene. |
| * From mRNA Sanger sequences, Chitars2.0 arranged chimeric transcripts. This table shows FTH1 related fusion information. |
| ID | Head Gene | Tail Gene | Accession | Gene_a | qStart_a | qEnd_a | Chromosome_a | tStart_a | tEnd_a | Gene_a | qStart_a | qEnd_a | Chromosome_a | tStart_a | tEnd_a |
| AW020886 | FTH1 | 8 | 65 | 11 | 61732036 | 61732093 | FAM162A | 66 | 379 | 3 | 122126184 | 122128846 | |
| BI491844 | FAM162A | 1 | 262 | 3 | 122126184 | 122128794 | FTH1 | 263 | 320 | 11 | 61732036 | 61732093 | |
| CF128359 | FTH1 | 1 | 135 | 11 | 61734947 | 61735085 | CAPNS1 | 135 | 663 | 19 | 36632030 | 36637138 | |
| DA783643 | FTH1 | 1 | 127 | 11 | 61734977 | 61735103 | BCYRN1 | 123 | 576 | X | 70514287 | 70517294 | |
| AK054816 | ORAOV1 | 1 | 1248 | 11 | 69481537 | 69490091 | FTH1 | 1249 | 2167 | 11 | 61732038 | 61735103 | |
| BG506265 | FTH1 | 1 | 76 | 11 | 61735028 | 61735103 | EXTL2 | 66 | 515 | 1 | 101338424 | 101338873 | |
| BG527923 | FTH1 | 2 | 125 | 11 | 61734981 | 61735103 | AVL9 | 124 | 630 | 7 | 33059247 | 33102232 | |
| AI541104 | LOC100507412 | 14 | 94 | ? | 115965 | 116046 | FTH1 | 94 | 466 | 11 | 61732511 | 61734924 | |
| AK127090 | SLC16A3 | 1 | 2846 | 17 | 80186921 | 80189766 | FTH1 | 2839 | 3621 | 11 | 61732038 | 61734967 | |
| BC001481 | BLCAP | 9 | 1289 | 20 | 36146457 | 36147737 | FTH1 | 1281 | 2185 | 11 | 61732037 | 61735089 | |
| AK095899 | PYGO2 | 1 | 1306 | 1 | 154931216 | 154934512 | FTH1 | 1301 | 2034 | 11 | 61732035 | 61734915 | |
| BQ230476 | FTH1 | 1 | 141 | 11 | 61734943 | 61735083 | FBL | 139 | 666 | 19 | 40328352 | 40331286 | |
| Top |
| Mutation type/ Tissue ID | brca | cns | cerv | endome | haematopo | kidn | Lintest | liver | lung | ns | ovary | pancre | prost | skin | stoma | thyro | urina | |||
| Total # sample | 1 | |||||||||||||||||||
| GAIN (# sample) | 1 | |||||||||||||||||||
| LOSS (# sample) |
| cf) Tissue ID; Tissue type (1; Breast, 2; Central_nervous_system, 3; Cervix, 4; Endometrium, 5; Haematopoietic_and_lymphoid_tissue, 6; Kidney, 7; Large_intestine, 8; Liver, 9; Lung, 10; NS, 11; Ovary, 12; Pancreas, 13; Prostate, 14; Skin, 15; Stomach, 16; Thyroid, 17; Urinary_tract) |
| Top |
|
 |
| Top |
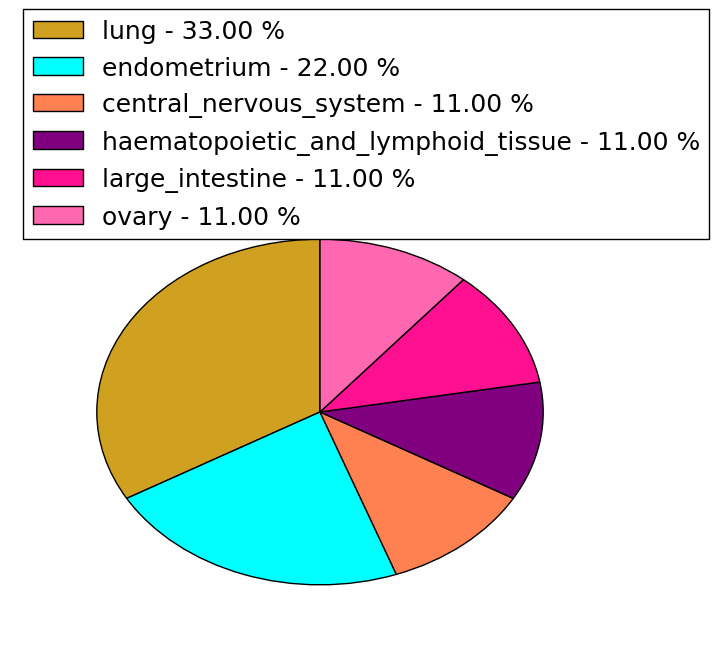
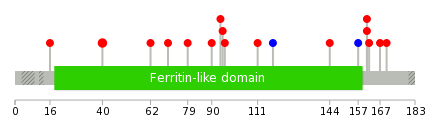
| Stat. for Non-Synonymous SNVs (# total SNVs=9) | (# total SNVs=2) |
 | 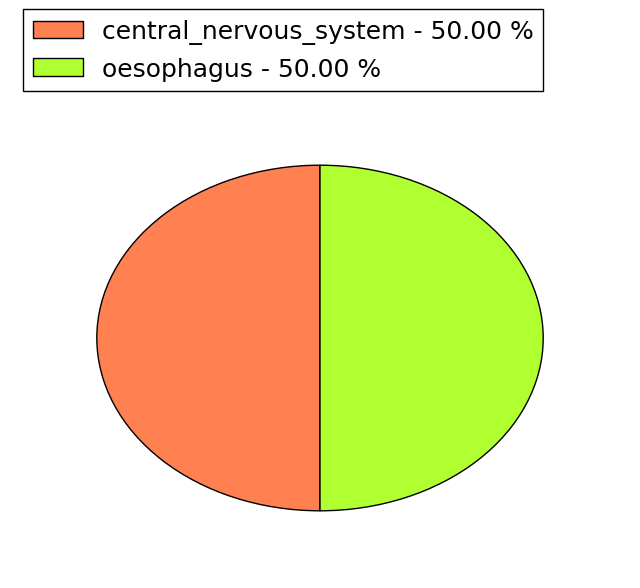 |
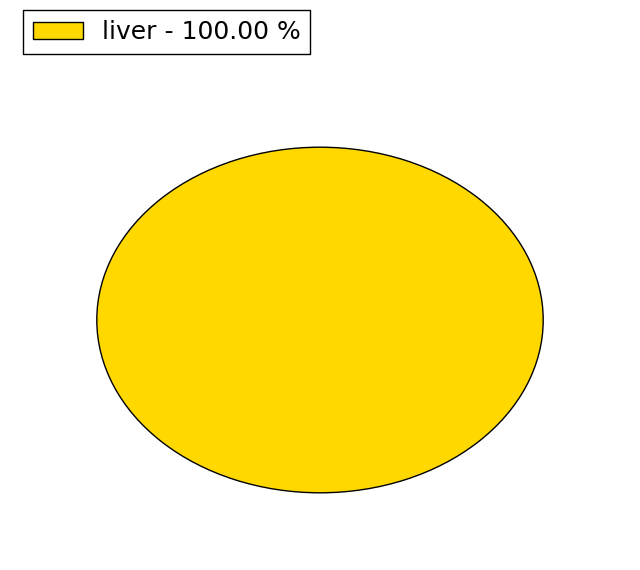
(# total SNVs=1) | (# total SNVs=0) |
 |
| Top |
| * When you move the cursor on each content, you can see more deailed mutation information on the Tooltip. Those are primary_site,primary_histology,mutation(aa),pubmedID. |
| GRCh37 position | Mutation(aa) | Unique sampleID count |
| chr11:61732984-61732984 | p.Y40H | 2 |
| chr11:61732517-61732517 | p.N110fs*2 | 1 |
| chr11:61732975-61732975 | p.D43N | 1 |
| chr11:61732558-61732558 | p.S96S | 1 |
| chr11:61732243-61732243 | p.L170V | 1 |
| chr11:61732559-61732559 | p.S96I | 1 |
| chr11:61732988-61732988 | p.? | 1 |
| chr11:61732251-61732251 | p.A167V | 1 |
| chr11:61732561-61732561 | p.E95D | 1 |
| chr11:61734799-61734799 | p.Y33* | 1 |
| Top |
|
 |
| Point Mutation/ Tissue ID | 1 | 2 | 3 | 4 | 5 | 6 | 7 | 8 | 9 | 10 | 11 | 12 | 13 | 14 | 15 | 16 | 17 | 18 | 19 | 20 |
| # sample | 1 | 1 | 1 | 2 | 1 | 2 | 2 | 3 | 2 | |||||||||||
| # mutation | 3 | 1 | 1 | 2 | 1 | 2 | 2 | 3 | 2 | |||||||||||
| nonsynonymous SNV | 3 | 1 | 2 | 1 | 1 | 2 | 3 | 2 | ||||||||||||
| synonymous SNV | 1 | 1 |
| cf) Tissue ID; Tissue type (1; BLCA[Bladder Urothelial Carcinoma], 2; BRCA[Breast invasive carcinoma], 3; CESC[Cervical squamous cell carcinoma and endocervical adenocarcinoma], 4; COAD[Colon adenocarcinoma], 5; GBM[Glioblastoma multiforme], 6; Glioma Low Grade, 7; HNSC[Head and Neck squamous cell carcinoma], 8; KICH[Kidney Chromophobe], 9; KIRC[Kidney renal clear cell carcinoma], 10; KIRP[Kidney renal papillary cell carcinoma], 11; LAML[Acute Myeloid Leukemia], 12; LUAD[Lung adenocarcinoma], 13; LUSC[Lung squamous cell carcinoma], 14; OV[Ovarian serous cystadenocarcinoma ], 15; PAAD[Pancreatic adenocarcinoma], 16; PRAD[Prostate adenocarcinoma], 17; SKCM[Skin Cutaneous Melanoma], 18:STAD[Stomach adenocarcinoma], 19:THCA[Thyroid carcinoma], 20:UCEC[Uterine Corpus Endometrial Carcinoma]) |
| Top |
| * We represented just top 10 SNVs. When you move the cursor on each content, you can see more deailed mutation information on the Tooltip. Those are primary_site, primary_histology, mutation(aa), pubmedID. |
| Genomic Position | Mutation(aa) | Unique sampleID count |
| chr11:61732984 | p.Y40H | 2 |
| chr11:61732559 | p.S96N | 1 |
| chr11:61732561 | p.E95D | 1 |
| chr11:61732243 | p.W94L | 1 |
| chr11:61732565 | p.D90N | 1 |
| chr11:61732251 | p.G79V | 1 |
| chr11:61732578 | p.L70P | 1 |
| chr11:61732267 | p.E62Q | 1 |
| chr11:61732866 | p.L170V | 1 |
| chr11:61732269 | p.A167V | 1 |
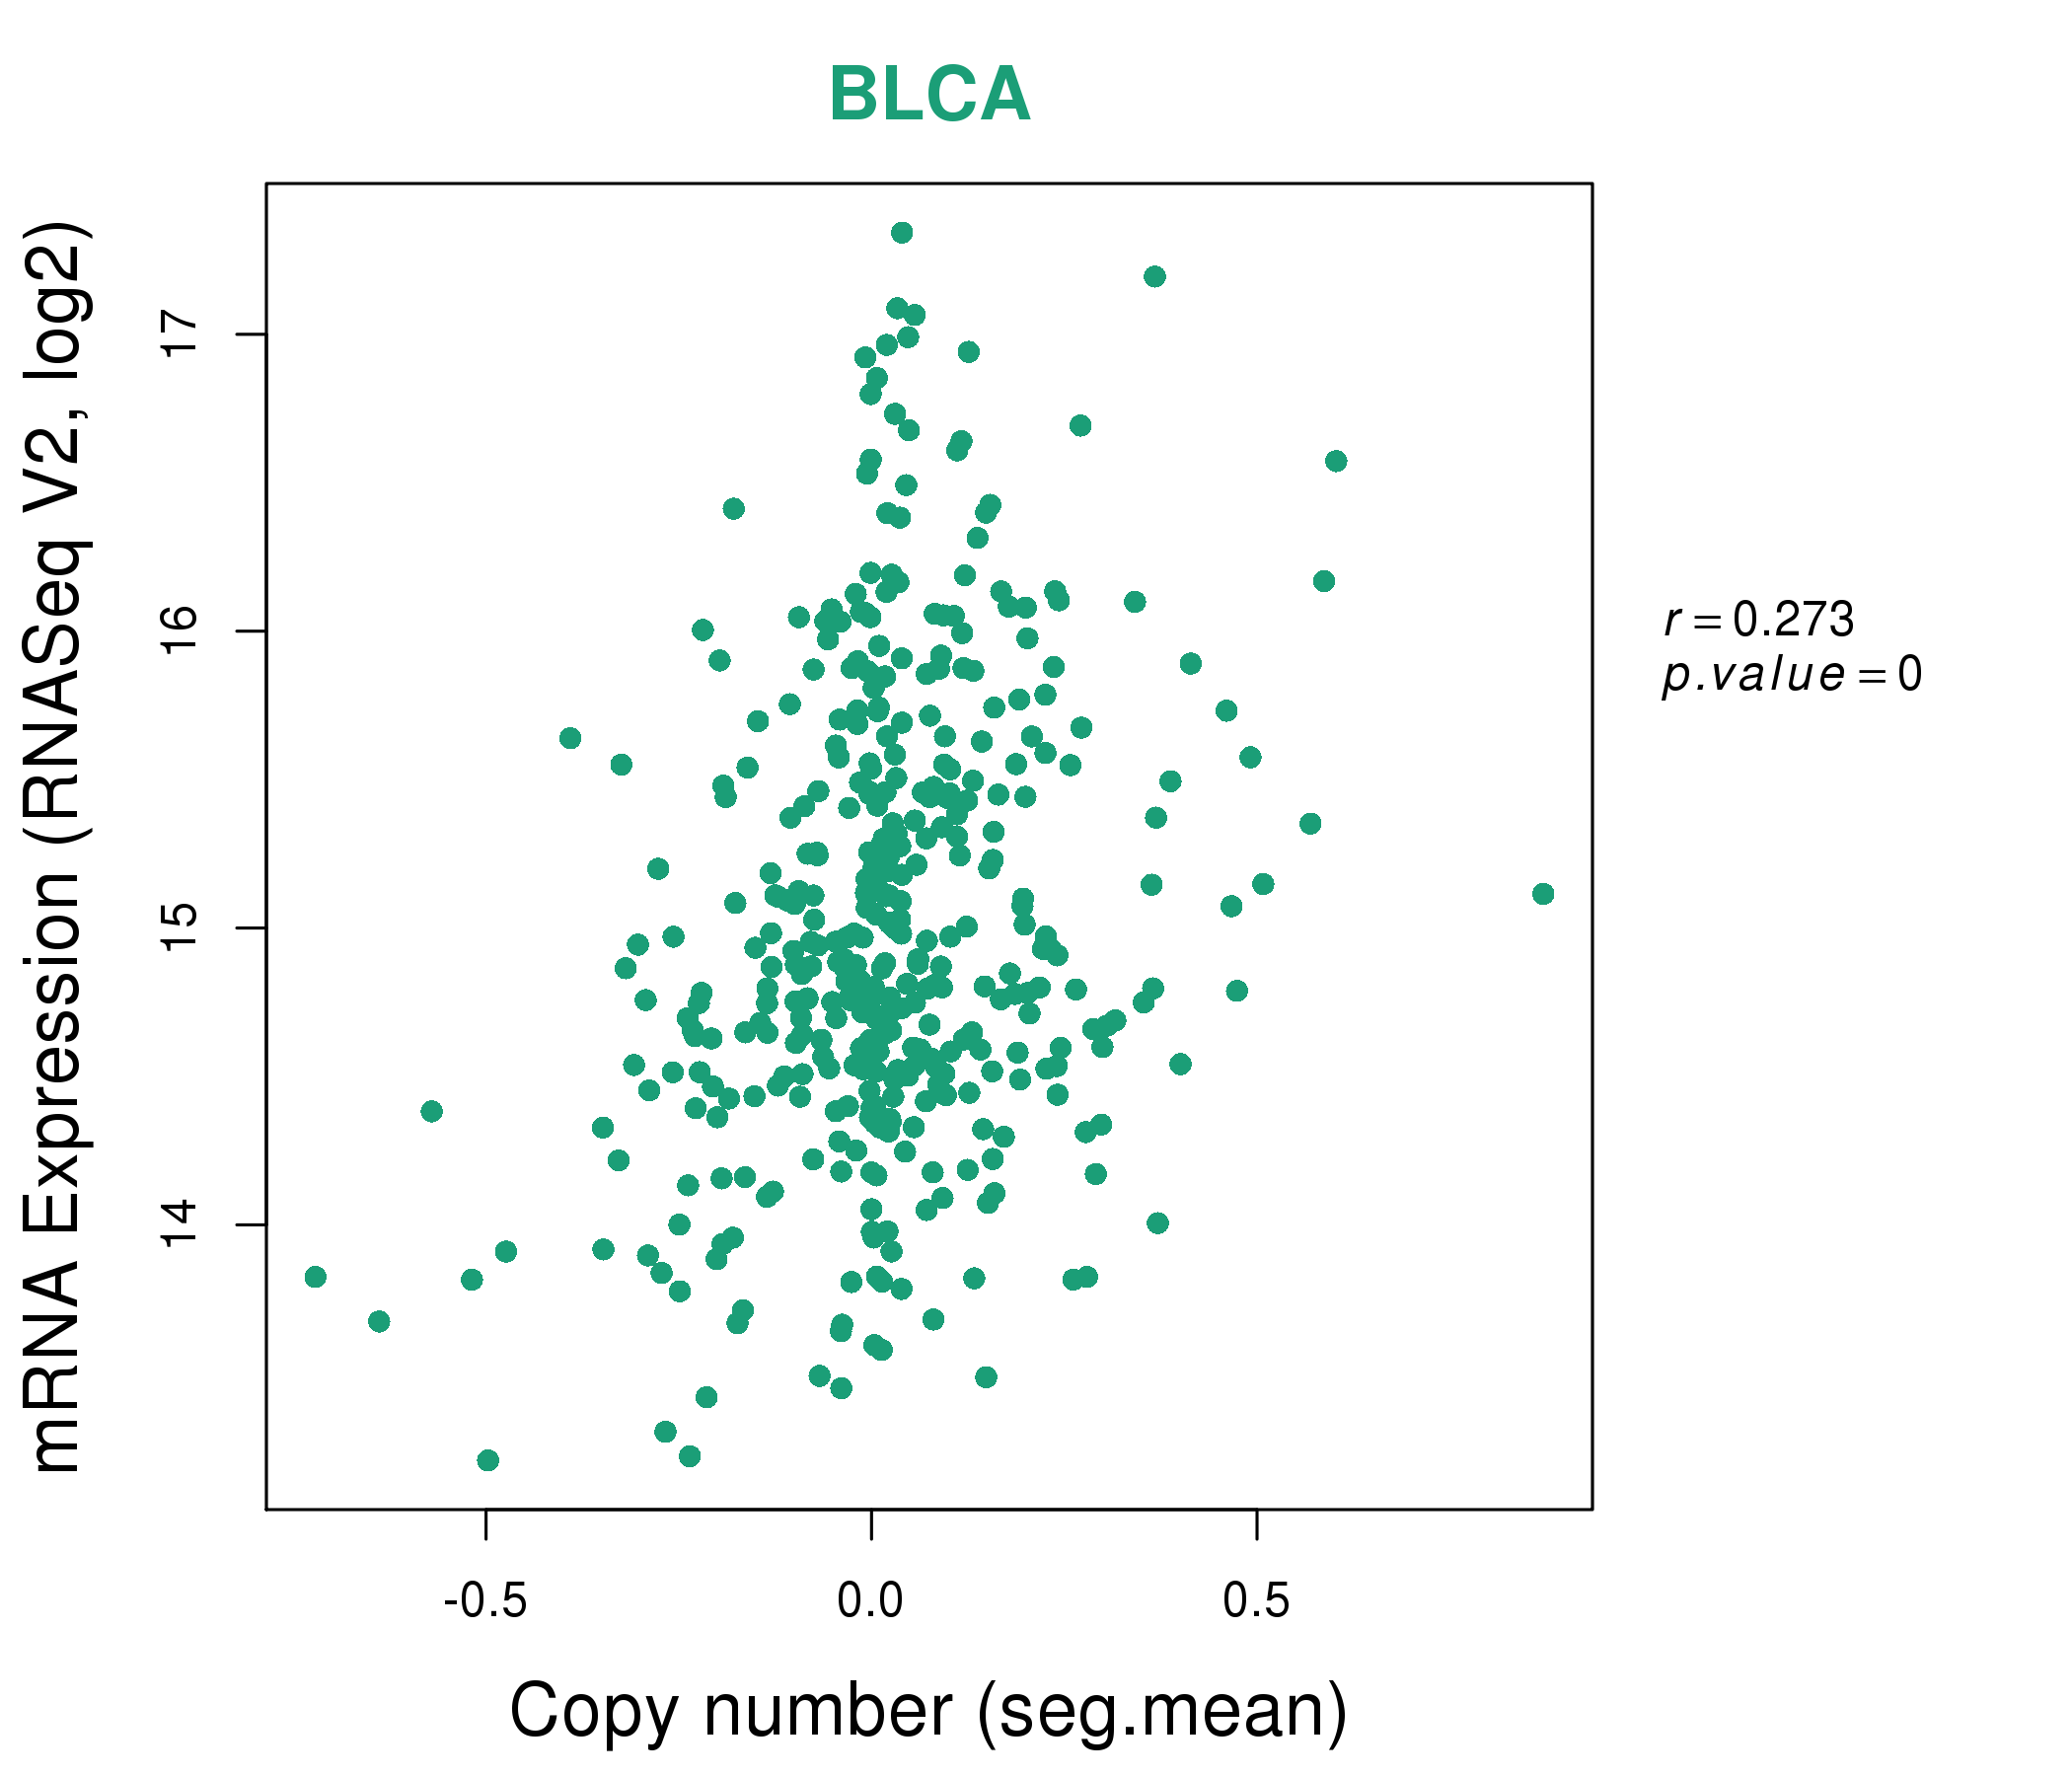
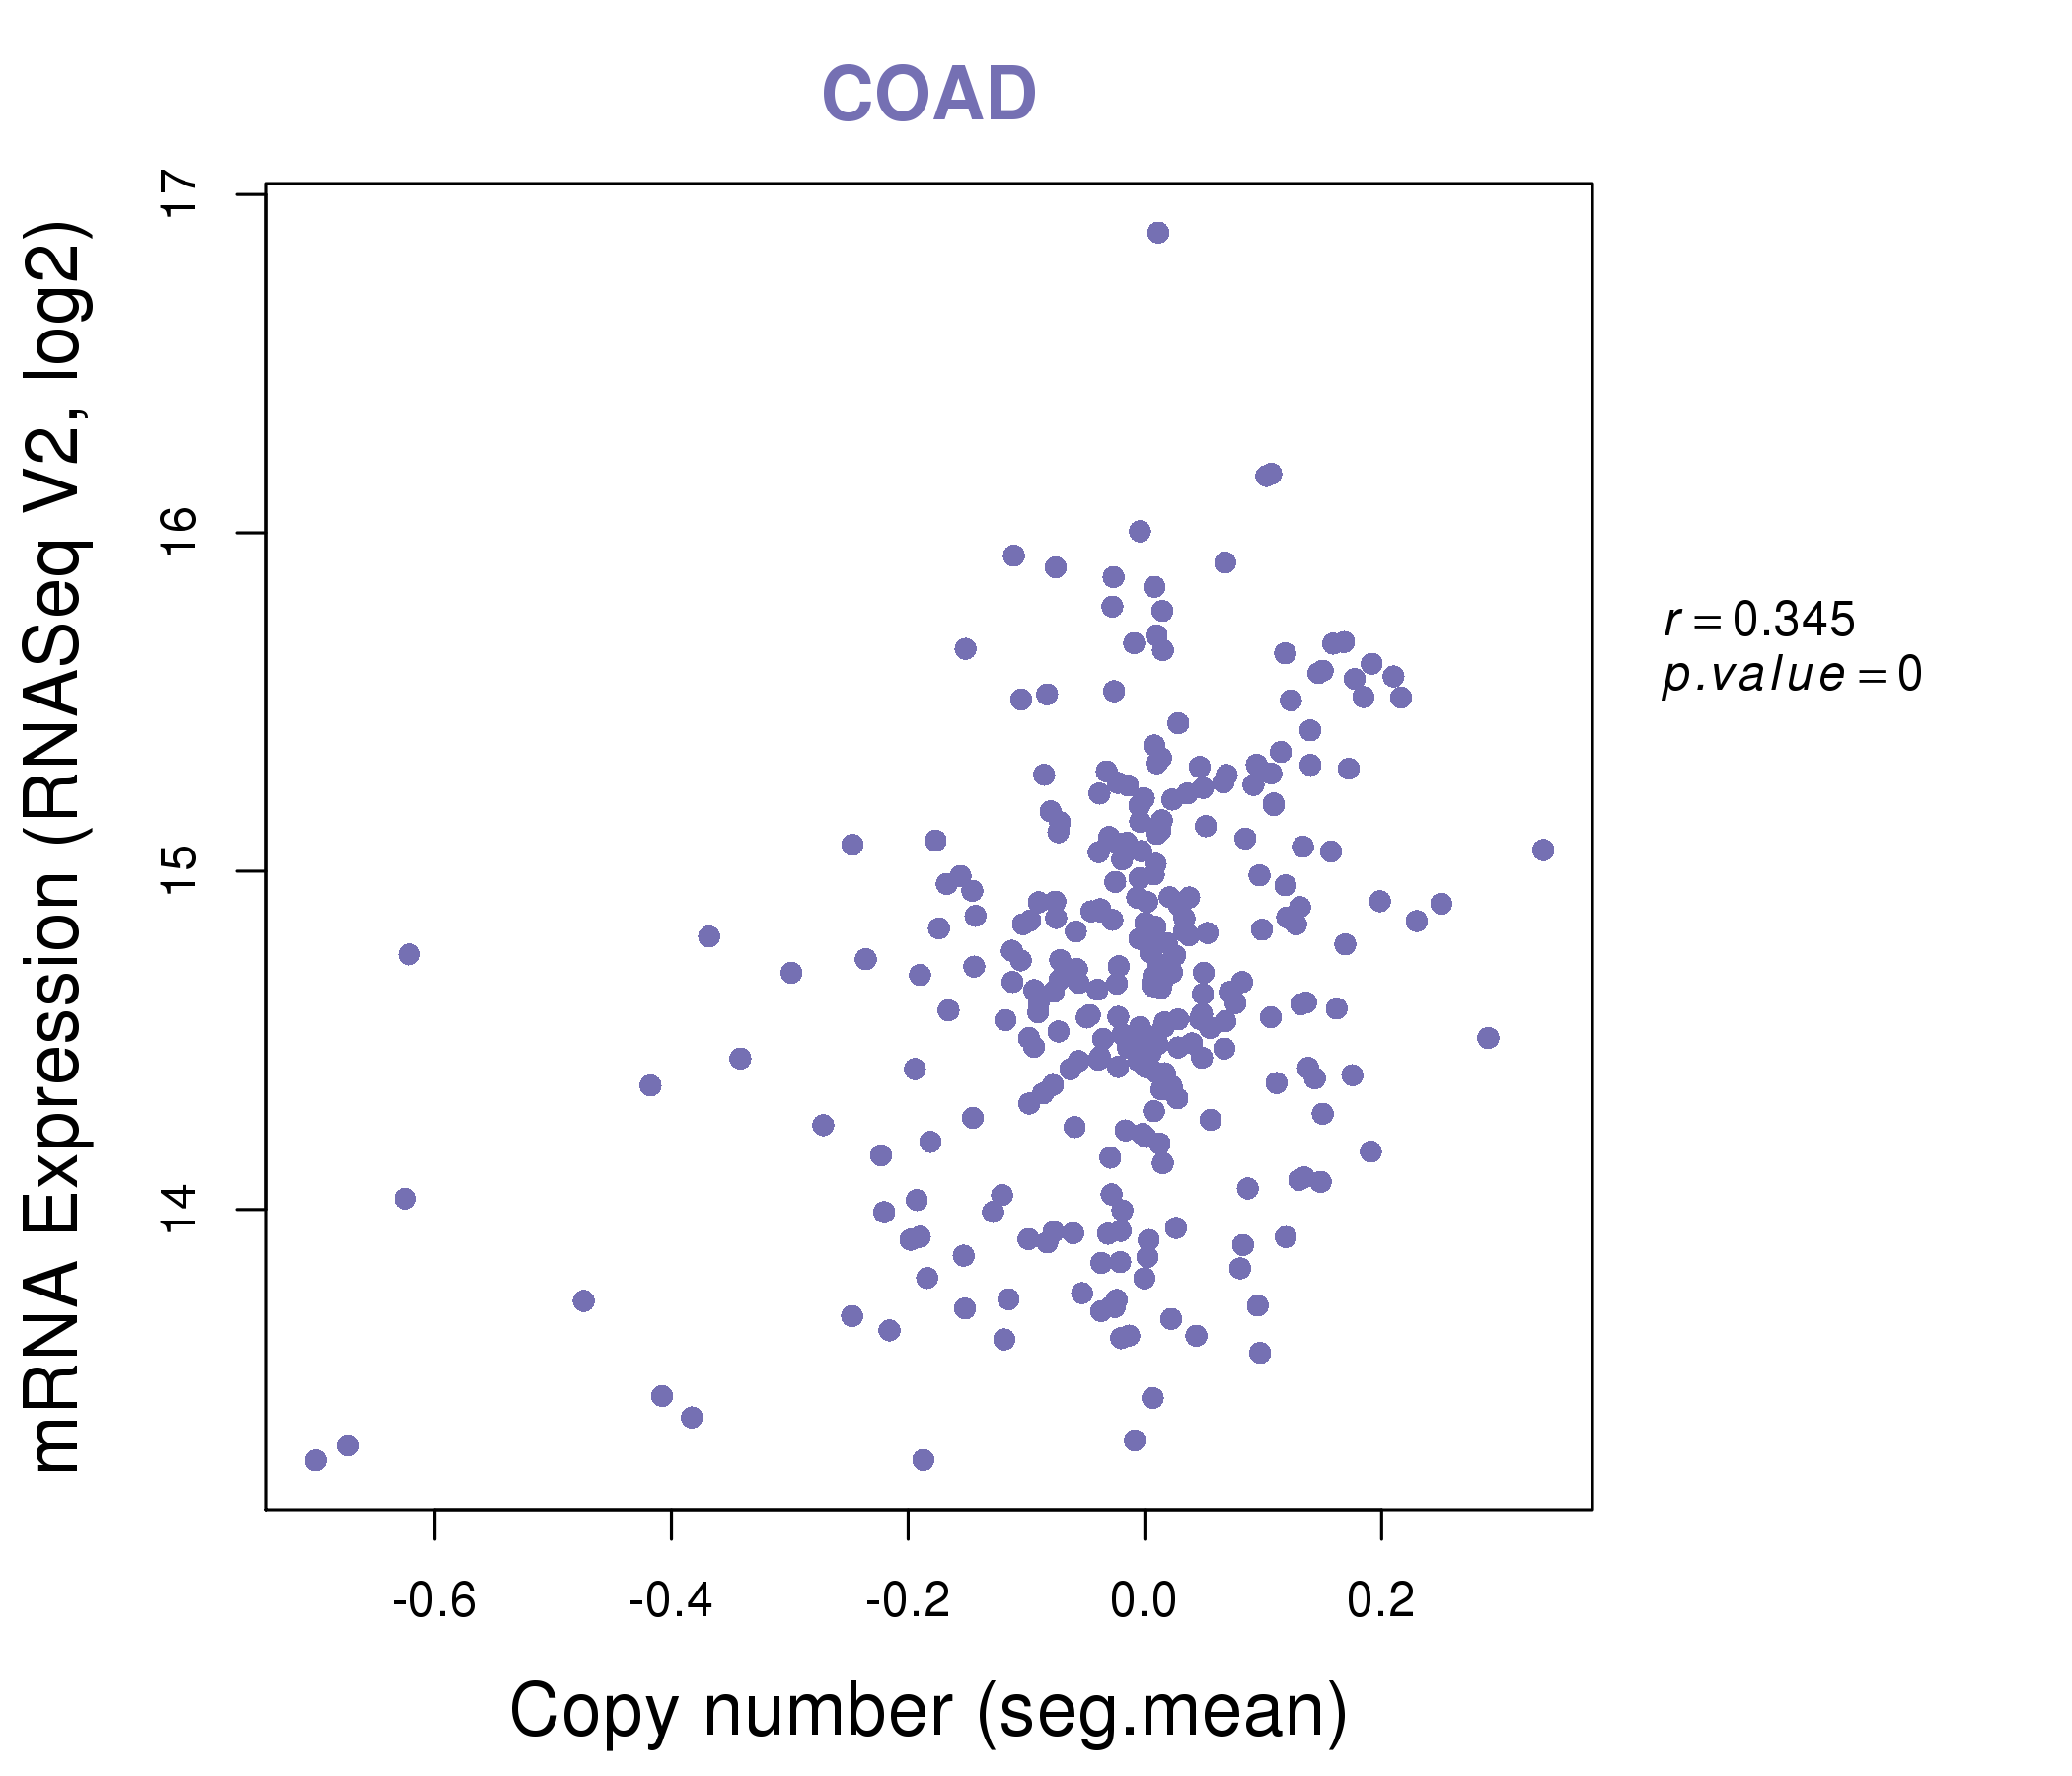
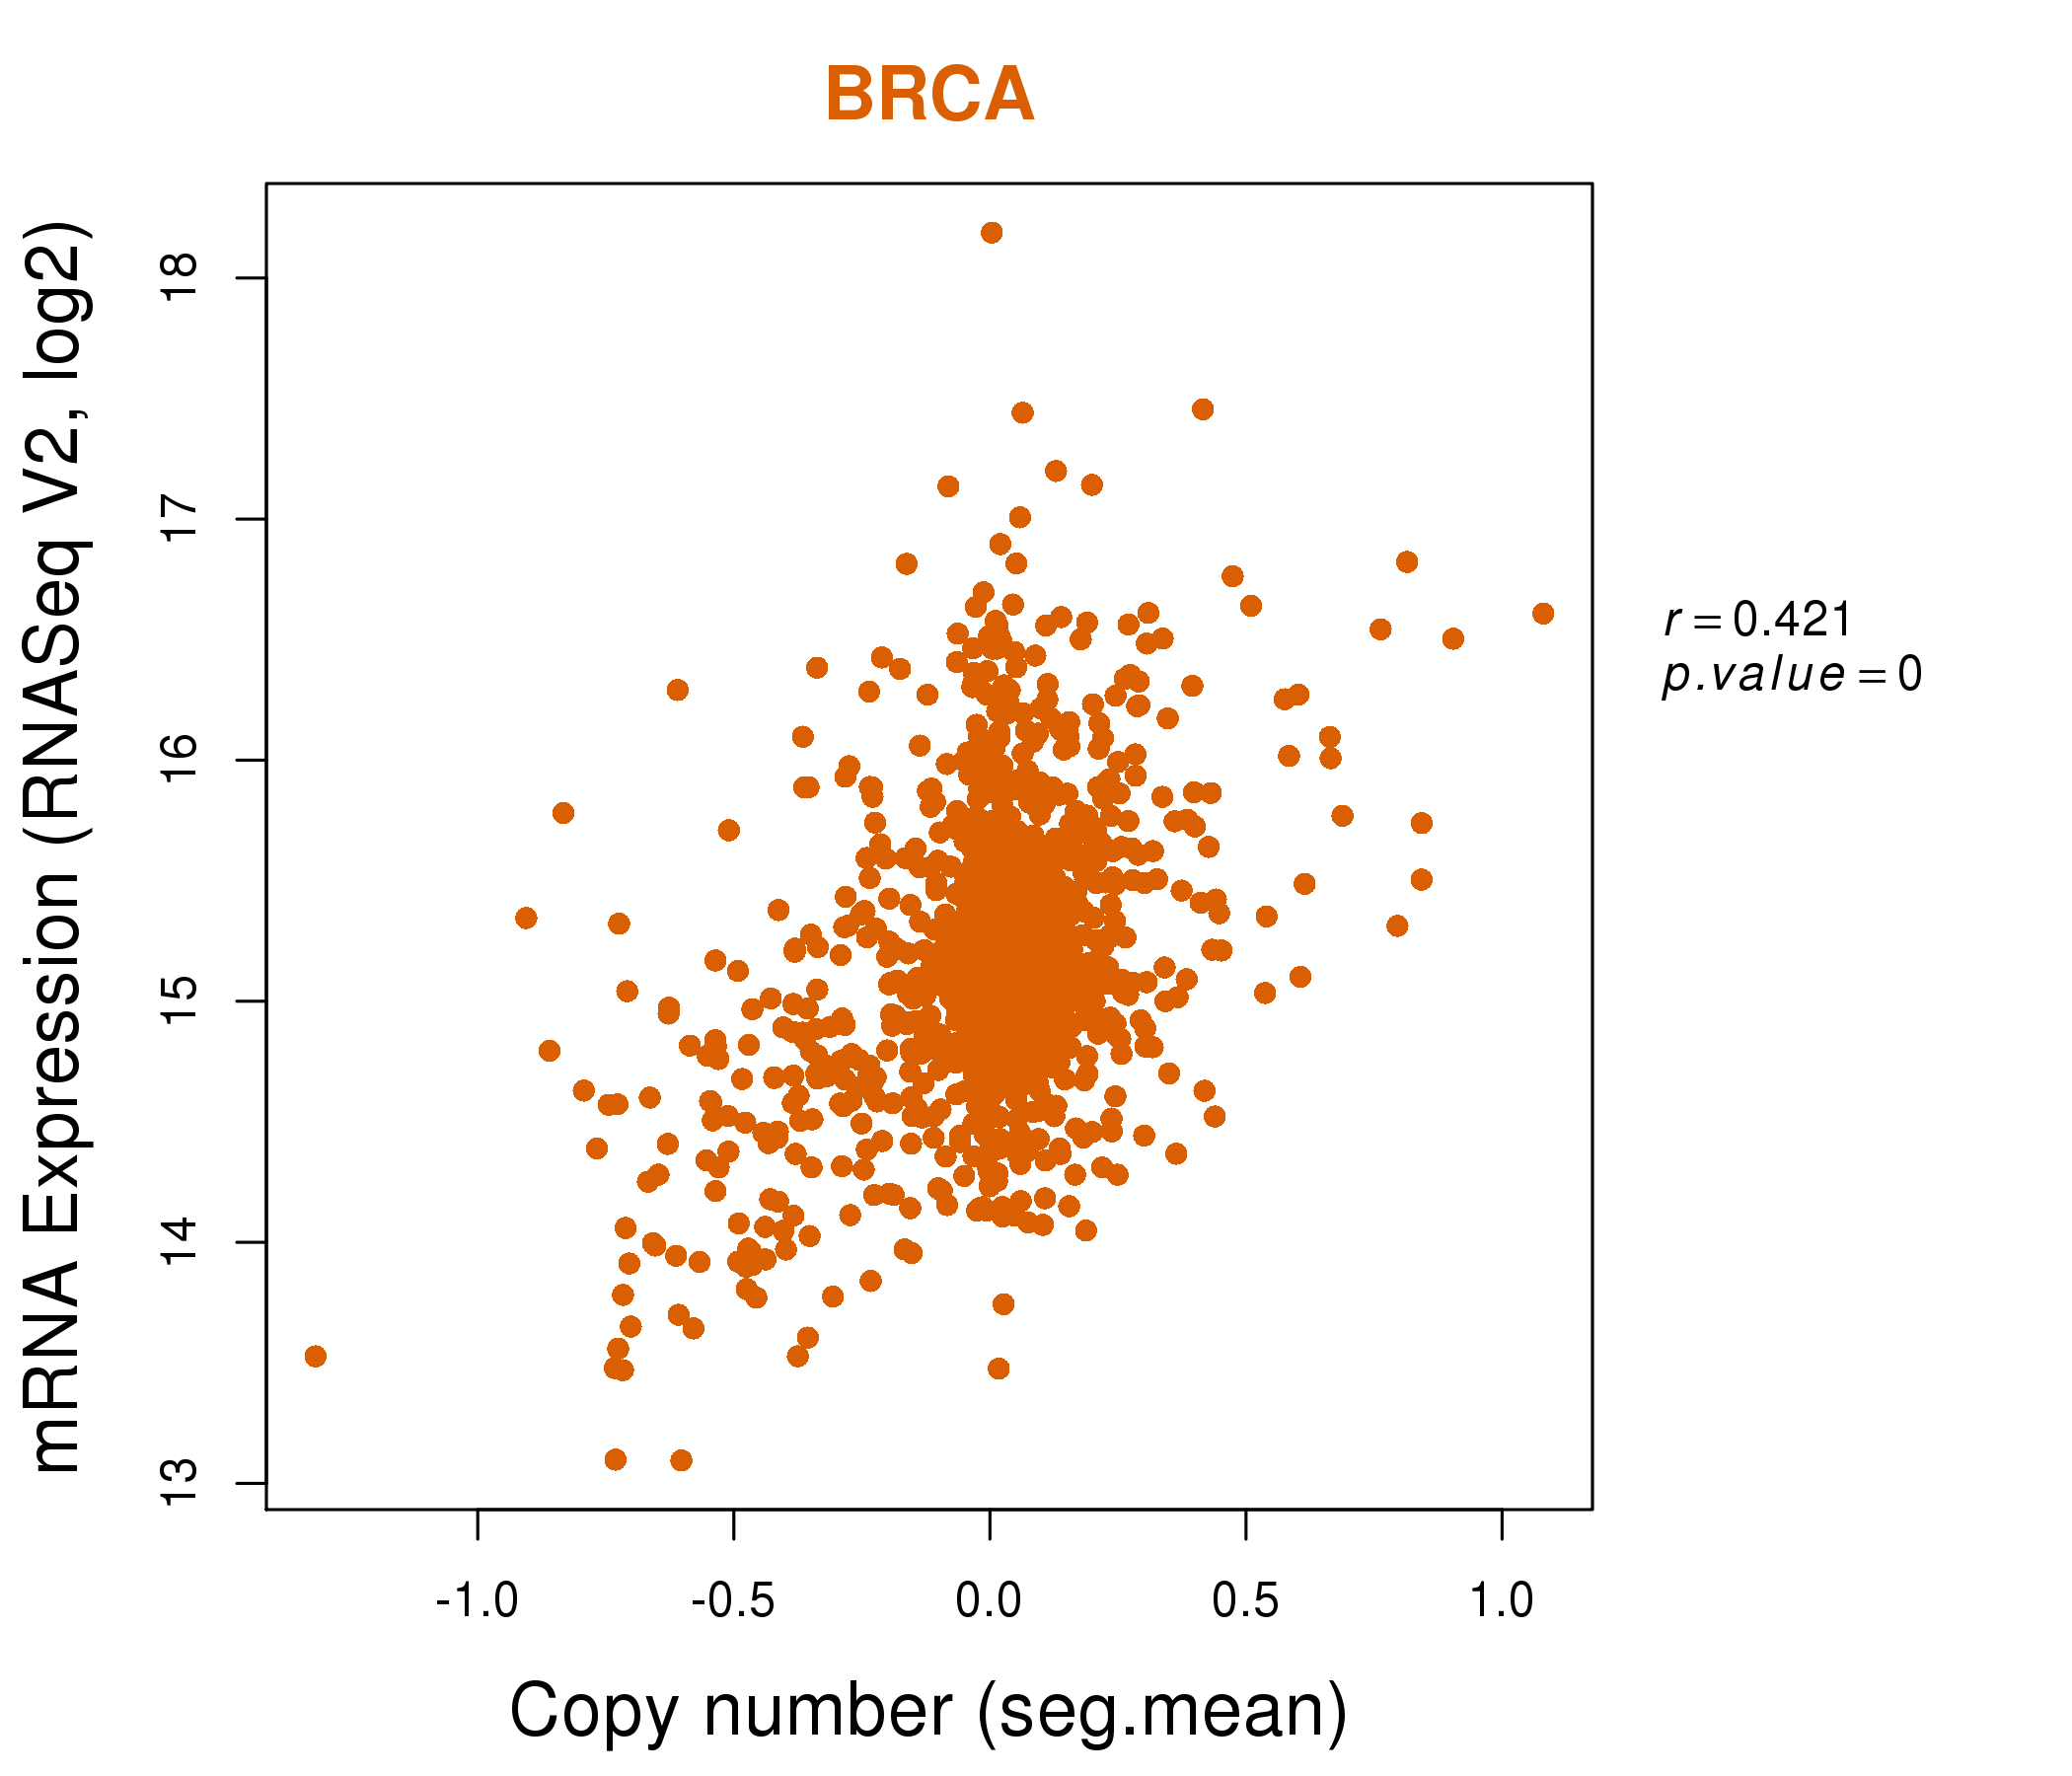
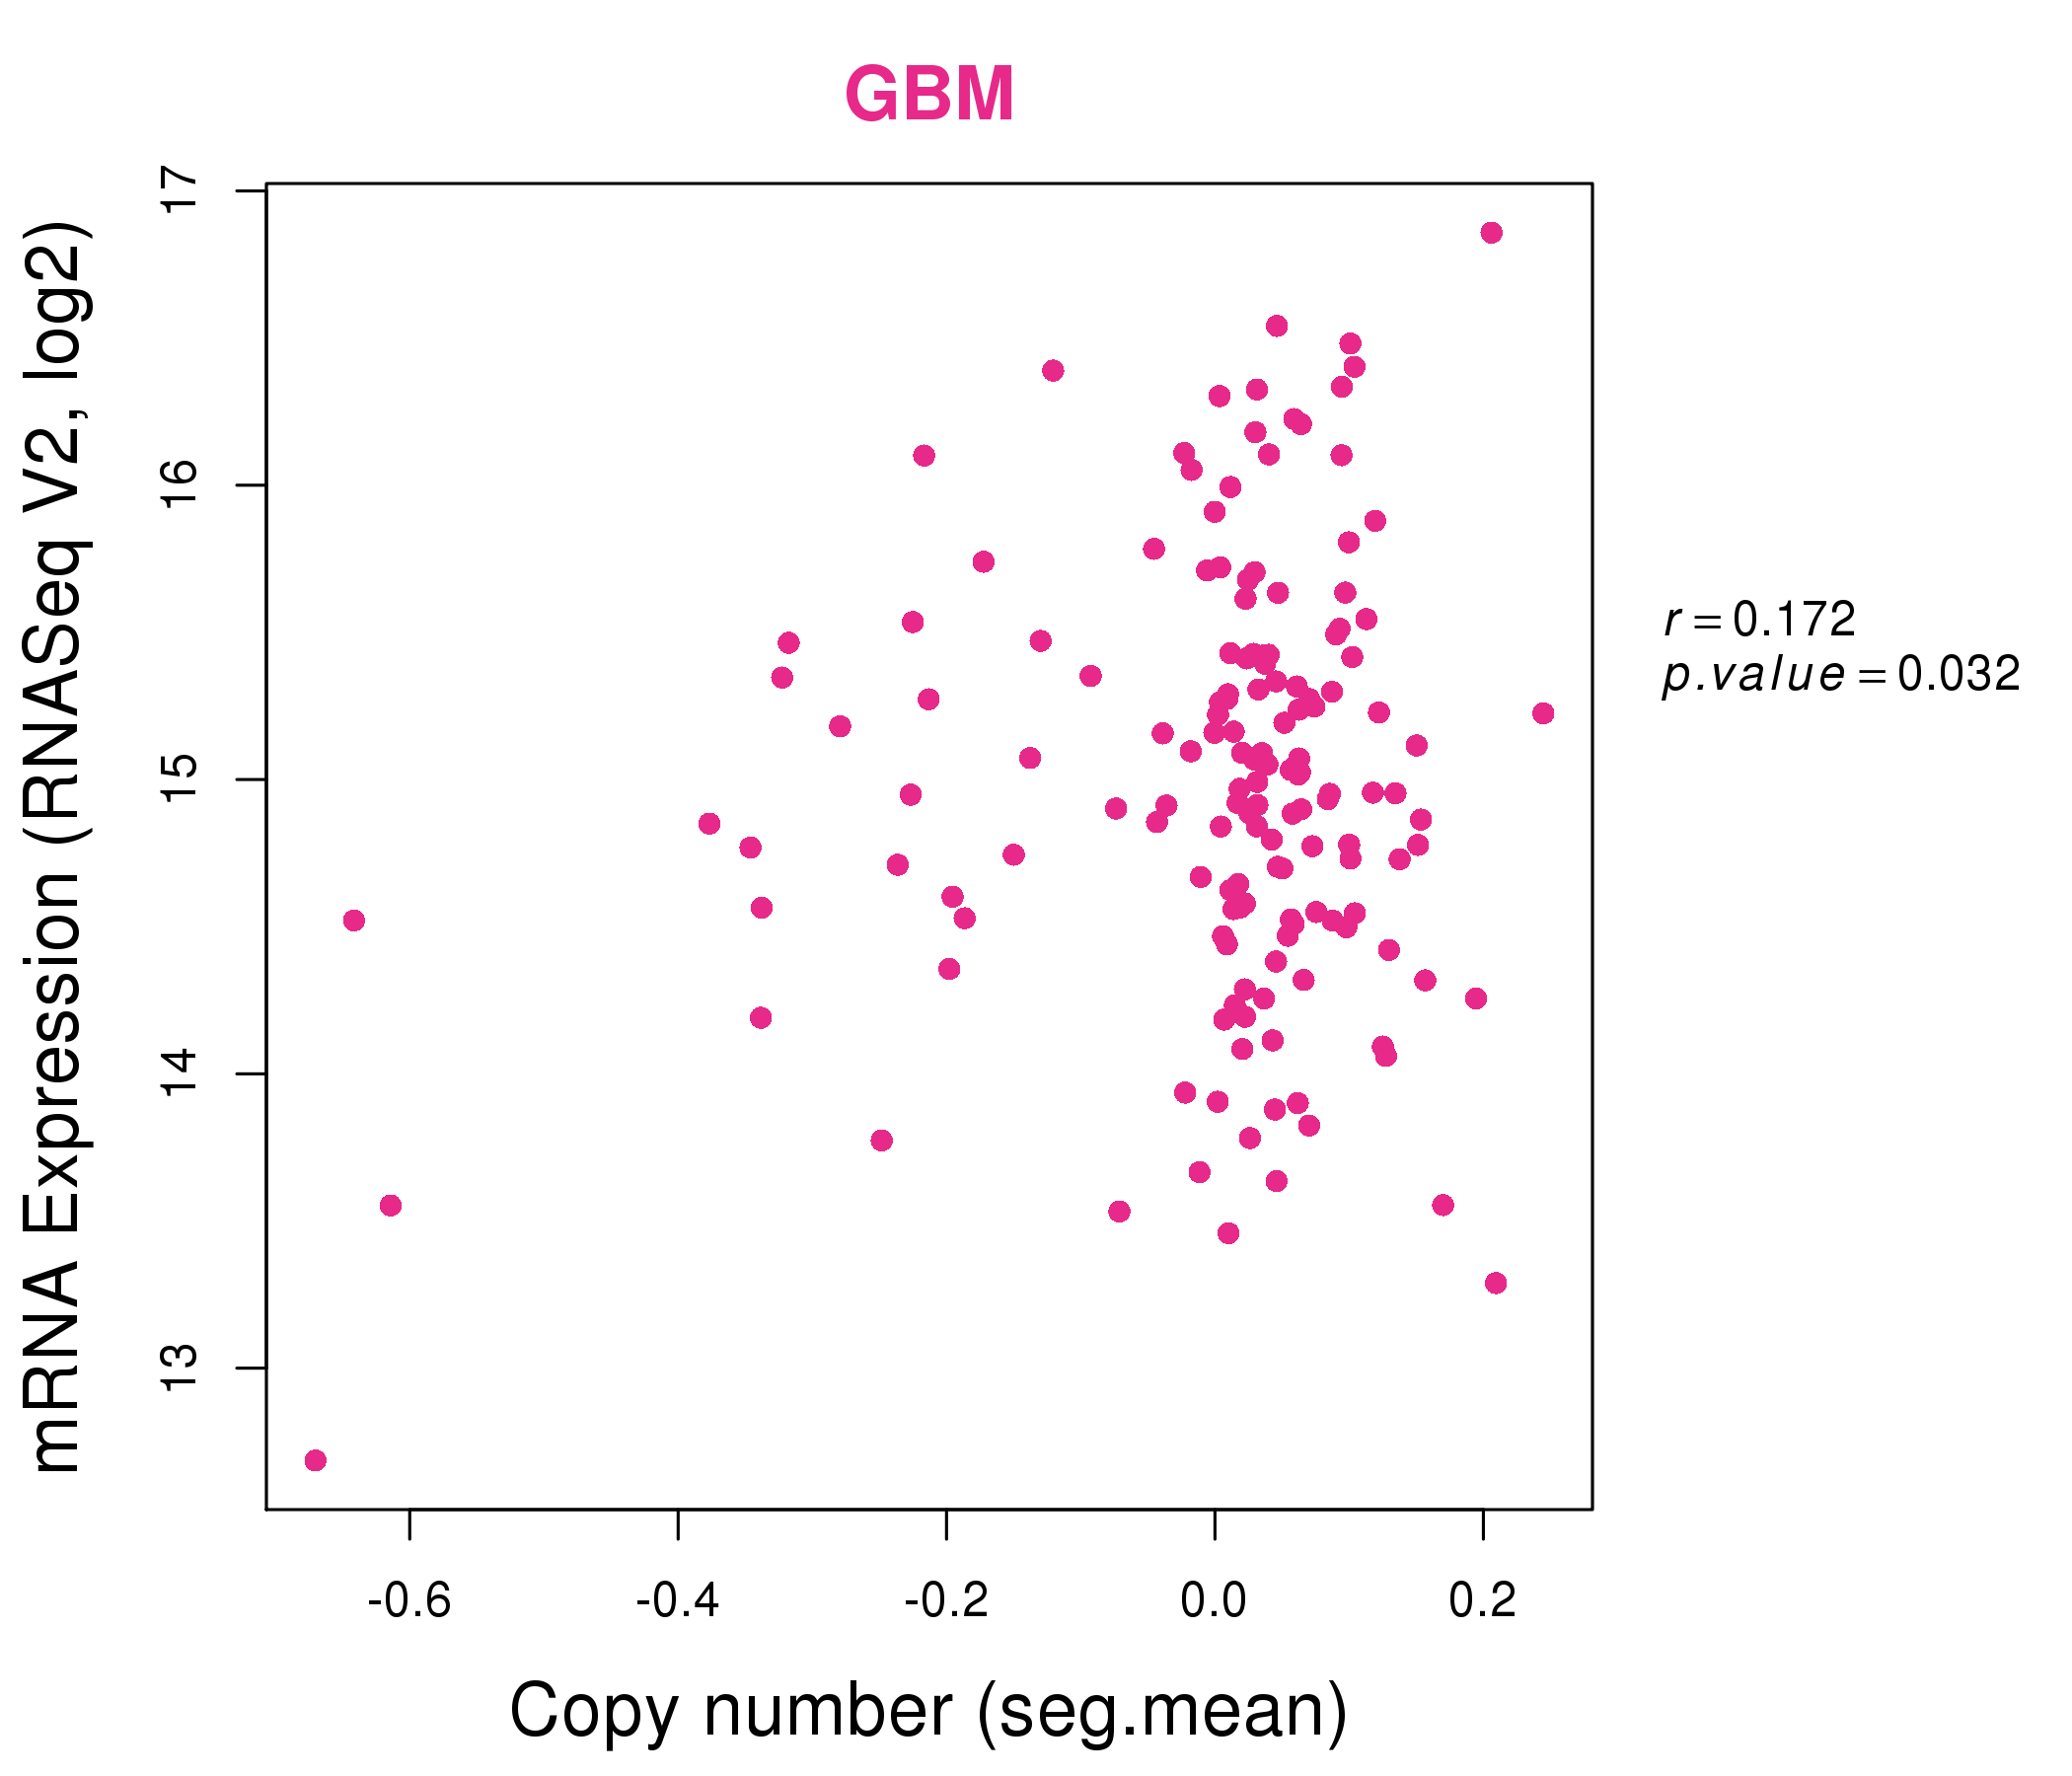
| * Copy number data were extracted from TCGA using R package TCGA-Assembler. The URLs of all public data files on TCGA DCC data server were gathered on Jan-05-2015. Function ProcessCNAData in TCGA-Assembler package was used to obtain gene-level copy number value which is calculated as the average copy number of the genomic region of a gene. |
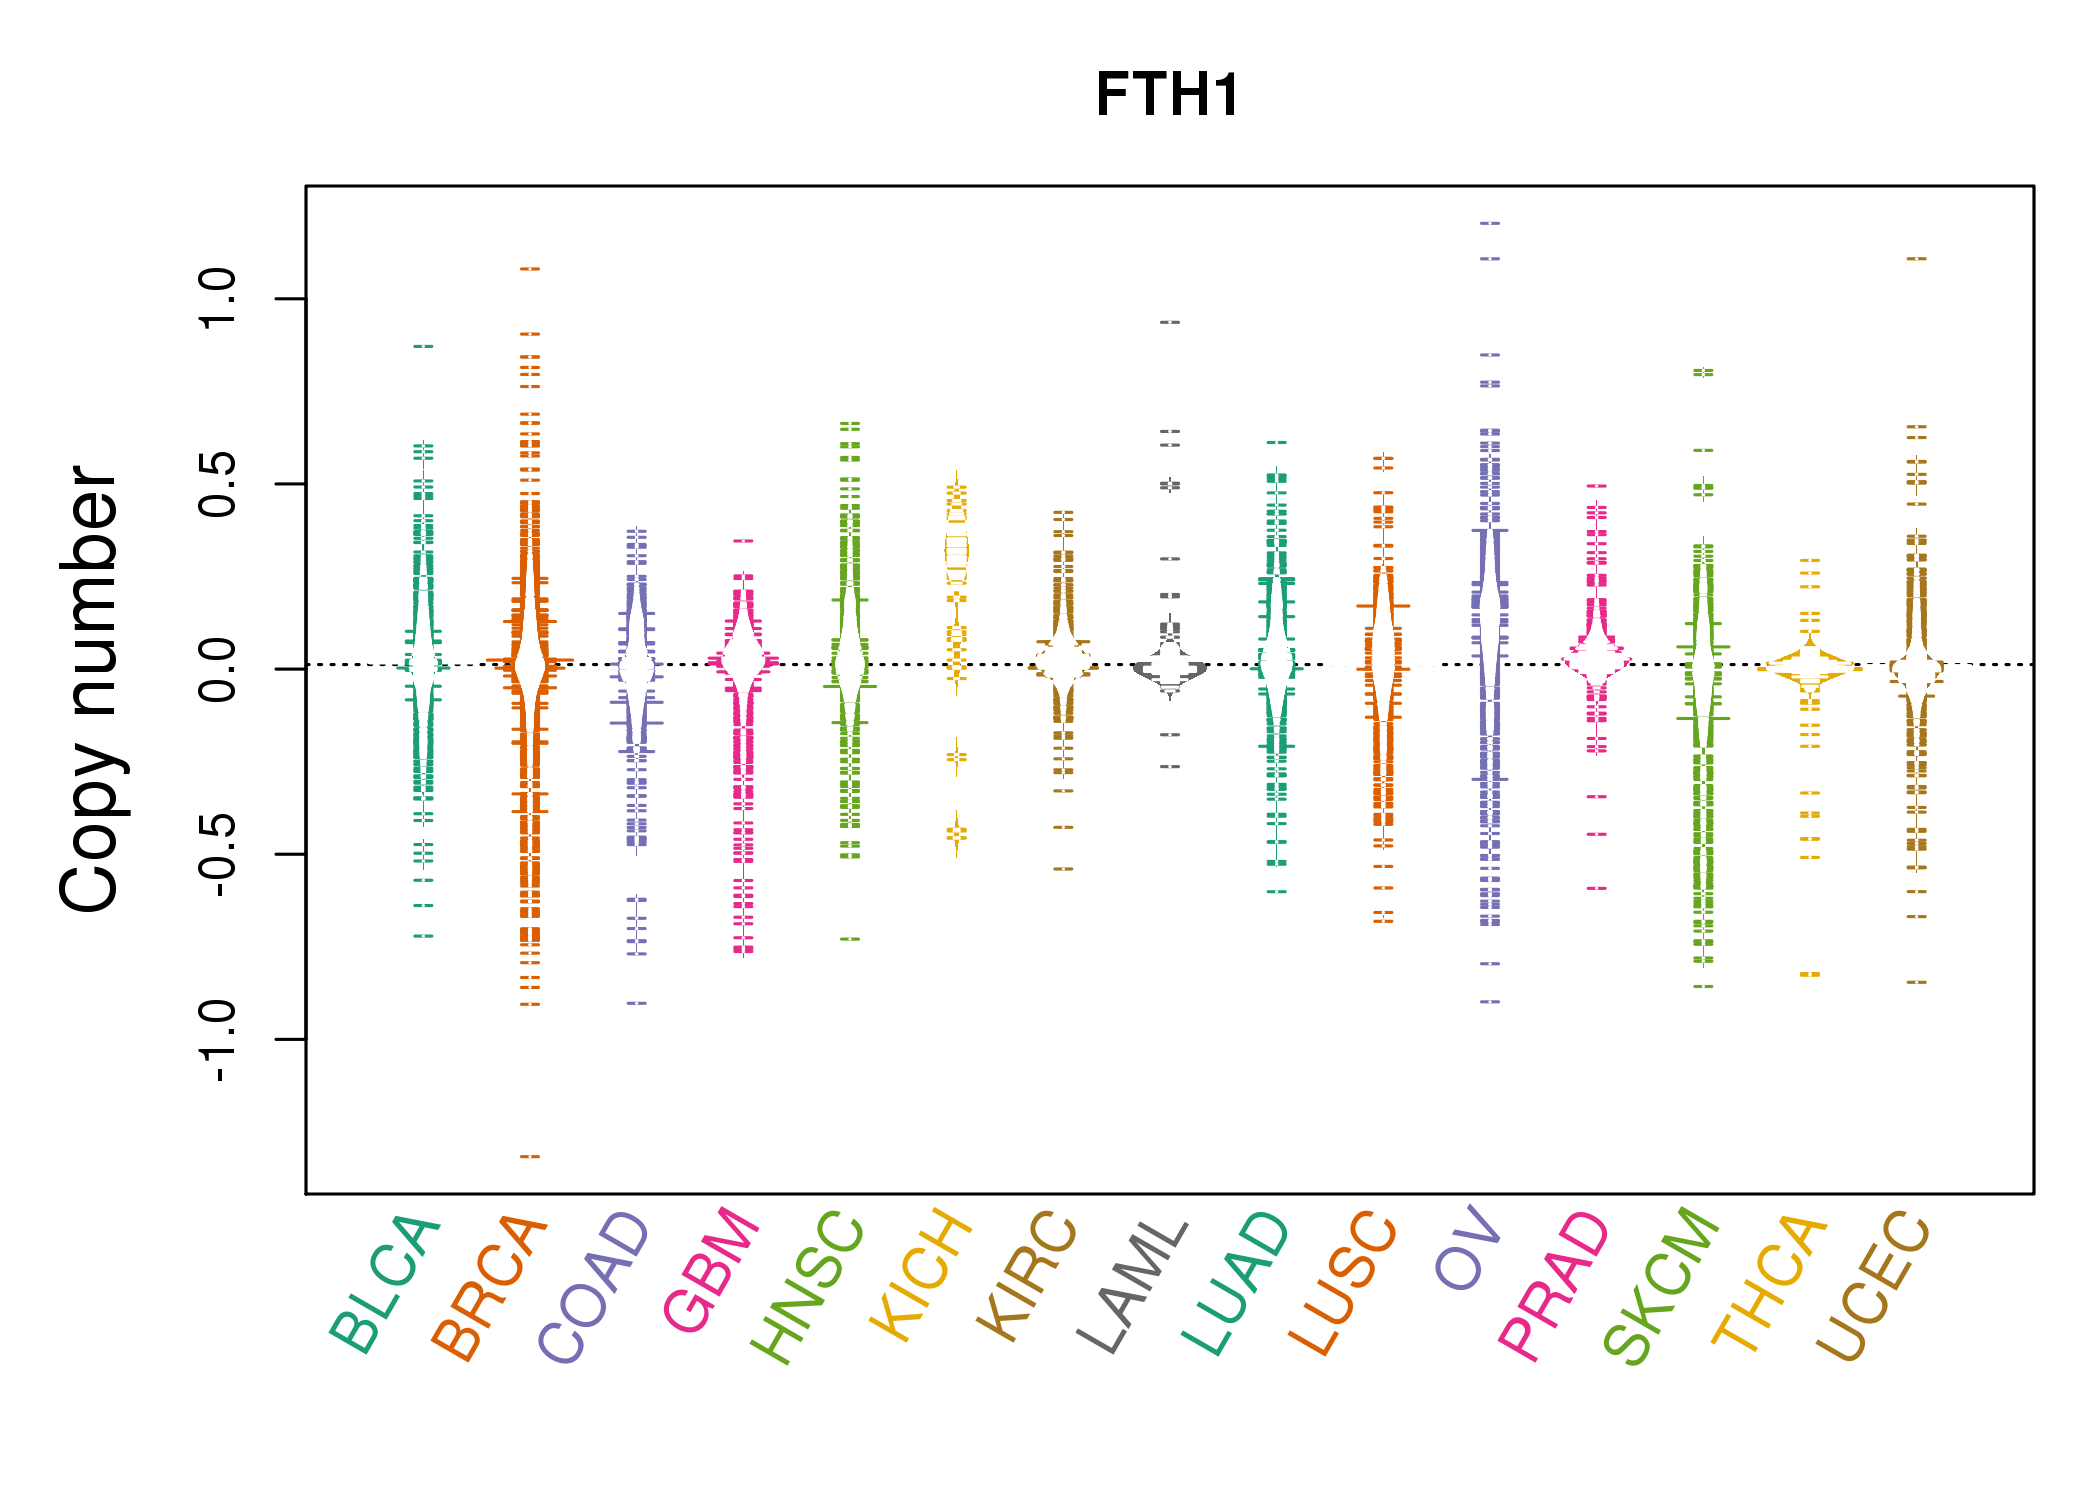 |
| cf) Tissue ID[Tissue type]: BLCA[Bladder Urothelial Carcinoma], BRCA[Breast invasive carcinoma], CESC[Cervical squamous cell carcinoma and endocervical adenocarcinoma], COAD[Colon adenocarcinoma], GBM[Glioblastoma multiforme], Glioma Low Grade, HNSC[Head and Neck squamous cell carcinoma], KICH[Kidney Chromophobe], KIRC[Kidney renal clear cell carcinoma], KIRP[Kidney renal papillary cell carcinoma], LAML[Acute Myeloid Leukemia], LUAD[Lung adenocarcinoma], LUSC[Lung squamous cell carcinoma], OV[Ovarian serous cystadenocarcinoma ], PAAD[Pancreatic adenocarcinoma], PRAD[Prostate adenocarcinoma], SKCM[Skin Cutaneous Melanoma], STAD[Stomach adenocarcinoma], THCA[Thyroid carcinoma], UCEC[Uterine Corpus Endometrial Carcinoma] |
| Top |
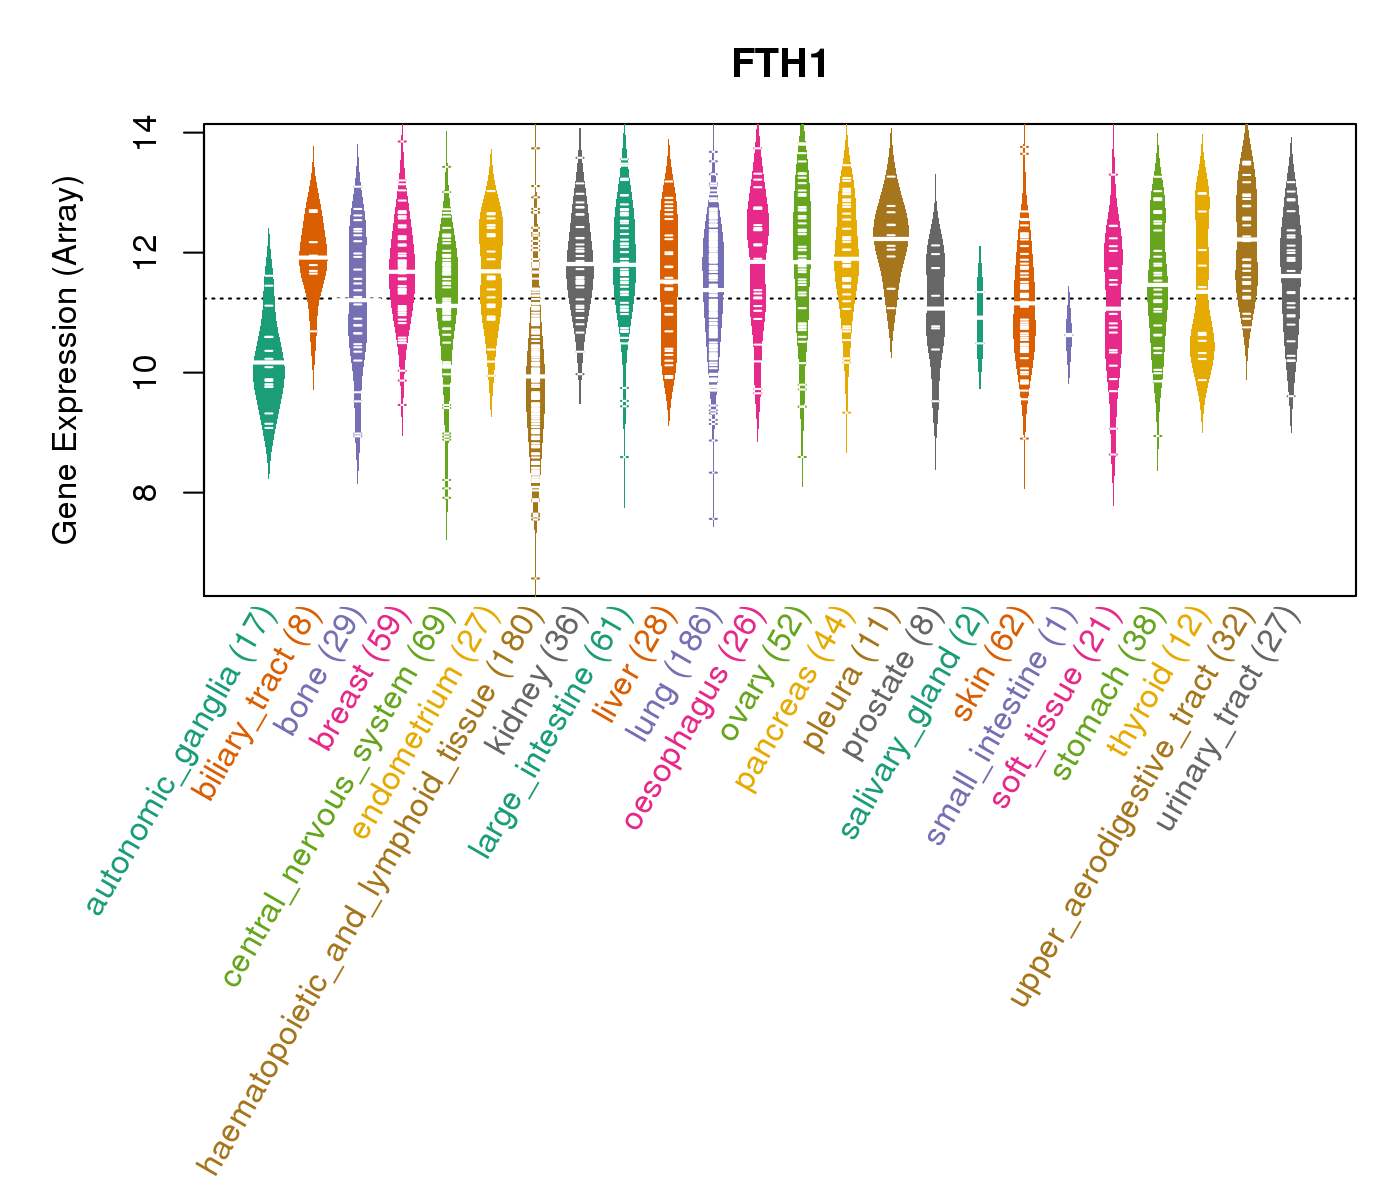
| Gene Expression for FTH1 |
| * CCLE gene expression data were extracted from CCLE_Expression_Entrez_2012-10-18.res: Gene-centric RMA-normalized mRNA expression data. |
 |
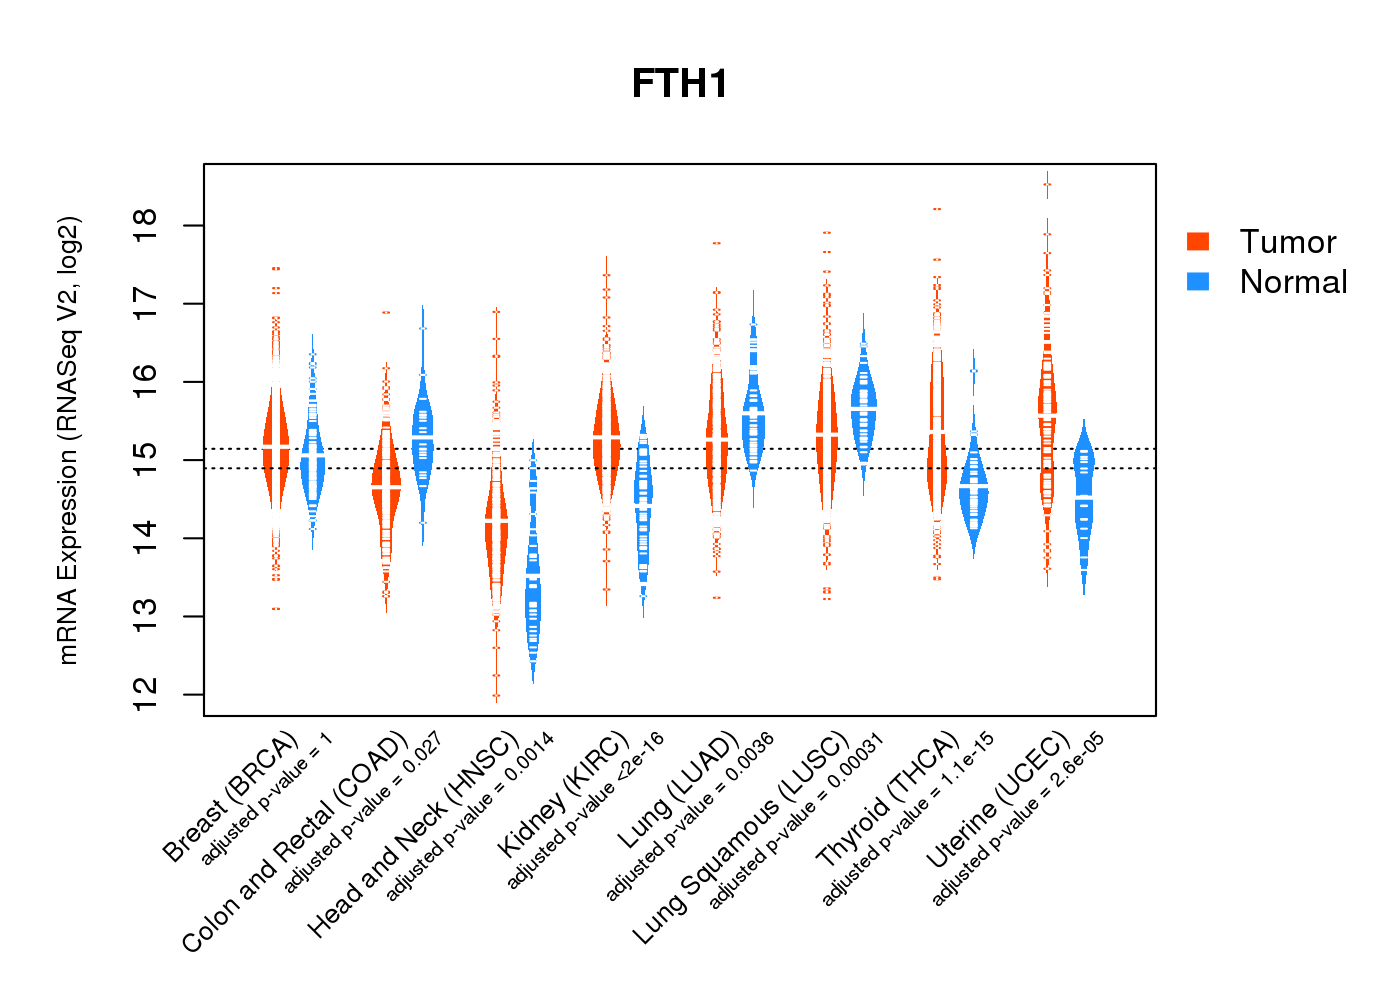
| * Normalized gene expression data of RNASeqV2 was extracted from TCGA using R package TCGA-Assembler. The URLs of all public data files on TCGA DCC data server were gathered at Jan-05-2015. Only eight cancer types have enough normal control samples for differential expression analysis. (t test, adjusted p<0.05 (using Benjamini-Hochberg FDR)) |
 |
| Top |
| * This plots show the correlation between CNV and gene expression. |
: Open all plots for all cancer types
 |
|
 |
|
| Top |
| Gene-Gene Network Information |
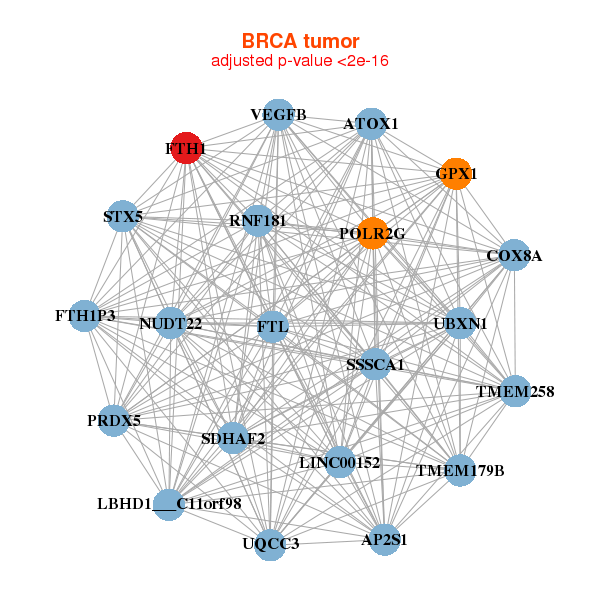
| * Co-Expression network figures were drawn using R package igraph. Only the top 20 genes with the highest correlations were shown. Red circle: input gene, orange circle: cell metabolism gene, sky circle: other gene |
: Open all plots for all cancer types
 |
| ||||
| AP2S1,ATOX1,TMEM258,LBHD1___C11orf98,UQCC3,COX8A,FTH1, FTH1P3,FTL,GPX1,LINC00152,NUDT22,POLR2G,PRDX5, RNF181,SDHAF2,SSSCA1,STX5,TMEM179B,UBXN1,VEGFB | ANXA2,ARPC2,BRI3,C1QA,CAPNS1,CD63,COTL1, CRYL1,CSTB,FCGRT,FOLR2,FTH1,FTL,COLGALT1, GMFG,RNASE1,S100A10,S100A6,SH3BGRL3,TMSB4XP8,VKORC1 | ||||
 |
| ||||
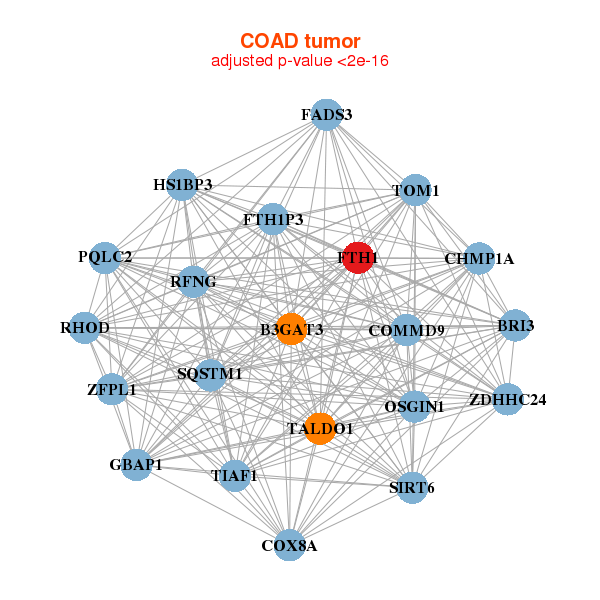
| B3GAT3,BRI3,CHMP1A,COMMD9,COX8A,FADS3,FTH1, FTH1P3,GBAP1,HS1BP3,OSGIN1,PQLC2,RFNG,RHOD, SIRT6,SQSTM1,TALDO1,TIAF1,TOM1,ZDHHC24,ZFPL1 | ACAA1,C1orf106,C2CD2L,CDKN2B,CHMP4B,CTSD,FTH1, FTH1P3,MAST2,PLEKHG6,PNPLA2,PRKCD,SERINC2,SMPDL3A, SPINT1,SPINT2,TICAM1,TNIP1,TRPM6,VILL,ZBTB7B |
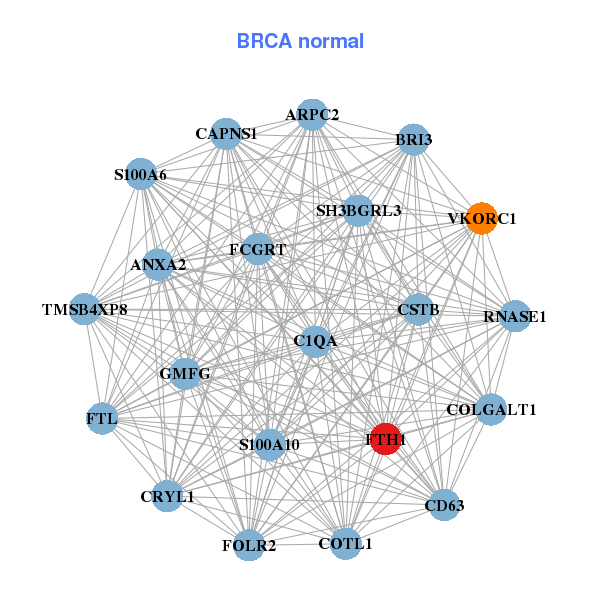
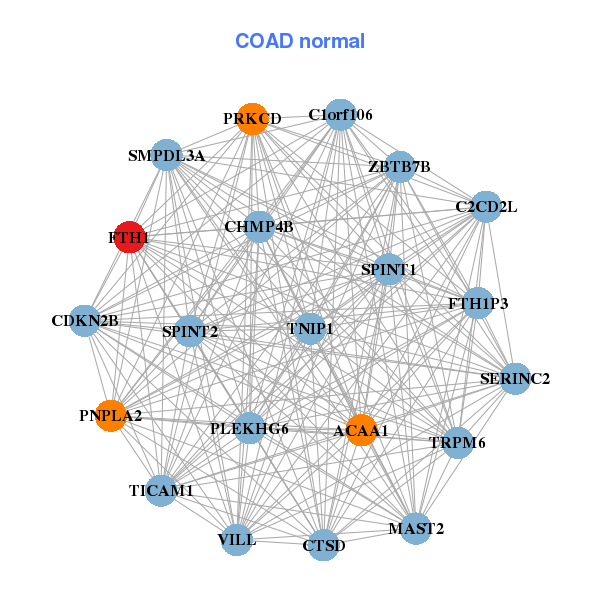
| * Co-Expression network figures were drawn using R package igraph. Only the top 20 genes with the highest correlations were shown. Red circle: input gene, orange circle: cell metabolism gene, sky circle: other gene |
: Open all plots for all cancer types
| Top |
: Open all interacting genes' information including KEGG pathway for all interacting genes from DAVID
| Top |
| Pharmacological Information for FTH1 |
| DB Category | DB Name | DB's ID and Url link |
| * Gene Centered Interaction Network. |
 |
| * Drug Centered Interaction Network. |
| DrugBank ID | Target Name | Drug Groups | Generic Name | Drug Centered Network | Drug Structure |
| DB00563 | ferritin, heavy polypeptide 1 | approved | Methotrexate |  |  |
| Top |
| Cross referenced IDs for FTH1 |
| * We obtained these cross-references from Uniprot database. It covers 150 different DBs, 18 categories. http://www.uniprot.org/help/cross_references_section |
: Open all cross reference information
|
Copyright © 2016-Present - The Univsersity of Texas Health Science Center at Houston @ |