|
||||||||||||||||||||||||||||||||||||||||||||||||||||||||||||||||||||||||||||||||||||||||||||||||||||||||||||||||||||||||||||||||||||||||||||||||||||||||||||||||||||||||||||||||||||||||||||||||||||||||||||||||||||||||||||||||||||||||||||||||||||||||||||||||||||||||||||||||||||||||||||||||||||||||||||||||||||||||||
| |
| Phenotypic Information (metabolism pathway, cancer, disease, phenome) |
| |
| |
| Gene-Gene Network Information: Co-Expression Network, Interacting Genes & KEGG |
| |
|


| Gene Summary for FUT8 |
| Top |
| Phenotypic Information for FUT8(metabolism pathway, cancer, disease, phenome) |
| Cancer | CGAP: FUT8 |
| Familial Cancer Database: FUT8 | |
| * This gene is included in those cancer gene databases. |
|
|
|
|
|
| . | ||||||||||||||||||||||||||||||||||||||||||||||||||||||||||||||||||||||||||||||||||||||||||||||||||||||||||||||||||||||||||||||||||||||||||||||||||||||||||||||||||||||||||||||||||||||||||||||||||||||||||||||||||||||||||||||||||||||||||||||||||||||||||||||||||||||||||||||||||||||||||||||||||||||||||||||||||||
Oncogene 1 | Significant driver gene in | |||||||||||||||||||||||||||||||||||||||||||||||||||||||||||||||||||||||||||||||||||||||||||||||||||||||||||||||||||||||||||||||||||||||||||||||||||||||||||||||||||||||||||||||||||||||||||||||||||||||||||||||||||||||||||||||||||||||||||||||||||||||||||||||||||||||||||||||||||||||||||||||||||||||||||||||||||||||||
| cf) number; DB name 1 Oncogene; http://nar.oxfordjournals.org/content/35/suppl_1/D721.long, 2 Tumor Suppressor gene; https://bioinfo.uth.edu/TSGene/, 3 Cancer Gene Census; http://www.nature.com/nrc/journal/v4/n3/abs/nrc1299.html, 4 CancerGenes; http://nar.oxfordjournals.org/content/35/suppl_1/D721.long, 5 Network of Cancer Gene; http://ncg.kcl.ac.uk/index.php, 1Therapeutic Vulnerabilities in Cancer; http://cbio.mskcc.org/cancergenomics/statius/ |
| REACTOME_METABOLISM_OF_PROTEINS | |
| OMIM | |
| Orphanet | |
| Disease | KEGG Disease: FUT8 |
| MedGen: FUT8 (Human Medical Genetics with Condition) | |
| ClinVar: FUT8 | |
| Phenotype | MGI: FUT8 (International Mouse Phenotyping Consortium) |
| PhenomicDB: FUT8 | |
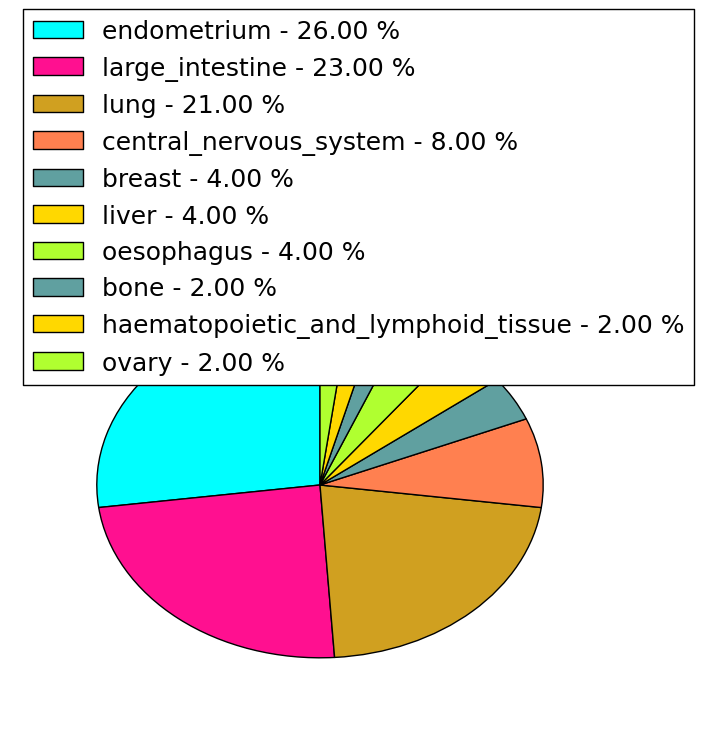
| Mutations for FUT8 |
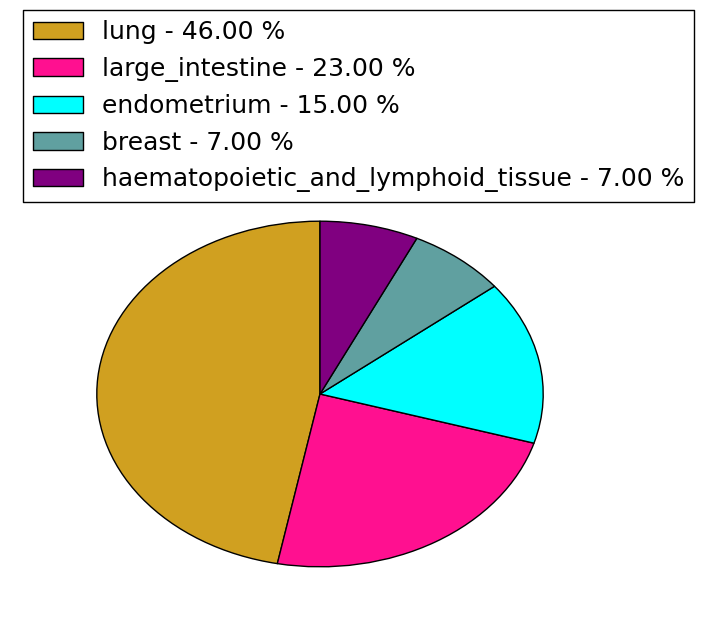
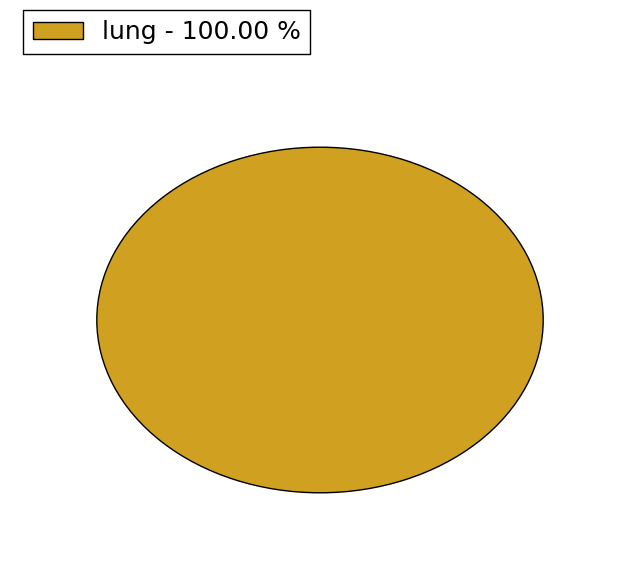
| * Under tables are showing count per each tissue to give us broad intuition about tissue specific mutation patterns.You can go to the detailed page for each mutation database's web site. |
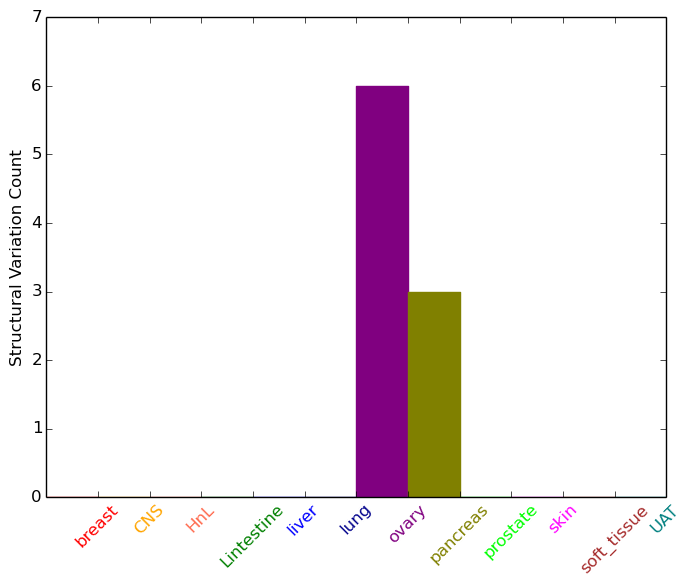
| - Statistics for Tissue and Mutation type | Top |
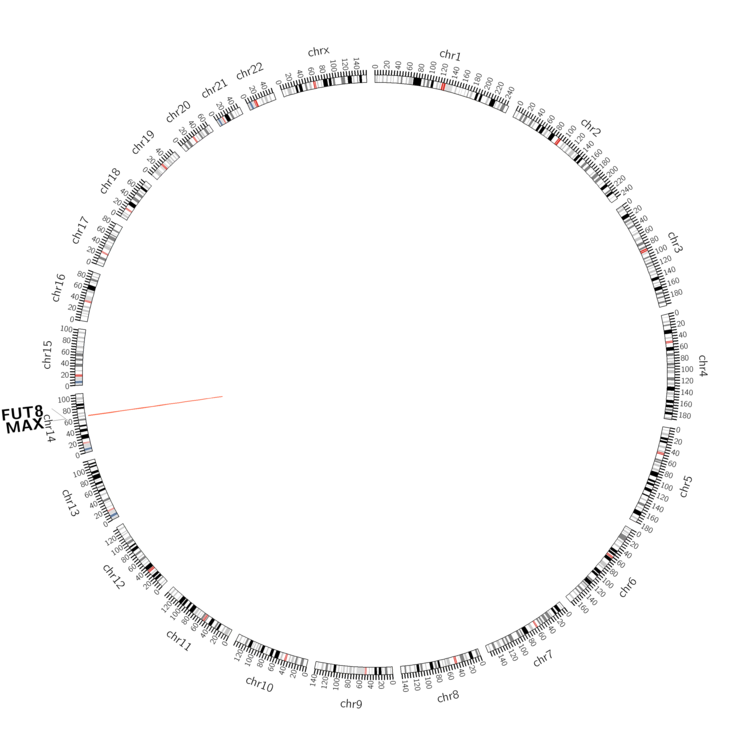 |
| - For Inter-chromosomal Variations |
| There's no inter-chromosomal structural variation. |
| - For Intra-chromosomal Variations |
| * Intra-chromosomal variantions includes 'intrachromosomal amplicon to amplicon', 'intrachromosomal amplicon to non-amplified dna', 'intrachromosomal deletion', 'intrachromosomal fold-back inversion', 'intrachromosomal inversion', 'intrachromosomal tandem duplication', 'Intrachromosomal unknown type', 'intrachromosomal with inverted orientation', 'intrachromosomal with non-inverted orientation'. |
 |
| Sample | Symbol_a | Chr_a | Start_a | End_a | Symbol_b | Chr_b | Start_b | End_b |
| ovary | FUT8 | chr14 | 65880659 | 65880679 | FUT8 | chr14 | 65880891 | 65880911 |
| ovary | FUT8 | chr14 | 65914893 | 65914913 | FUT8 | chr14 | 65997088 | 65997108 |
| ovary | FUT8 | chr14 | 65940360 | 65940380 | FUT8 | chr14 | 65965283 | 65965303 |
| ovary | FUT8 | chr14 | 65940549 | 65940569 | MAX | chr14 | 65490848 | 65490868 |
| ovary | FUT8 | chr14 | 66009894 | 66009914 | FUT8 | chr14 | 66201873 | 66201893 |
| ovary | FUT8 | chr14 | 66210535 | 66210555 | FUT8 | chr14 | 66210654 | 66210674 |
| pancreas | FUT8 | chr14 | 65907546 | 65907566 | MAX | chr14 | 65542325 | 65542345 |
| pancreas | FUT8 | chr14 | 65968239 | 65968259 | FUT8 | chr14 | 65981297 | 65981317 |
| pancreas | FUT8 | chr14 | 66193680 | 66193700 | FUT8 | chr14 | 66155888 | 66155908 |
| cf) Tissue number; Tissue name (1;Breast, 2;Central_nervous_system, 3;Haematopoietic_and_lymphoid_tissue, 4;Large_intestine, 5;Liver, 6;Lung, 7;Ovary, 8;Pancreas, 9;Prostate, 10;Skin, 11;Soft_tissue, 12;Upper_aerodigestive_tract) |
| * From mRNA Sanger sequences, Chitars2.0 arranged chimeric transcripts. This table shows FUT8 related fusion information. |
| ID | Head Gene | Tail Gene | Accession | Gene_a | qStart_a | qEnd_a | Chromosome_a | tStart_a | tEnd_a | Gene_a | qStart_a | qEnd_a | Chromosome_a | tStart_a | tEnd_a |
| AW361302 | IFRD1 | 1 | 312 | 7 | 112112877 | 112115756 | FUT8 | 298 | 656 | 14 | 66166618 | 66166979 | |
| BF996799 | FUT8 | 33 | 302 | 14 | 66209024 | 66209298 | IFT52 | 295 | 348 | 20 | 42232476 | 42232529 | |
| Top |
| Mutation type/ Tissue ID | brca | cns | cerv | endome | haematopo | kidn | Lintest | liver | lung | ns | ovary | pancre | prost | skin | stoma | thyro | urina | |||
| Total # sample | 1 | 1 | 1 | |||||||||||||||||
| GAIN (# sample) | 1 | 1 | 1 | |||||||||||||||||
| LOSS (# sample) |
| cf) Tissue ID; Tissue type (1; Breast, 2; Central_nervous_system, 3; Cervix, 4; Endometrium, 5; Haematopoietic_and_lymphoid_tissue, 6; Kidney, 7; Large_intestine, 8; Liver, 9; Lung, 10; NS, 11; Ovary, 12; Pancreas, 13; Prostate, 14; Skin, 15; Stomach, 16; Thyroid, 17; Urinary_tract) |
| Top |
|
 |
| Top |
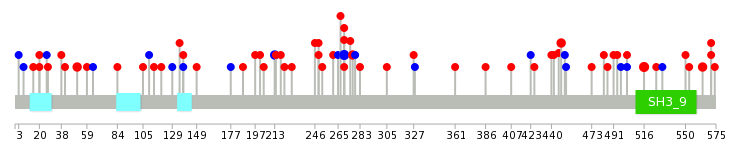
| Stat. for Non-Synonymous SNVs (# total SNVs=46) | (# total SNVs=13) |
 |  |
(# total SNVs=1) | (# total SNVs=0) |
 |
| Top |
| * When you move the cursor on each content, you can see more deailed mutation information on the Tooltip. Those are primary_site,primary_histology,mutation(aa),pubmedID. |
| GRCh37 position | Mutation(aa) | Unique sampleID count |
| chr14:66209075-66209075 | p.R559* | 4 |
| chr14:66208947-66208947 | p.R516Q | 3 |
| chr14:66136173-66136173 | p.S270S | 3 |
| chr14:66208906-66208906 | p.Q502H | 2 |
| chr14:66200031-66200031 | p.R448C | 2 |
| chr14:66136002-66136002 | p.N213N | 2 |
| chr14:66028372-66028372 | p.R31* | 2 |
| chr14:66136172-66136172 | p.S270F | 2 |
| chr14:66028432-66028432 | p.E51Q | 2 |
| chr14:66083023-66083023 | p.K138N | 2 |
| Top |
|
 |
| Point Mutation/ Tissue ID | 1 | 2 | 3 | 4 | 5 | 6 | 7 | 8 | 9 | 10 | 11 | 12 | 13 | 14 | 15 | 16 | 17 | 18 | 19 | 20 |
| # sample | 3 | 8 | 1 | 1 | 7 | 5 | 1 | 1 | 11 | 5 | 10 | |||||||||
| # mutation | 3 | 6 | 1 | 1 | 7 | 6 | 1 | 1 | 11 | 5 | 10 | |||||||||
| nonsynonymous SNV | 3 | 5 | 1 | 1 | 5 | 2 | 1 | 7 | 4 | 9 | ||||||||||
| synonymous SNV | 1 | 2 | 4 | 1 | 4 | 1 | 2 |
| cf) Tissue ID; Tissue type (1; BLCA[Bladder Urothelial Carcinoma], 2; BRCA[Breast invasive carcinoma], 3; CESC[Cervical squamous cell carcinoma and endocervical adenocarcinoma], 4; COAD[Colon adenocarcinoma], 5; GBM[Glioblastoma multiforme], 6; Glioma Low Grade, 7; HNSC[Head and Neck squamous cell carcinoma], 8; KICH[Kidney Chromophobe], 9; KIRC[Kidney renal clear cell carcinoma], 10; KIRP[Kidney renal papillary cell carcinoma], 11; LAML[Acute Myeloid Leukemia], 12; LUAD[Lung adenocarcinoma], 13; LUSC[Lung squamous cell carcinoma], 14; OV[Ovarian serous cystadenocarcinoma ], 15; PAAD[Pancreatic adenocarcinoma], 16; PRAD[Prostate adenocarcinoma], 17; SKCM[Skin Cutaneous Melanoma], 18:STAD[Stomach adenocarcinoma], 19:THCA[Thyroid carcinoma], 20:UCEC[Uterine Corpus Endometrial Carcinoma]) |
| Top |
| * We represented just top 10 SNVs. When you move the cursor on each content, you can see more deailed mutation information on the Tooltip. Those are primary_site, primary_histology, mutation(aa), pubmedID. |
| Genomic Position | Mutation(aa) | Unique sampleID count |
| chr14:66136173 | p.S107S,FUT8 | 3 |
| chr14:66083023 | p.T89A,FUT8 | 2 |
| chr14:66136117 | p.S107Y,FUT8 | 2 |
| chr14:66136172 | p.R353Q,FUT8 | 2 |
| chr14:66208947 | p.K138K,FUT8 | 2 |
| chr14:66208977 | p.Y393H,FUT8 | 1 |
| chr14:66028381 | p.P3P,FUT8 | 1 |
| chr14:66200014 | p.L4L,FUT8 | 1 |
| chr14:66208993 | p.G191C,FUT8 | 1 |
| chr14:66083055 | p.T401M,FUT8 | 1 |
| * Copy number data were extracted from TCGA using R package TCGA-Assembler. The URLs of all public data files on TCGA DCC data server were gathered on Jan-05-2015. Function ProcessCNAData in TCGA-Assembler package was used to obtain gene-level copy number value which is calculated as the average copy number of the genomic region of a gene. |
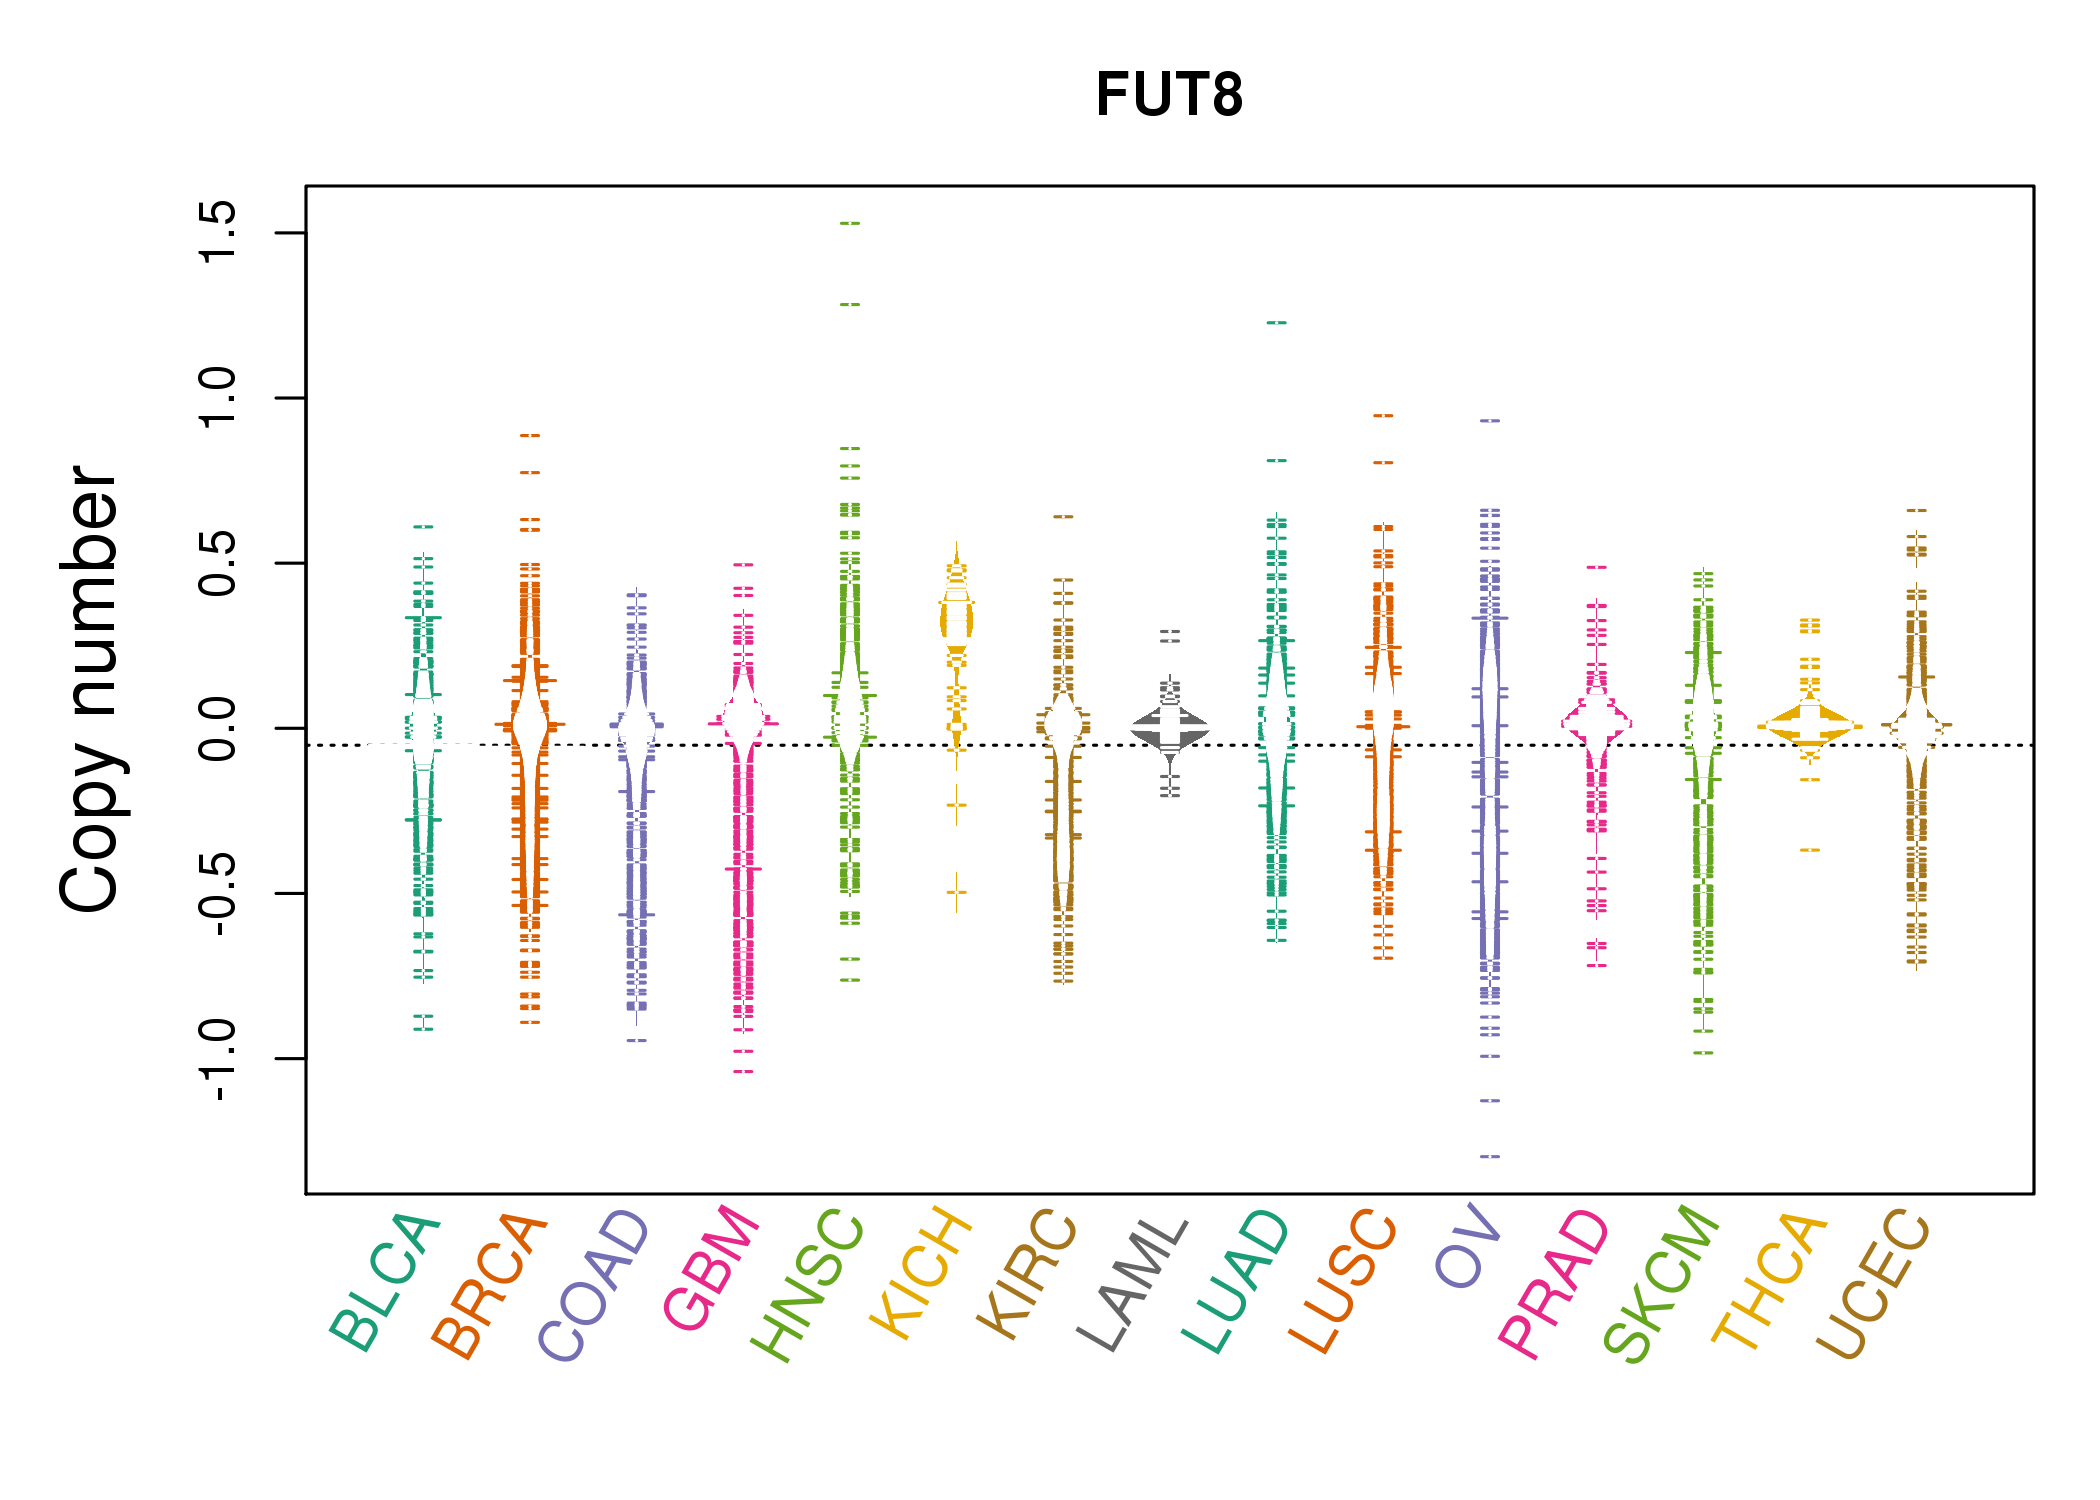 |
| cf) Tissue ID[Tissue type]: BLCA[Bladder Urothelial Carcinoma], BRCA[Breast invasive carcinoma], CESC[Cervical squamous cell carcinoma and endocervical adenocarcinoma], COAD[Colon adenocarcinoma], GBM[Glioblastoma multiforme], Glioma Low Grade, HNSC[Head and Neck squamous cell carcinoma], KICH[Kidney Chromophobe], KIRC[Kidney renal clear cell carcinoma], KIRP[Kidney renal papillary cell carcinoma], LAML[Acute Myeloid Leukemia], LUAD[Lung adenocarcinoma], LUSC[Lung squamous cell carcinoma], OV[Ovarian serous cystadenocarcinoma ], PAAD[Pancreatic adenocarcinoma], PRAD[Prostate adenocarcinoma], SKCM[Skin Cutaneous Melanoma], STAD[Stomach adenocarcinoma], THCA[Thyroid carcinoma], UCEC[Uterine Corpus Endometrial Carcinoma] |
| Top |
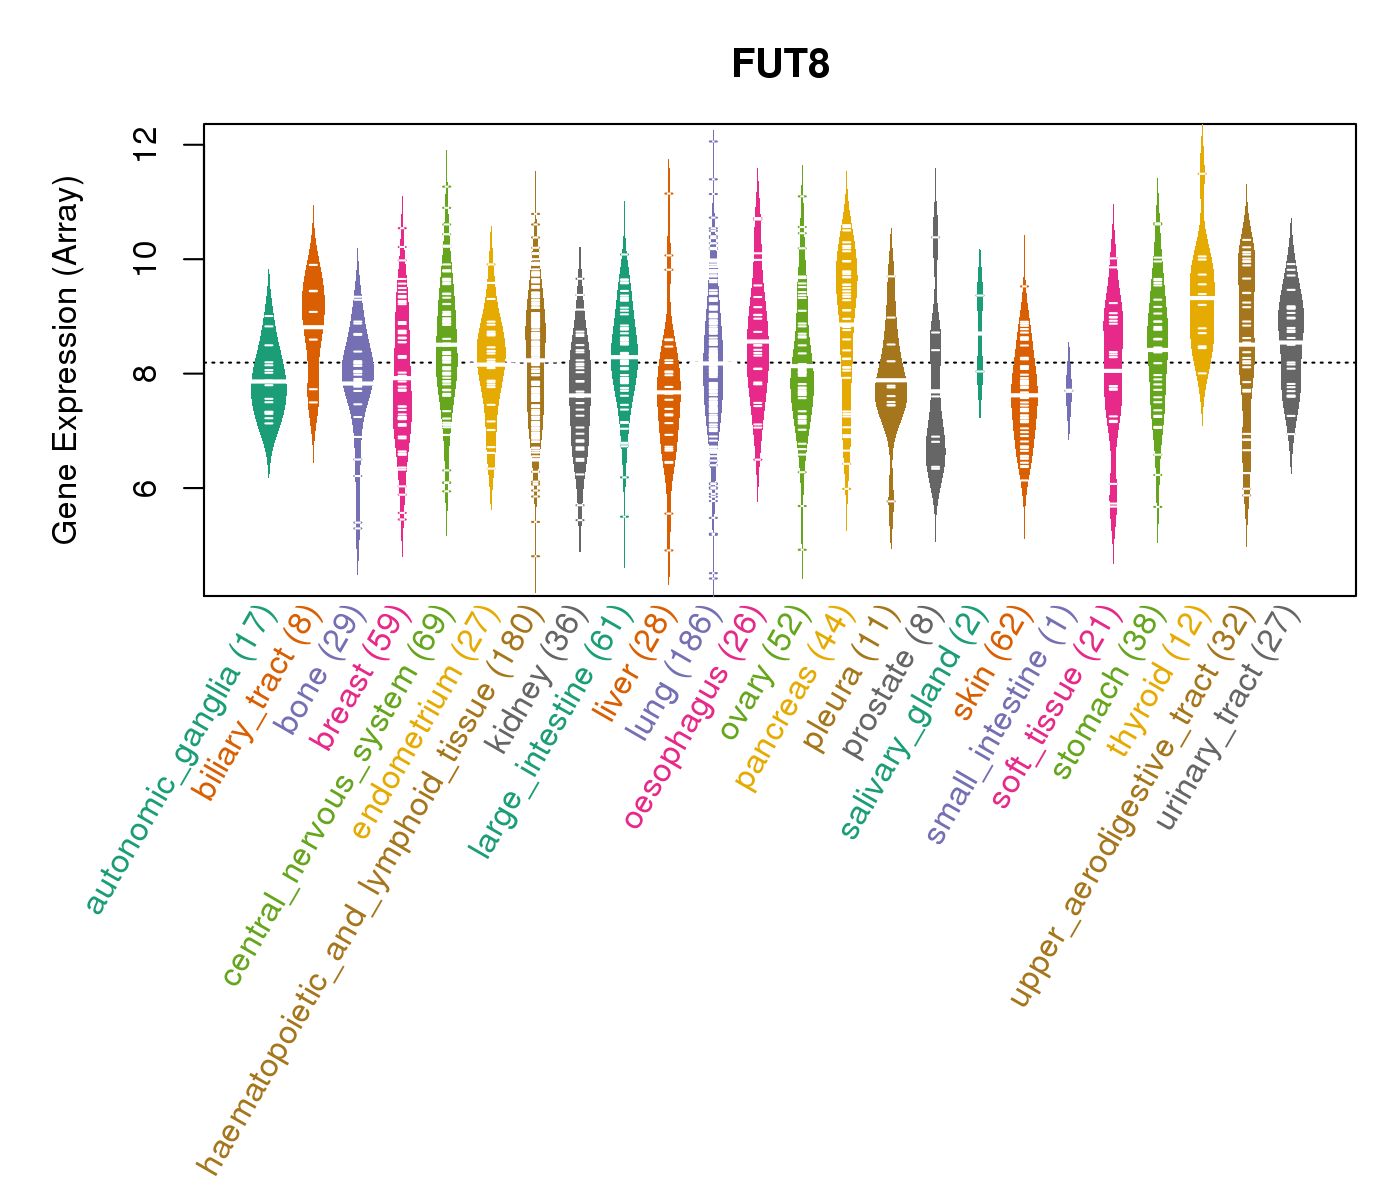
| Gene Expression for FUT8 |
| * CCLE gene expression data were extracted from CCLE_Expression_Entrez_2012-10-18.res: Gene-centric RMA-normalized mRNA expression data. |
 |
| * Normalized gene expression data of RNASeqV2 was extracted from TCGA using R package TCGA-Assembler. The URLs of all public data files on TCGA DCC data server were gathered at Jan-05-2015. Only eight cancer types have enough normal control samples for differential expression analysis. (t test, adjusted p<0.05 (using Benjamini-Hochberg FDR)) |
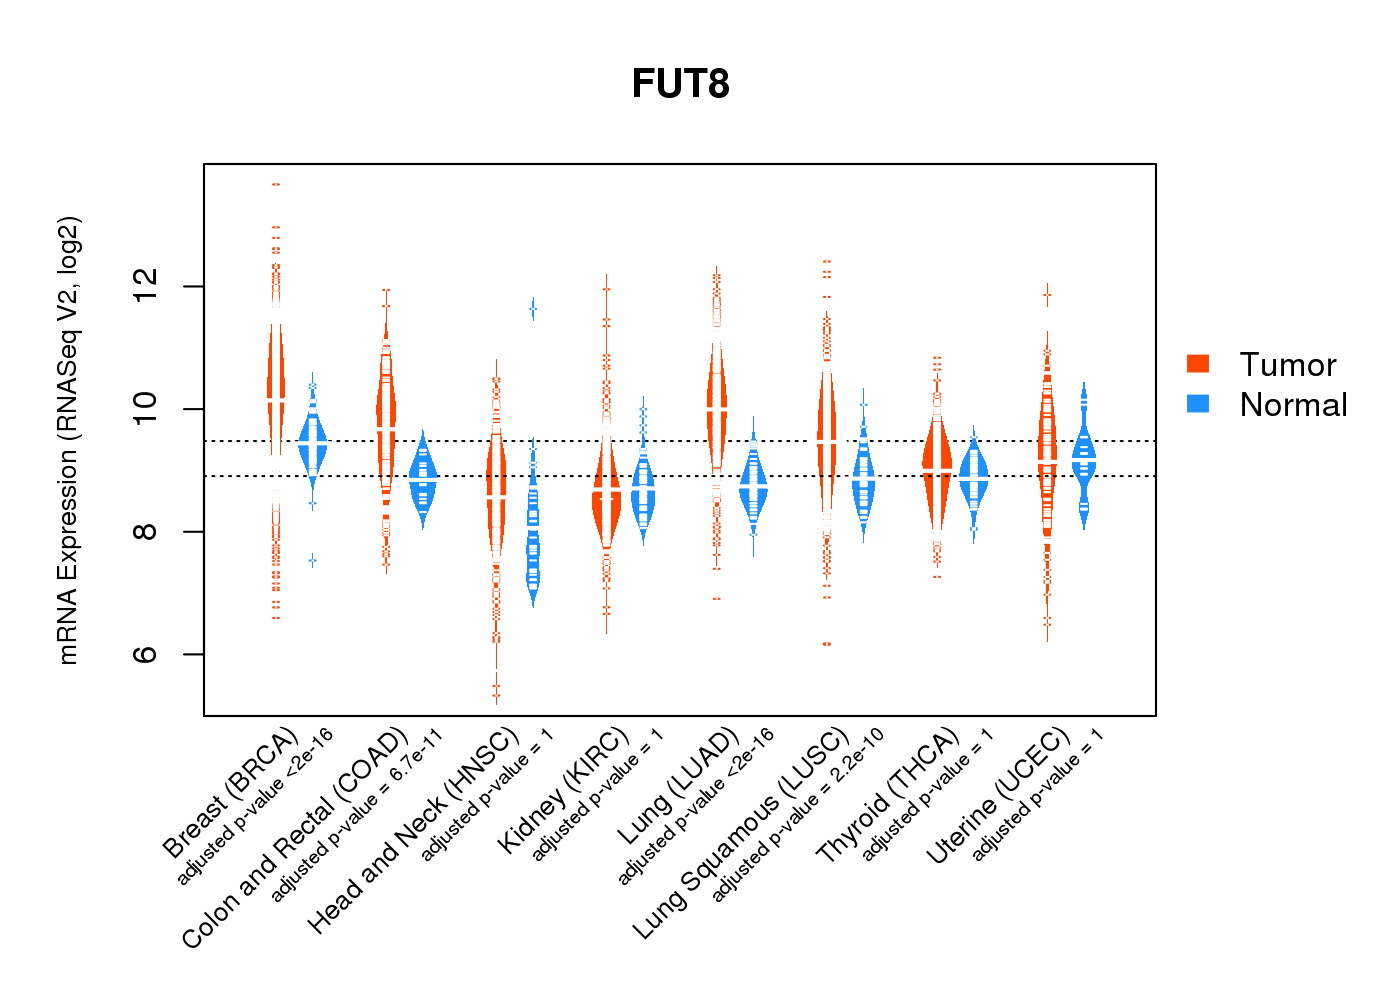 |
| Top |
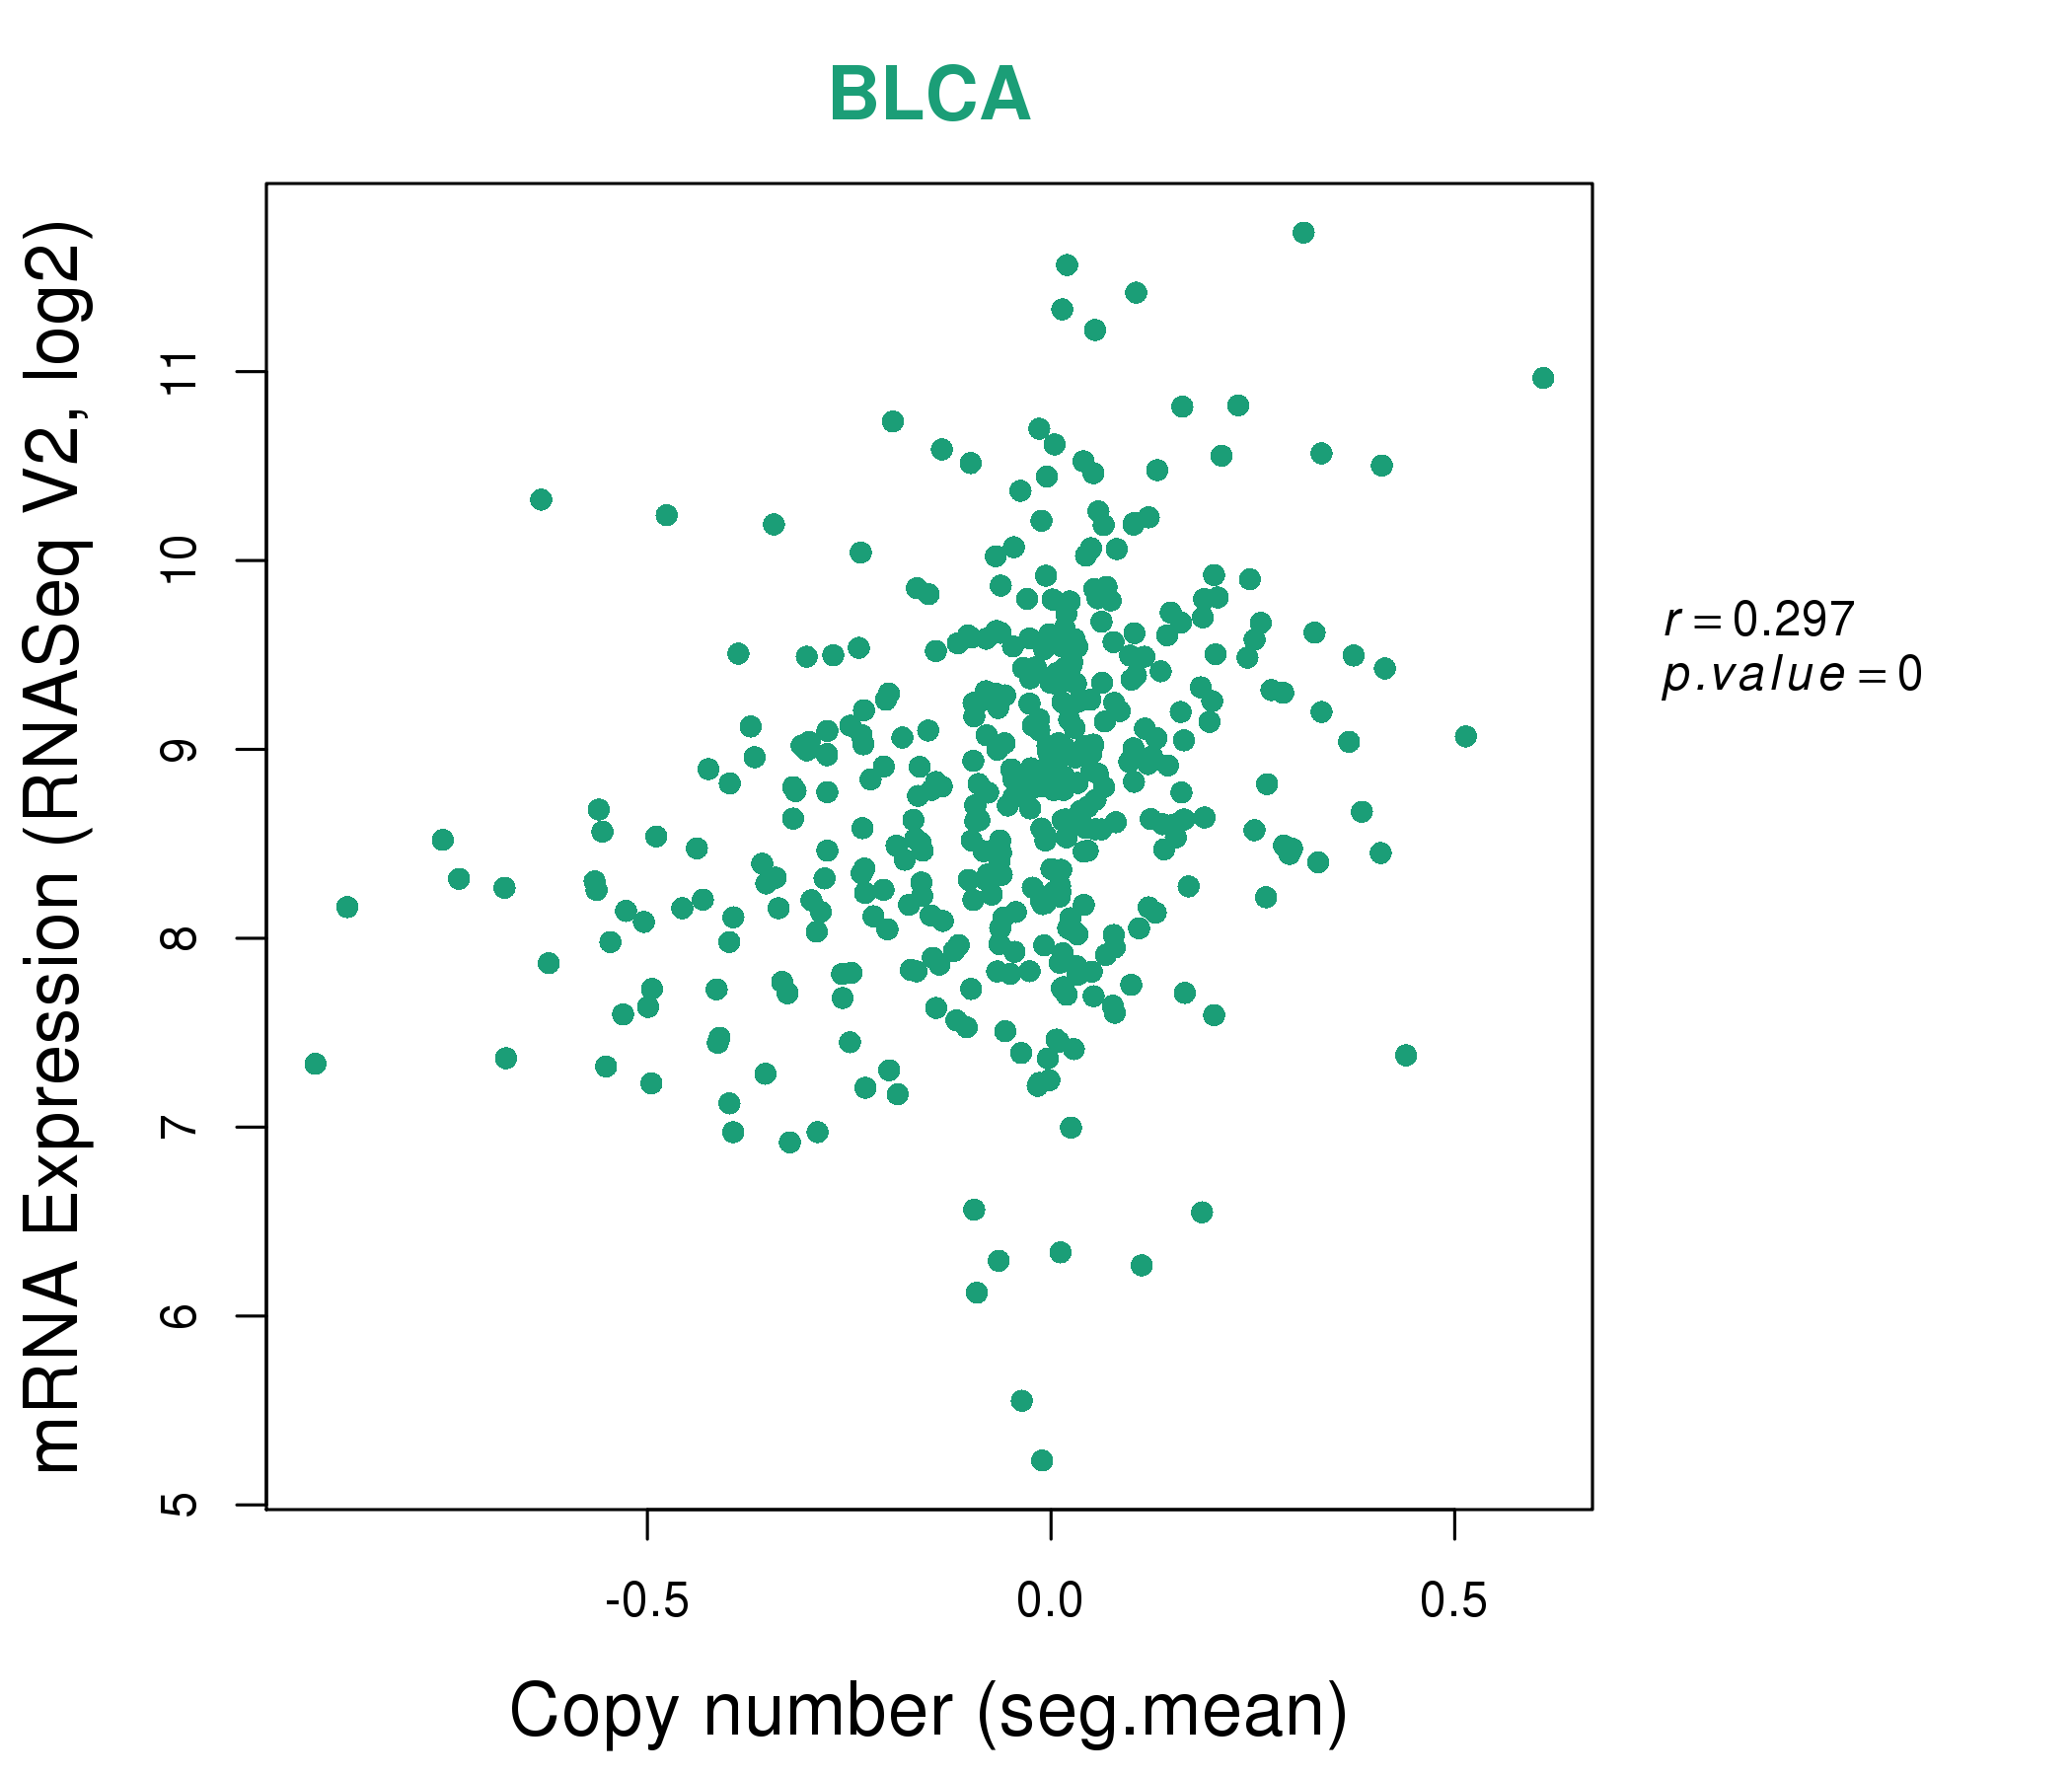
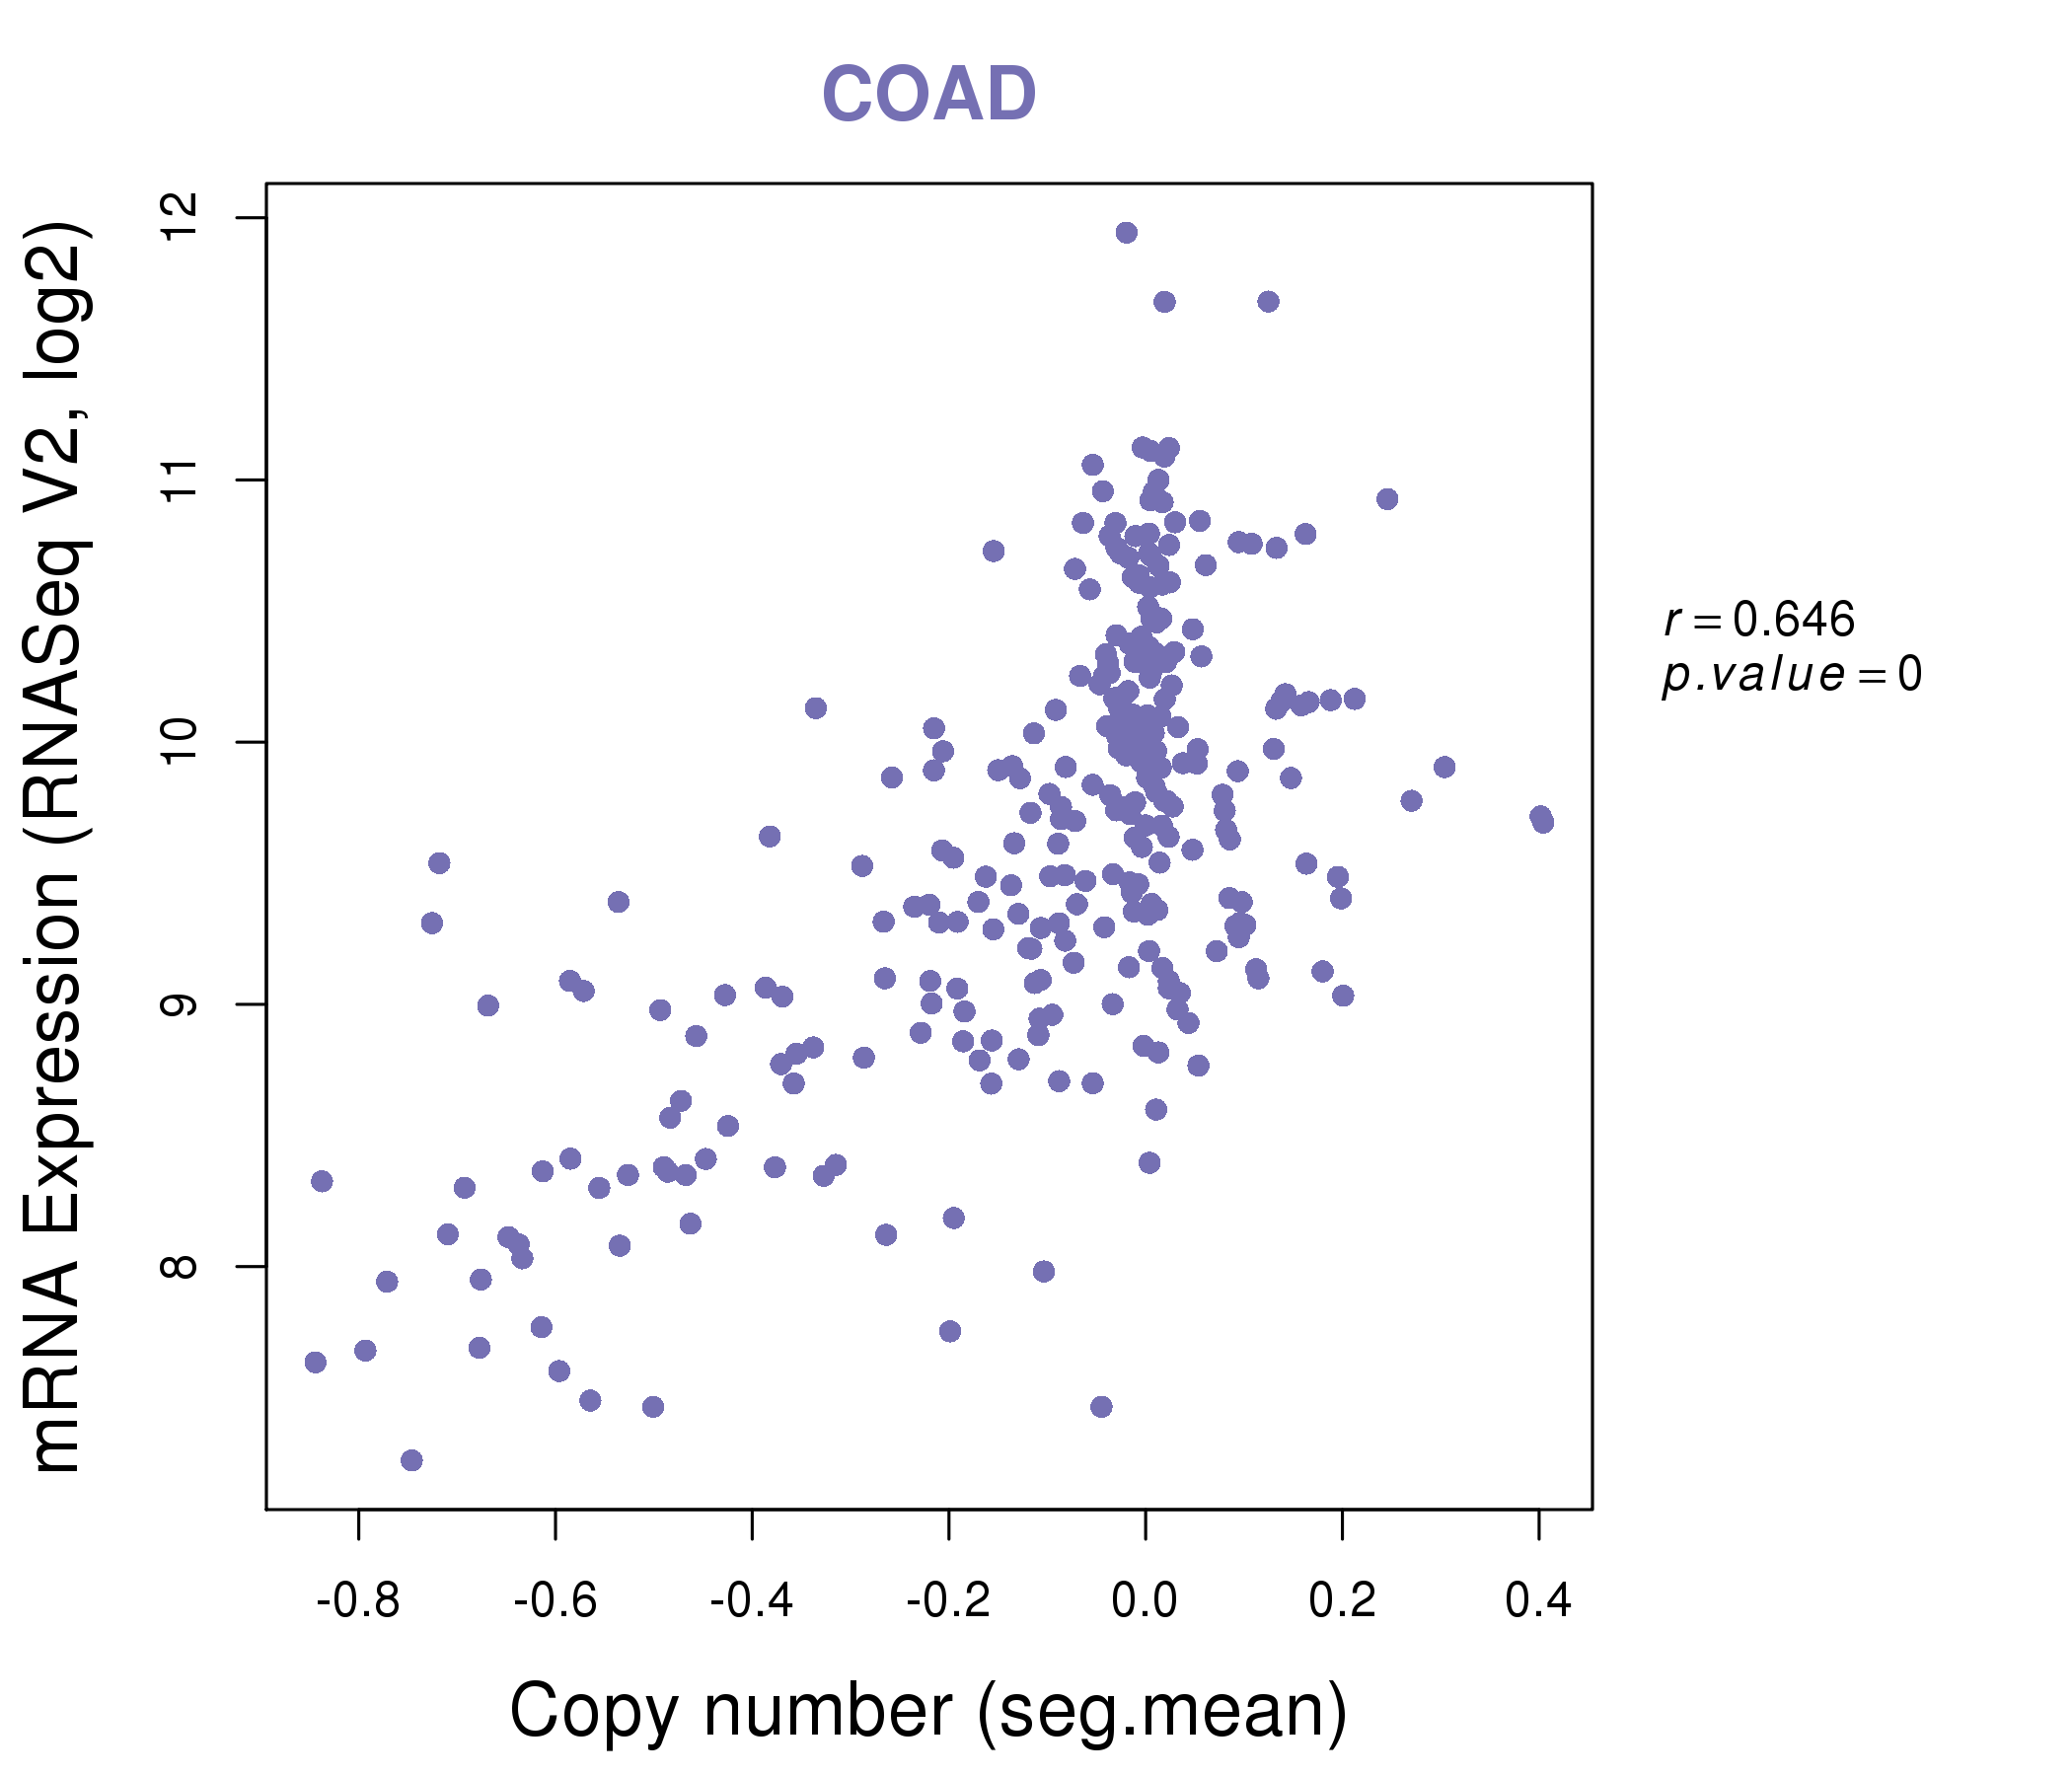
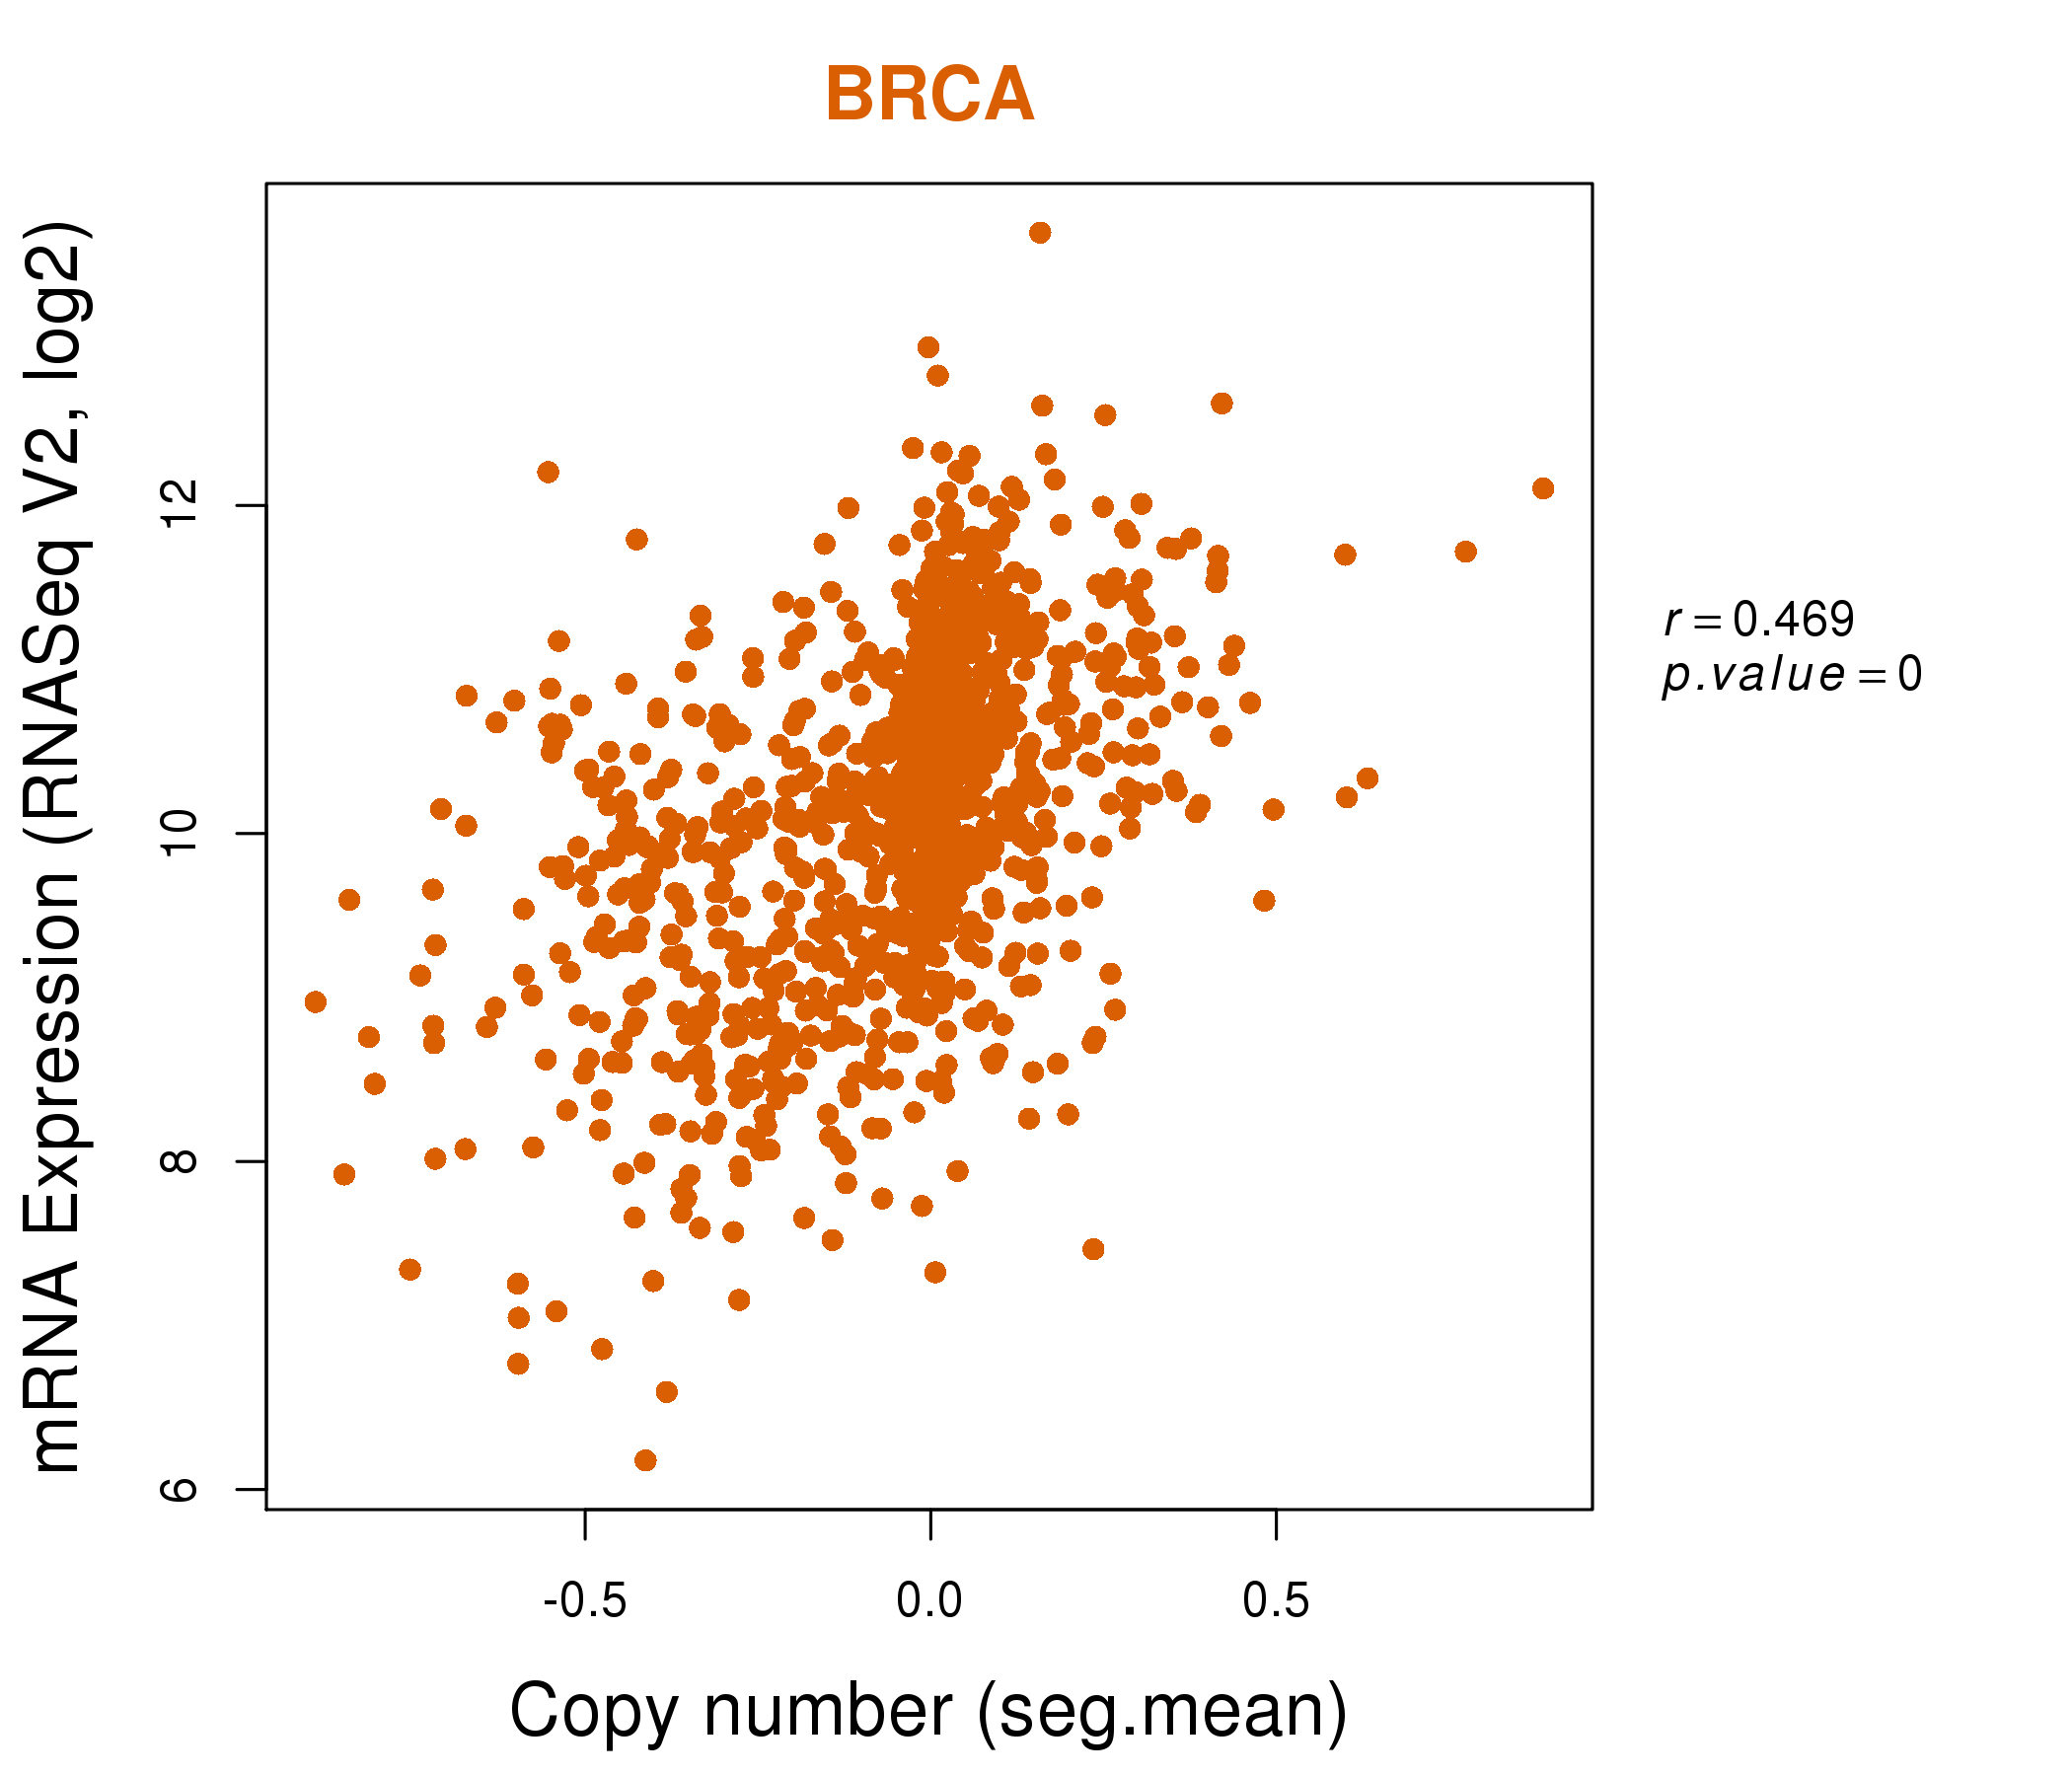
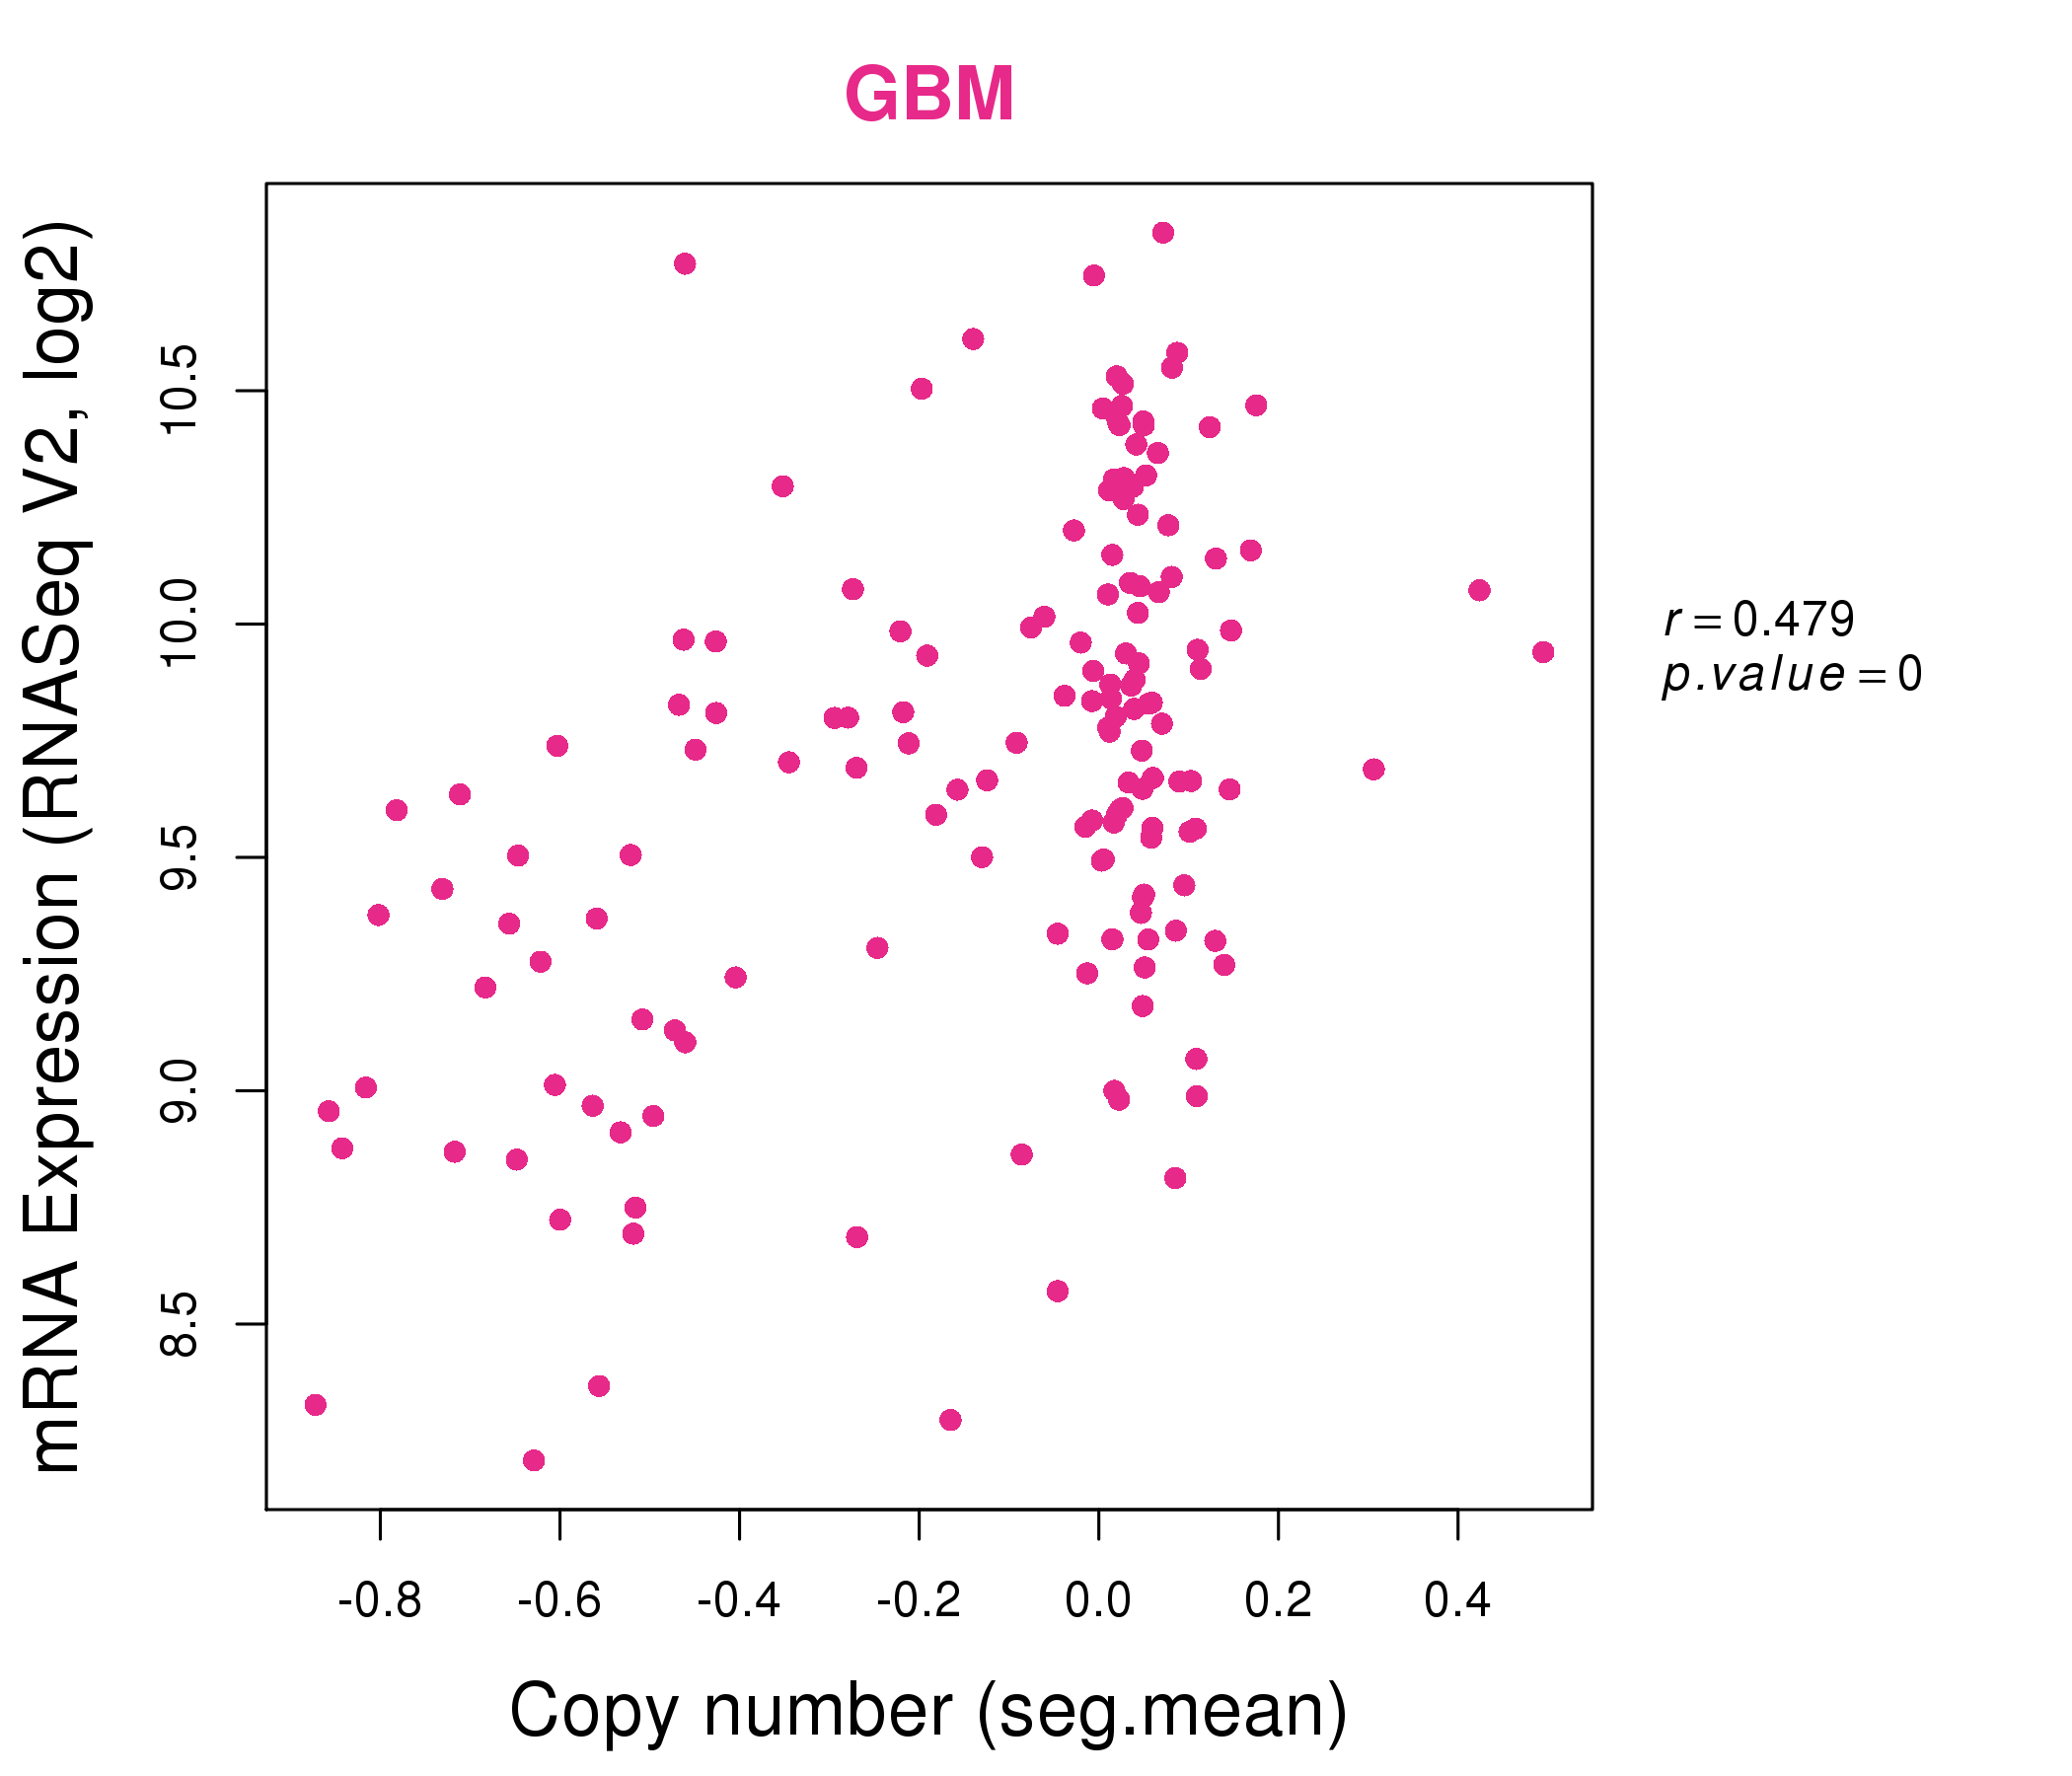
| * This plots show the correlation between CNV and gene expression. |
: Open all plots for all cancer types
 |
|
 |
|
| Top |
| Gene-Gene Network Information |
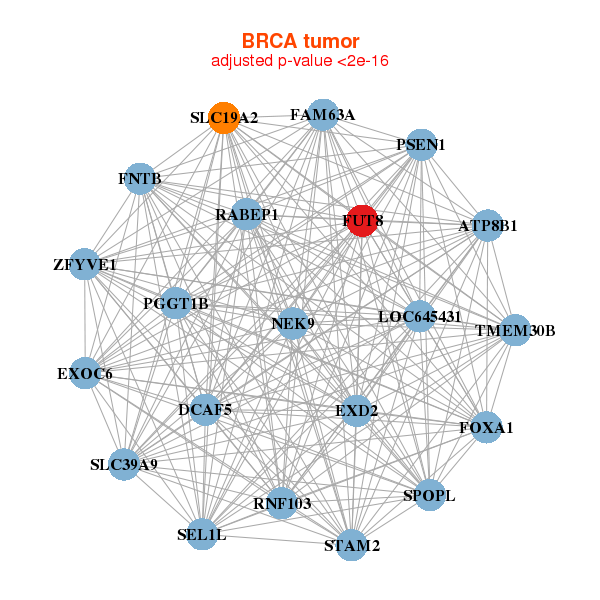
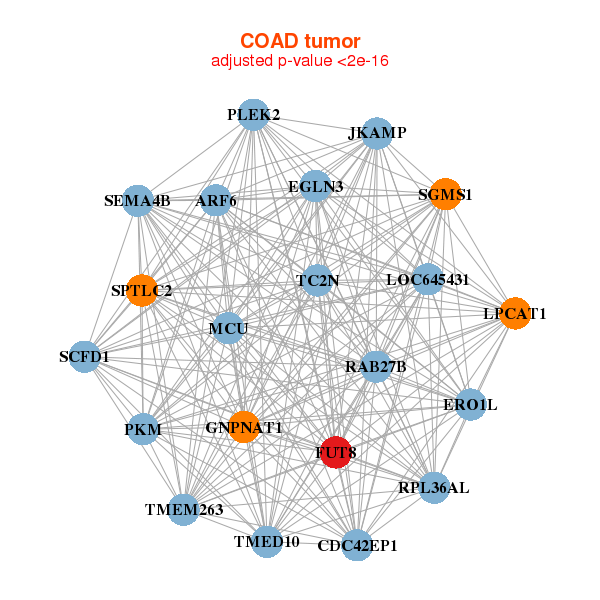
| * Co-Expression network figures were drawn using R package igraph. Only the top 20 genes with the highest correlations were shown. Red circle: input gene, orange circle: cell metabolism gene, sky circle: other gene |
: Open all plots for all cancer types
 |
|
| ATP8B1,DCAF5,EXD2,EXOC6,FAM63A,FNTB,FOXA1, FUT8,LOC645431,NEK9,PGGT1B,PSEN1,RABEP1,RNF103, SEL1L,SLC19A2,SLC39A9,SPOPL,STAM2,TMEM30B,ZFYVE1 | PXYLP1,AFF3,AP2B1,SAMD15,CHST15,COL4A5,DNAJC12, F2RL2,FTO,FUT8,IGSF3,KIAA1211,LRP2,MAGI3, PNMA2,SLC2A10,SYTL2,TANC2,THSD4,TPBG,TSPAN5 |
 |
|
| ARF6,TMEM263,MCU,CDC42EP1,EGLN3,ERO1L,FUT8, GNPNAT1,JKAMP,LOC645431,LPCAT1,PKM,PLEK2,RAB27B, RPL36AL,SCFD1,SEMA4B,SGMS1,SPTLC2,TC2N,TMED10 | ACRBP,AIG1,AKR1A1,ATP6V1B2,BDH2,TMEM256,CRYZ, CTSH,FTL,FUT8,GATM,HACL1,HPS3,LIPA, LPO,MTHFS,PALB2,ECI2,PPAPDC1B,TFEC,TM2D2 |
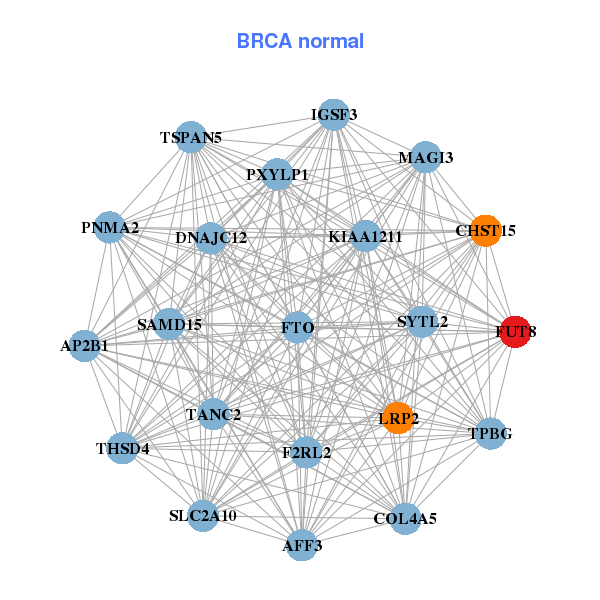
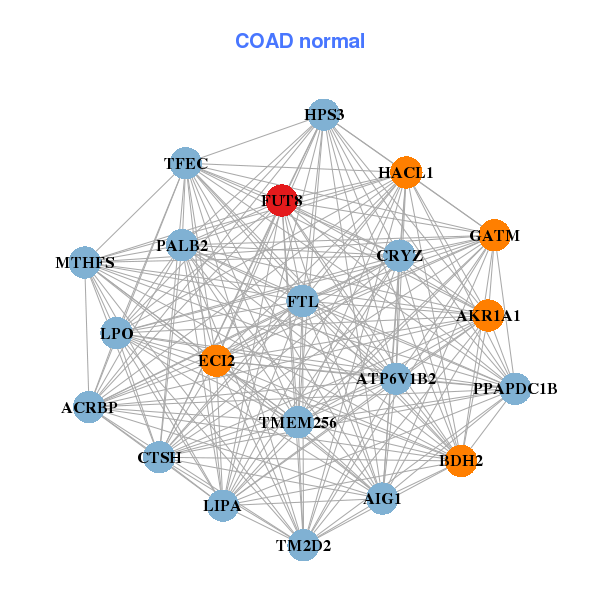
| * Co-Expression network figures were drawn using R package igraph. Only the top 20 genes with the highest correlations were shown. Red circle: input gene, orange circle: cell metabolism gene, sky circle: other gene |
: Open all plots for all cancer types
| Top |
: Open all interacting genes' information including KEGG pathway for all interacting genes from DAVID
| Top |
| Pharmacological Information for FUT8 |
| There's no related Drug. |
| Top |
| Cross referenced IDs for FUT8 |
| * We obtained these cross-references from Uniprot database. It covers 150 different DBs, 18 categories. http://www.uniprot.org/help/cross_references_section |
: Open all cross reference information
|
Copyright © 2016-Present - The Univsersity of Texas Health Science Center at Houston @ |