|
||||||||||||||||||||||||||||||||||||||||||||||||||||||||||||||||||||||||||||||||||||||||||||||||||||||||||||||||||||||||||||||||||||||||||||||||||||||||||||||||||||||||||||||||||||||||||||||||||||||||||||||||||||||||||||||||||||||||||||||||||||||||||||||||||||||||||||||||||||||||||||||||||||||||||||||||||||||||||
| |
| Phenotypic Information (metabolism pathway, cancer, disease, phenome) |
| |
| |
| Gene-Gene Network Information: Co-Expression Network, Interacting Genes & KEGG |
| |
|


| Gene Summary for KDSR |
| Basic gene info. | Gene symbol | KDSR |
| Gene name | 3-ketodihydrosphingosine reductase | |
| Synonyms | DHSR|FVT1|SDR35C1 | |
| Cytomap | UCSC genome browser: 18q21.3 | |
| Genomic location | chr18 :60994970-61034506 | |
| Type of gene | protein-coding | |
| RefGenes | NM_002035.2, | |
| Ensembl id | ENSG00000119537 | |
| Description | 3-dehydrosphinganine reductaseFVT-1KDS reductasefollicular lymphoma variant translocation 1follicular variant translocation protein 1short chain dehydrogenase/reductase family 35C, member 1 | |
| Modification date | 20141207 | |
| dbXrefs | MIM : 136440 | |
| HGNC : HGNC | ||
| Ensembl : ENSG00000119537 | ||
| HPRD : 00640 | ||
| Vega : OTTHUMG00000132792 | ||
| Protein | UniProt: Q06136 go to UniProt's Cross Reference DB Table | |
| Expression | CleanEX: HS_KDSR | |
| BioGPS: 2531 | ||
| Gene Expression Atlas: ENSG00000119537 | ||
| The Human Protein Atlas: ENSG00000119537 | ||
| Pathway | NCI Pathway Interaction Database: KDSR | |
| KEGG: KDSR | ||
| REACTOME: KDSR | ||
| ConsensusPathDB | ||
| Pathway Commons: KDSR | ||
| Metabolism | MetaCyc: KDSR | |
| HUMANCyc: KDSR | ||
| Regulation | Ensembl's Regulation: ENSG00000119537 | |
| miRBase: chr18 :60,994,970-61,034,506 | ||
| TargetScan: NM_002035 | ||
| cisRED: ENSG00000119537 | ||
| Context | iHOP: KDSR | |
| cancer metabolism search in PubMed: KDSR | ||
| UCL Cancer Institute: KDSR | ||
| Assigned class in ccmGDB | B - This gene belongs to cancer gene. | |
| Top |
| Phenotypic Information for KDSR(metabolism pathway, cancer, disease, phenome) |
| Cancer | CGAP: KDSR |
| Familial Cancer Database: KDSR | |
| * This gene is included in those cancer gene databases. |
|
|
|
|
|
| . | ||||||||||||||||||||||||||||||||||||||||||||||||||||||||||||||||||||||||||||||||||||||||||||||||||||||||||||||||||||||||||||||||||||||||||||||||||||||||||||||||||||||||||||||||||||||||||||||||||||||||||||||||||||||||||||||||||||||||||||||||||||||||||||||||||||||||||||||||||||||||||||||||||||||||||||||||||||
Oncogene 1 | Significant driver gene in | |||||||||||||||||||||||||||||||||||||||||||||||||||||||||||||||||||||||||||||||||||||||||||||||||||||||||||||||||||||||||||||||||||||||||||||||||||||||||||||||||||||||||||||||||||||||||||||||||||||||||||||||||||||||||||||||||||||||||||||||||||||||||||||||||||||||||||||||||||||||||||||||||||||||||||||||||||||||||
| cf) number; DB name 1 Oncogene; http://nar.oxfordjournals.org/content/35/suppl_1/D721.long, 2 Tumor Suppressor gene; https://bioinfo.uth.edu/TSGene/, 3 Cancer Gene Census; http://www.nature.com/nrc/journal/v4/n3/abs/nrc1299.html, 4 CancerGenes; http://nar.oxfordjournals.org/content/35/suppl_1/D721.long, 5 Network of Cancer Gene; http://ncg.kcl.ac.uk/index.php, 1Therapeutic Vulnerabilities in Cancer; http://cbio.mskcc.org/cancergenomics/statius/ |
| KEGG_SPHINGOLIPID_METABOLISM REACTOME_PHOSPHOLIPID_METABOLISM REACTOME_SPHINGOLIPID_METABOLISM REACTOME_METABOLISM_OF_LIPIDS_AND_LIPOPROTEINS | |
| OMIM | 136440; gene. |
| Orphanet | |
| Disease | KEGG Disease: KDSR |
| MedGen: KDSR (Human Medical Genetics with Condition) | |
| ClinVar: KDSR | |
| Phenotype | MGI: KDSR (International Mouse Phenotyping Consortium) |
| PhenomicDB: KDSR | |
| Mutations for KDSR |
| * Under tables are showing count per each tissue to give us broad intuition about tissue specific mutation patterns.You can go to the detailed page for each mutation database's web site. |
| - Statistics for Tissue and Mutation type | Top |
 |
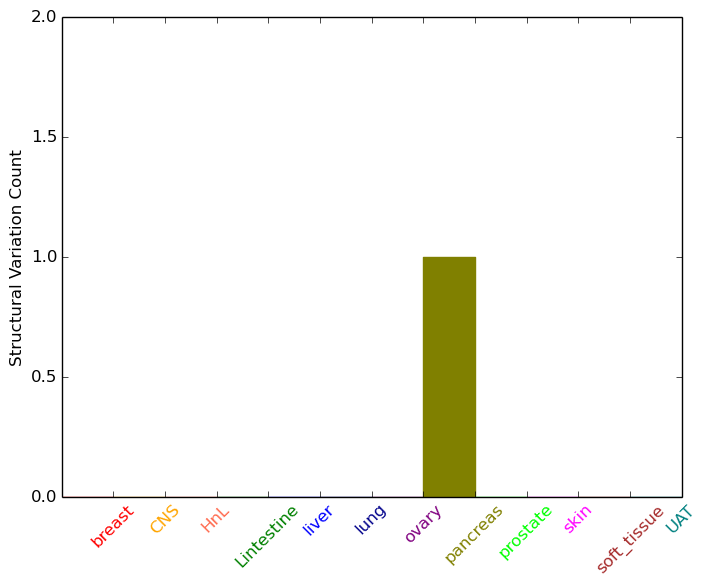
| - For Inter-chromosomal Variations |
| * Inter-chromosomal variantions includes 'interchromosomal amplicon to amplicon', 'interchromosomal amplicon to non-amplified dna', 'interchromosomal insertion', 'Interchromosomal unknown type'. |
 |
| - For Intra-chromosomal Variations |
| * Intra-chromosomal variantions includes 'intrachromosomal amplicon to amplicon', 'intrachromosomal amplicon to non-amplified dna', 'intrachromosomal deletion', 'intrachromosomal fold-back inversion', 'intrachromosomal inversion', 'intrachromosomal tandem duplication', 'Intrachromosomal unknown type', 'intrachromosomal with inverted orientation', 'intrachromosomal with non-inverted orientation'. |
 |
| Sample | Symbol_a | Chr_a | Start_a | End_a | Symbol_b | Chr_b | Start_b | End_b |
| pancreas | KDSR | chr18 | 60998170 | 60998190 | C18orf34 | chr18 | 30824849 | 30824869 |
| cf) Tissue number; Tissue name (1;Breast, 2;Central_nervous_system, 3;Haematopoietic_and_lymphoid_tissue, 4;Large_intestine, 5;Liver, 6;Lung, 7;Ovary, 8;Pancreas, 9;Prostate, 10;Skin, 11;Soft_tissue, 12;Upper_aerodigestive_tract) |
| * From mRNA Sanger sequences, Chitars2.0 arranged chimeric transcripts. This table shows KDSR related fusion information. |
| ID | Head Gene | Tail Gene | Accession | Gene_a | qStart_a | qEnd_a | Chromosome_a | tStart_a | tEnd_a | Gene_a | qStart_a | qEnd_a | Chromosome_a | tStart_a | tEnd_a |
| AA258694 | KDSR | 2 | 69 | 18 | 60996006 | 60996073 | CNN2 | 68 | 325 | 19 | 1038784 | 1039041 | |
| Top |
| Mutation type/ Tissue ID | brca | cns | cerv | endome | haematopo | kidn | Lintest | liver | lung | ns | ovary | pancre | prost | skin | stoma | thyro | urina | |||
| Total # sample | 2 | |||||||||||||||||||
| GAIN (# sample) | ||||||||||||||||||||
| LOSS (# sample) | 2 |
| cf) Tissue ID; Tissue type (1; Breast, 2; Central_nervous_system, 3; Cervix, 4; Endometrium, 5; Haematopoietic_and_lymphoid_tissue, 6; Kidney, 7; Large_intestine, 8; Liver, 9; Lung, 10; NS, 11; Ovary, 12; Pancreas, 13; Prostate, 14; Skin, 15; Stomach, 16; Thyroid, 17; Urinary_tract) |
| Top |
|
 |
| Top |
| Stat. for Non-Synonymous SNVs (# total SNVs=10) | (# total SNVs=4) |
 | 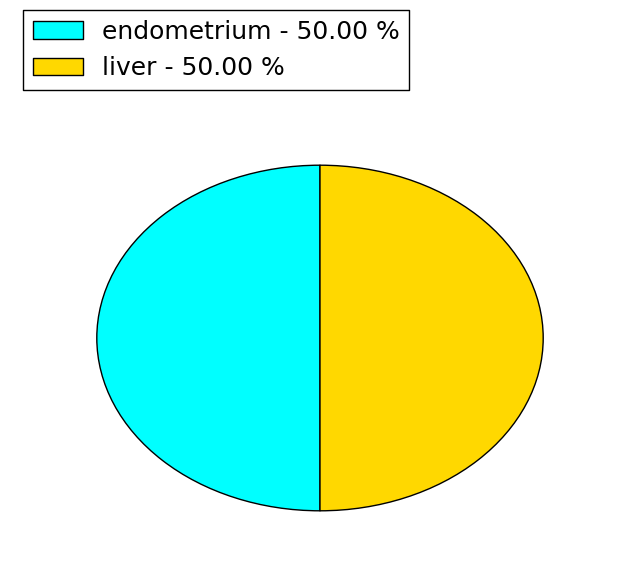 |
(# total SNVs=1) | (# total SNVs=1) |
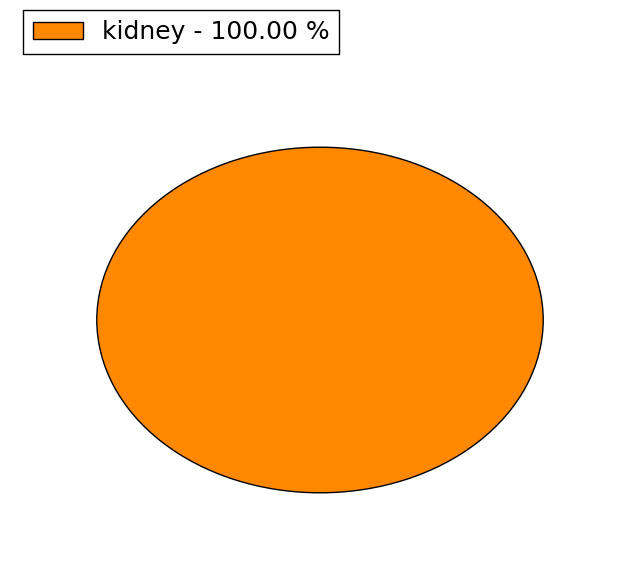 |  |
| Top |
| * When you move the cursor on each content, you can see more deailed mutation information on the Tooltip. Those are primary_site,primary_histology,mutation(aa),pubmedID. |
| GRCh37 position | Mutation(aa) | Unique sampleID count |
| chr18:61022447-61022447 | p.S136T | 2 |
| chr18:61022770-61022770 | p.V94V | 2 |
| chr18:61002551-61002551 | p.M273T | 1 |
| chr18:61022457-61022457 | p.L133I | 1 |
| chr18:61002580-61002580 | p.F263L | 1 |
| chr18:61022495-61022495 | p.N120I | 1 |
| chr18:61006080-61006080 | p.V244L | 1 |
| chr18:61022741-61022741 | p.V104A | 1 |
| chr18:61006117-61006117 | p.? | 1 |
| chr18:61022756-61022756 | p.N99T | 1 |
| Top |
|
 |
| Point Mutation/ Tissue ID | 1 | 2 | 3 | 4 | 5 | 6 | 7 | 8 | 9 | 10 | 11 | 12 | 13 | 14 | 15 | 16 | 17 | 18 | 19 | 20 |
| # sample | 1 | 1 | 1 | 1 | 3 | 2 | 1 | 4 | ||||||||||||
| # mutation | 1 | 1 | 1 | 1 | 3 | 2 | 1 | 5 | ||||||||||||
| nonsynonymous SNV | 1 | 1 | 1 | 2 | 2 | 1 | 3 | |||||||||||||
| synonymous SNV | 1 | 1 | 2 |
| cf) Tissue ID; Tissue type (1; BLCA[Bladder Urothelial Carcinoma], 2; BRCA[Breast invasive carcinoma], 3; CESC[Cervical squamous cell carcinoma and endocervical adenocarcinoma], 4; COAD[Colon adenocarcinoma], 5; GBM[Glioblastoma multiforme], 6; Glioma Low Grade, 7; HNSC[Head and Neck squamous cell carcinoma], 8; KICH[Kidney Chromophobe], 9; KIRC[Kidney renal clear cell carcinoma], 10; KIRP[Kidney renal papillary cell carcinoma], 11; LAML[Acute Myeloid Leukemia], 12; LUAD[Lung adenocarcinoma], 13; LUSC[Lung squamous cell carcinoma], 14; OV[Ovarian serous cystadenocarcinoma ], 15; PAAD[Pancreatic adenocarcinoma], 16; PRAD[Prostate adenocarcinoma], 17; SKCM[Skin Cutaneous Melanoma], 18:STAD[Stomach adenocarcinoma], 19:THCA[Thyroid carcinoma], 20:UCEC[Uterine Corpus Endometrial Carcinoma]) |
| Top |
| * We represented just top 10 SNVs. When you move the cursor on each content, you can see more deailed mutation information on the Tooltip. Those are primary_site, primary_histology, mutation(aa), pubmedID. |
| Genomic Position | Mutation(aa) | Unique sampleID count |
| chr18:61030017 | p.M273T | 1 |
| chr18:61002580 | p.F263L | 1 |
| chr18:61011643 | p.K231N | 1 |
| chr18:61018226 | p.I168I | 1 |
| chr18:61018276 | p.P152S | 1 |
| chr18:61018297 | p.N145Y | 1 |
| chr18:61022445 | p.T137S | 1 |
| chr18:61022457 | p.L133I | 1 |
| chr18:60999039 | p.N120I | 1 |
| chr18:61022495 | p.V104G | 1 |
| * Copy number data were extracted from TCGA using R package TCGA-Assembler. The URLs of all public data files on TCGA DCC data server were gathered on Jan-05-2015. Function ProcessCNAData in TCGA-Assembler package was used to obtain gene-level copy number value which is calculated as the average copy number of the genomic region of a gene. |
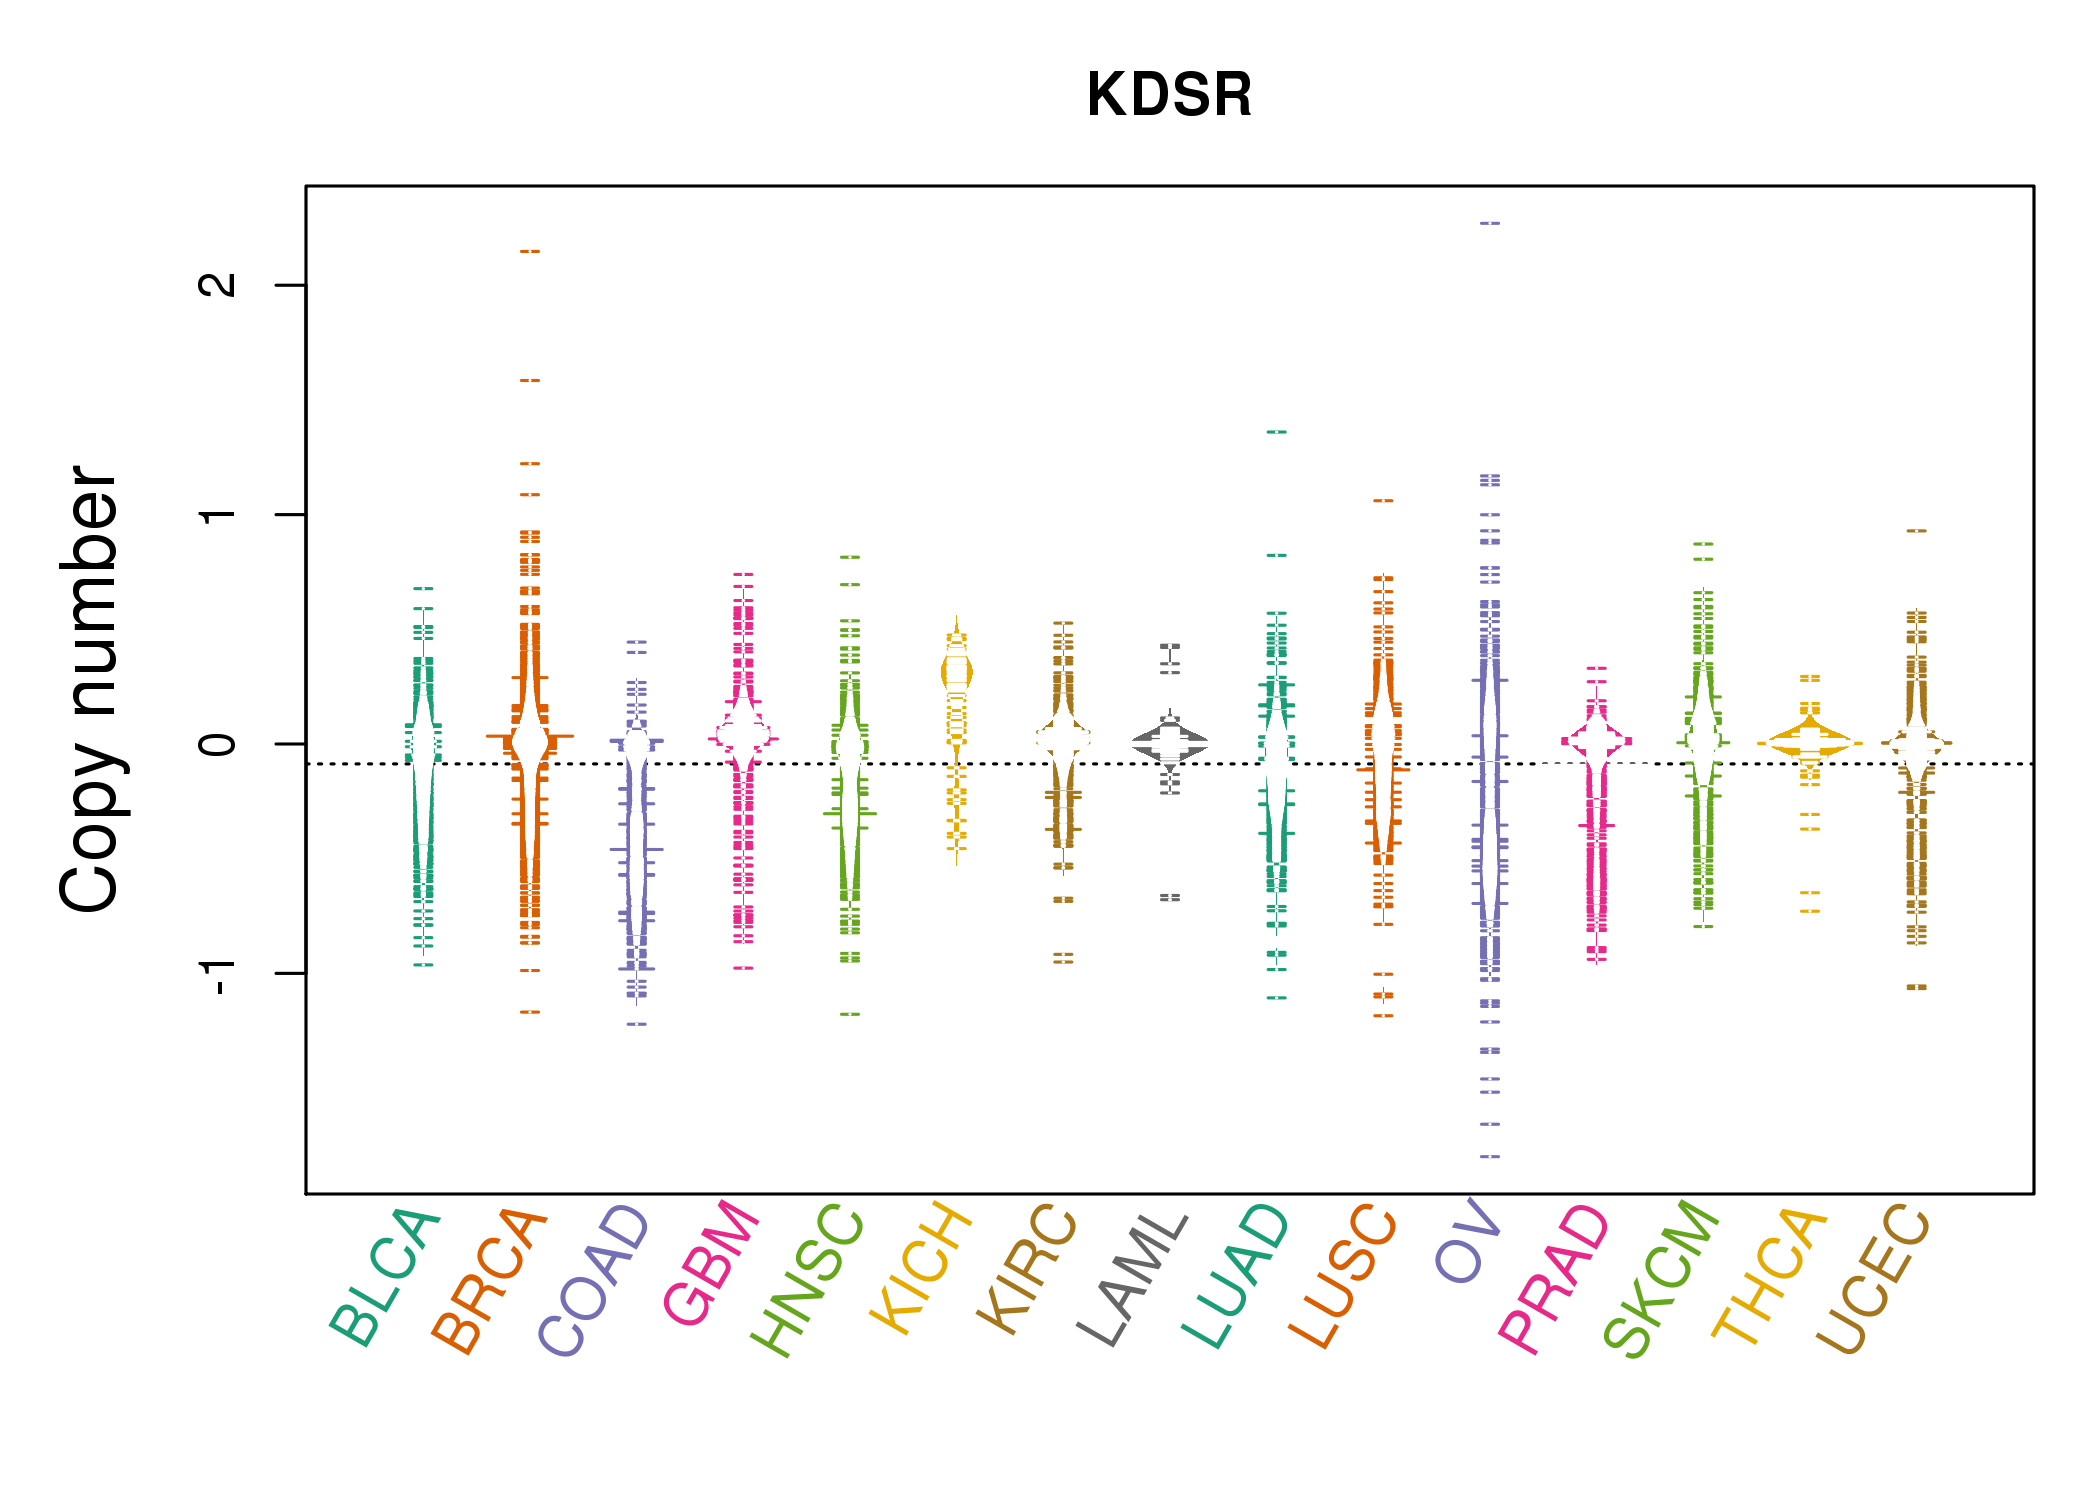 |
| cf) Tissue ID[Tissue type]: BLCA[Bladder Urothelial Carcinoma], BRCA[Breast invasive carcinoma], CESC[Cervical squamous cell carcinoma and endocervical adenocarcinoma], COAD[Colon adenocarcinoma], GBM[Glioblastoma multiforme], Glioma Low Grade, HNSC[Head and Neck squamous cell carcinoma], KICH[Kidney Chromophobe], KIRC[Kidney renal clear cell carcinoma], KIRP[Kidney renal papillary cell carcinoma], LAML[Acute Myeloid Leukemia], LUAD[Lung adenocarcinoma], LUSC[Lung squamous cell carcinoma], OV[Ovarian serous cystadenocarcinoma ], PAAD[Pancreatic adenocarcinoma], PRAD[Prostate adenocarcinoma], SKCM[Skin Cutaneous Melanoma], STAD[Stomach adenocarcinoma], THCA[Thyroid carcinoma], UCEC[Uterine Corpus Endometrial Carcinoma] |
| Top |
| Gene Expression for KDSR |
| * CCLE gene expression data were extracted from CCLE_Expression_Entrez_2012-10-18.res: Gene-centric RMA-normalized mRNA expression data. |
 |
| * Normalized gene expression data of RNASeqV2 was extracted from TCGA using R package TCGA-Assembler. The URLs of all public data files on TCGA DCC data server were gathered at Jan-05-2015. Only eight cancer types have enough normal control samples for differential expression analysis. (t test, adjusted p<0.05 (using Benjamini-Hochberg FDR)) |
 |
| Top |
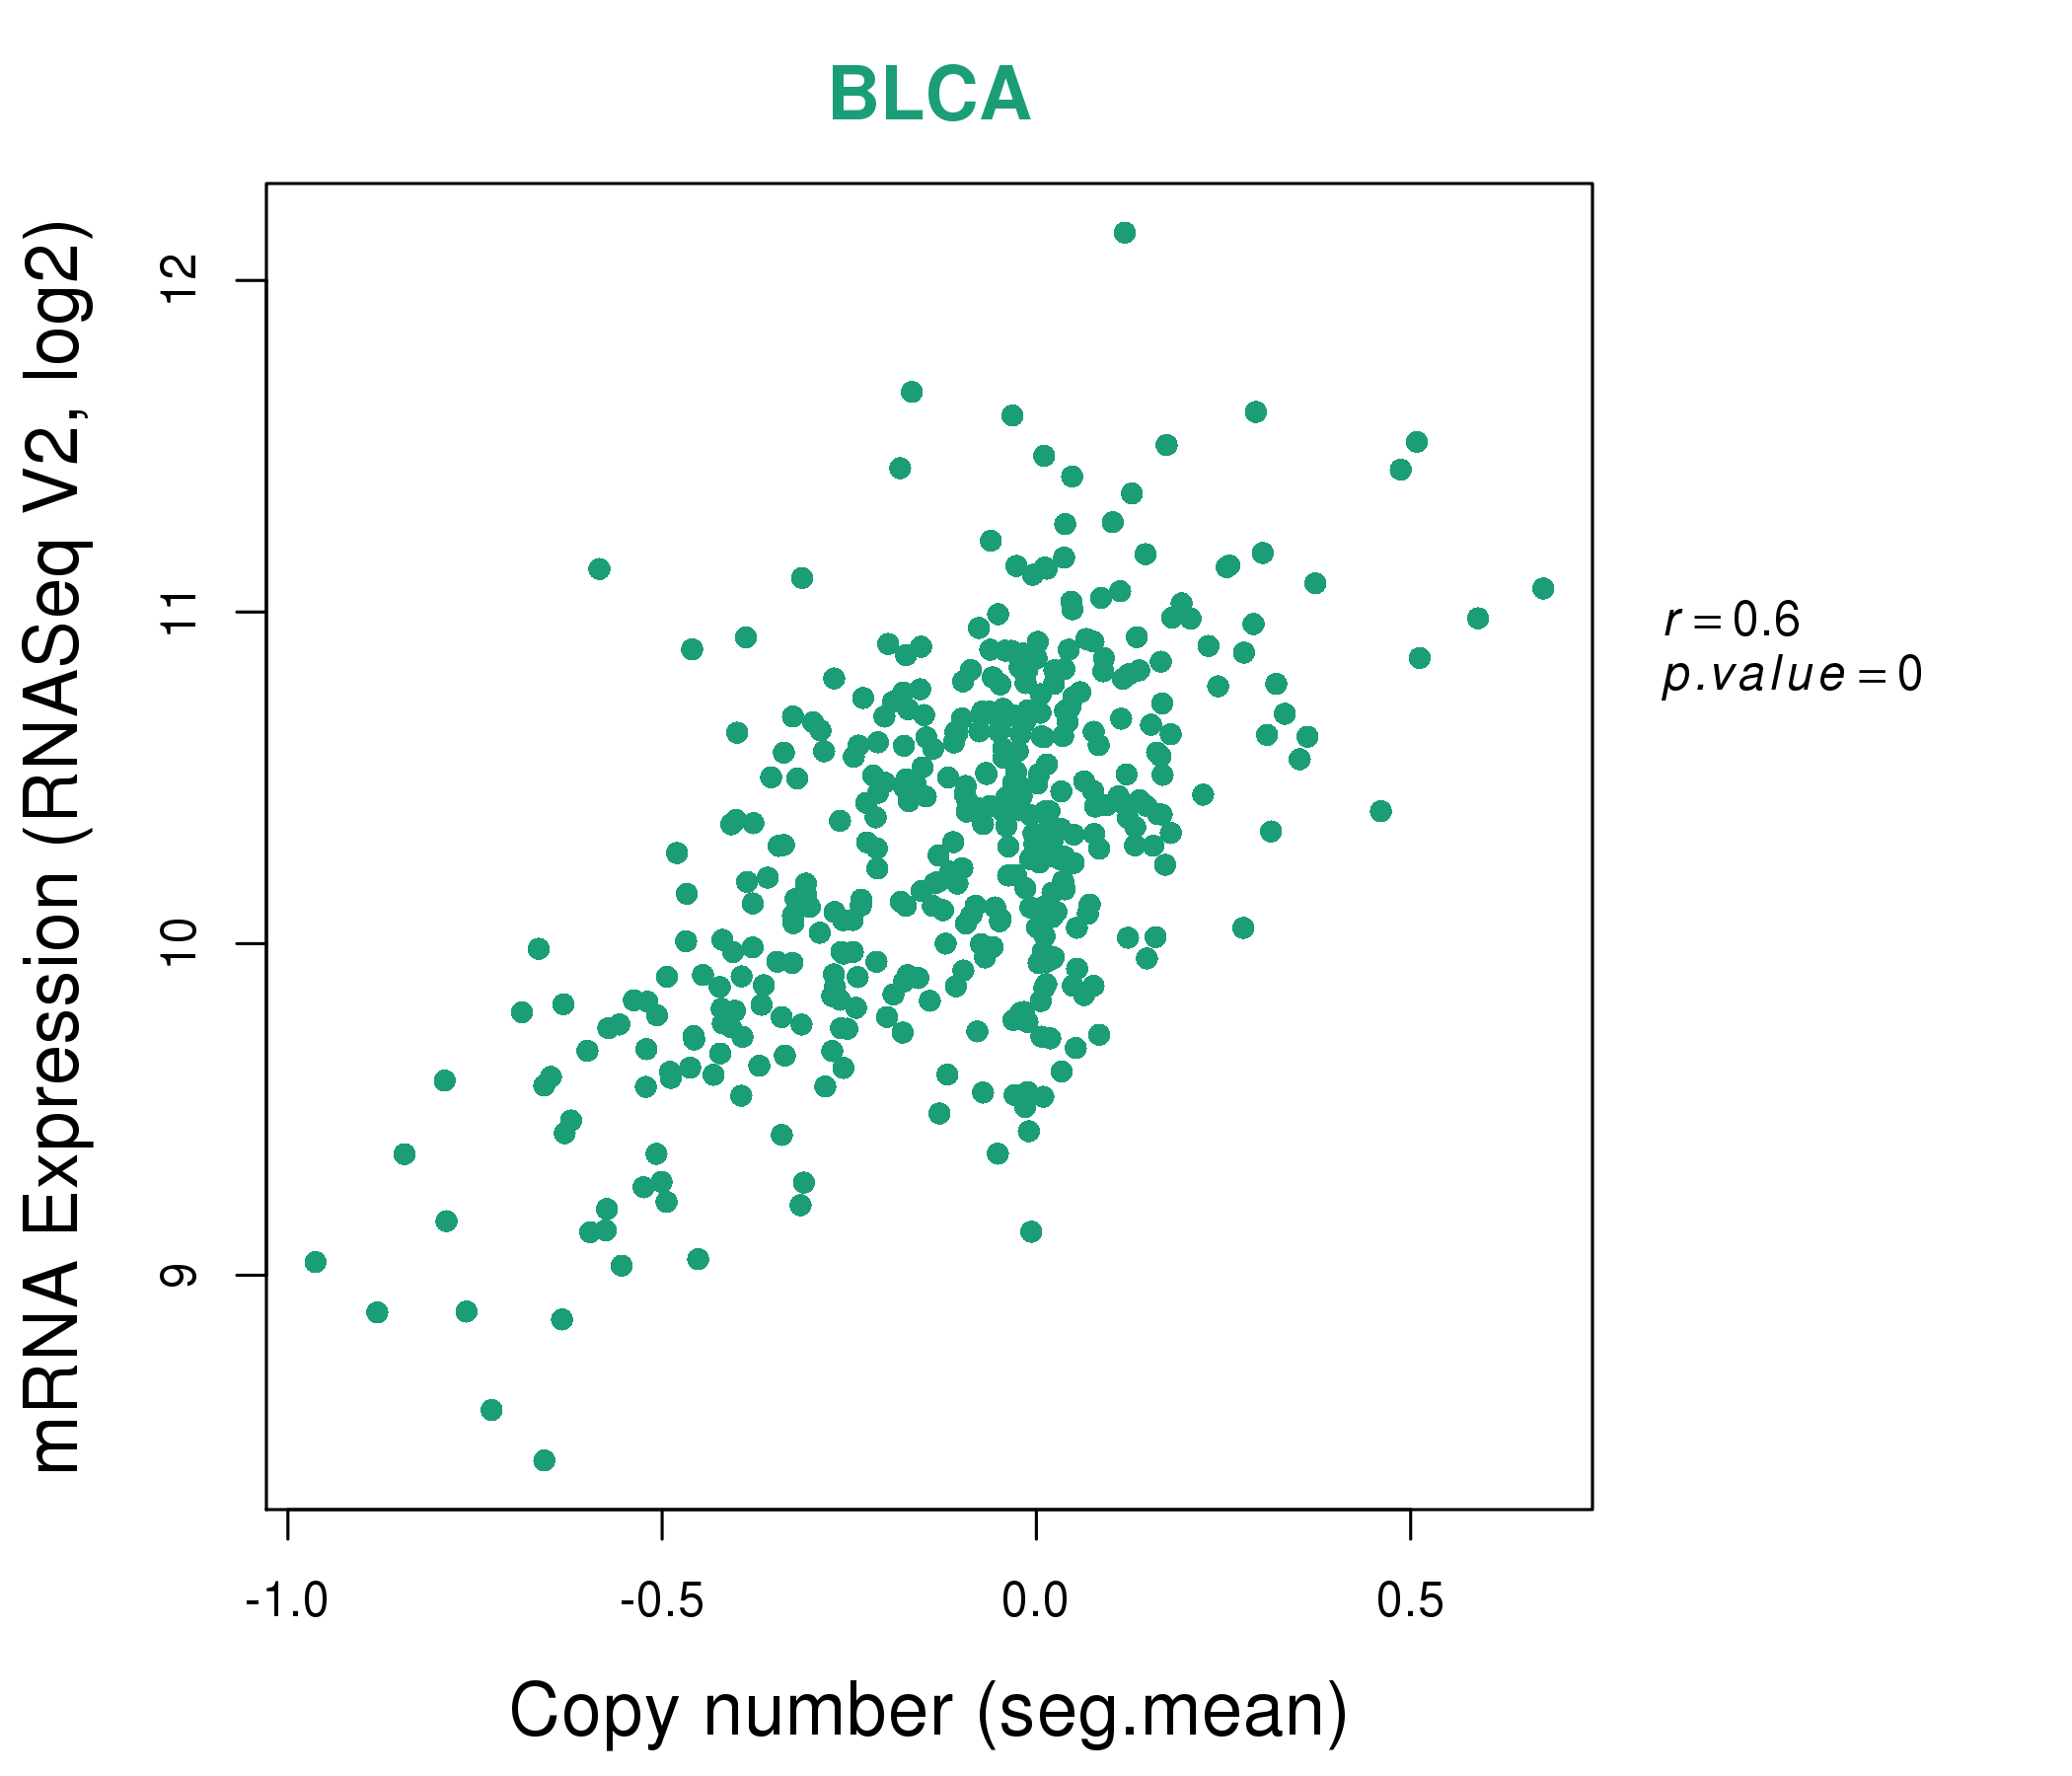
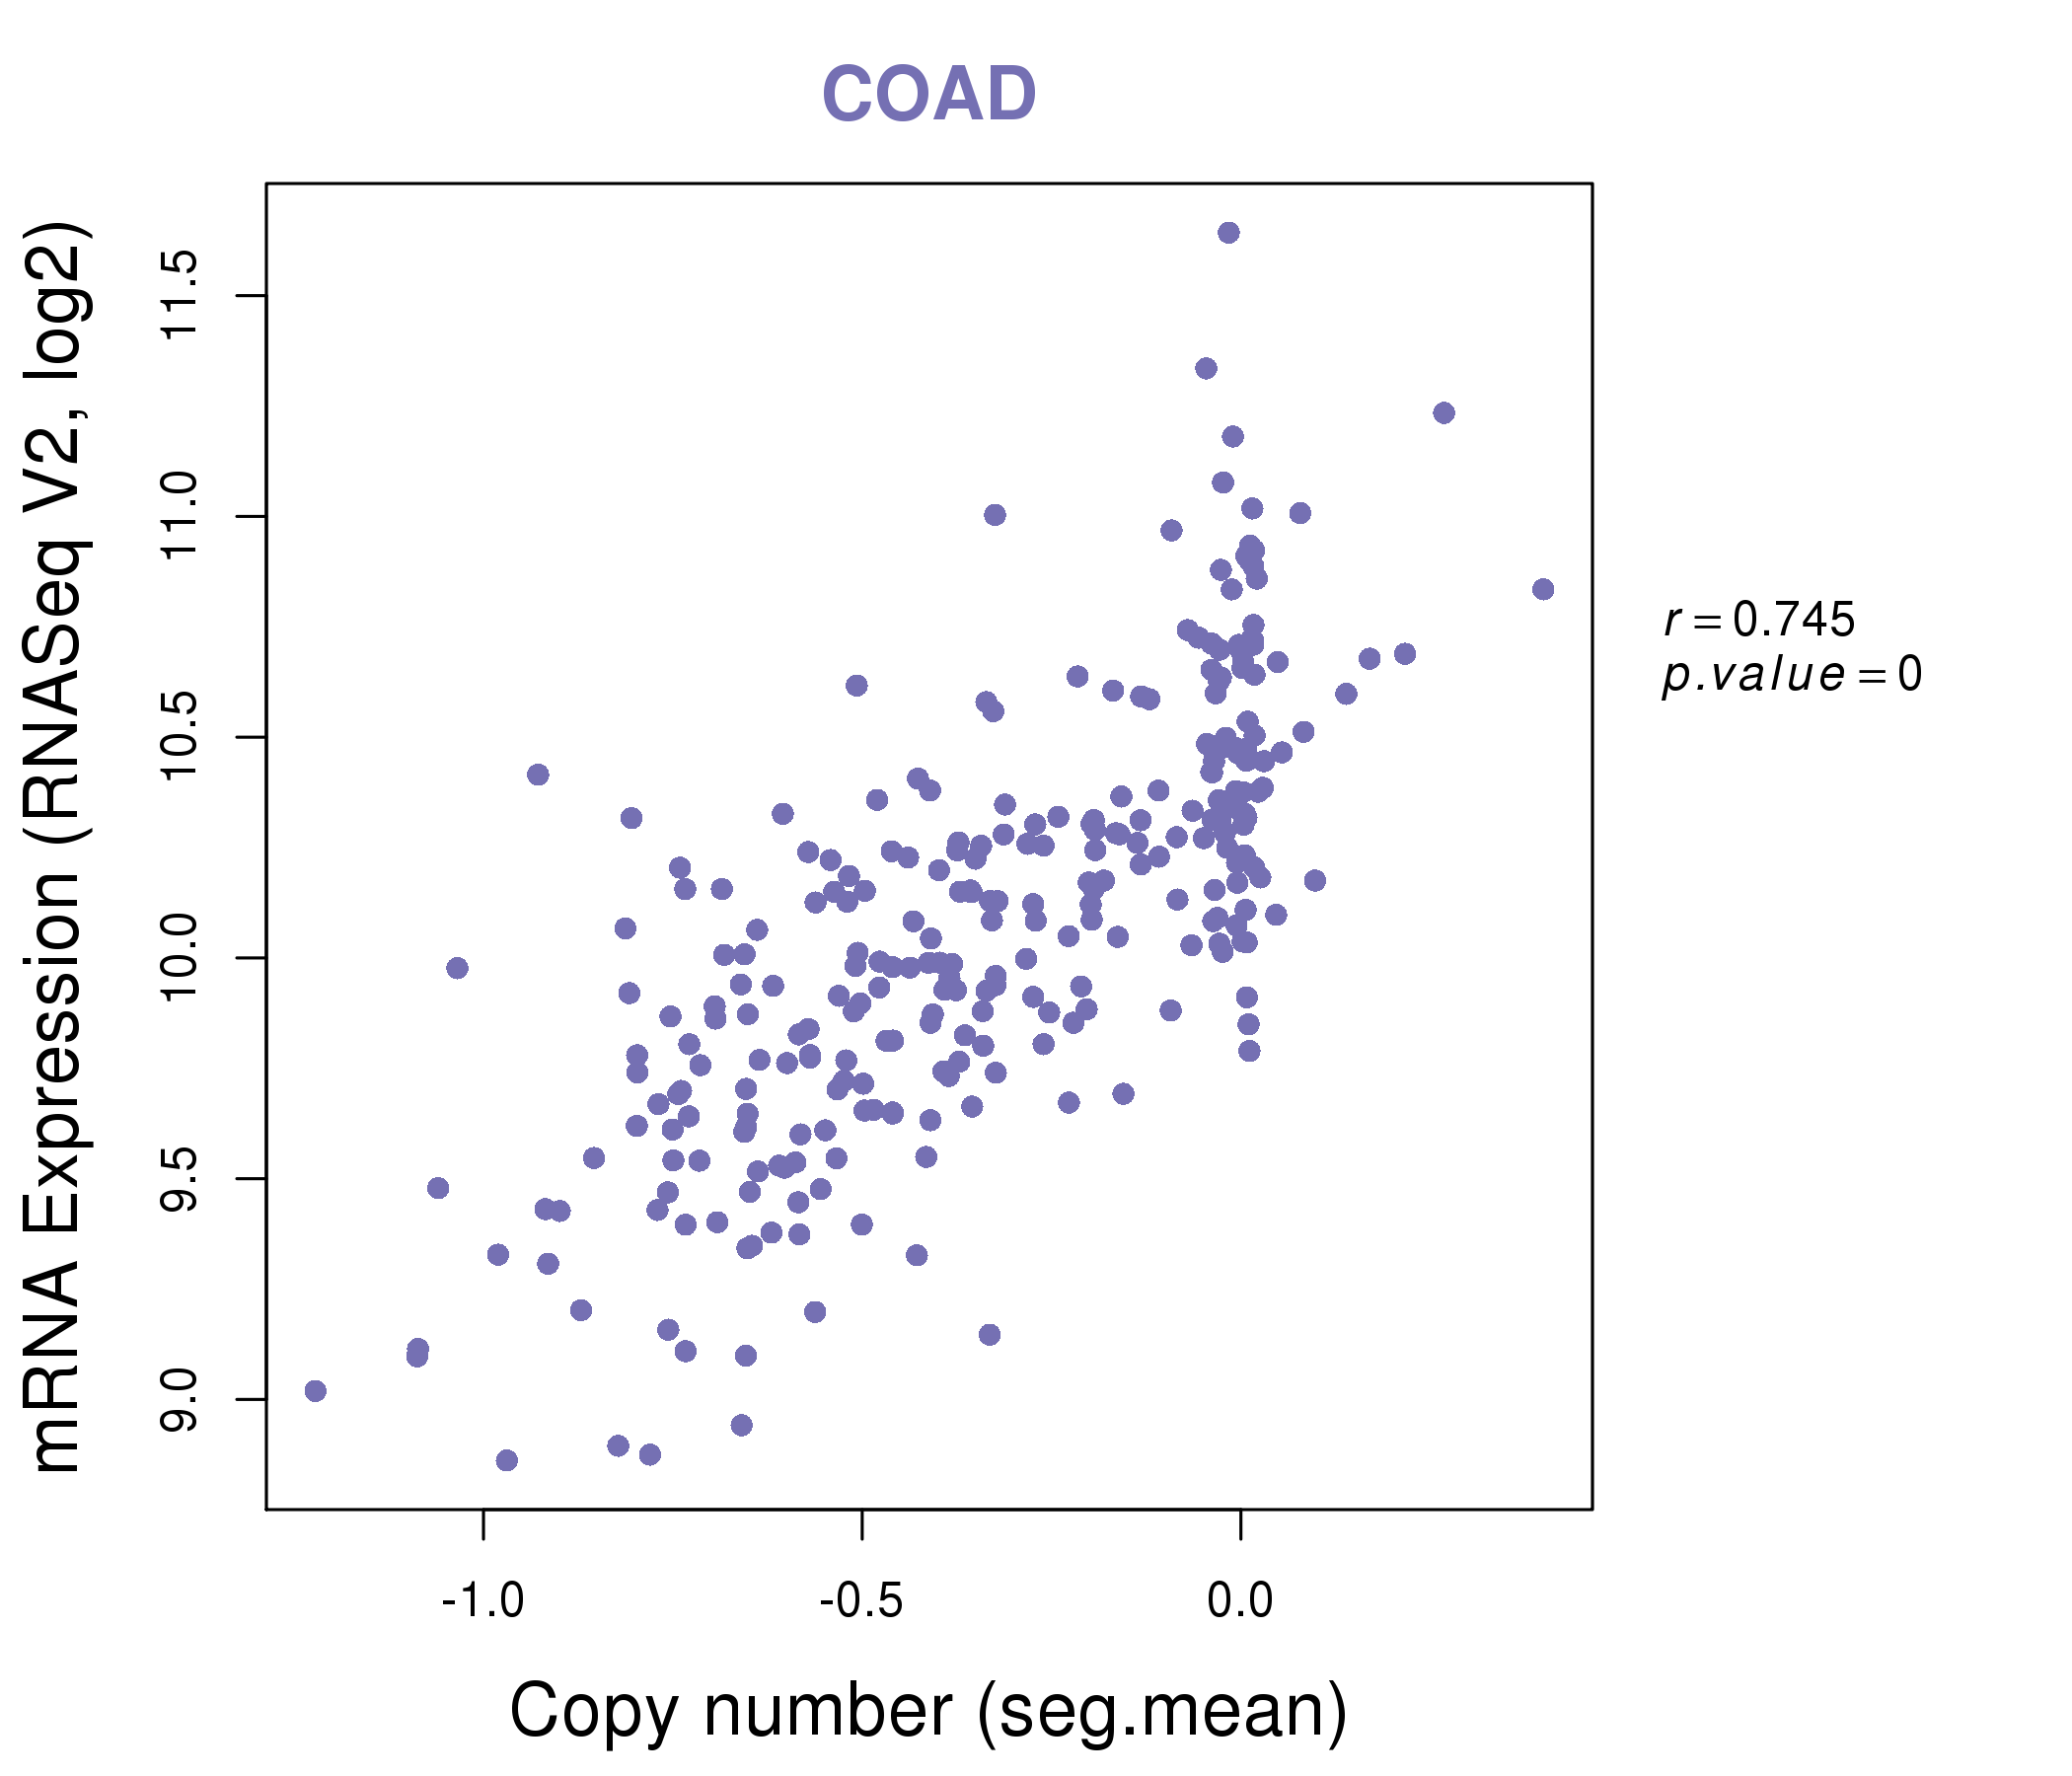
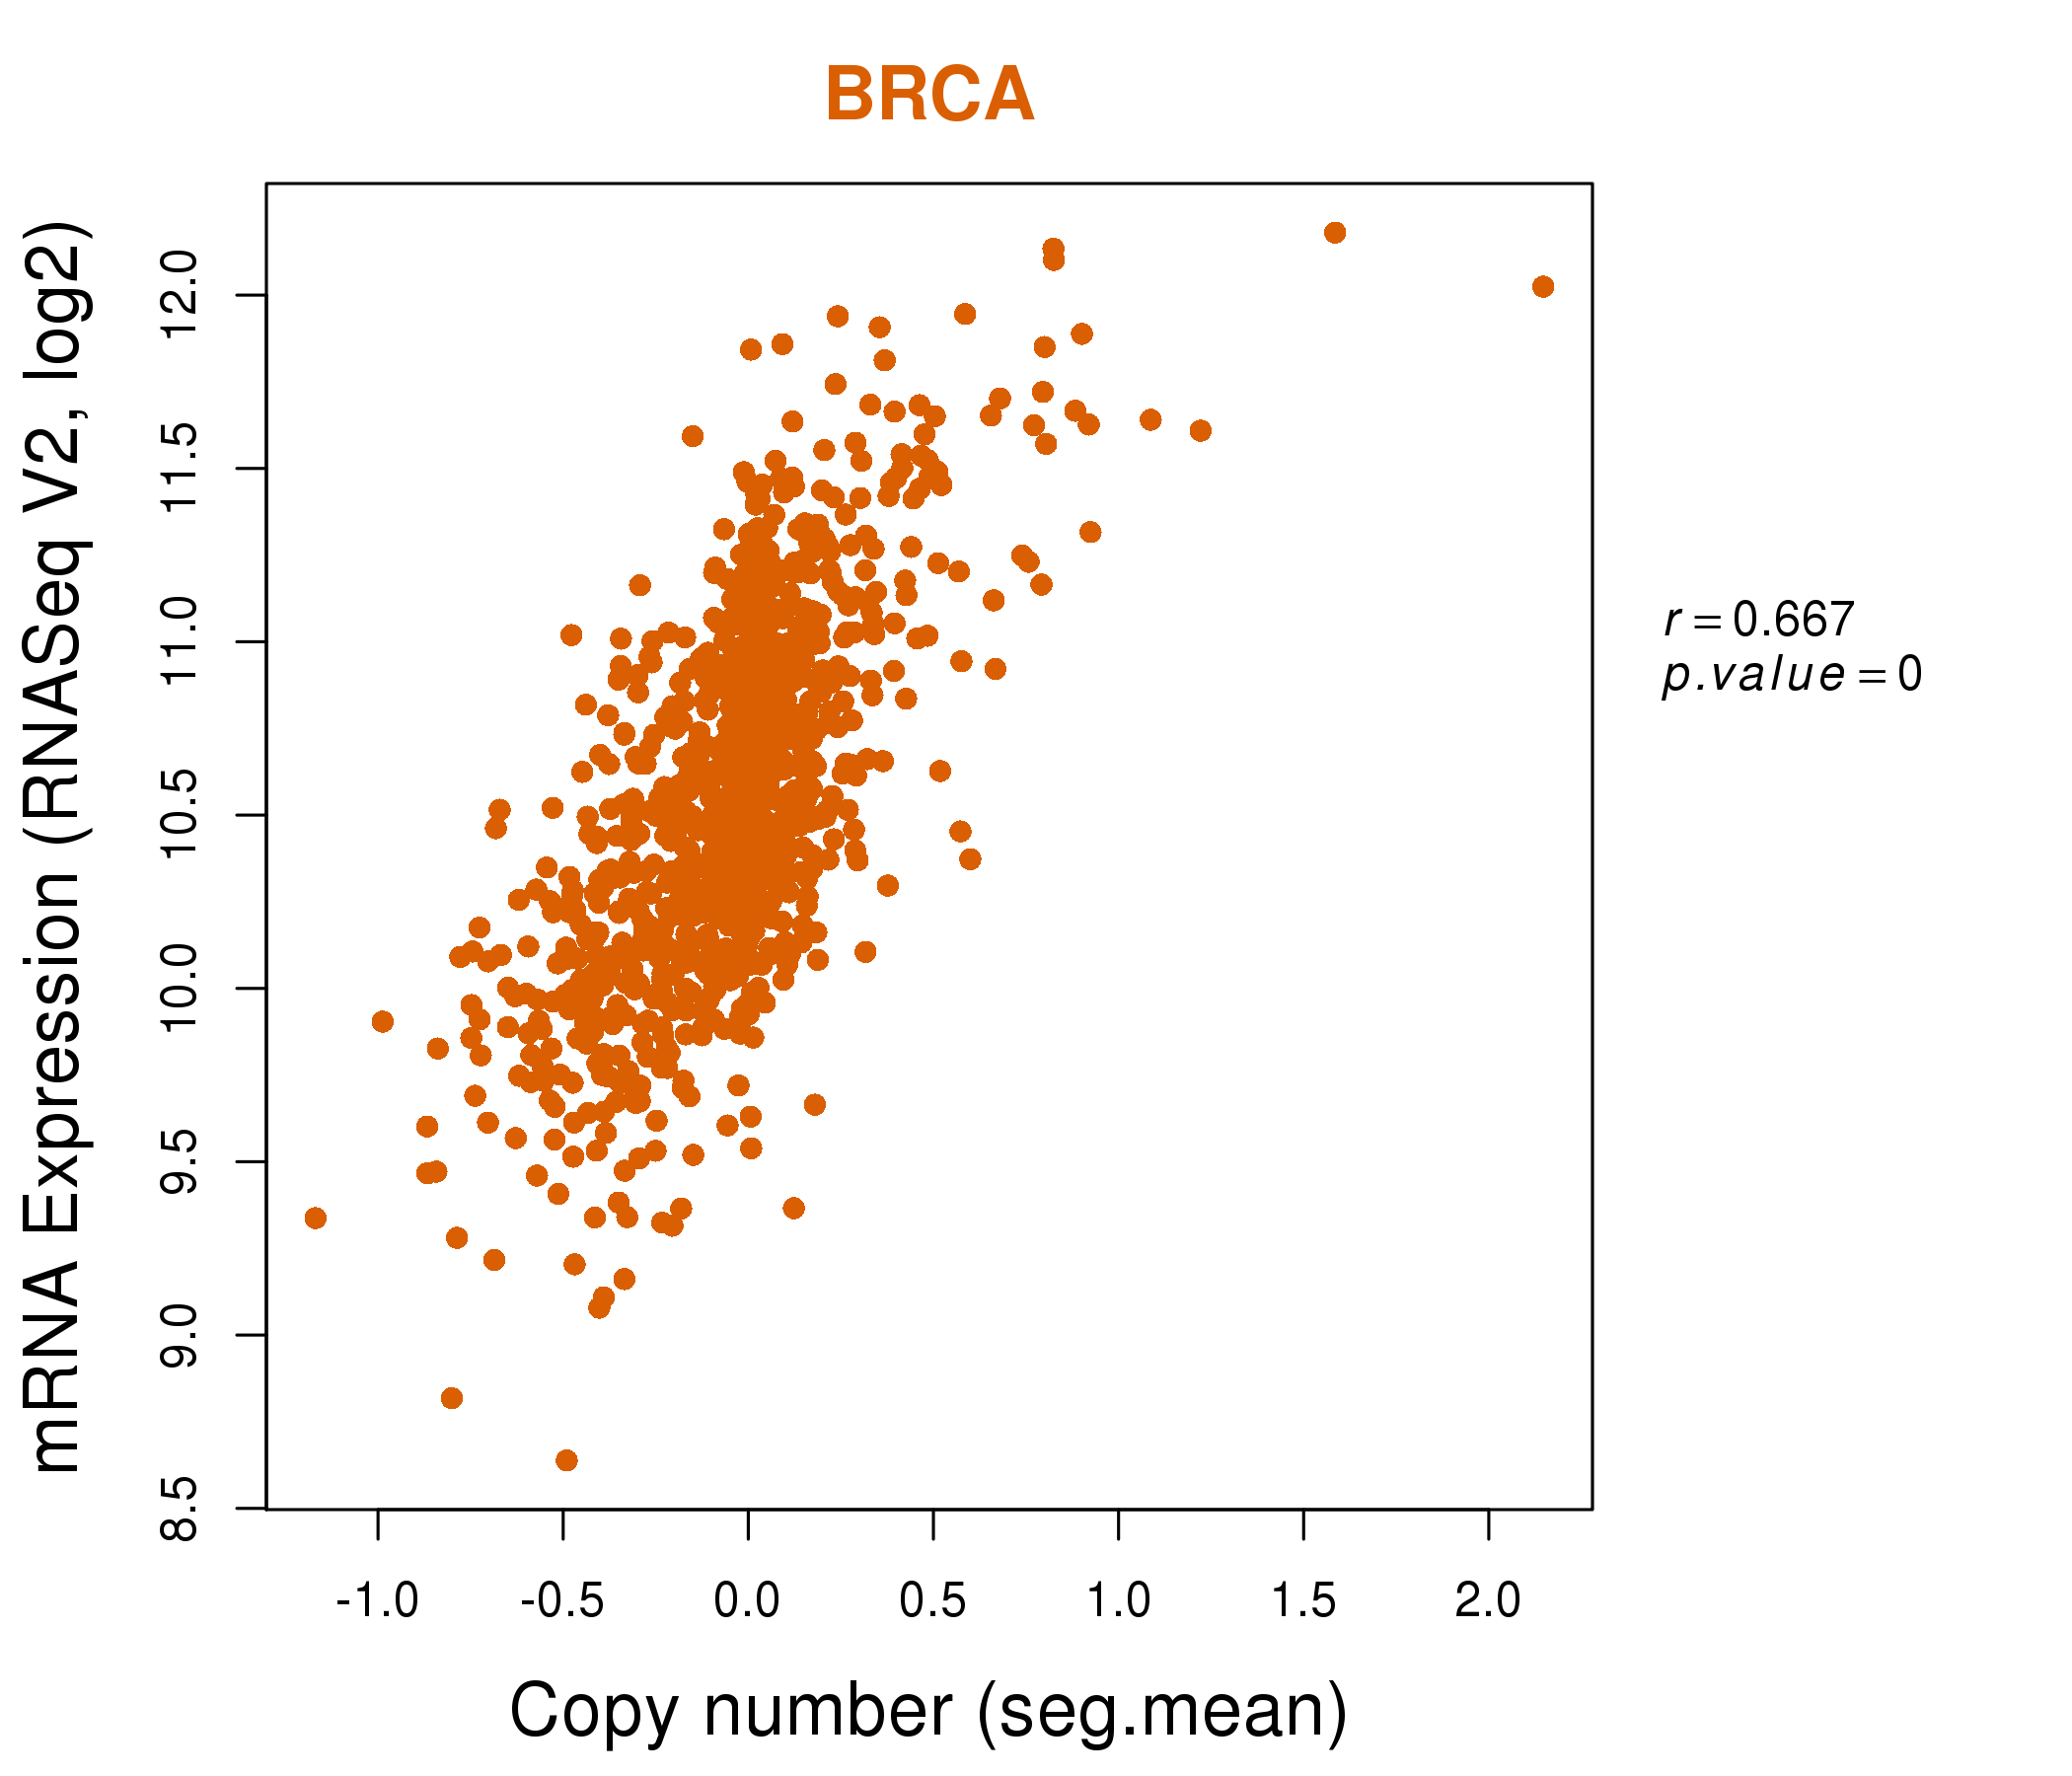
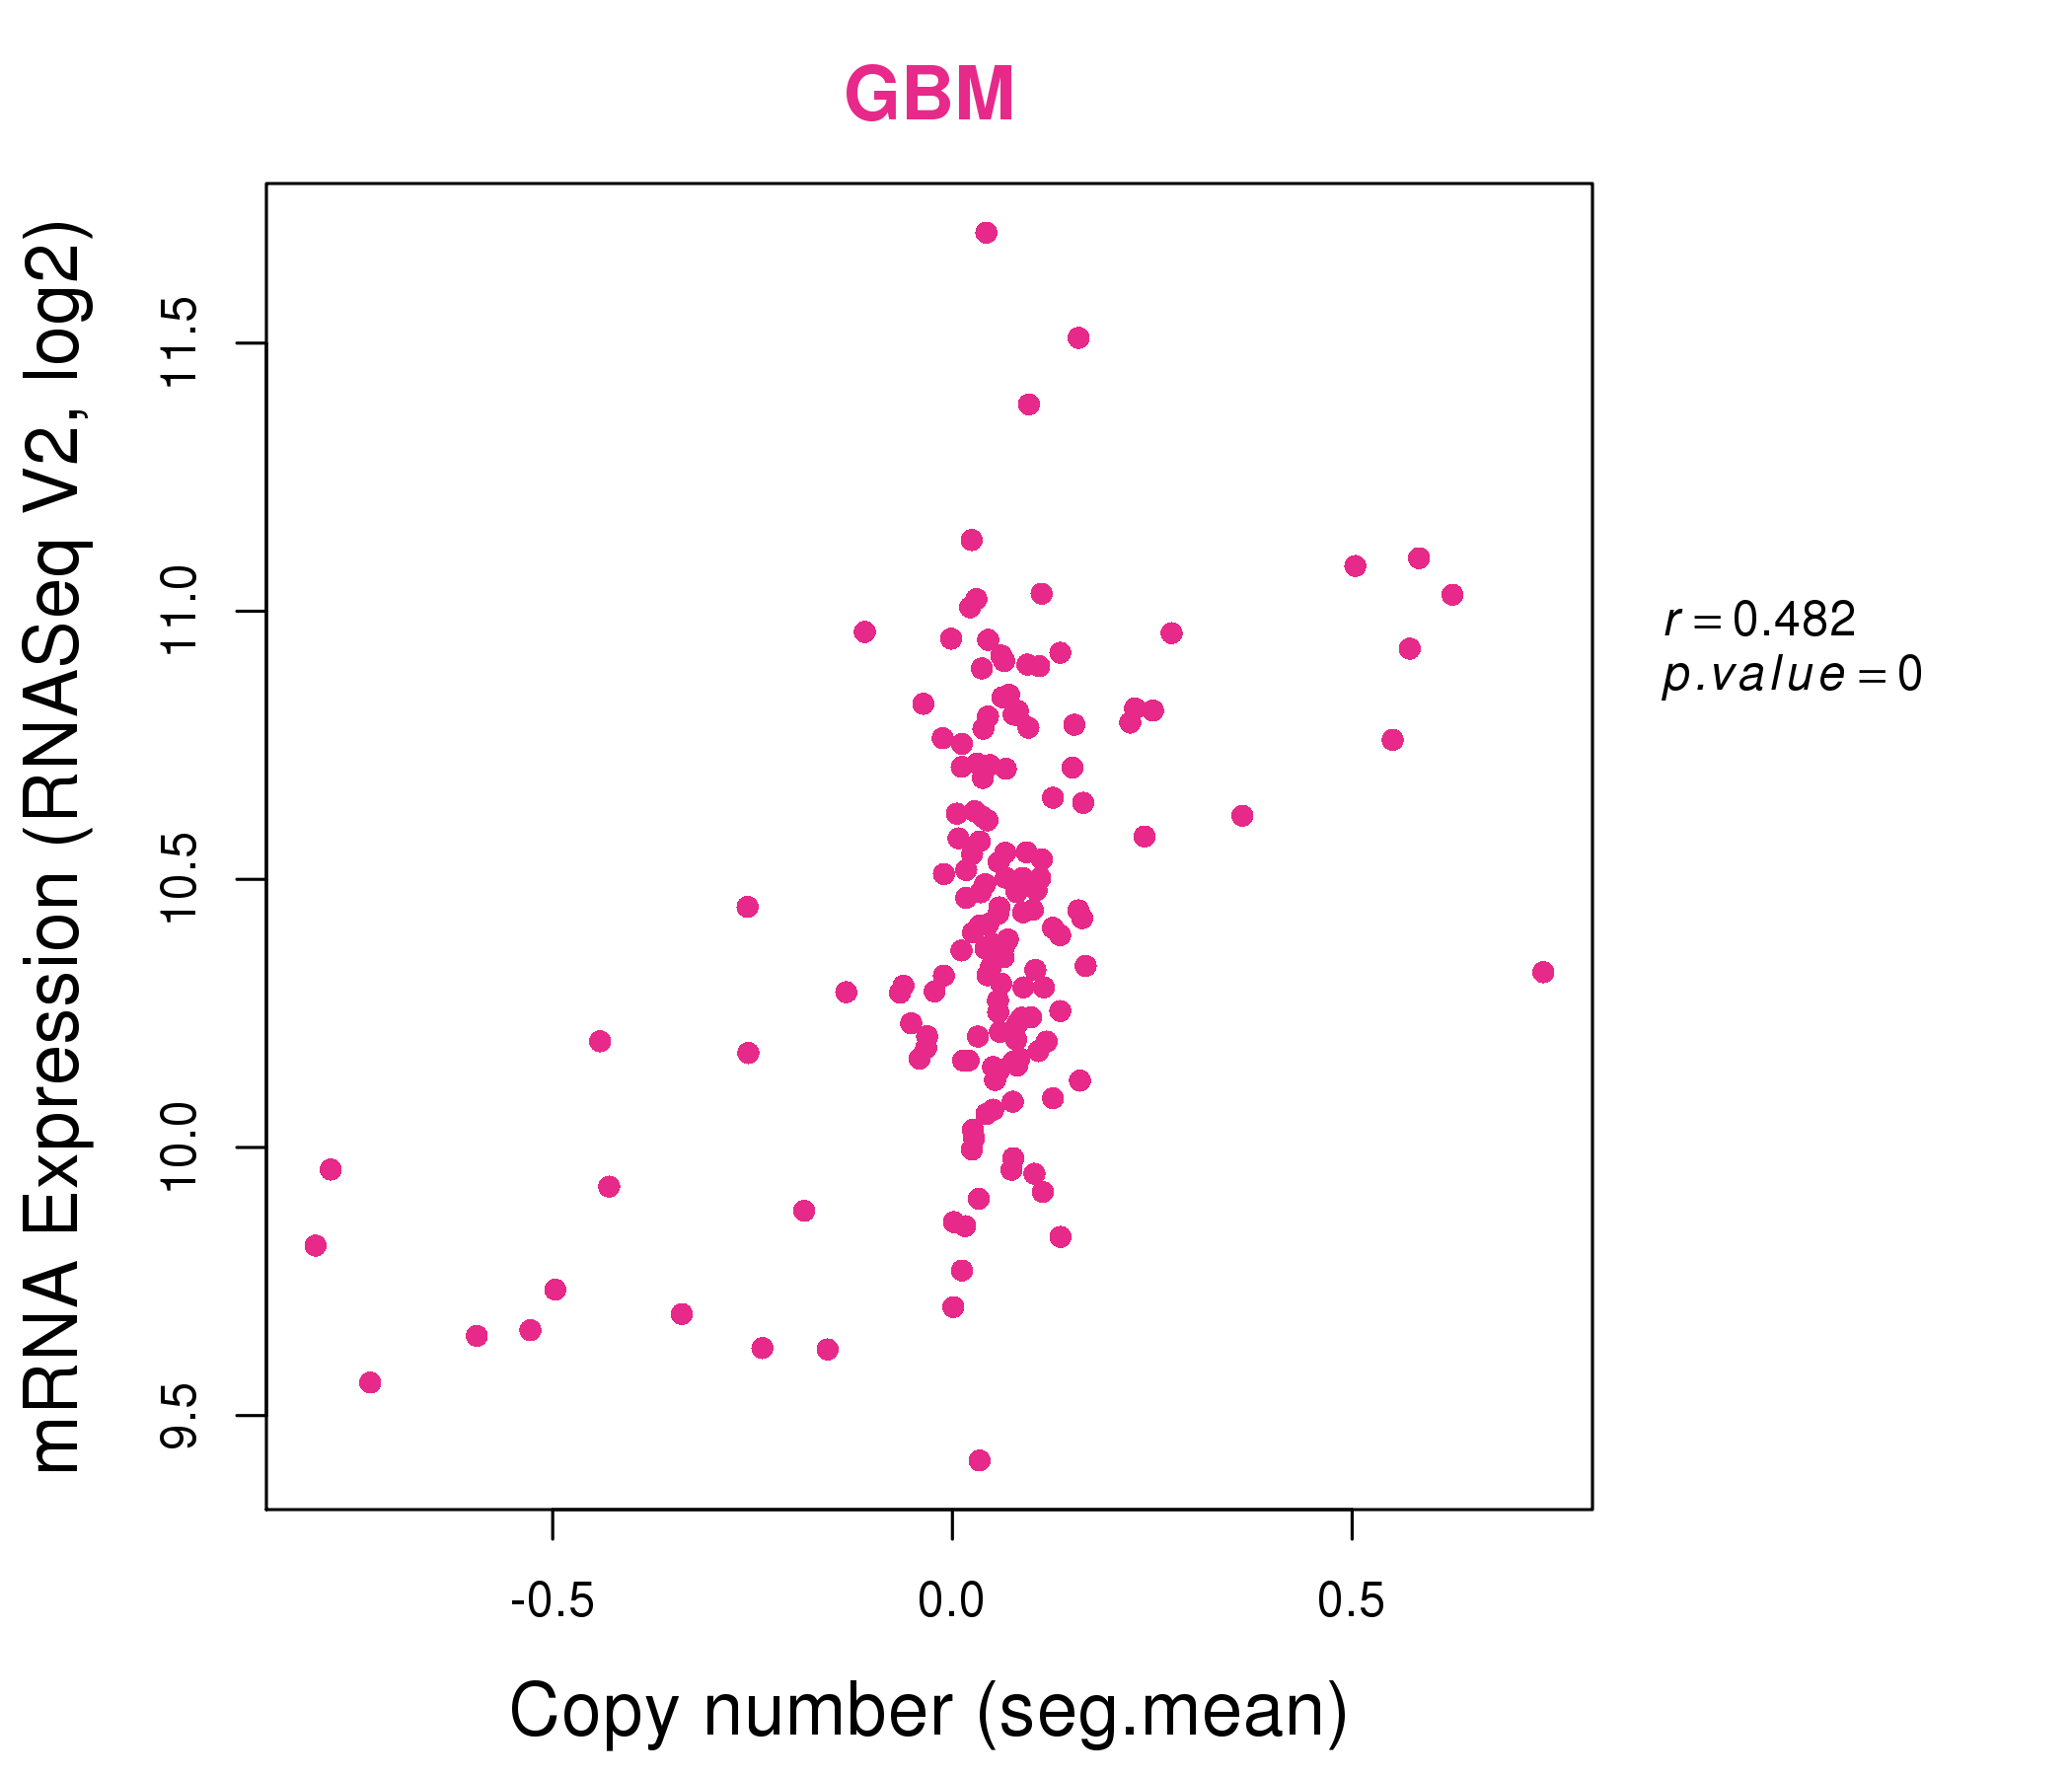
| * This plots show the correlation between CNV and gene expression. |
: Open all plots for all cancer types
 |
|
 |
|
| Top |
| Gene-Gene Network Information |
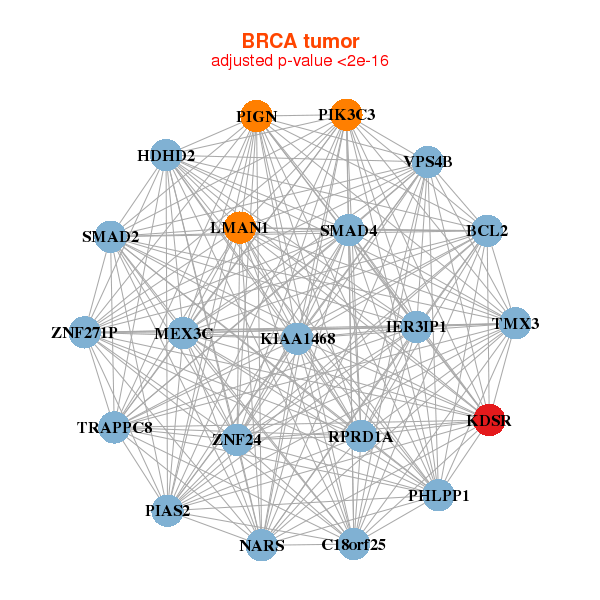
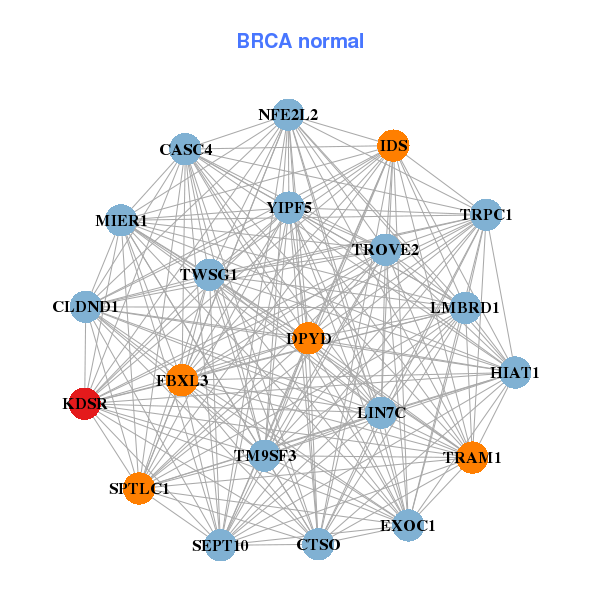
| * Co-Expression network figures were drawn using R package igraph. Only the top 20 genes with the highest correlations were shown. Red circle: input gene, orange circle: cell metabolism gene, sky circle: other gene |
: Open all plots for all cancer types
 |
|
| BCL2,C18orf25,HDHD2,IER3IP1,KDSR,TRAPPC8,KIAA1468, LMAN1,MEX3C,NARS,PHLPP1,PIAS2,PIGN,PIK3C3, RPRD1A,SMAD2,SMAD4,TMX3,VPS4B,ZNF24,ZNF271P | CASC4,CLDND1,CTSO,DPYD,EXOC1,FBXL3,HIAT1, IDS,KDSR,LIN7C,LMBRD1,MIER1,NFE2L2,SEPT10, SPTLC1,TM9SF3,TRAM1,TROVE2,TRPC1,TWSG1,YIPF5 |
 |
|
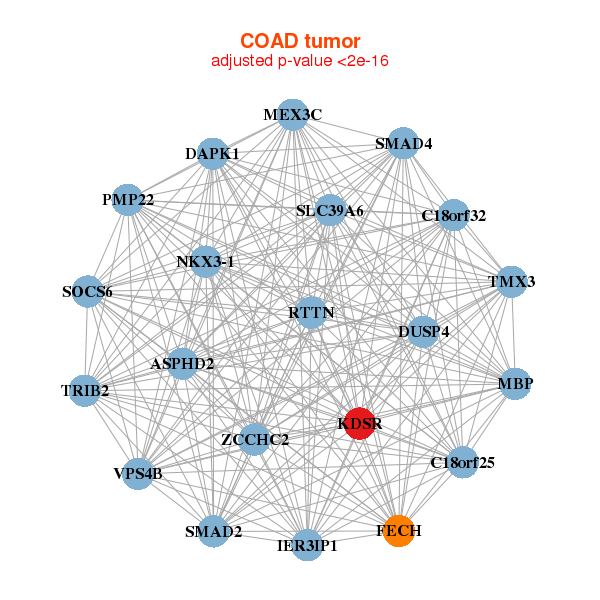
| ASPHD2,C18orf25,C18orf32,DAPK1,DUSP4,FECH,IER3IP1, KDSR,MBP,MEX3C,NKX3-1,PMP22,RTTN,SLC39A6, SMAD2,SMAD4,SOCS6,TMX3,TRIB2,VPS4B,ZCCHC2 | ATP1B2,C1QTNF7,C7,CSDE1,CYP2U1,DDHD2,ECM2, FAM172A,FLJ16779,GABARAPL1,GALNT16,KCND2,KDSR,LHFP, NAP1L5,NR3C1,CPQ,RALYL,SVOP,SYN2,SYT4 |

| * Co-Expression network figures were drawn using R package igraph. Only the top 20 genes with the highest correlations were shown. Red circle: input gene, orange circle: cell metabolism gene, sky circle: other gene |
: Open all plots for all cancer types
| Top |
: Open all interacting genes' information including KEGG pathway for all interacting genes from DAVID
| Top |
| Pharmacological Information for KDSR |
| There's no related Drug. |
| Top |
| Cross referenced IDs for KDSR |
| * We obtained these cross-references from Uniprot database. It covers 150 different DBs, 18 categories. http://www.uniprot.org/help/cross_references_section |
: Open all cross reference information
|
Copyright © 2016-Present - The Univsersity of Texas Health Science Center at Houston @ |