|
||||||||||||||||||||||||||||||||||||||||||||||||||||||||||||||||||||||||||||||||||||||||||||||||||||||||||||||||||||||||||||||||||||||||||||||||||||||||||||||||||||||||||||||||||||||||||||||||||||||||||||||||||||||||||||||||||||||||||||||||||||||||||||||||||||||||||||||||||||||||||||
| |
| Phenotypic Information (metabolism pathway, cancer, disease, phenome) |
| |
| |
| Gene-Gene Network Information: Co-Expression Network, Interacting Genes & KEGG |
| |
|


| Gene Summary for CERS6 |
| Top |
| Phenotypic Information for CERS6(metabolism pathway, cancer, disease, phenome) |
| Cancer | CGAP: CERS6 |
| Familial Cancer Database: CERS6 | |
| * This gene is included in those cancer gene databases. |
|
|
|
|
|
| . | ||||||||||||||||||||||||||||||||||||||||||||||||||||||||||||||||||||||||||||||||||||||||||||||||||||||||||||||||||||||||||||||||||||||||||||||||||||||||||||||||||||||||||||||||||||||||||||||||||||||||||||||||||||||||||||||||||||||||||||||||||||||||||||||||||||||||||||||||||||||
Oncogene 1 | Significant driver gene in | |||||||||||||||||||||||||||||||||||||||||||||||||||||||||||||||||||||||||||||||||||||||||||||||||||||||||||||||||||||||||||||||||||||||||||||||||||||||||||||||||||||||||||||||||||||||||||||||||||||||||||||||||||||||||||||||||||||||||||||||||||||||||||||||||||||||||||||||||||||||||||
| cf) number; DB name 1 Oncogene; http://nar.oxfordjournals.org/content/35/suppl_1/D721.long, 2 Tumor Suppressor gene; https://bioinfo.uth.edu/TSGene/, 3 Cancer Gene Census; http://www.nature.com/nrc/journal/v4/n3/abs/nrc1299.html, 4 CancerGenes; http://nar.oxfordjournals.org/content/35/suppl_1/D721.long, 5 Network of Cancer Gene; http://ncg.kcl.ac.uk/index.php, 1Therapeutic Vulnerabilities in Cancer; http://cbio.mskcc.org/cancergenomics/statius/ |
| REACTOME_PHOSPHOLIPID_METABOLISM REACTOME_SPHINGOLIPID_METABOLISM REACTOME_METABOLISM_OF_LIPIDS_AND_LIPOPROTEINS | |
| OMIM | |
| Orphanet | |
| Disease | KEGG Disease: CERS6 |
| MedGen: CERS6 (Human Medical Genetics with Condition) | |
| ClinVar: CERS6 | |
| Phenotype | MGI: CERS6 (International Mouse Phenotyping Consortium) |
| PhenomicDB: CERS6 | |
| Mutations for CERS6 |
| * Under tables are showing count per each tissue to give us broad intuition about tissue specific mutation patterns.You can go to the detailed page for each mutation database's web site. |
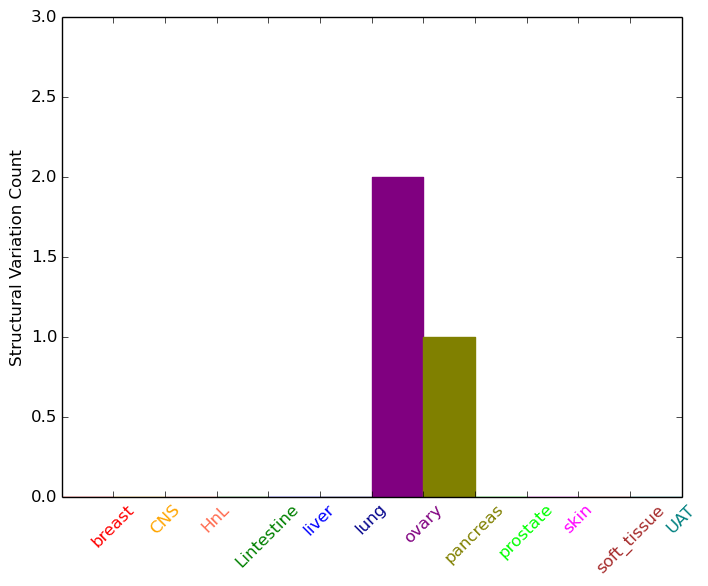
| - Statistics for Tissue and Mutation type | Top |
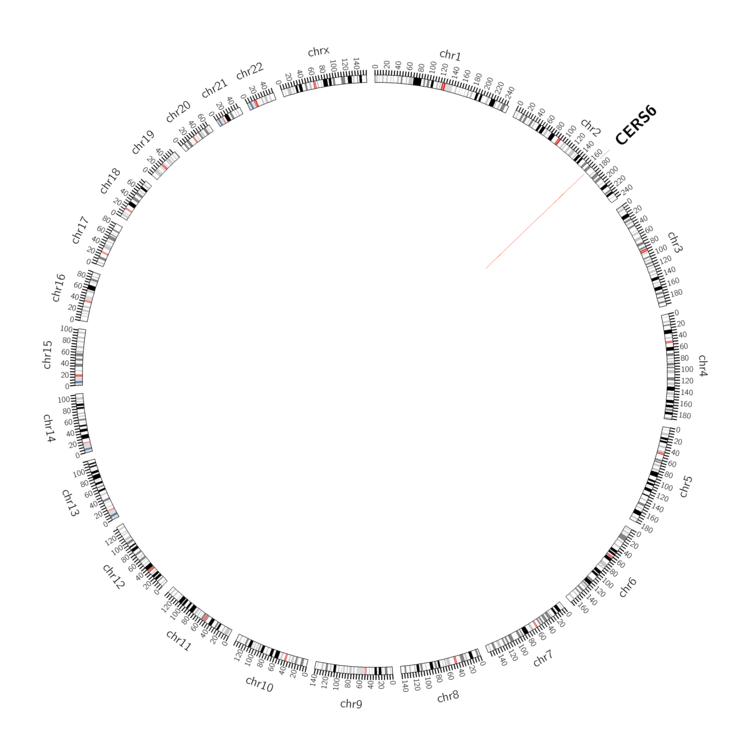 |
| - For Inter-chromosomal Variations |
| There's no inter-chromosomal structural variation. |
| - For Intra-chromosomal Variations |
| * Intra-chromosomal variantions includes 'intrachromosomal amplicon to amplicon', 'intrachromosomal amplicon to non-amplified dna', 'intrachromosomal deletion', 'intrachromosomal fold-back inversion', 'intrachromosomal inversion', 'intrachromosomal tandem duplication', 'Intrachromosomal unknown type', 'intrachromosomal with inverted orientation', 'intrachromosomal with non-inverted orientation'. |
 |
| Sample | Symbol_a | Chr_a | Start_a | End_a | Symbol_b | Chr_b | Start_b | End_b |
| ovary | CERS6 | chr2 | 169524445 | 169524465 | CERS6 | chr2 | 169524531 | 169524551 |
| pancreas | CERS6 | chr2 | 169578053 | 169578073 | CERS6 | chr2 | 169578116 | 169578136 |
| cf) Tissue number; Tissue name (1;Breast, 2;Central_nervous_system, 3;Haematopoietic_and_lymphoid_tissue, 4;Large_intestine, 5;Liver, 6;Lung, 7;Ovary, 8;Pancreas, 9;Prostate, 10;Skin, 11;Soft_tissue, 12;Upper_aerodigestive_tract) |
| * From mRNA Sanger sequences, Chitars2.0 arranged chimeric transcripts. This table shows CERS6 related fusion information. |
| ID | Head Gene | Tail Gene | Accession | Gene_a | qStart_a | qEnd_a | Chromosome_a | tStart_a | tEnd_a | Gene_a | qStart_a | qEnd_a | Chromosome_a | tStart_a | tEnd_a |
| BE815041 | CERS6 | 29 | 131 | 2 | 169630062 | 169630167 | SPP1 | 131 | 266 | 4 | 88904333 | 88904468 | |
| AW601963 | CERS6 | 5 | 299 | 2 | 169629012 | 169629307 | TXNIP | 300 | 580 | 1 | 145440113 | 145440522 | |
| AW601881 | TXNIP | 11 | 482 | 1 | 145440113 | 145440935 | CERS6 | 483 | 624 | 2 | 169629012 | 169629156 | |
| M86087 | LRFN5 | 1 | 75 | 14 | 42361011 | 42361085 | CERS6 | 76 | 205 | 2 | 169587955 | 169588084 | |
| BF209028 | MEST | 501 | 571 | 7 | 130146084 | 130146155 | CERS6 | 563 | 582 | 2 | 169374239 | 169374258 | |
| BI050759 | CERS6 | 25 | 209 | 2 | 169326774 | 169326958 | SVIL | 191 | 419 | 10 | 29839535 | 29839764 | |
| BE085594 | CERS6 | 12 | 107 | 2 | 169406305 | 169406402 | QSER1 | 100 | 166 | 11 | 32926552 | 32926618 | |
| Top |
| Mutation type/ Tissue ID | brca | cns | cerv | endome | haematopo | kidn | Lintest | liver | lung | ns | ovary | pancre | prost | skin | stoma | thyro | urina | |||
| Total # sample | 2 | 1 | 1 | 1 | ||||||||||||||||
| GAIN (# sample) | 2 | 1 | 1 | 1 | ||||||||||||||||
| LOSS (# sample) |
| cf) Tissue ID; Tissue type (1; Breast, 2; Central_nervous_system, 3; Cervix, 4; Endometrium, 5; Haematopoietic_and_lymphoid_tissue, 6; Kidney, 7; Large_intestine, 8; Liver, 9; Lung, 10; NS, 11; Ovary, 12; Pancreas, 13; Prostate, 14; Skin, 15; Stomach, 16; Thyroid, 17; Urinary_tract) |
| Top |
|
 |
| Top |
| Stat. for Non-Synonymous SNVs (# total SNVs=0) | (# total SNVs=0) |
(# total SNVs=0) | (# total SNVs=0) |
| Top |
| * When you move the cursor on each content, you can see more deailed mutation information on the Tooltip. Those are primary_site,primary_histology,mutation(aa),pubmedID. |
| GRCh37 position | Mutation(aa) | Unique sampleID count |
| Top |
|
 |
| Point Mutation/ Tissue ID | 1 | 2 | 3 | 4 | 5 | 6 | 7 | 8 | 9 | 10 | 11 | 12 | 13 | 14 | 15 | 16 | 17 | 18 | 19 | 20 |
| # sample | 1 | 1 | 4 | 1 | 1 | 2 | 1 | 5 | 1 | 7 | 2 | 1 | 6 | |||||||
| # mutation | 1 | 1 | 5 | 1 | 1 | 2 | 1 | 6 | 1 | 8 | 2 | 1 | 6 | |||||||
| nonsynonymous SNV | 1 | 1 | 5 | 1 | 1 | 2 | 1 | 4 | 1 | 2 | 2 | 1 | 4 | |||||||
| synonymous SNV | 2 | 6 | 2 |
| cf) Tissue ID; Tissue type (1; BLCA[Bladder Urothelial Carcinoma], 2; BRCA[Breast invasive carcinoma], 3; CESC[Cervical squamous cell carcinoma and endocervical adenocarcinoma], 4; COAD[Colon adenocarcinoma], 5; GBM[Glioblastoma multiforme], 6; Glioma Low Grade, 7; HNSC[Head and Neck squamous cell carcinoma], 8; KICH[Kidney Chromophobe], 9; KIRC[Kidney renal clear cell carcinoma], 10; KIRP[Kidney renal papillary cell carcinoma], 11; LAML[Acute Myeloid Leukemia], 12; LUAD[Lung adenocarcinoma], 13; LUSC[Lung squamous cell carcinoma], 14; OV[Ovarian serous cystadenocarcinoma ], 15; PAAD[Pancreatic adenocarcinoma], 16; PRAD[Prostate adenocarcinoma], 17; SKCM[Skin Cutaneous Melanoma], 18:STAD[Stomach adenocarcinoma], 19:THCA[Thyroid carcinoma], 20:UCEC[Uterine Corpus Endometrial Carcinoma]) |
| Top |
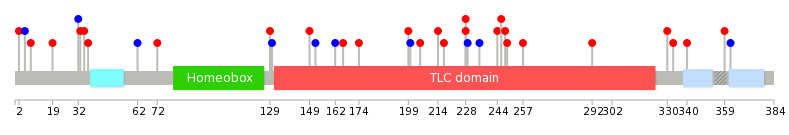
| * We represented just top 10 SNVs. When you move the cursor on each content, you can see more deailed mutation information on the Tooltip. Those are primary_site, primary_histology, mutation(aa), pubmedID. |
| Genomic Position | Mutation(aa) | Unique sampleID count |
| chr2:169487532 | p.A228V,CERS6 | 1 |
| chr2:169571584 | p.D37Y,CERS6 | 1 |
| chr2:169312982 | p.R229R,CERS6 | 1 |
| chr2:169622847 | p.P62P,CERS6 | 1 |
| chr2:169487543 | p.L235L,CERS6 | 1 |
| chr2:169571586 | p.N72S,CERS6 | 1 |
| chr2:169313014 | p.L244F,CERS6 | 1 |
| chr2:169626093 | p.L129V,CERS6 | 1 |
| chr2:169547564 | p.E246D,CERS6 | 1 |
| chr2:169571606 | p.T130T,CERS6 | 1 |
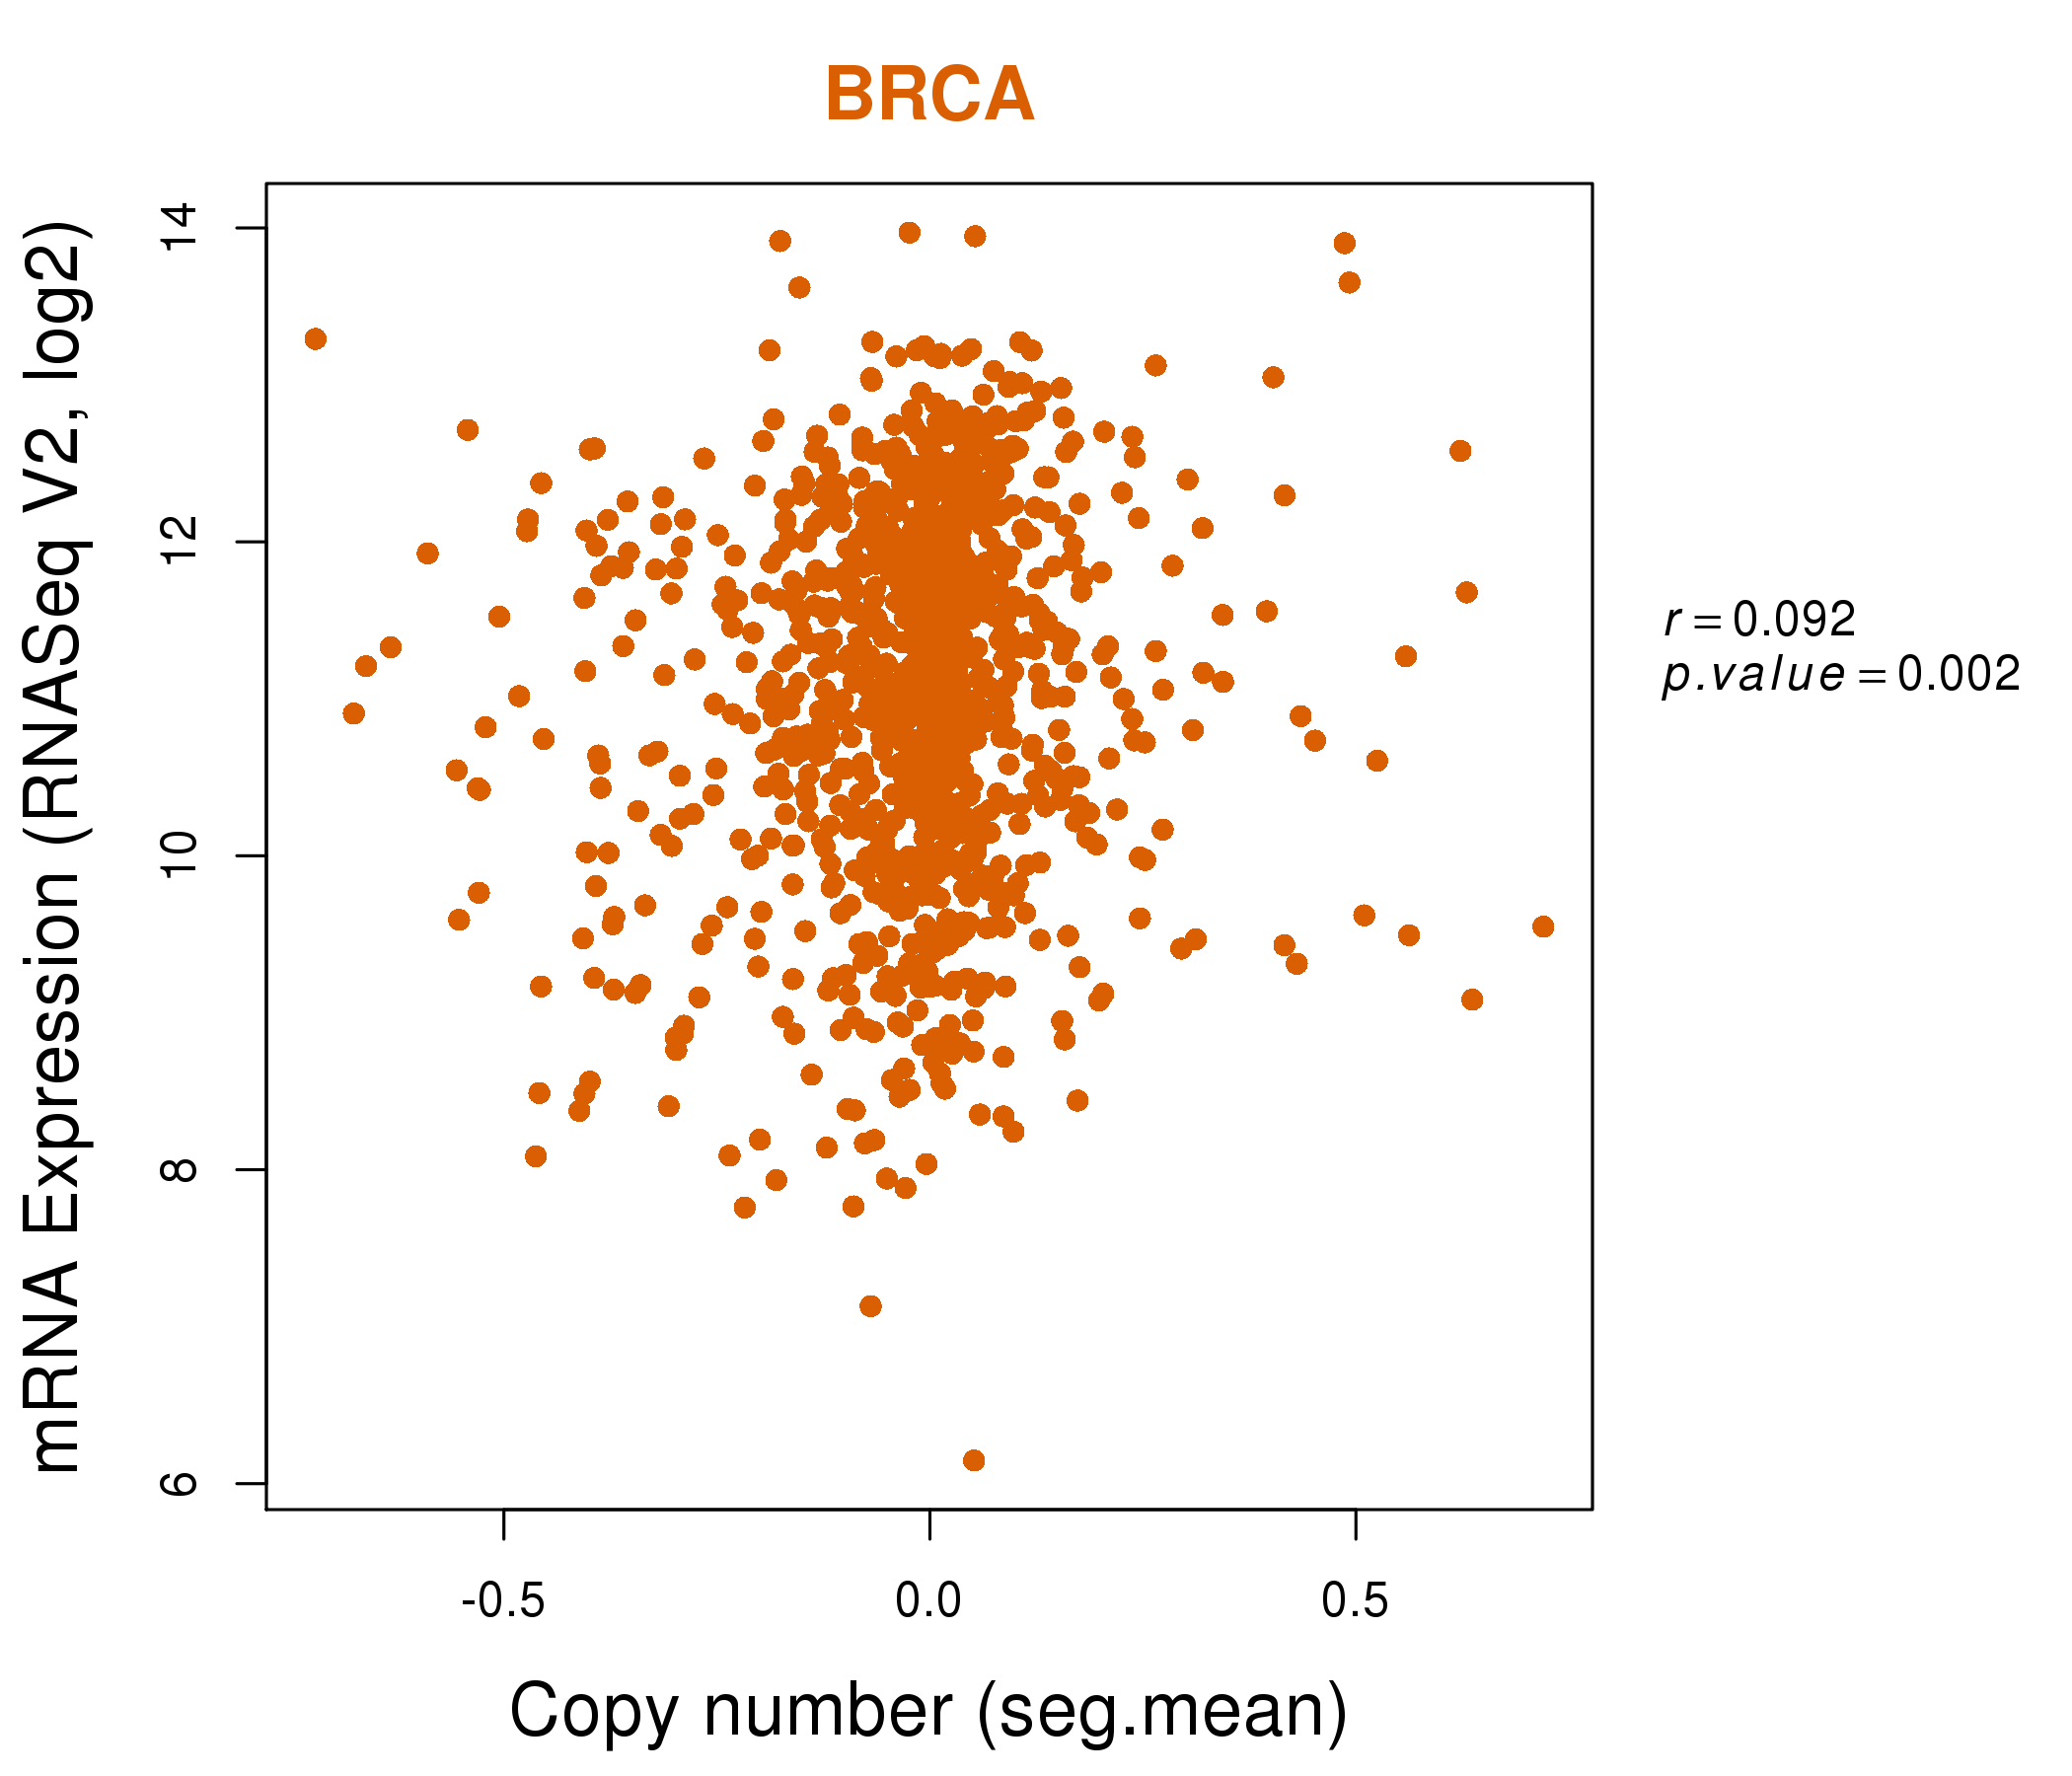
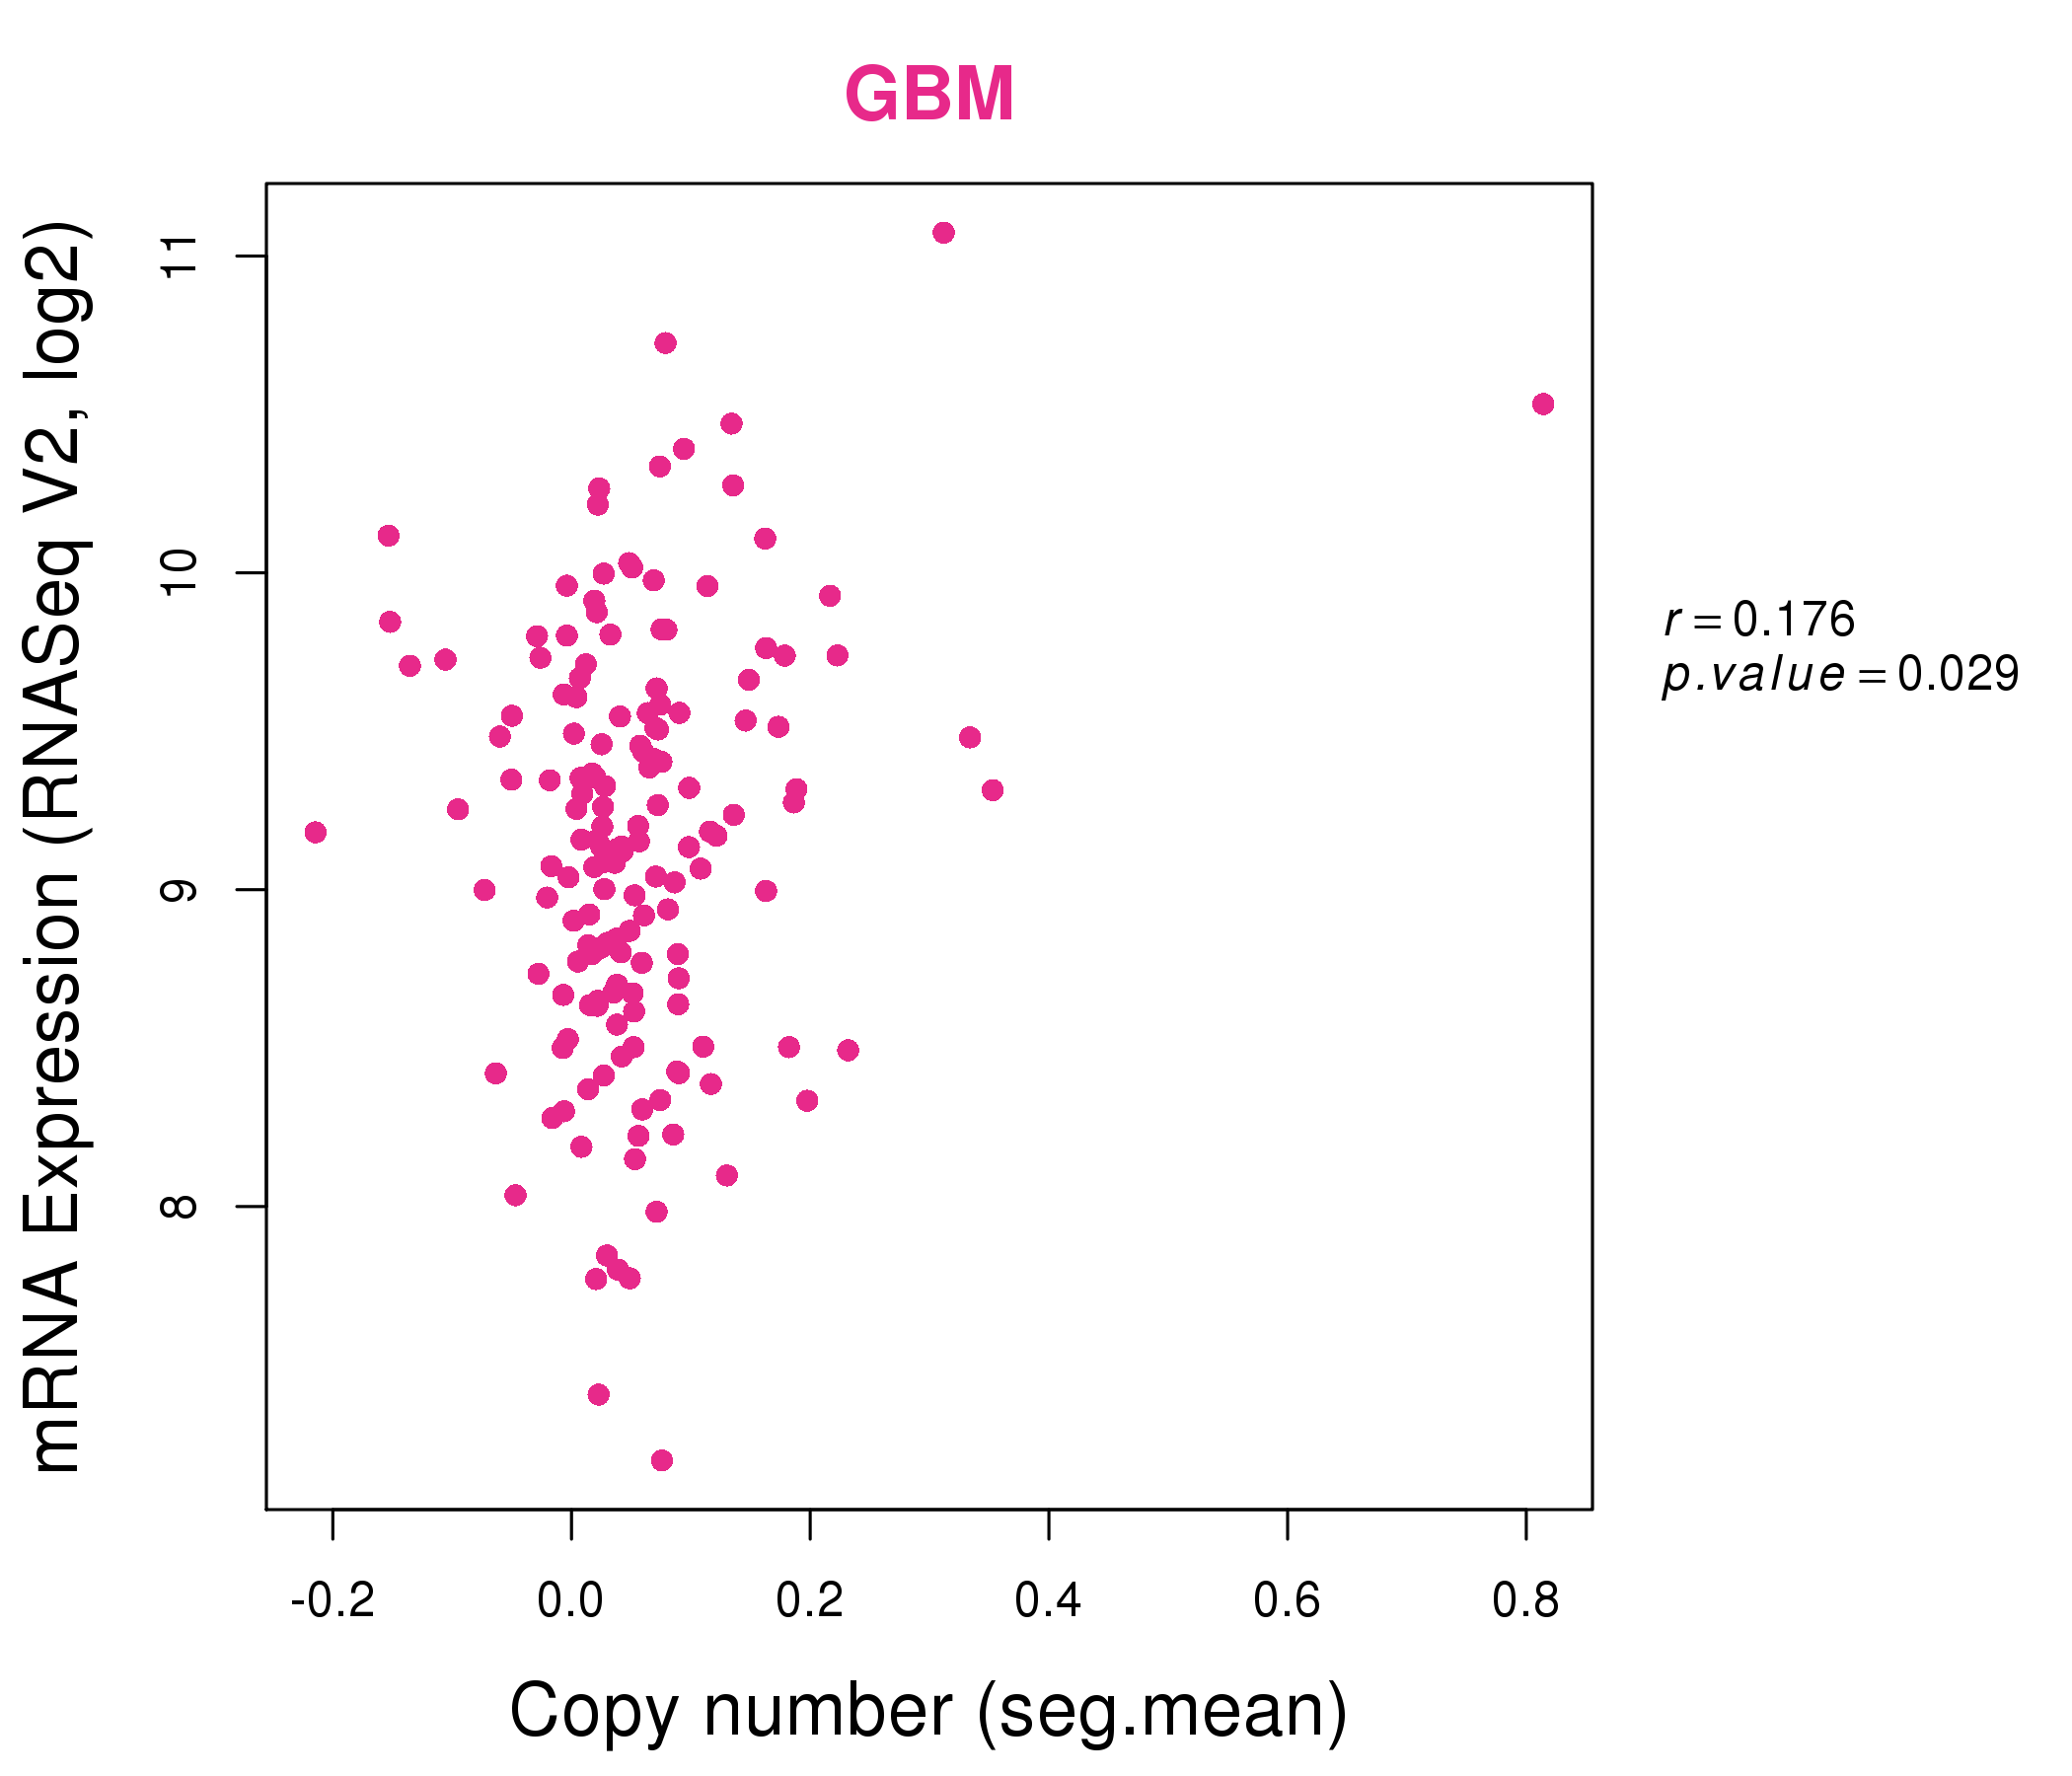
| * Copy number data were extracted from TCGA using R package TCGA-Assembler. The URLs of all public data files on TCGA DCC data server were gathered on Jan-05-2015. Function ProcessCNAData in TCGA-Assembler package was used to obtain gene-level copy number value which is calculated as the average copy number of the genomic region of a gene. |
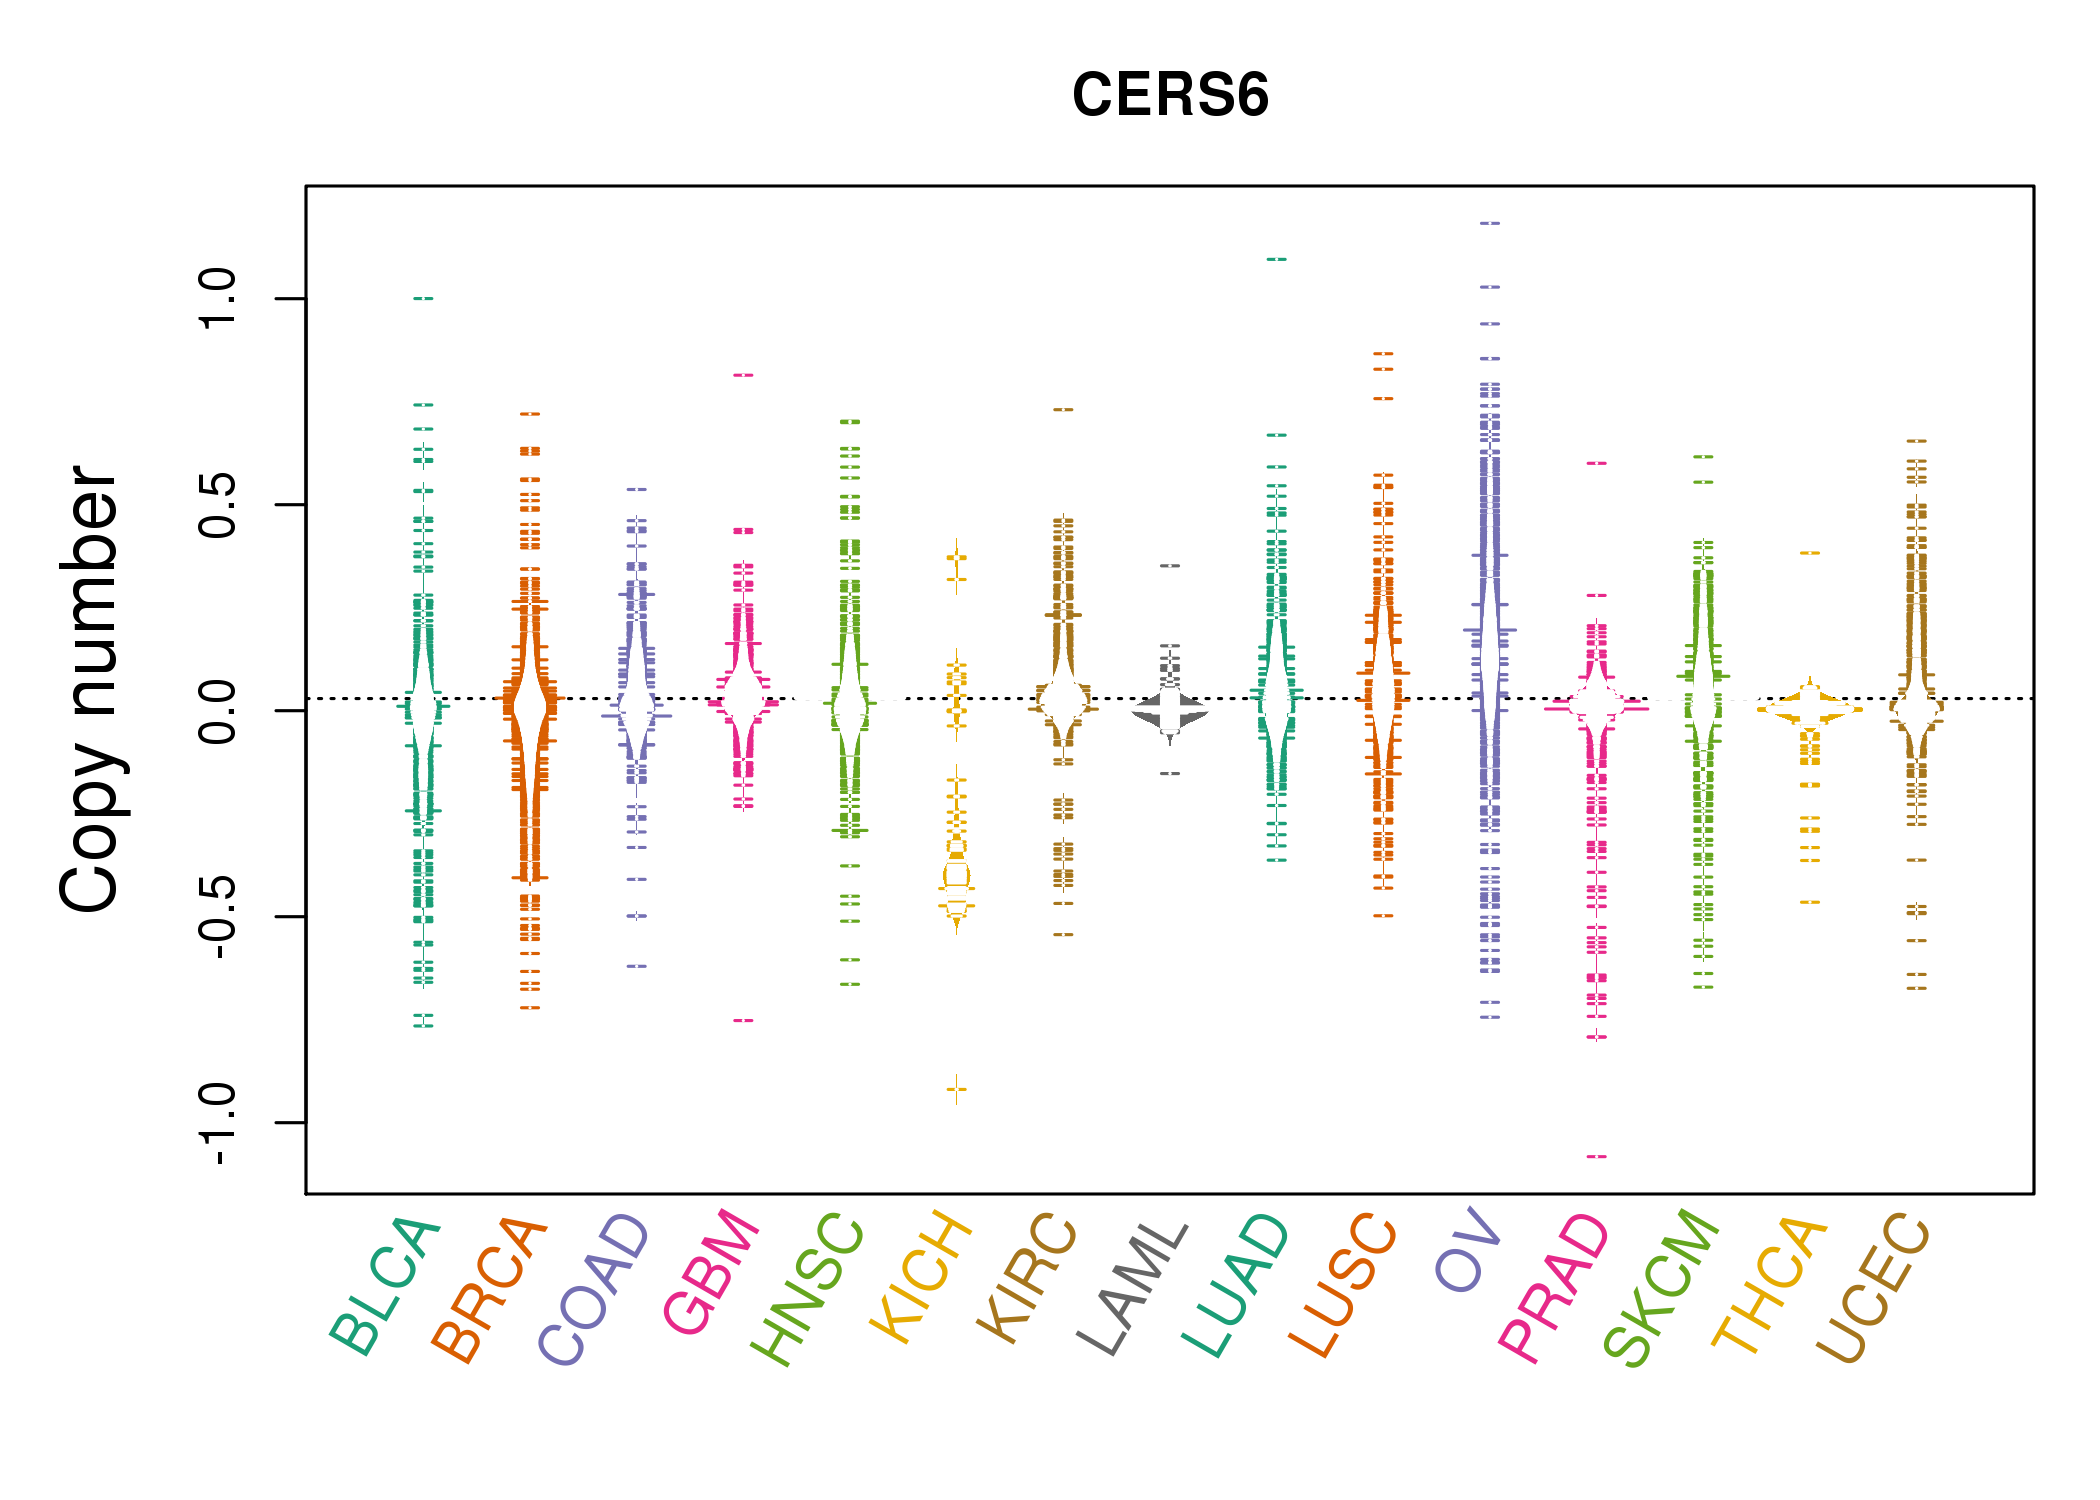 |
| cf) Tissue ID[Tissue type]: BLCA[Bladder Urothelial Carcinoma], BRCA[Breast invasive carcinoma], CESC[Cervical squamous cell carcinoma and endocervical adenocarcinoma], COAD[Colon adenocarcinoma], GBM[Glioblastoma multiforme], Glioma Low Grade, HNSC[Head and Neck squamous cell carcinoma], KICH[Kidney Chromophobe], KIRC[Kidney renal clear cell carcinoma], KIRP[Kidney renal papillary cell carcinoma], LAML[Acute Myeloid Leukemia], LUAD[Lung adenocarcinoma], LUSC[Lung squamous cell carcinoma], OV[Ovarian serous cystadenocarcinoma ], PAAD[Pancreatic adenocarcinoma], PRAD[Prostate adenocarcinoma], SKCM[Skin Cutaneous Melanoma], STAD[Stomach adenocarcinoma], THCA[Thyroid carcinoma], UCEC[Uterine Corpus Endometrial Carcinoma] |
| Top |
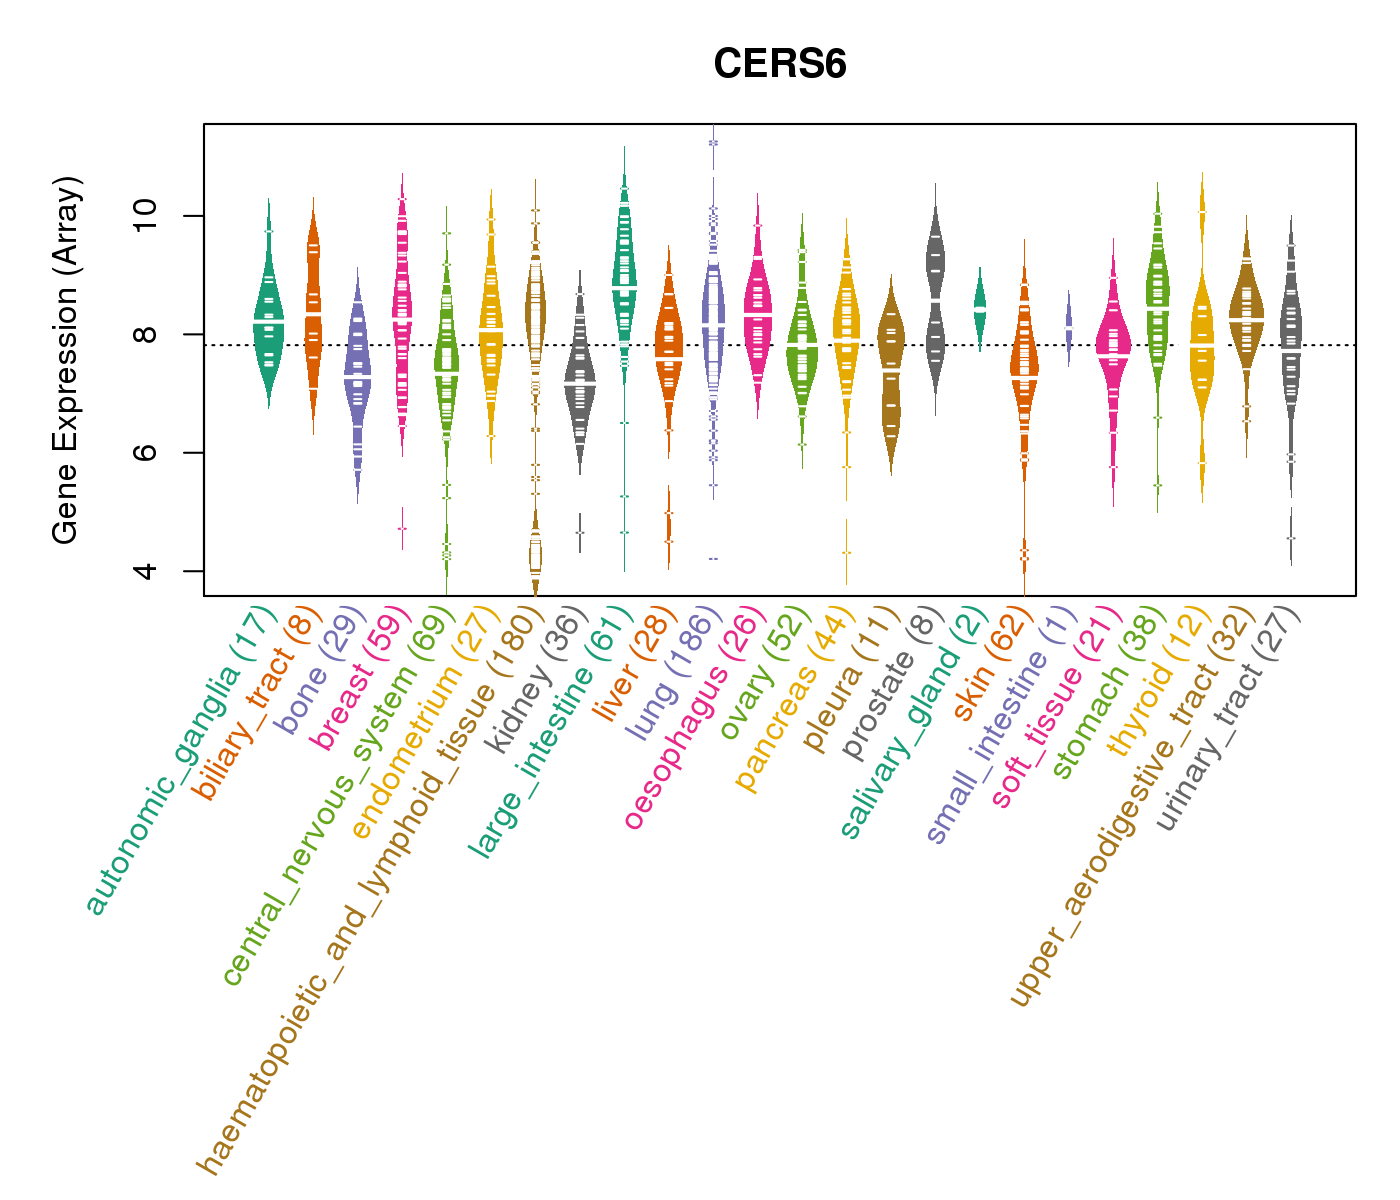
| Gene Expression for CERS6 |
| * CCLE gene expression data were extracted from CCLE_Expression_Entrez_2012-10-18.res: Gene-centric RMA-normalized mRNA expression data. |
 |
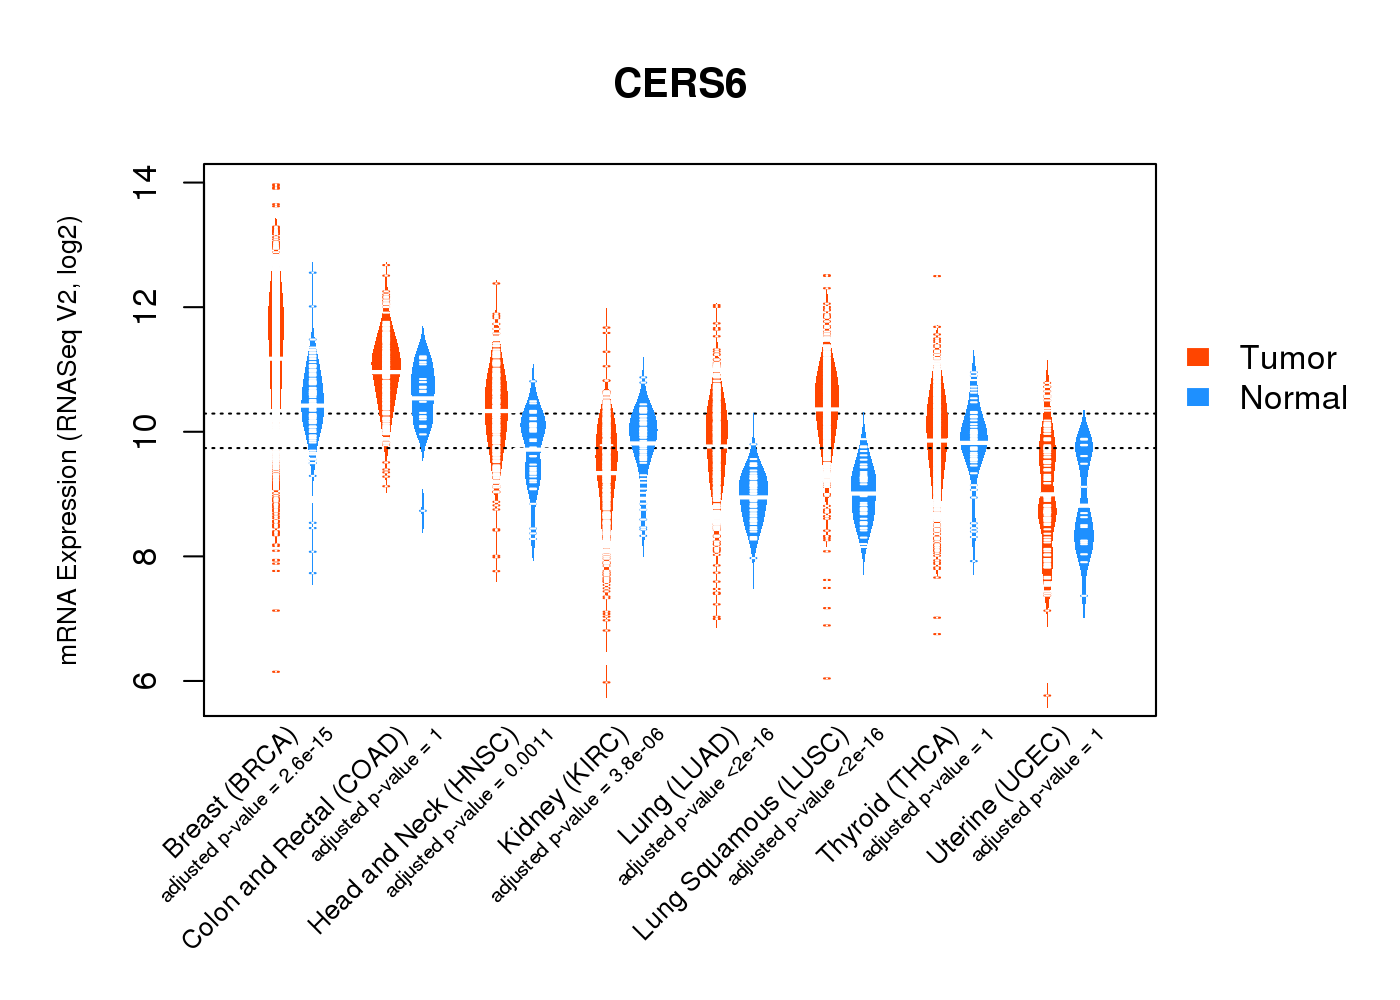
| * Normalized gene expression data of RNASeqV2 was extracted from TCGA using R package TCGA-Assembler. The URLs of all public data files on TCGA DCC data server were gathered at Jan-05-2015. Only eight cancer types have enough normal control samples for differential expression analysis. (t test, adjusted p<0.05 (using Benjamini-Hochberg FDR)) |
 |
| Top |
| * This plots show the correlation between CNV and gene expression. |
: Open all plots for all cancer types
 |
|
 |
|
| Top |
| Gene-Gene Network Information |
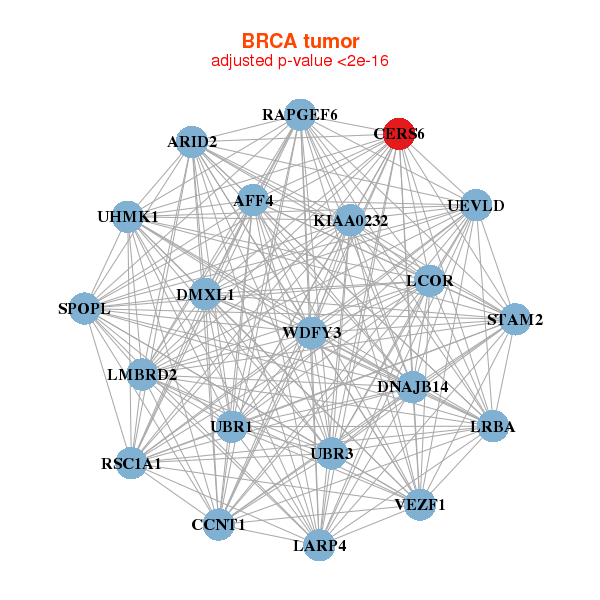
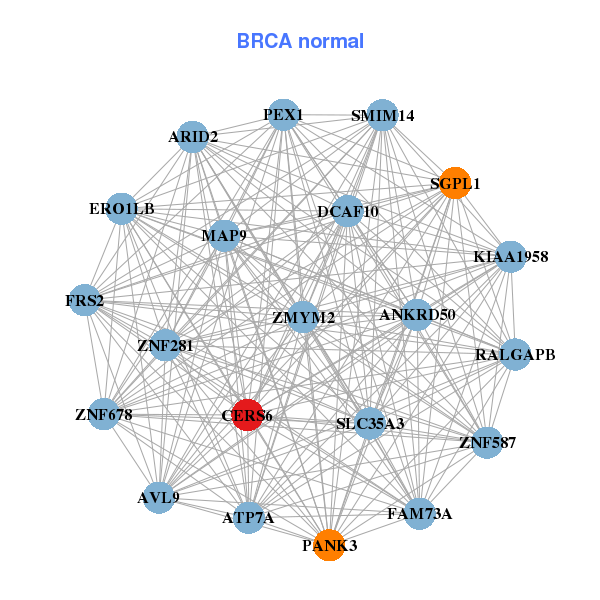
| * Co-Expression network figures were drawn using R package igraph. Only the top 20 genes with the highest correlations were shown. Red circle: input gene, orange circle: cell metabolism gene, sky circle: other gene |
: Open all plots for all cancer types
 |
|
| AFF4,ARID2,CCNT1,DMXL1,DNAJB14,KIAA0232,LARP4, CERS6,LCOR,LMBRD2,LRBA,RAPGEF6,RSC1A1,SPOPL, STAM2,UBR1,UBR3,UEVLD,UHMK1,VEZF1,WDFY3 | ANKRD50,ARID2,ATP7A,AVL9,SMIM14,DCAF10,ERO1LB, FAM73A,FRS2,KIAA1958,CERS6,MAP9,PANK3,PEX1, RALGAPB,SGPL1,SLC35A3,ZMYM2,ZNF281,ZNF587,ZNF678 |
 |
|
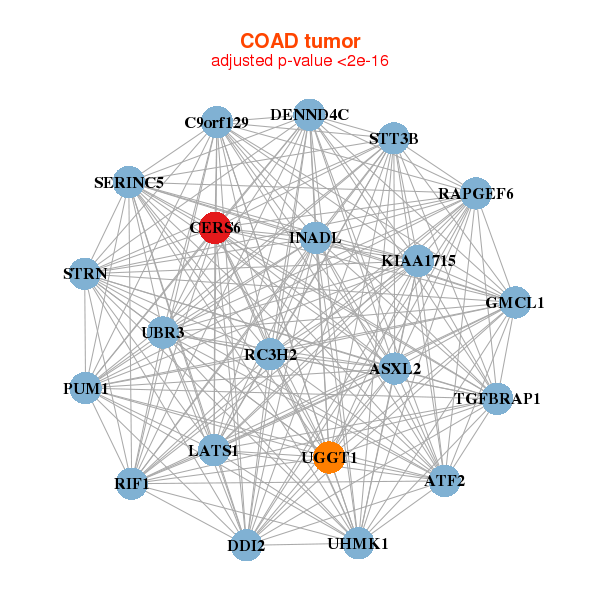
| ASXL2,ATF2,C9orf129,DDI2,DENND4C,GMCL1,INADL, KIAA1715,CERS6,LATS1,PUM1,RAPGEF6,RC3H2,RIF1, SERINC5,STRN,STT3B,TGFBRAP1,UBR3,UGGT1,UHMK1 | ABLIM1,ARHGAP32,ATP7B,CASK,CMTM4,DOPEY2,GOLIM4, IGF2BP2,KIAA0319L,KIAA1804,CERS6,MYO10,NEO1,PDXDC1, PTPRK,RNF43,SH3RF2,SLC39A11,SSTR1,THSD4,XYLB |
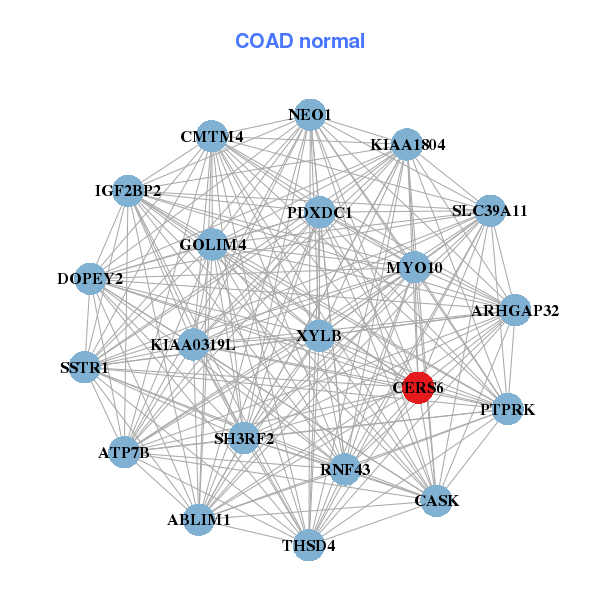
| * Co-Expression network figures were drawn using R package igraph. Only the top 20 genes with the highest correlations were shown. Red circle: input gene, orange circle: cell metabolism gene, sky circle: other gene |
: Open all plots for all cancer types
| Top |
: Open all interacting genes' information including KEGG pathway for all interacting genes from DAVID
| Top |
| Pharmacological Information for CERS6 |
| There's no related Drug. |
| Top |
| Cross referenced IDs for CERS6 |
| * We obtained these cross-references from Uniprot database. It covers 150 different DBs, 18 categories. http://www.uniprot.org/help/cross_references_section |
: Open all cross reference information
|
Copyright © 2016-Present - The Univsersity of Texas Health Science Center at Houston @ |